Embed Size (px)
Citation preview

Chapter 1
Introduction

The Study on Integrated Transport Master Plan for JABOTABEK (Phase I) Final Report Volume IV (Review of Jakarta Outer Ring Road Project) Chapter 1
1-1
1. Introduction The terms-of-reference (TOR) for “The Study on Integrated Transport Master Plan for JABOTABEK (Phase I)” call for a review of the Jakarta Outer Ring Road (JORR) project, comprising some 65.1 km toll road located mainly in DKI Jakarta, with the alignment of a minor stretch going through Bekasi.1 The history of the JORR concept goes back to the late 70s, when the Government of Indonesia (GOI) requested the Government of Japan (GOJ) to assist in the preparation of a master plan 2 for the JORR. The master plan study was subsequently followed-up by a planning3 and a preliminary design study4, both of which constituted the basis for further Government planning and JORR implementation. PP No.8/19905 paved the way for private sector participation in the construction and operations of toll roads. In fact, construction and operations of toll roads under BOT schemes commenced in 1994 in accordance with the then prevailing Government policy.
Concessions for the JORR toll way 6 were awarded to four private sector companies and Sections S and E2 were almost completely constructed. The sections were opened to traffic in August 1995. The 1997 financial crisis, which resulted in a severe economic and political crisis, brought full realization of the JORR under the then existing BOT-based concessionaire agreements to a practical standstill, due to the actual and/or legal bankruptcy of the concessionaires. Hence, the JORR, with the exception of Sections S and E2, remains uncompleted to date.
The JORR project, as a consequence of such unusual circumstances, has to therefore be classified as an “on-going” project, the realization of which has been suspended temporarily, due to unforeseen and unforeseeable circumstances. In fact, the GOI continues to attach high priority to the completion of the JORR, manifested in the fact that the it has requested the GOJ to assist in the JORR’s realization through the provision of a “Special Yen Loan- SYL”.
The Final Report (F/R) presents the results of an in-depth review and assessment of the JORR project from a technical, economic, and financial point of view, taking full account of the impacts caused by the special circumstances inhibiting any timely realization of the JORR.
The DFR is structured broadly along a standard format for road and/or toll road related feasibility studies. However, particular attention has been paid to:
1. Uncertainties in the political, economic, institutional and legal frameworks, which may constitute impediments to JORR realization
1 ) For a discussion of the JORR system configuration see later in Chapter 2 and Chapter 5. 2 ) Outer Ring Road Master Plan Study, JICA, 1978. 3 ) The Consulting Engineering Services for Jakarta Outer Ring Road Project, Phase I Report; OECF 1988 4 ) The Consulting Engineering Services for Jakarta Outer Ring Road Project, Phase II Report, OECF 1990. A more comprehensive list of relevant urban and public transport studies over the past two decades is attached in Annex 1-1. 5 ) PP stands for “Peraturan Pemerintah” or Government Decree, which has a status below law, but above Presidential or Governor Decrees. 6 ) For details see Chapter 2.

The Study on Integrated Transport Master Plan for JABOTABEK (Phase I) Final Report Volume IV (Review of Jakarta Outer Ring Road Project) Chapter 1
1-2
2. Uncertainties in Indonesia’s short to medium-term economic performance prospects and their likely short, medium to long-term impact on traffic demand on the JORR, and
3. Short to medium constraints on public investment funds (development budget) in general and for road transport related infrastructure development in particular.
Chapter 2 presents an in-depth review of JORR project history, the JORR project profile, its current implementation status and the assessment approach adopted in this report. Chapter 3 identifies the problem hierarchy and the major obstacles, which have prevented further realization of the JORR since the 1997 crisis. It elaborates on major economic, financial and institutional factors, which must be taken into full account in interpretating the economic and financial viability results. Chapter 4 briefly introduces major socio-economic and the traffic demand parameter, which were used as the criteria in the viability assessment of the project. Chapter 5 reviews and evaluates JORR engineering aspects and Chapter 6 JORR environmental related issues. The deliberations in Chapters 5 and 6 are guided by the fact that major engineering and environment related issues were already decided and approved by GOI in the past. Chapter 7 assesses the economic and financial viability of the JORR. This chapter pays particular attention to the appropriate up-dating of unit costs, base prices and economic and financial net-benefits, in order to arrive at investment requirements, which are realistic and in line with “best-practice” engineering standards.
Chapter 8 elaborates on potential realization scenarios for the JORR taking into full account the results of the economic and financial viability calculations. The GOI has, as is almost always the case with infrastructure projects of JORR’s nature, not unlimited, but only a maximum of four (4) options on how to proceed with the JORR, out of which three (3) are classified as rather unlikely or unrealistic. Other essential factors, which should go into the deliberations on the “pros & cons” of further speedy JORR realization, are related to a suitable long-term toll road policy, and an appropriate legal and institutional set-up, including such essential issues as toll levels and their adjustment mechanisms. The Chapter touches also briefly on issues of practical importance, such as the function(s) of the project implementing entity, the merits and demerits of different construction methods and the merits and demerits of alternative implementation options. Finally, the Chapter identifies the most suitable of these options, and recommends an implementation and time schedule tailored around that option.
Essential documents, statistical data and computation tables that are important to support the line of argumentation presented in this DF/R are attached to this document in various annexure.
Chapter 2
JORR Project History &
Implementation Status

The Study on Integrated Transport Master Plan for JABOTABEK (Phase I) Final Report Volume IV (Review of Jakarta Outer Ring Road Project) Chapter 2
2-1
2. JORR Project History & Implementation Status
2.1 General JORR Background
The Indonesian economy grew over the 27-year period from 1970 to 1997 at a compound real growth rate of 6.6 percent. In 1997, the year in which the financial crisis was triggered, Gross Domestic Product (GDP) reached a level of Rupiah 624 trillion1. Per Capita GDP increased from US$ 400 in the seventies to a 1997 pre-crisis level of US$ 1,2852.
Accelerated economic growth was accompanied by rapid urbanization and strong motorization processes. Urban population growth averaged 4.6 percent per annum, i.e. 2.9 percentage points above the country’s natural population growth rate. The stock of the motor vehicle fleet at national level grew from a total of some 3.87 million vehicles in 1980 to about 16.54 million in 1997, equivalent to a compound growth rate of 8.92 percent per annum over that period.
DKI Jakarta is Indonesia’s administration, education, service, financial and business center, and also her single largest urban agglomeration. DKI Jakarta in combination with Bogor, Tangerang and Bekasi forms the “Jabotabek” region, which in 1995 already had an urbanization level of about 83 percent and a population density per km2 of 3,063 people. It is estimated that about 30 percent of the total national vehicle fleet operates within the Jakarta metropolitan area and its surroundings.
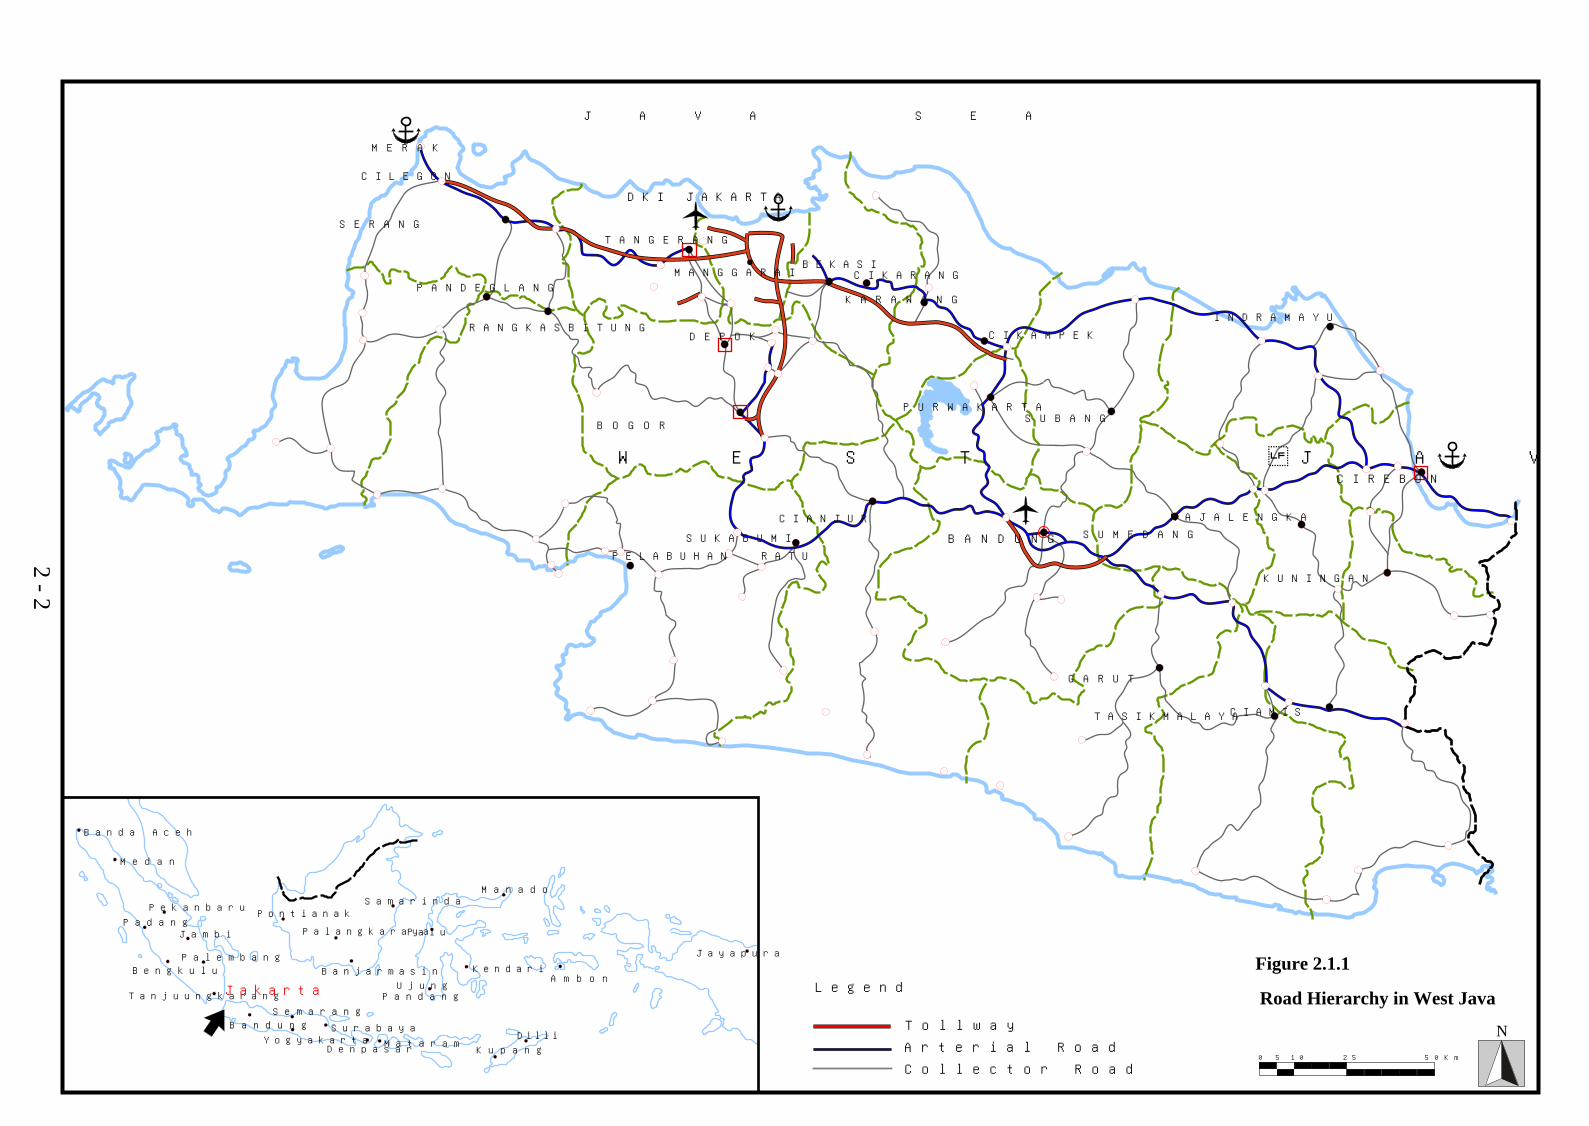
The GOI already recognized in the late 1970s the need to address the drastic increases in vehicle motor traffic in the Jabotabek region through the adoption of road infrastructure development measures. The GOI decided to develop the Jakarta-West Java Toll Road system, comprising radial toll roads in the major transportation corridors. The toll way and arterial road system in West Java is depicted in Figure 2.1.1. It was decided by the GOI to develop the corridors extending from Jakarta together with the inner ring road and the Jakarta Outer Ring Road (JORR). The existing toll roads in operations as of October 2000 within the Jakarta West Java Toll-road system, their respective lengths, toll rate system and presently prevailing ownership are summarized in Table 2.1.1.
Six toll roads within the toll road system network are directly relevant to the JORR. The Jakarta Intra Urban Toll Roads and the Jakarta Harbor Road, which together constitute the Jakarta Intra Urban Toll-road (JIUT or inner ring road), are located inside the JORR. DKI Jakarta and its outlying satellite cities of Bogor, Tangerang and Bekasi have a toll road network. On the western side of DKI Jakarta, there are the Cengkareng Access Toll Road connecting to Soekarno-Hatta International Airport and the Jakarta-Merak Toll Road connecting DKI Jakarta with Tangerang and Merak. On the south side there is the Jagorawi Toll Road connecting DKI Jakarta with Bogor. On the east side, there is the Cikampek Toll Road connecting DKI Jakarta with Bekasi and Cikampek. These four radial toll roads assume a connector function among the major urban centers in West Java.
1 ) Roughly equivalent to US dollar 260 billion at current prices and at a pre-crisis average exchange rate. 2 ) In current dollar terms and on a non purchasing-power-parity basis.
2 - 2
Road Hierarchy in West Java
Jambi
Palembang
PontianakPekanbaru
M e d a n
Banda Aceh
Padang
Bengkulu
Tanjuungkarang
Bandung
Semarang
YogyakartaSurabaya
MataramDenpasar
UjungPandang
Kupang
Dilli
KendariA m b o n
Palangkaraya
Samarinda
Palu
Banjarmasin
Manado
Jayapura
M E R A K
P A N D E G L A N G
R A N G K A S B I T U N G
PELABUHAN RATU
B O G O R
S U K A B U M I
CIANJUR
B A N D U N G
S U B A N GP U R W A K A R T A
S U M E D A N G
M A J A L E N G K A
K U N I N G A N
C I R E B O N
CIAMIST A S I K M A L A Y A
G A R U T
I N D R A M A Y U
K A R A W A N G
DKI JAKARTA
S E R A N G
C I L E G O N
J A V A S E A
W E S T J A V A
0 5 10 25 5 0 K m
C I K A M P E K
C I K A R A N G
Jakarta
BEKASI
D E P O K
T A N G E R A N G
M A N G G A R A I
C o l l e c t o r R o a d
T o l l w a y
A r t e r i a l R o a d
Legend
Figure 2.1.1
N
The Study on Integrated Transport Master Plan for JABOTABEK (Phase I) Final Report Volume IV (Review of Jakarta Outer Ring Road Project) Chapter 2
2-3
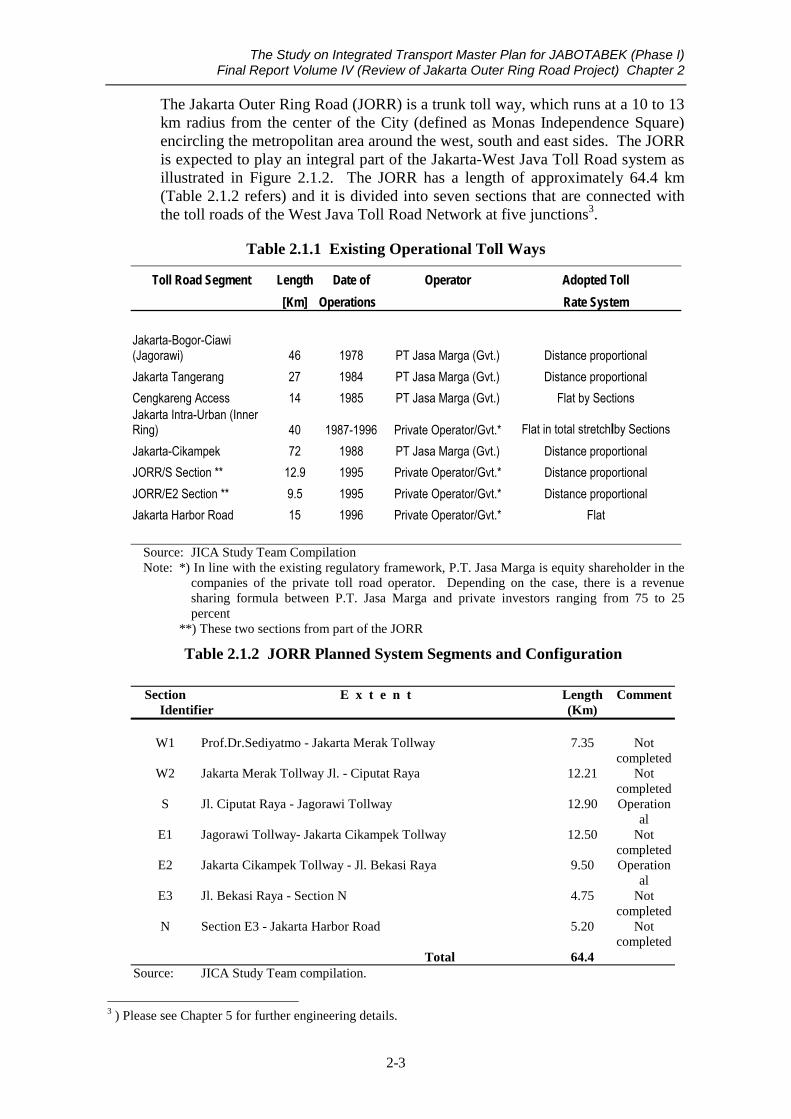
The Jakarta Outer Ring Road (JORR) is a trunk toll way, which runs at a 10 to 13 km radius from the center of the City (defined as Monas Independence Square) encircling the metropolitan area around the west, south and east sides. The JORR is expected to play an integral part of the Jakarta-West Java Toll Road system as illustrated in Figure 2.1.2. The JORR has a length of approximately 64.4 km (Table 2.1.2 refers) and it is divided into seven sections that are connected with the toll roads of the West Java Toll Road Network at five junctions3.
Table 2.1.1 Existing Operational Toll Ways
Toll Road Segment Length Date of Operator Adopted Toll [Km] Operations Rate System Jakarta-Bogor-Ciawi (Jagorawi) 46 1978 PT Jasa Marga (Gvt.) Distance proportional Jakarta Tangerang 27 1984 PT Jasa Marga (Gvt.) Distance proportional Cengkareng Access 14 1985 PT Jasa Marga (Gvt.) Flat by Sections Jakarta Intra-Urban (Inner Ring) 40 1987-1996 Private Operator/Gvt.* Flat in total stretchlby Sections Jakarta-Cikampek 72 1988 PT Jasa Marga (Gvt.) Distance proportional JORR/S Section ** 12.9 1995 Private Operator/Gvt.* Distance proportional JORR/E2 Section ** 9.5 1995 Private Operator/Gvt.* Distance proportional Jakarta Harbor Road 15 1996 Private Operator/Gvt.* Flat
Source: JICA Study Team Compilation Note: *) In line with the existing regulatory framework, P.T. Jasa Marga is equity shareholder in the
companies of the private toll road operator. Depending on the case, there is a revenue sharing formula between P.T. Jasa Marga and private investors ranging from 75 to 25 percent
**) These two sections from part of the JORR
Table 2.1.2 JORR Planned System Segments and Configuration
Section E x t e n t Length Comment Identifier (Km)
W1 Prof.Dr.Sediyatmo - Jakarta Merak Tollway 7.35 Not
completed W2 Jakarta Merak Tollway Jl. - Ciputat Raya 12.21 Not
completed S Jl. Ciputat Raya - Jagorawi Tollway 12.90 Operation
al E1 Jagorawi Tollway- Jakarta Cikampek Tollway 12.50 Not
completed E2 Jakarta Cikampek Tollway - Jl. Bekasi Raya 9.50 Operation
al E3 Jl. Bekasi Raya - Section N 4.75 Not
completed N Section E3 - Jakarta Harbor Road 5.20 Not
completed Total 64.4
Source: JICA Study Team compilation.
3 ) Please see Chapter 5 for further engineering details.

N
JAKARTA
SOUTH SECTION
W2 SE
CT
ION
W1 S
EC
TIO
N
E3
SE
CT
ION
E2
SE
CT
ION
E 1 SE
C
TI
ON
TJ. PRIOK PORT MARUNDA PORT
CENGKARENG ACCESS
JAKARTAROAD
RBOURHA
JAKARTA CIKAMPEK TOLL ROAD
JAKARTA -S
ERPONGTOLL
ROADJAKARTA - MERAK TOLL ROAD
SOU
TH -
WEST
ARC
NO
RT
H -
SOU
THLI
NK
Java Sea
OUTER RING ROAD
JAKARTA
N SECTION
TANGERANG
SOEKARNO HATTAAIR PORT
SERPONG
BEKASI
LEGEND
: Jakarta Outer Ring Road
: Toll Way in Operation
: Rail Way
: Toll Way in Planning
Figure 2.1.2 Jakarta Outer Ring Road Project Location Map
2-4
The Study on Integrated Transport Master Plan for JABOTABEK (Phase I) Final Report Volume IV (Review of Jakarta Outer Ring Road Project) Chapter 2
2-5
The JORR is expected to address the following principal functions:
1. To avoid serious traffic congestion, thereby contributing to a sustainable level of urban activities
2. To supplement the functions of radial toll roads and the Cengkareng Access, and
3. To support improved land use in the Jabotabek metropolitan area, namely DKI Jakarta, Bogor, Tangerang and Bekasi.
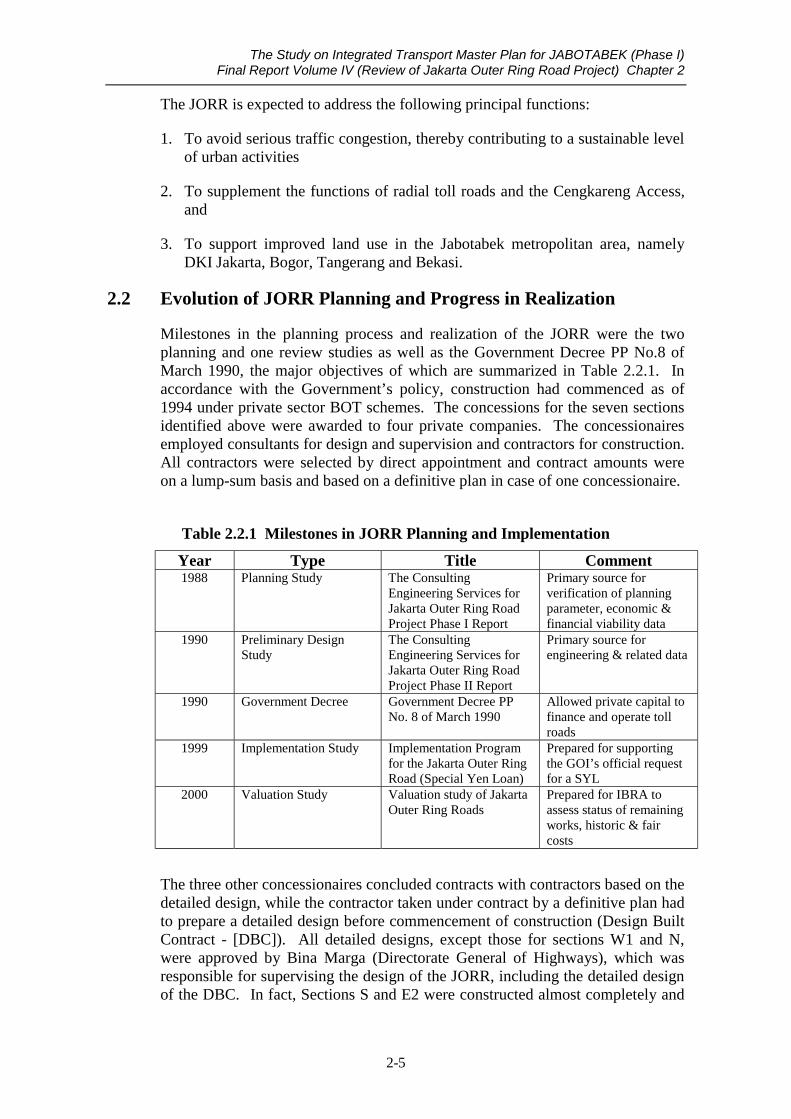
2.2 Evolution of JORR Planning and Progress in Realization
Milestones in the planning process and realization of the JORR were the two planning and one review studies as well as the Government Decree PP No.8 of March 1990, the major objectives of which are summarized in Table 2.2.1. In accordance with the Government’s policy, construction had commenced as of 1994 under private sector BOT schemes. The concessions for the seven sections identified above were awarded to four private companies. The concessionaires employed consultants for design and supervision and contractors for construction. All contractors were selected by direct appointment and contract amounts were on a lump-sum basis and based on a definitive plan in case of one concessionaire.
Table 2.2.1 Milestones in JORR Planning and Implementation
Year Type Title Comment 1988 Planning Study The Consulting
Engineering Services for Jakarta Outer Ring Road Project Phase I Report
Primary source for verification of planning parameter, economic & financial viability data
1990 Preliminary Design Study
The Consulting Engineering Services for Jakarta Outer Ring Road Project Phase II Report
Primary source for engineering & related data
1990 Government Decree Government Decree PP No. 8 of March 1990
Allowed private capital to finance and operate toll roads
1999 Implementation Study Implementation Program for the Jakarta Outer Ring Road (Special Yen Loan)
Prepared for supporting the GOI’s official request for a SYL
2000 Valuation Study Valuation study of Jakarta Outer Ring Roads
Prepared for IBRA to assess status of remaining works, historic & fair costs
The three other concessionaires concluded contracts with contractors based on the detailed design, while the contractor taken under contract by a definitive plan had to prepare a detailed design before commencement of construction (Design Built Contract - [DBC]). All detailed designs, except those for sections W1 and N, were approved by Bina Marga (Directorate General of Highways), which was responsible for supervising the design of the JORR, including the detailed design of the DBC. In fact, Sections S and E2 were constructed almost completely and
The Study on Integrated Transport Master Plan for JABOTABEK (Phase I) Final Report Volume IV (Review of Jakarta Outer Ring Road Project) Chapter 2
2-6
have been open for public use since August 1995, though some minor work still needs to be completed at both Sections4.
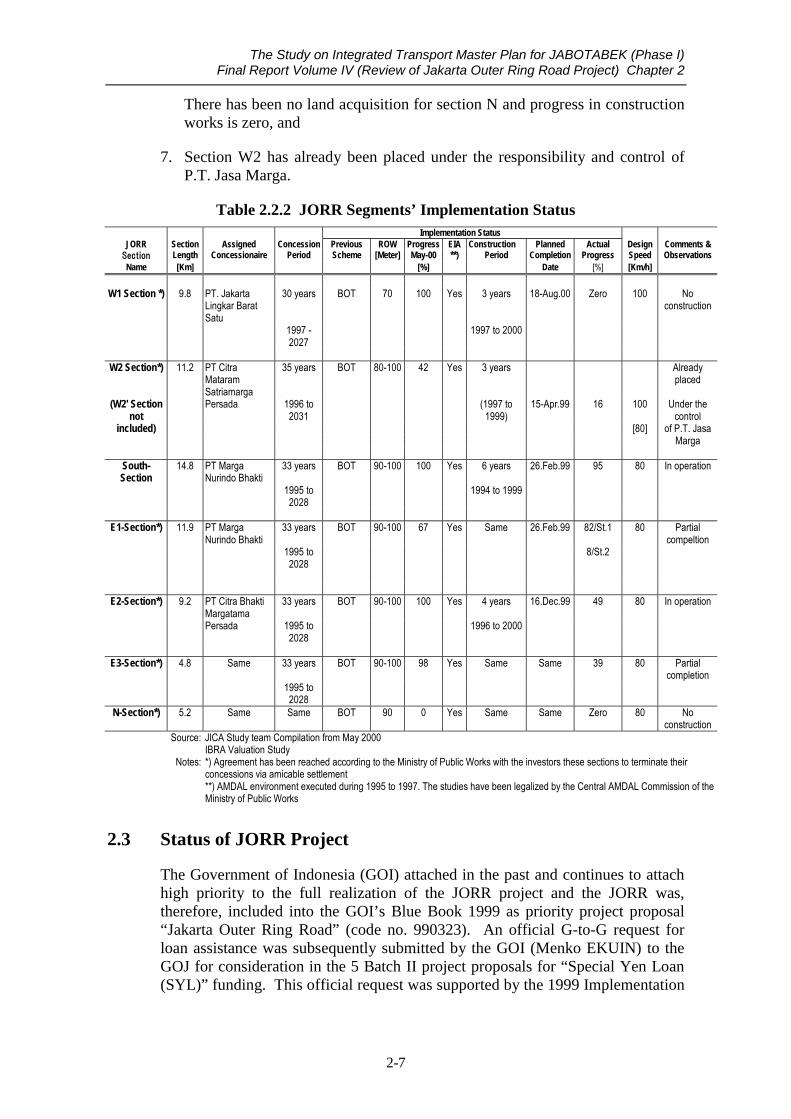
Table 2.2.2 identifies the concessionaires, the concession period, and it provides summary information on the progress/status in land acquisition and construction, as well as other related issues which are important for the realization of the JORR5.
The key characteristics of the realization status of the JORR as of October 2000 are:
1. Implementation of the JORR under the previous legal BOT arrangements has, for all practical purposes, come to a complete standstill
2. “The Indonesian Bank Restructuring Agency - IBRA” has officially been charged with resolving the pending financial issues regarding, inter alia, the previous concessionaire agreements. IBRA’s main mandate is to recover non-performing loans through debt settlement/rescheduling schemes and/or the proceeds of asset sales of the defaulting parties
3. In fact, IBRA has commissioned a valuation study6, in order to (a) analyze and confirm historical cost incurred by the relevant concessionaires; (b) evaluate and confirm “fair cost” as against cost actually paid, and (c) evaluate and confirm projected cost required to complete the remaining JORR works. This study allows for the identification of (a) March 2000 unit cost and (b) the value of works/structures (in other words assets) already completed
4. The sections already in operations, i.e. Sections S and E2, generates revenues7
5. The environmental impact assessment (EIA) has been completed for all JORR segments and legalized by the Central AMDAL Commission of the Ministry of Public Works. Therefore, the completion of the JORR will not require new and/or additional EIA’s for the W1, W2, S, E1, E2, E3 and N sections
6. Land acquisition, compensation and construction completion in line with original concession agreements are at various stages of completion. Land acquisition for JORR section W1 is completed, but there is zero progress in terms of construction. Land acquisition for section W2 is completed to around 42 percent and some 16 percent of the construction works have been completed. Land acquisition for section S is completed to about 98 percent and construction to around 95 percent. Land acquisition for section E1 is completed to 70 percent and construction to 82 and 8 percent (for stage 1 and 2, respectively). Land acquisition for section E2 is completed to 98 percent and construction to around 49 percent. As regards section E3, land acquisition is completed to 100 percent and construction to some 39 percent.
4 ) Please consult Chapter 5 for details. 5 ) For further details and an in-depth discussion of individual details, please refer to the following Chapter 5. 6 ) Identified in Table 2.2.1 as “Valuation Study of Jakarta Outer Ring Road”; Jakarta, May 2000. 7 ) According to an interview with P.T. Jasa Marga, Section S generates already annual revenue of some 80 billion Rupiah which would be equivalent to an approximate traffic volume of 54,795 vehicles/day.
The Study on Integrated Transport Master Plan for JABOTABEK (Phase I) Final Report Volume IV (Review of Jakarta Outer Ring Road Project) Chapter 2
2-7
There has been no land acquisition for section N and progress in construction works is zero, and
7. Section W2 has already been placed under the responsibility and control of P.T. Jasa Marga.
Table 2.2.2 JORR Segments’ Implementation Status Implementation Status
JORR Section Assigned Concession Previous ROW Progress EIA Construction Planned Actual Design Comments & Section Length Concessionaire Period Scheme [Meter] May-00 **) Period Completion Progress Speed Observations Name [Km] [%] Date [%] [Km/h]
W1 Section *) 9.8 PT. Jakarta
Lingkar Barat Satu
30 years BOT 70 100 Yes 3 years 18-Aug.00 Zero 100 No construction
1997 - 2027
1997 to 2000
W2 Section*) 11.2 PT Citra
Mataram Satriamarga
35 years BOT 80-100 42 Yes 3 years Already placed
(W2' Section not
Persada 1996 to 2031
(1997 to 1999)
15-Apr.99 16 100 Under the control
included) [80] of P.T. Jasa Marga
South-Section
14.8 PT Marga Nurindo Bhakti
33 years BOT 90-100 100 Yes 6 years 26.Feb.99 95 80 In operation
1995 to 2028
1994 to 1999
E1-Section*) 11.9 PT Marga
Nurindo Bhakti 33 years BOT 90-100 67 Yes Same 26.Feb.99 82/St.1 80 Partial
compeltion 1995 to
2028 8/St.2
E2-Section*) 9.2 PT Citra Bhakti Margatama
33 years BOT 90-100 100 Yes 4 years 16.Dec.99 49 80 In operation
Persada 1995 to 2028
1996 to 2000
E3-Section*) 4.8 Same 33 years BOT 90-100 98 Yes Same Same 39 80 Partial
completion 1995 to
2028
N-Section*) 5.2 Same Same BOT 90 0 Yes Same Same Zero 80 No construction
Source: JICA Study team Compilation from May 2000 IBRA Valuation Study
Notes: *) Agreement has been reached according to the Ministry of Public Works with the investors these sections to terminate their concessions via amicable settlement
**) AMDAL environment executed during 1995 to 1997. The studies have been legalized by the Central AMDAL Commission of the Ministry of Public Works
2.3 Status of JORR Project
The Government of Indonesia (GOI) attached in the past and continues to attach high priority to the full realization of the JORR project and the JORR was, therefore, included into the GOI’s Blue Book 1999 as priority project proposal “Jakarta Outer Ring Road” (code no. 990323). An official G-to-G request for loan assistance was subsequently submitted by the GOI (Menko EKUIN) to the GOJ for consideration in the 5 Batch II project proposals for “Special Yen Loan (SYL)” funding. This official request was supported by the 1999 Implementation
The Study on Integrated Transport Master Plan for JABOTABEK (Phase I) Final Report Volume IV (Review of Jakarta Outer Ring Road Project) Chapter 2
2-8
Program (IP) prepared by the Ministry of Public Works (listed in the previous Table 2.2.1).
However, the project definition reflected in the 1999 Implementation Program of the Ministry of Public Works differs from the original 1988 JORR project configuration with regard to two major aspects:
1. The overall system configuration (Table 2.3.1 refers), and
2. An equipment component, namely a revenue sharing, traffic control and information system, was added to the JORR project definition as reflected in the 1999 Implementation Program.
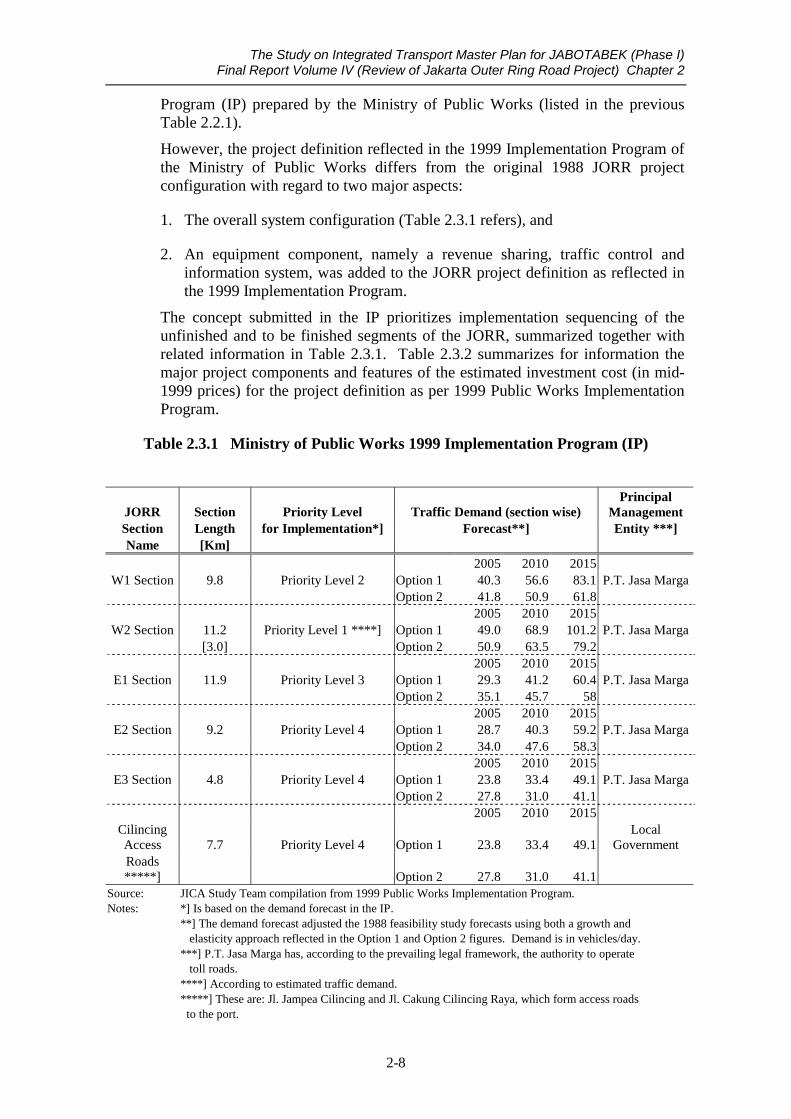
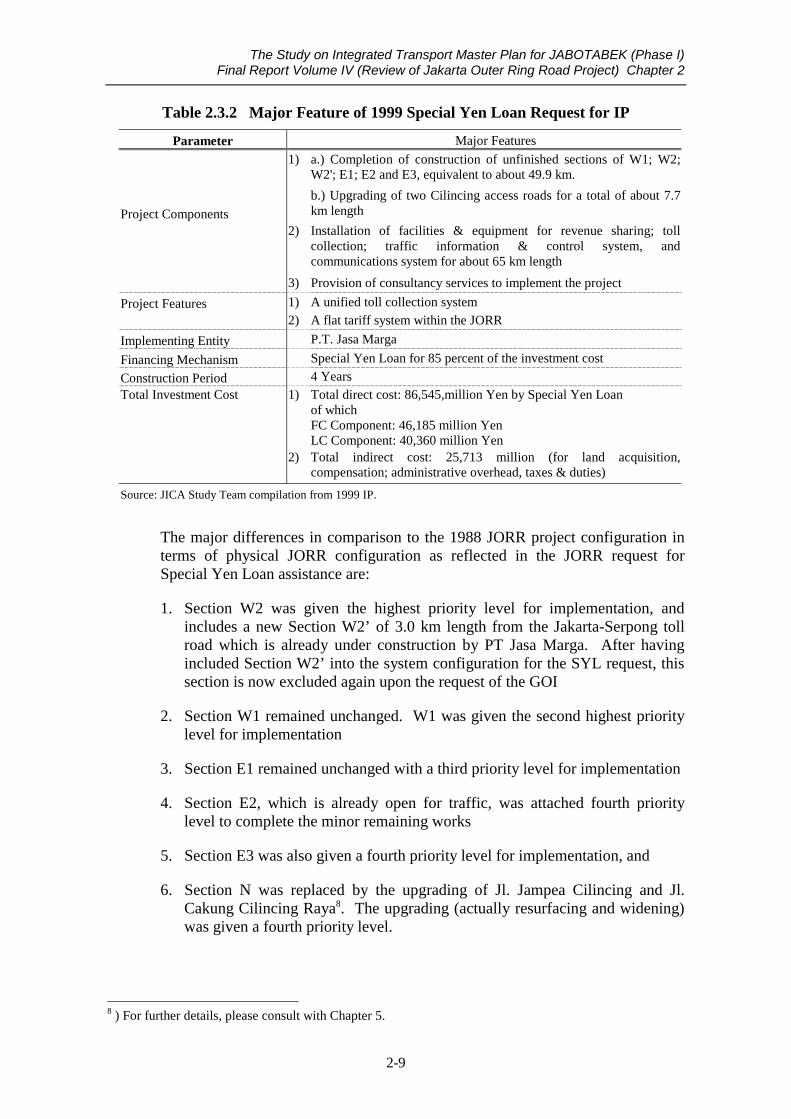
The concept submitted in the IP prioritizes implementation sequencing of the unfinished and to be finished segments of the JORR, summarized together with related information in Table 2.3.1. Table 2.3.2 summarizes for information the major project components and features of the estimated investment cost (in mid-1999 prices) for the project definition as per 1999 Public Works Implementation Program.
Table 2.3.1 Ministry of Public Works 1999 Implementation Program (IP)
JORR Section Priority Level Traffic Demand (section wise) Principal
Management Section Length for Implementation*] Forecast**] Entity ***] Name [Km]
2005 2010 2015 W1 Section 9.8 Priority Level 2 Option 1 40.3 56.6 83.1 P.T. Jasa Marga
Option 2 41.8 50.9 61.8 2005 2010 2015 W2 Section 11.2 Priority Level 1 ****] Option 1 49.0 68.9 101.2 P.T. Jasa Marga
[3.0] Option 2 50.9 63.5 79.2 2005 2010 2015 E1 Section 11.9 Priority Level 3 Option 1 29.3 41.2 60.4 P.T. Jasa Marga
Option 2 35.1 45.7 58 2005 2010 2015 E2 Section 9.2 Priority Level 4 Option 1 28.7 40.3 59.2 P.T. Jasa Marga
Option 2 34.0 47.6 58.3 2005 2010 2015 E3 Section 4.8 Priority Level 4 Option 1 23.8 33.4 49.1 P.T. Jasa Marga
Option 2 27.8 31.0 41.1 2005 2010 2015
Cilincing Access 7.7 Priority Level 4 Option 1 23.8 33.4 49.1
Local Government
Roads *****] Option 2 27.8 31.0 41.1
Source: JICA Study Team compilation from 1999 Public Works Implementation Program. Notes: *] Is based on the demand forecast in the IP. **] The demand forecast adjusted the 1988 feasibility study forecasts using both a growth and elasticity approach reflected in the Option 1 and Option 2 figures. Demand is in vehicles/day. ***] P.T. Jasa Marga has, according to the prevailing legal framework, the authority to operate toll roads. ****] According to estimated traffic demand. *****] These are: Jl. Jampea Cilincing and Jl. Cakung Cilincing Raya, which form access roads to the port.
The Study on Integrated Transport Master Plan for JABOTABEK (Phase I) Final Report Volume IV (Review of Jakarta Outer Ring Road Project) Chapter 2
2-9
Table 2.3.2 Major Feature of 1999 Special Yen Loan Request for IP
Parameter Major Features
1) a.) Completion of construction of unfinished sections of W1; W2; W2'; E1; E2 and E3, equivalent to about 49.9 km.
Project Components
b.) Upgrading of two Cilincing access roads for a total of about 7.7 km length
2) Installation of facilities & equipment for revenue sharing; toll collection; traffic information & control system, and communications system for about 65 km length
3) Provision of consultancy services to implement the project
Project Features 1) A unified toll collection system
2) A flat tariff system within the JORR
Implementing Entity P.T. Jasa Marga
Financing Mechanism Special Yen Loan for 85 percent of the investment cost
Construction Period 4 Years Total Investment Cost 1) Total direct cost: 86,545,million Yen by Special Yen Loan
of which FC Component: 46,185 million Yen LC Component: 40,360 million Yen
2) Total indirect cost: 25,713 million (for land acquisition, compensation; administrative overhead, taxes & duties)
Source: JICA Study Team compilation from 1999 IP.
The major differences in comparison to the 1988 JORR project configuration in terms of physical JORR configuration as reflected in the JORR request for Special Yen Loan assistance are:
1. Section W2 was given the highest priority level for implementation, and includes a new Section W2’ of 3.0 km length from the Jakarta-Serpong toll road which is already under construction by PT Jasa Marga. After having included Section W2’ into the system configuration for the SYL request, this section is now excluded again upon the request of the GOI
2. Section W1 remained unchanged. W1 was given the second highest priority level for implementation
3. Section E1 remained unchanged with a third priority level for implementation
4. Section E2, which is already open for traffic, was attached fourth priority level to complete the minor remaining works
5. Section E3 was also given a fourth priority level for implementation, and
6. Section N was replaced by the upgrading of Jl. Jampea Cilincing and Jl. Cakung Cilincing Raya8. The upgrading (actually resurfacing and widening) was given a fourth priority level.
8 ) For further details, please consult with Chapter 5.

The Study on Integrated Transport Master Plan for JABOTABEK (Phase I) Final Report Volume IV (Review of Jakarta Outer Ring Road Project) Chapter 2
2-10
The total investment cost for the system configuration reflected in the SYL request and the supporting 1999 Implementation Program document amounted to Y112,258 million (all resources, in mid-1999 prices and at an average 1999 exchange rate).
2.4 Assessment Approach
Completion of the JORR was interrupted as a result of the 1997 financial and subsequent economic crisis. Such circumstances are a sort of “force majeur” and the JORR is, therefore, an on-going project, the need for which has been established and confirmed and the implementation of which has been temporarily interrupted. Works and structures (or in economic terms “assets”) are in place partly and their value has been determined by the May 2000 valuation study sponsored by IBRA. The GOI has already requested officially financial assistance from the GOJ. Furthermore, Indonesia’s overall “enabling environment” for toll road development and operations is “in flux”, due to recent political and policy changes9.
The approach adopted for reviewing the JORR project request uses a three-step approach 10 and a comprehensive checklist 11 . There have been many studies relevant in one way or another to the JORR project 12 (the most important documents are listed in Annex 1). However, primary data sources for the present assessment exercise was the following two documents:
1. JORR Implementation Program, 1999 by the Ministry of Public Works, since this document supported the GOI’s official request for financial SYL assistance, and
2. Valuation Study of the Jakarta Outer Ring Road, 2000 by IBRA, since this document provides invaluable latest data on unit cost, the value of the JORR works and structures already in place and the estimated completion cost for the JORR.
The nature of the project demanded that particular emphasis be placed in the assessment exercise on:
1. The implications for the implementing entity resulting from the JORR project’s internal rate of return (IRR), taking into account the prevailing regulatory and legal demands and limitations
2. A realistic financing plan, and
3. Implications for the policy for overall toll road system integration, harmonization of toll structures and tariffs and identification of a suitable long-term institutional structure for toll road policy formulation, planning and operation and management.
9 ) This is, of course, not limited to toll road planning and development, but to the overall legal, institutional, planning and project execution set-ups. 10 ) See Chapter 2 of the Interim Report for details. 11 ) See Chapter 2 of the Interim Report for details. 12 ) Summarized in Table 2-2 of the Interim Report, page 2-3.
Chapter 3
JORR Project Definition

The Study on Integrated Transport Master Plan for JABOTABEK (Phase I) Final Report Volume IV (Review of Jakarta Outer Ring Road Project) Chapter 3
3-1
3. JORR Project Definition
3.1 Core Problems & Issues
It is necessary to understand the difficulties impeding the full realization of JORR and to identify the principal decision takers (actors) and the possible alternative courses of action, that they could take to address the difficulties and their implications. A simple diagram outlining the situation is illustrated in Figure 3.1.1, and the key factors are summarized below:
3.1.1 Core Problems and Target
Increased and increasing economic and social cost measured in terms of greater travel time, air pollution and lost economic activities is the core problem caused by the non-completion of the JORR. Most sections of the JORR with the exception of Section W11 were scheduled for completion in either early or late 1999. Traffic demand has, after a decline in 1998, already grown considerably2. Circumferential traffic in an east to west or north to south direction, which would have used the JORR, is therefore forced to use the JIUT or other non-toll arterial roads. In addition, works and structures at various levels of completion3 are already in place, which form, regardless of the prevailing economic situation of the previous concessionaires, road infrastructure assets worth between 830,800 to 970,757 million Rupiah4. This amount and perhaps additional demolition costs would have to be written off, if the JORR remained uncompleted, in addition to the economic and social cost caused by JORR non-completion. It is estimated from the demand modeling exercise that completion of the JORR would generate in 2005 savings of some 58.04 million vehicle-hours/yr. and about 312.27 million vehicle-kms/yr. in that very year alone (on the basis of total vehicle fleet assigned to the network).
Therefore, the primary objective and target is to finalize the JORR on an “as soon as possible” basis, in order to alleviate potential costs and losses identified in item 1., and also to generate revenues collected from JORR users5. To complete the JORR on an “as soon as possible” basis is in line with the GOI position on this matter.
3.1.2 Principal Implementing Options
P.T. Jasa Marga is, under existing laws and the established regulatory framework, the only entity that has the clear legal mandate and the authority to operate toll ways at national level, though the regulations allow P.T. Jasa Marga to do so with “third parties” (Annex 2 summarizes the regulatory framework and provides an
1 ) Please refer to Table 2.2.2 in Chapter 2. Completion of Section W1 was scheduled for August 2000. 2 ) Please refer to Chapter 4 for more details. 3 ) Please refer to Table 2.2.2 in Chapter 2. 4 ) Based on the results of the May 2000 Valuation Study prepared for IBRA. The number quoted represents cost actually paid by the concessionaires, which would be equivalent to roughly US $ 132.1 million US dollars at the exchange rate of Rp. 7,350 used in the IBRA study. It is immaterial in this context that this amount may be over “fair cost” as assessed by this very study. 5 ) In-depth interview with P.T. Jasa Marga on September 20, 2000.

The Study on Integrated Transport Master Plan for JABOTABEK (Phase I) Final Report Volume IV (Review of Jakarta Outer Ring Road Project) Chapter 3
overview on the new road law presently under consideration)6. It is therefore only logical that P.T. Jasa Marga will be entrusted with the function of executing/implementing entity for the JORR project7. There are three major alternative courses of action or implementation options that P.T. Jasa Marga may pursue.
Figure 3.1.1 6 ) Please consult Appendix 2 for details. 7 ) There are, of course, some difficultiesliabilities of the old concessionaires.
Increasing trafficeconomic and soc
Core TarComplete the JOR“as soon as possibharvest the relatedbenefits.
Factors that caused and/or influence the core problem ROOT: 1997 financial crisis CAUSED: Economic & political
crisis CAUSED: Old Concessionaire’s
bankruptcy ALSO: (1) Banking crisis, therefore, No or little domestic lending; (2) No long-term financial market
Suspension of JORR Project
Core Problem congestion and therefore increased ial cost on intra-urban toll and urban
arterial roads
3-2
Core Problem and Key Issues
that need to be ironed out. This relates to the question of the
Factors that impact on the Selection of a Strategy 1) The JORR Project’s FIRR 2) General future toll road policy 3) Privatization policies 4) Restriction on sovereign debt raising
Alternative 1 P.T. Jasa Marga on its own with its own power/funds
Implications Heavy burden on future income and its use. JORR implementation: piecemeal
Alternative 2 P.T. Jasa Marga with a concessional loan
Implications Reduced burden on future earnings. JORR implementation in one piece
Alternative 3 P.T. Jasa Marga with strategic private sector partner
Implications Time consuming. Require legal changes. May require guaranteed ROE
get R on an le” basis to economic
Implementing Entity P.T. Jasa Marga
Potential Alternative Strategic Approach for Core Target Achievement
The Study on Integrated Transport Master Plan for JABOTABEK (Phase I) Final Report Volume IV (Review of Jakarta Outer Ring Road Project) Chapter 3
3-3
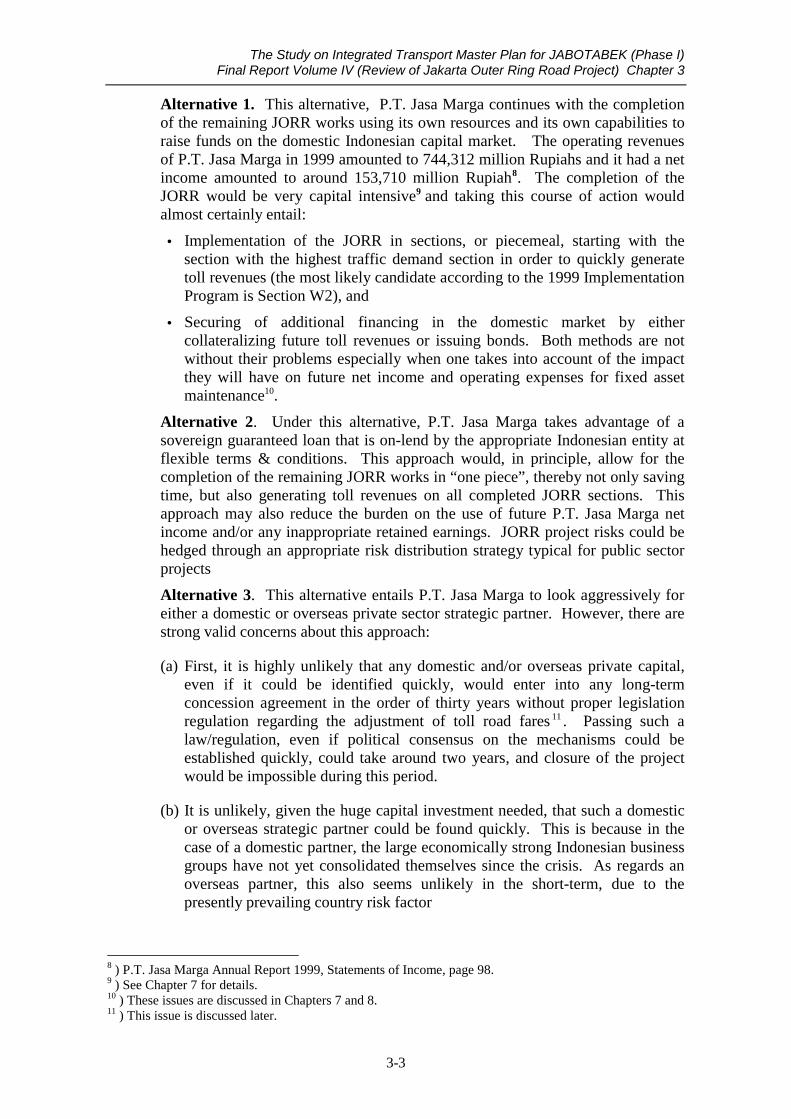
Alternative 1. This alternative, P.T. Jasa Marga continues with the completion of the remaining JORR works using its own resources and its own capabilities to raise funds on the domestic Indonesian capital market. The operating revenues of P.T. Jasa Marga in 1999 amounted to 744,312 million Rupiahs and it had a net income amounted to around 153,710 million Rupiah8. The completion of the JORR would be very capital intensive9 and taking this course of action would almost certainly entail:
• Implementation of the JORR in sections, or piecemeal, starting with the section with the highest traffic demand section in order to quickly generate toll revenues (the most likely candidate according to the 1999 Implementation Program is Section W2), and
• Securing of additional financing in the domestic market by either collateralizing future toll revenues or issuing bonds. Both methods are not without their problems especially when one takes into account of the impact they will have on future net income and operating expenses for fixed asset maintenance10.
Alternative 2. Under this alternative, P.T. Jasa Marga takes advantage of a sovereign guaranteed loan that is on-lend by the appropriate Indonesian entity at flexible terms & conditions. This approach would, in principle, allow for the completion of the remaining JORR works in “one piece”, thereby not only saving time, but also generating toll revenues on all completed JORR sections. This approach may also reduce the burden on the use of future P.T. Jasa Marga net income and/or any inappropriate retained earnings. JORR project risks could be hedged through an appropriate risk distribution strategy typical for public sector projects
Alternative 3. This alternative entails P.T. Jasa Marga to look aggressively for either a domestic or overseas private sector strategic partner. However, there are strong valid concerns about this approach:
(a) First, it is highly unlikely that any domestic and/or overseas private capital, even if it could be identified quickly, would enter into any long-term concession agreement in the order of thirty years without proper legislation regulation regarding the adjustment of toll road fares 11 . Passing such a law/regulation, even if political consensus on the mechanisms could be established quickly, could take around two years, and closure of the project would be impossible during this period.
(b) It is unlikely, given the huge capital investment needed, that such a domestic or overseas strategic partner could be found quickly. This is because in the case of a domestic partner, the large economically strong Indonesian business groups have not yet consolidated themselves since the crisis. As regards an overseas partner, this also seems unlikely in the short-term, due to the presently prevailing country risk factor
8 ) P.T. Jasa Marga Annual Report 1999, Statements of Income, page 98. 9 ) See Chapter 7 for details. 10 ) These issues are discussed in Chapters 7 and 8. 11 ) This issue is discussed later.

The Study on Integrated Transport Master Plan for JABOTABEK (Phase I) Final Report Volume IV (Review of Jakarta Outer Ring Road Project) Chapter 3
3-4
(c) An additional critical factor that hints against quick participation of potential domestic and/or overseas private capital is the unavailability of long-term financing in the Indonesian capital markets. It is essential that borrowing terms match the life span of the assets, in this case the toll road and toll road facilities for which a life-span of some 31 years is assumed (includes construction period). The longest term available now is eight to nine years for Government bonds at around 16.5 percent. Overseas private capital would have to borrow offshore in (most likely) US dollar terms and such borrowing would have to be collateralized with offshore assets of the private sector borrower. It is fair to say that this scenario seems to quite unrealistic taking all factors, such as country, foreign exchange and toll road inherent risk factors into account.
Absolute Factors. It cannot be stressed enough with respect to selecting among these scenarios that what constitutes a realistic course of action is determined to a very large extent by the JORR projects economic and financial viability (EIRR, IRR or ROI and FIRR). These essential and other related issues are discussed in detail in Chapter 7, including the results of the economic and financial viability investigation.
3.2 JORR Project Definition
It was essential for the review and assessment of the JORR project, in view of the dynamics in Indonesia’s overall enabling environment and potentially conflicting positions of various Indonesian stakeholders, to ascertain the JORR project’s scope or in other words the JORR’s basic system configuration. Basic assumptions and related important indirect parameter were confirmed with the relevant authorities by employing a simple assumption matrix (reproduced in Appendix Figure AP 3.1).
The following components have been confirmed and constitute therefore the elements of the JORR project assessment exercise. They also constitute the major elements for base cost and subsequent investment cost calculations12:
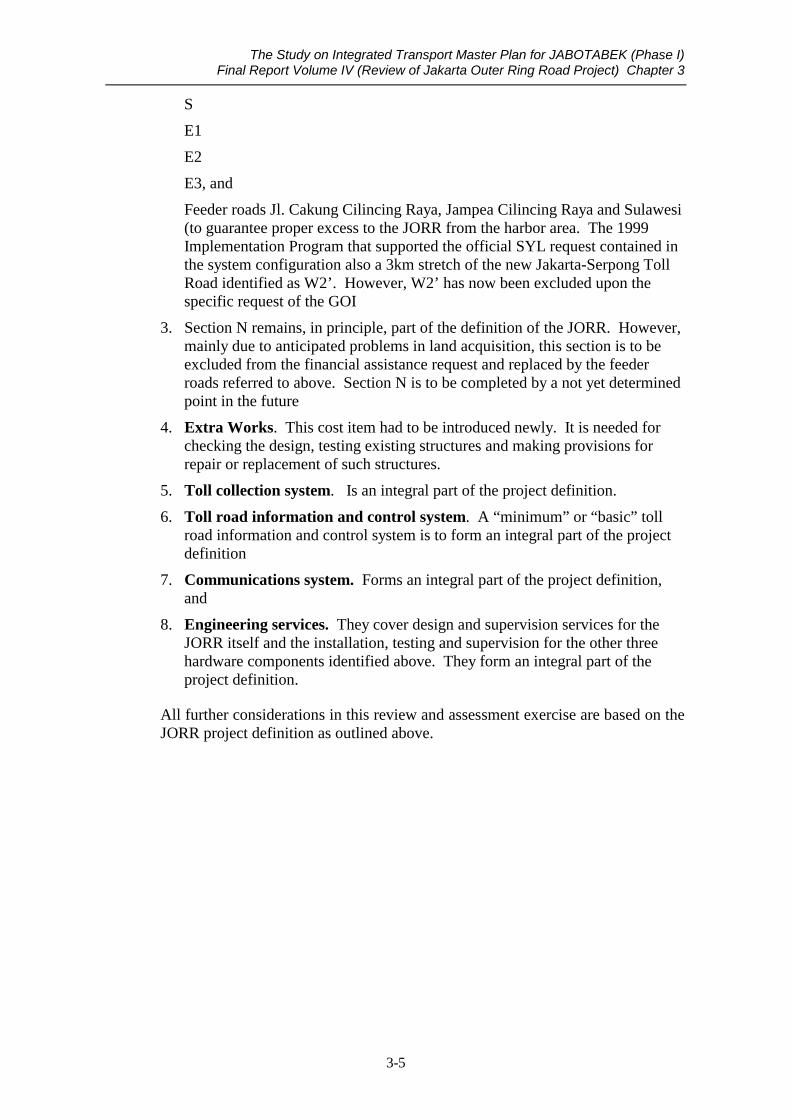
1. JORR system configuration. The JORR remains defined, in principle, as being comprised of Sections W1, W2, S, E1, E2, E3 and N. The horizontal and vertical alignment of all sections has been confirmed
2. However, taking into account the progress achieved so far in terms of land acquisition, works and structures already completed, interconnectivity to the new Jakarta – Serpong Toll Road under construction by P.T. Jasa Marga, JORR completion time factors, anticipated problems in completing land acquisition and the need to generate toll revenues as soon as possible, the JORR segments to be covered by the financial assistance request have been confirmed as:
W1
W2
12 ) See Chapter 5 for the engineering aspects and Chapter 7 for the economic and financial viability considerations.
The Study on Integrated Transport Master Plan for JABOTABEK (Phase I) Final Report Volume IV (Review of Jakarta Outer Ring Road Project) Chapter 3
3-5
S
E1
E2
E3, and
Feeder roads Jl. Cakung Cilincing Raya, Jampea Cilincing Raya and Sulawesi (to guarantee proper excess to the JORR from the harbor area. The 1999 Implementation Program that supported the official SYL request contained in the system configuration also a 3km stretch of the new Jakarta-Serpong Toll Road identified as W2’. However, W2’ has now been excluded upon the specific request of the GOI
3. Section N remains, in principle, part of the definition of the JORR. However, mainly due to anticipated problems in land acquisition, this section is to be excluded from the financial assistance request and replaced by the feeder roads referred to above. Section N is to be completed by a not yet determined point in the future
4. Extra Works. This cost item had to be introduced newly. It is needed for checking the design, testing existing structures and making provisions for repair or replacement of such structures.
5. Toll collection system. Is an integral part of the project definition.
6. Toll road information and control system. A “minimum” or “basic” toll road information and control system is to form an integral part of the project definition
7. Communications system. Forms an integral part of the project definition, and
8. Engineering services. They cover design and supervision services for the JORR itself and the installation, testing and supervision for the other three hardware components identified above. They form an integral part of the project definition.
All further considerations in this review and assessment exercise are based on the JORR project definition as outlined above.
Chapter 4
Socio-Economic and
Toll Road Traffic Demand Profile
The Study on Integrated Transport Master Plan for JABOTABEK (Phase I) Final Report Volume IV (Review of Jakarta Outer Ring Road Project) Chapter 4
4-1
4. Socio-economic and Toll Road Traffic Demand Profile
4.1 Socio-economic Profile In order to review and assess properly the results of past project viability considerations,1 it is necessary to establish selected empirical socio-economic and traffic demand indicators at national and Jabotabek region levels that reflect to the extent possible 1997 post-crisis developments. These indicators are based either on the six-year period from 1995 to 2000, or where data for 2000 could not yet be estimated firmly, such indicators were based on the five-year period from 1995 to 19992.
Table 4.1.1 summarizes the national macro level key indicator, Table 4.1.2 establishes the national level road & rail transport sector indicator, Table 4.1.3 summarizes the Jabotabek level demographic and economic base data, Table 41.4 presents the selected Jabotabek road transport sector data and Table 4.1.5 the rail sector data3.
The performance of these indicators over the indicated periods is summarized in the following actions.
4.1.1 GDP and RDP Growth The elasticity between the national level GDP and the Jabotabek level GRDP growth ranged between factor 1.8 (highest) to factor 1.21 (lowest) for the period for which data are available. The factor was 1.46 on average.
4.1.2 Real Per Capita Movements The elasticity between national level real per capita income growth (constant 1993 price base) and Jabotabek level real per capita income growth ranged, between factor 1.88 (highest) to factor 0.94 (lowest) for the period for which data is available. The factor was 1.40 on average.
The data suggests that, after a severe contraction in 19984, contraction in real per capita income halted in 1999 and positive growth started in 2000 again.
Real per capita income growth at national level is estimated at around 1.41 percent for 2000 and there may already be positive real per capita income growth in the Jabotabek region. Such trends would be fully consistent with the fact that the economic recovery has been fueled so far by consumption expenditures.
In addition, real per capita income levels in absolute terms in Jabotabek are over factor two (2) times the national average with real per capita income in Jabotabek growing faster than the national average. Real per capita contraction in Jabotabek during the crisis years was steeper than the national average. However, a reverse trend toward positive real per capita growth in Jabotabek would support the empirical data of only limited impact (in terms of duration) on growth in the vehicle fleet and traffic demand on toll roads (see below).
1 ) See Section 2.4 of Chapter 2 and Section 3.2 of Chapter 3. 2 ) See the relevant Chapters in Volume I for a comprehensive discussion on socio-economic features, impact of the financial and economic crisis, and so on. Such discussion does not need to be duplicated here. 3 ) Rail sector data are discussed in Volume I. 4 ) Real per capita income decline of –14.5 percent at national and –20.0 percent at Jabotabek level in 1998.

The Study on Integrated Transport Master Plan for JABOTABEK (Phase I) Final Report Volume IV (Review of Jakarta Outer Ring Road Project) Chapter 4
4-2
4.1.3 Motor Vehicle Production Domestic motor vehicle production (excluding motorcycles), which peaked at 389,279 units in 1997, declined drastically to 58,079 units in 1998 for a negative growth rate of –85.1 percent. 1999 domestic production has grown again to 88,962 units and in 2000 to 122,639 units, thus achieving a growth rate of 111.2 percent between 1998 and 2000. The actual growth rate in production is higher than that, since year 2000 production figures are for the January to May 2000 period only.
Reliable actual sales data are not available. However, given the financial performance situation of motor vehicle manufacturers, the production data most likely reflects actual sales conditions. This is likely to be so, since companies cannot afford to produce for stock. In brief, domestic production data suggests that demand for motor vehicles is growing strongly, though from a small base.
4.1.4 Registered Motor Vehicles The number of registered motor vehicles (including motorcycles) in the police territorial jurisdiction of DKI Jakarta5 has grown from 3,021,166 units in 1995 to 3,909,497 units in 1999. This growth in stock is equivalent to a compound growth rate of 6.7 percent. A comparison of the structural composition of the motor vehicle stocks in 1995 and 1999 suggests a definitive trend toward increasing shares of passenger cars and motorcycles in the motor vehicle fleet composition.
The share of passenger cars in the total fleet grew from around 28.1 percent in 1995 to around 28.8 percent in 1999, equivalent to 849,939 units in 1995 and 1,125,334 units in 1999. This is equivalent to a compound growth rate of 7.3 percent for passenger car stock over the period, or 0.6 percentage points above the total growth of motor vehicle stock. The share of motorcycles6 in the total motor vehicle stock has grown from 51.0 percent in 1995 to around 53.5 percent in 1999, equivalent to an absolute number of 1,540,825 units in 1995 and 2,092,053 units in 1999. This is equivalent to a compound growth rate of 7.95 percent over the period, or 1.25 percentage points above the growth of total motor vehicle fleet.
Growth in the bus fleet over the same period has been minimal at 0.13 percent. Hence, the share of buses in the total fleet has declined from around 10.3 percent in 1995 to roughly 8.0 percent in 1999.
The number of trucks has grown from 320,246 units in 1995 to about 380,353 units in 1999, equivalent to a compound growth rate of around 4.4 percent. The share in the total fleet has remained in a similar order of magnitude, 10.6 percent in 1995 and 9.7 percent in 1999.
5 ) Which is adopted as a proxy for the Jabotabek area as a whole. 6 ) Irrelevant for toll roads, but highly important for traffic movements and congestion levels on the road network as a whole.

Table 4.1.1 National Level Macro Data 1995 to 2000 (Unit: as indicated) A c t u a l
P a r a m e t e r Unit 1995 1996 1997 1998 1999 2000 Comments & Observations estim. * estim. *
NATIONAL MACRO LEVEL DATA
1.) Absolute Population Size Million people 194.8 198.3 201.4 204.4 207.4 210.5 The 1999 BPS estimate excludes the popu- Growth rate % n.a. 1.83 1.53 1.51 1.47 1.49 lation for "Timor 2.) Gross Domestic Product - GDP Billion Rupiah 452,380.9 532,568.0 627,695.5 1,002,333.0 1,107,291.1 292,400.1 2000: first quarter only. (At current market prices) Growth rate % n.a. 17.73 17.86 59.68 10.47 (…) The 2000 estimates are for first quarter 3.) Gross Domestic Product - GDP Billion Rupiah 383,767.8 413,797.9 433,245.9 376,051.6 376,902.5 96,985.6 only. If annualized they would result (At 1993 constant prices) Growth rate % n.a. 7.83 4.7 -13.2 0.23 (…) in 2.93% (including oil& gas). The ADB estimates GDP growth for 2000 at 3.5%. 4.) Employment Million people 80.11 n.a. 87.05 87.67 88.82 n.a. Employment growth recorded by BPS is Growth rate % n.a. n.a. n.a. 0.71 1.31 (…) somewhat unusual for output contraction. 5.) Private consumption expenditures Billion Rupiah n.a. 257,016.2 277,116.1 267,912.7 271,867.3 n.a. Private consumption and GFCF figures (At 1993 constant prices) Growth rate % n.a. n.a. 7.82 -3.32 1.48 (…) are not yet available. 6.) GFCF Billion Rupiah n.a. 128,698.6 139,725.5 90,070.8 71,351.4 n.a. (At 1993 constant prices) Growth rate % n.a. n.a. 8.57 -35.54 -20.78 (…) 7.) Export Value Billion Rupiah n.a. 112,391.4 121,157.9 134,707.2 91,517.6 n.a. Export & import values are available (At 1993 constant prices) Growth rate % n.a. n.a. 7.80 11.18 -32.06 (…) the first quarter 2000. However, 8.) Import Value Billion Rupiah n.a. 121,862.8 139,796.1 132,400.7 78,252.3 n.a. annualisation is difficult, due to different (At 1993 constant prices) Growth rate % n.a. n.a. 14.72 -5.29 -40.9 (…) statistical format. 9.) Inflation % n.a. 6.47 11.05 77.63 2.01 4.18 The 2000 estimation is annualized based on 44 cities' in Indonesia. 10.) Per Capita Income '93 const.prices Rupiahs 1,970,061 2,086,727 2,151,171 1,839,783 1,817,273 1,842,957 Figures for 2000 are based on annualized
Growth rate % n.a. 5.92 3,09 -14.48 -1.22 1.41 GDP and population estimation. Source: Compilation by JICA Study Team. Notes: 1) National level GDP data for 1995 are from "Statistics during 50 years Indonesian Independence"; BPS, Jakarta 1997. The data for the period 1996 to 1999 are from
Yearbook 1999"; BPS; Jakarta; 2000. GDP for 1999 and 2000 are estimated by BPS. The year 2000 figure is for the first quarter only. GDP figures include oil & gas. 2) Population size data at national level are from "Statistical Yearbook of Indonesia 1999"; BPS, Jakarta, 2000. Data for 1995 are based on 1995 intercensal population 2000 population size data are based on BPS projections for the period 2000 to 2005; "Indikator Ekonomi"; BPS; Jakarta; Juli 2000. 3) Employment data are from "Statistical Yearbook of Indonesia 1999"; BPS; Jakarta; 2000. 4) Private consumption, GFCF, export and import values and inflation data for the period 1996 to 1999 are from "Statistical Yearbook of Indonesia 1999", BPS, Jakarta 2000. Data for the first quarter of 2000, where available, are from "Indikator Ekonomi", Juli 2000; BPS, Jakarta, 2000. 5.) Per capita income has been computed using parameter 1.) and 3.) data identified in this table. n.a. = not (or not yet) available. (…) Cannot be calculated, due to uncertainty of available data.
4-3

Table 4.1.2 National Level Road & Rail Transport Sector Data 1995 to 2000 (Unit: as indicated) A c t u a l
P a r a m e t e r Unit 1995 1996 1997 1998 1999 2000 Comments & Observations estim. * estim. *
NATIONAL LEVEL ROAD & RAIL TRANSPORT SECTOR DATA 1.) Domestically assembled Units 1,430,479 1,750,867 2,250,390 577,483 660,915 n.a. motor vehicles Jeeps Units 6,079 5,598 4,081 1,257 1,287 n.a. Passenger cars Units 39,839 35,303 55,102 8,401 5,974 n.a. Pick up Units 275,552 220,681 267,367 43,194 69,454 n.a. Buses Units 48,020 52,761 49,958 4,699 10,435 n.a. Trucks Units 18,051 11,151 12,771 528 1,812 n.a. Motorcycles Units 1,042,938 1,425,373 1,861,111 519,404 571,953 n.a. Sub-total 4-wheelers Units 387,541 325,494 389,279 58,079 88,962 122,639 Year 2000 data for 5 months only. 2.) Imports of motor vehicles units 20,895 33,432 38,946 17,173 4,128 n.a. See footnote 4.) for explanations. 3.) TOTAL Units 1,451,374 1,784,299 2,289,336 594,656 665,043 n.a. 4.) Traffic volume toll roads "'000" vehicles/y 518,094 591,247 727,013 674,880 738,820 n.a. 5.) Toll revenues by PT Jasa Marga Million Rupiah 375,203 431,264 496,187 467,636 515,769 n.a. 6.) Railway [Passenger-km] Million 15,524 15,224 16,389 16,140 18,585 8,326 2000 data are for 5 months only. If Growth rate % 23.07 -1.93 7.65 -1.52 15,15 (…) annualized, total would be 19,982. 7.) Railway [ton-km] Million 4,174 4,700 8,213 4,960 5,035 1,997 2000 data are for 5 months only. If Growth rate % 8.30 12.60 74.74 -39.61 1.51 (…) annualized, total would be 4,793.
Source: Compilation by JICA Study Team. Notes: 1) Domestically assembled motor vehicles and motor vehicle imports are from "Statistical Yearbook of Indonesia 1999"; BPS; Jakarta, 2000.
2) Traffic volume on & toll revenues from toll roads (national level) are from "Annual Report 1999"; PT Jasa Marga (Persero). 3) The category "pick up" is likely to include Kijangs. 4.) Domestic vehicle production data for the period January to May 2000 from GAIKINDO database. If annualized they would amount to some 295,000 units, equivalent to a growth rate of 332% as against 1999 production levels. It is not possible to obtain actual sales data. However, giving economic circumstances, it is reasonable to assume that actual domestic production data are close to sales data For domestically produced vehicles, since on-stock production is likely to be minimal. n.a. = not (or not yet) available. (…) Cannot be calculated, due to uncertainty of available data.
4-4

Table 4.1.3 Jabotabek Level Demographic & Economic Base Data 1995 to 2000 (Unit: as indicated) A c t u a l
P a r a m e t e r Area Unit 1995 1996 1997 1998 1999 2000 Comments
JABOTABEK LEVEL DEMOGRAPHIC & ECONOMIC BASE DATA
1.) Absolute Population Size DKI Jakarta Million people 9.113 9.272 9.434 9.599 9.767 8.300 See footnote 2). Bogor Million people 4.200 4.303 4.409 4.517 4.628 4.742 Tangerang Million people 3.589 3.741 3.900 4.065 4.237 4.417 Bekasi Million people 2.757 2.862 2.972 3.085 3.203 3.325 Botabek Million people 10.546 10.906 11.281 11.667 12.068 12.484 Jabotabek Million people 19.659 20.178 20.715 21.266 21.835 20.784 2.) Gross Regional Domestic Product DKI Jakarta Billion Rupiah 60,648.7 66,164.8 69,543.3 57,283.5 56,638.2 n.a. (GRDP at 1993 constant prices) Growth rate % n.a. 9.10 5.11 -17.63 -1.13 (…) Botabek Billion Rupiah 21,311.10 27,327.10 29,232.10 23,816.60 n.a. n.a. Growth rate % n.a. 28.23 6.97 -18.53 (…) (…) Jabotabek Billion Rupiah 81,959.8 93,491.9 98,775.4 81,100.1 n.a. n.a. Growth rate % n.a. 14.1 5.7 -17.9 (…) (…) 3.) Employment DKI Jakarta Million people 3.222 n.a. n.a. n.a. n.a. n.a. Growth rate % n.a. (…) (…) (…) (…) (…) Botabek Million people 3.721 n.a. n.a. n.a. n.a. n.a. Growth rate % n.a. (…) (…) (…) (…) (…) Jabotabek Million people 6.943 n.a. n.a. n.a. n.a. n.a. Growth rate % n.a. (…) (…) (…) (…) (…) DKI Jakarta Rupiah 6,655,185 7,135,979 7,371,560 5,967,653 5,798,935 (…) 4.) Per Capita Income '93 const.prices Growth rate % n.a. 7.22 3.30 -19.04 -2.83 (…)
Botabek Rupiah 7,771,648 8,572,520 8,755,908 6,951,239 (…) (…) Growth rate % n.a. 10.31 2.14 -20.61 (…) (…) Jabotabek Rupiah 4,169,073 4,633,358 4,768,303 3,813,604 (…) (…) Growth rate % n.a. 11.14 2.91 -20.02 (…) (…)
Source: Compilation by JICA Study Team. Notes: 1) Absolute population size data are based on 1995 census data, projected based on adopted Jabotabek Demographic Framework.
2) Absolute population size data for DKI Jakarta for 2000 are based on preliminary results of the PBS population census. 3) GRDP and employment data are from Tables 2.10, 2.16 and 2.18, Interim Report. GRDP data for DKI Jakarta for 1999 are from BPS. n.a. = not (or not yet) available. (…) Cannot be calculated, due to uncertainty of available data.
4-5

Table 4.1.4 Jabotabek Road Transport Sector Data 1995 to 2000 (Unit: as indicated) A c t u a l
P a r a m e t e r Unit 1995 1996 1997 1998 1999 2000 Comments
JABOTABEK ROAD TRANSPORT SECTOR DATA
1.) Registered motor vehicles by police territorial Units 3,021,166 3,397,770 3,842,785 3,876,563 3,909,497 n.a. jurisdiction DKI Jakarta Growth rate % 12.53 12.47 13.10 0.88 0.85 (…) Passenger cars Units 849,939 967,229 1,095,170 1,107,087 1,125,334 n.a. Growth rate % 12.77 13.80 13.23 1.09 1.65 (…) Buses Units 310,128 310,636 311,471 311,890 311,755 n.a. Growth rate % 5.81 0.16 0.27 0.13 -0.04 (…) Trucks Units 320,246 344,730 380,788 379,605 380,353 n.a. Growth rate % 9.24 7.65 10.46 -0.31 0.20 (…) Motorcycles Units 1,540,825 1,775,153 2,055,332 2,077,980 2,092,053 n.a. Growth rate % 14.58 15.21 15.78 1.10 0.68 (…) 2.) Average Annual Traffic Volume on Jabotabek Toll Roads Jagorawi Vehicles 1,975,677 2,186,421 2,539,441 2,434,918 2,616,276 925,504 2000: for Jan.;Feb. March; May only. (Vehicle Type I, IIA & IIB) Growth in % n.a. 10.67 16.15 -4.12 7.45 (…)
Jakarta-Cikampek Vehicles 2,309,116 2,435,293 3,021,417 2,846,940 3,026,092 1,076,437 2000: for Jan.;Feb. March; May only. Growth in % n.a. 5.46 24.07 -5.77 6.29 (…) Jakarta-Merak Vehicles 1,779,504 1,988,650 2,237,870 2,345,771 2,571,476 925,382 2000: for Jan.;Feb. March; May only. Growth in % n.a. 11.75 12.53 4.82 9.62 (…) Cawang-Tomang Vehicles 2,386,419 2,387,677 2,545,239 2,316,225 2,578,656 747,764 2000: for Jan.;Feb. March; May only. Growth in % n.a. 0.05 6.60 -9.00 11.33 (…) Cawang-Tg.Priok Vehicles 739,667 1,026,615 1,388,256 1,225,304 1,425,389 521,242 2000: for Jan.;Feb. March; May only. Growth in % n.a. 38.79 35.23 -11.74 16.33 (…) Intraurban Tollway Vehicles 3,126,404 3,414,292 3,933,492 3,541,528 4,004,043 1,450,424 2000: for Jan.;Feb. March; May only. Growth in % n.a. 9.21 15.21 -9.96 13.06 (…) Cengkareng Vehicles 361,065 425,598 495,090 381,910 422,535 160,007 2000: for Jan.;Feb. March; May only. Growth in % n.a. 17.87 16.33 -22.86 10.64 (…) Kapuk Vehicles 0 274,648 667,372 560,067 646,279 244,765 2000: for Jan.;Feb. March; May only. Growth in % n.a. n.a. 142.99 -16.08 15.39 (…) TOTAL Vehicles 9,551,448 10,724,902 12,894,685 ########### 13,286,703 4,601,101 2000: for Jan.;Feb. March; May only. Growth in % n.a. 12.29 20.23 -6.08 9.71 (…)
Source: Compilation by JICA Study Team, based on PT Jasa Marga monthly traffic volume reports. Notes: n.a. = not (or not yet) available. (…) Cannot be calculated, due to uncertainty of available data.
4-6

Table 4.1.5 Jabotabek Rail Transport Sector Data 1995 to 2000 (Unit: as indicated) A c t u a l
P a r a m e t e r Unit 1995 1996 1997 1998 1999 2000 Comments
JABOTABEK RAIL TRANSPORT SECTOR DATA 1.) Rail Passenger Traffic Originating in DAOP1 Long/Medium Distance Trains Number of Passengers Thousand 8.414 8.117 8.545 8.758 9.854 5.156 2000: Jan.to June only. Growth in % 10.61 -3.53 5.27 2.49 12.51 (…) Passenger-km Million 4.046 3.883 3.865 4.120 4.508 2.323 2000: Jan.to June only. Growth in % 12.14 -4.03 -0.46 6.60 9.42 (…) Local Economy Trains Number of Passengers thousand 10.408 10.518 11.346 14.162 13.991 7.608 2000: Jan. to June only. Growth in % 27.00 1.06 7.87 24.82 -1.21 (…) Passenger-km Million 379 431 457 528 627 350 2000: Jan.to June only. Growth in % 36.33 13.72 6.03 15.54 18.75 (…) Jabotabek Commuter Trains Number of Passengers Thousand 85.378 100.008 104.074 107.899 117.670 59.816 2000: Jan.to June only. Growth in % 30.06 17.14 4.07 3.68 9.06 (…) Passenger-km Million 2.948 3.154 3.307 3.285 n.a. n.a. 2000: Jan.to June only. Growth in % 31.31 6.99 4.85 -0.67 n.a. (…) Source: Compilation by JICA Study Team, based on DAOP1 data and reflecting "ticket sales" only. Notes: n.a. = not (or not yet) available. (…) Cannot be calculated, due to uncertainty of available data.
4-7

The Study on Integrated Transport Master Plan for JABOTABEK (Phase I) Final Report Volume IV (Review of Jakarta Outer Ring Road Project) Chapter 4
4-8
It can be concluded that growth of the total motor vehicle fleet continues in spite of the financial and economic crisis, though the growth rate has slowed down. Such growth was driven mainly by the growth in the stock of motorcycles and passenger cars. Hence, congestion levels are unlikely to go down, though there may be relative shifts in the locations where such congestion occurs.
4.1.5 Traffic Volume on Jabotabek Toll Roads
Monthly traffic volume data collected by P.T. Jasa Marga indicate that the volume of vehicles on Jabotabek toll roads has increased from 9,551,448 vehicles (vehicle type GOL I, IIA and IIB) in 1995 to around 13,286,703 vehicles in 1999. Thus, the compound growth rate of vehicles (all allowed vehicle types) using the Jabotabek toll roads is around 8.6 percent over the period. The only year of traffic volume contraction on the toll roads was 1998, when the volume declined by around –6.1 percent compared to the 1997 level.
Traffic data for January, February, March and May in 2000 indicate a volume of 4,601,101 for these 4 months. If annualized, and disregarding any seasonal fluctuations, this would amount to an estimated total traffic volume of 13,803,303 vehicles in 2000, or a growth rate of 3.9 percent compared to 1999.
In summary, the traffic volume on Jabotabek toll roads is growing, in spite of the financial and economic crisis, although the pace has slowed down somewhat.
4.2 Future Vehicle Trip Patterns
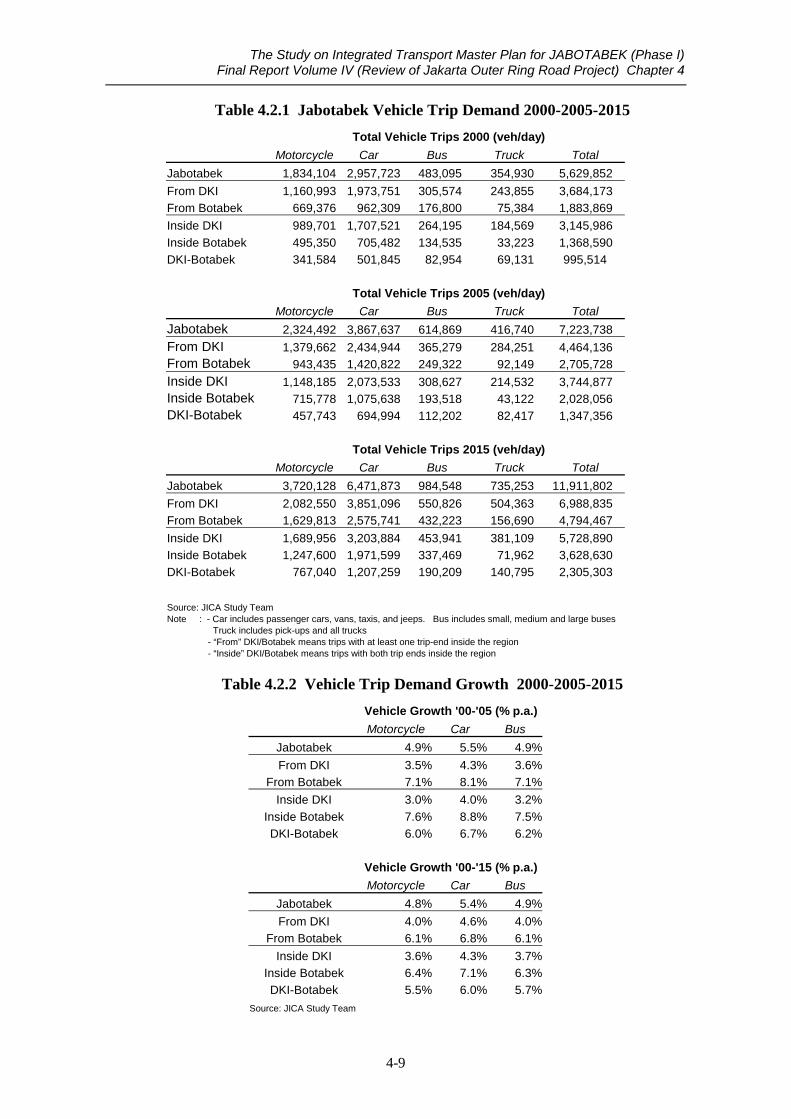
Trip generation models were applied to forecast future levels of Jabotabek region demand for each zone, using as input the forecast distributions of the respective socio-economic and demographic variables7. Subsequent to trip distribution and modal split model application, vehicular matrices were synthesized and established for the base and planning years. Table 4.2.1 provides a summary of the total vehicle trip demand for 2000, 2005 and 2015; while Table 4.2.2 presents the implied average annual growth rates.
The results of the vehicle trip demand analysis suggest that the total Jabotabek motorized trips could grow from around 5.6 million vehicles per day in 2000 to 7.2 million and 12 million vehicles per day in 2005 and 2015, respectively. Vehicle trips are expected over the 15 year period to be more than double. The ‘car’ trip is expected to continue its dominant role, accounting for more than half of the total trips in 2015. The vast majority of Jabotabek trips have now at least one trip end in DKI Jakarta, a pattern that is expected to continue in the future.
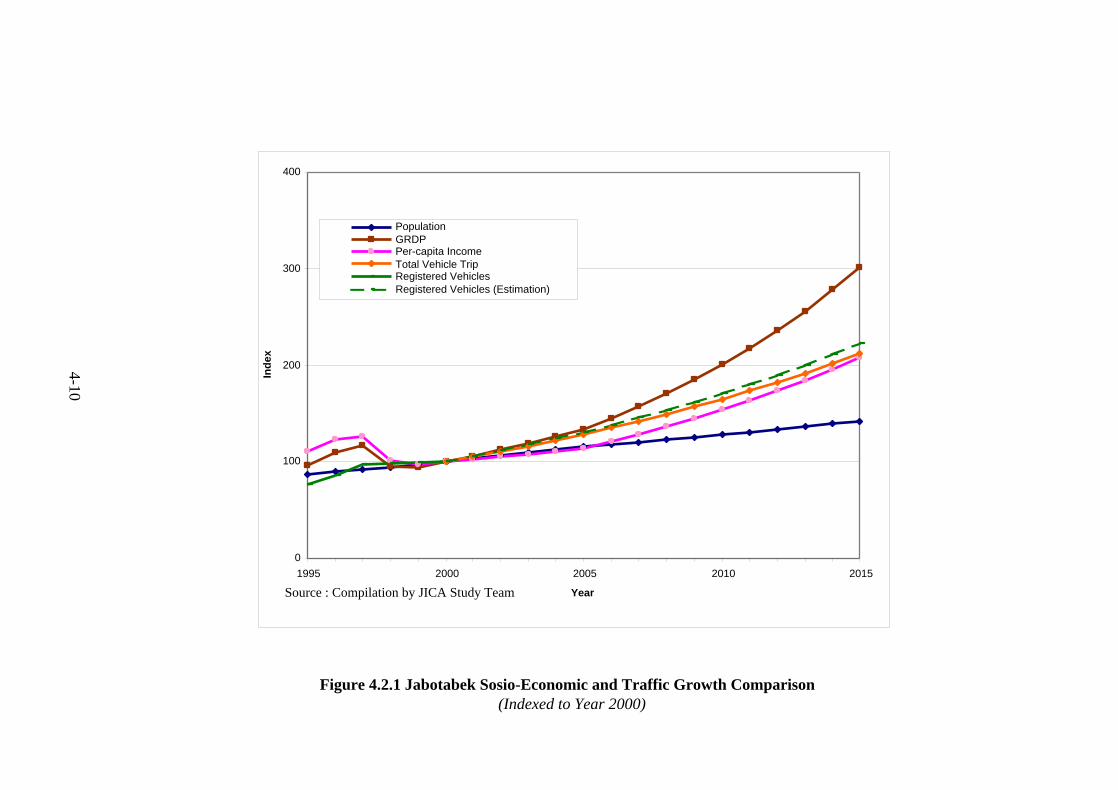
Table 4.2.2 indicates a projected growth in vehicle trip demand of around 5 percent p.a. for the whole Jabotabek region over the 2000-2005 period. This growth is roughly within the corridor of vehicle ownership growth and per-capita income growth as indicated in Figure 4.2.1.
7 Detailed zonal level summaries of the planning year trip ends are reported in a separate Working Paper,
together with the forecast socioeconomic data from which these forecasts were prepared.
The Study on Integrated Transport Master Plan for JABOTABEK (Phase I) Final Report Volume IV (Review of Jakarta Outer Ring Road Project) Chapter 4
4-9
Table 4.2.1 Jabotabek Vehicle Trip Demand 2000-2005-2015 Total Vehicle Trips 2000 (veh/day) Motorcycle Car Bus Truck Total Jabotabek 1,834,104 2,957,723 483,095 354,930 5,629,852 From DKI 1,160,993 1,973,751 305,574 243,855 3,684,173 From Botabek 669,376 962,309 176,800 75,384 1,883,869 Inside DKI 989,701 1,707,521 264,195 184,569 3,145,986 Inside Botabek 495,350 705,482 134,535 33,223 1,368,590 DKI-Botabek 341,584 501,845 82,954 69,131 995,514 Total Vehicle Trips 2005 (veh/day)
Motorcycle Car Bus Truck Total Jabotabek 2,324,492 3,867,637 614,869 416,740 7,223,738 From DKI 1,379,662 2,434,944 365,279 284,251 4,464,136 From Botabek 943,435 1,420,822 249,322 92,149 2,705,728 Inside DKI 1,148,185 2,073,533 308,627 214,532 3,744,877 Inside Botabek 715,778 1,075,638 193,518 43,122 2,028,056 DKI-Botabek 457,743 694,994 112,202 82,417 1,347,356 Total Vehicle Trips 2015 (veh/day) Motorcycle Car Bus Truck Total Jabotabek 3,720,128 6,471,873 984,548 735,253 11,911,802 From DKI 2,082,550 3,851,096 550,826 504,363 6,988,835 From Botabek 1,629,813 2,575,741 432,223 156,690 4,794,467 Inside DKI 1,689,956 3,203,884 453,941 381,109 5,728,890 Inside Botabek 1,247,600 1,971,599 337,469 71,962 3,628,630 DKI-Botabek 767,040 1,207,259 190,209 140,795 2,305,303 Source: JICA Study Team Note : - Car includes passenger cars, vans, taxis, and jeeps. Bus includes small, medium and large buses Truck includes pick-ups and all trucks - “From” DKI/Botabek means trips with at least one trip-end inside the region - “Inside” DKI/Botabek means trips with both trip ends inside the region
Table 4.2.2 Vehicle Trip Demand Growth 2000-2005-2015 Vehicle Growth '00-'05 (% p.a.)
Motorcycle Car Bus Jabotabek 4.9% 5.5% 4.9% From DKI 3.5% 4.3% 3.6%
From Botabek 7.1% 8.1% 7.1% Inside DKI 3.0% 4.0% 3.2%
Inside Botabek 7.6% 8.8% 7.5% DKI-Botabek 6.0% 6.7% 6.2%
Vehicle Growth '00-'15 (% p.a.)
Motorcycle Car Bus Jabotabek 4.8% 5.4% 4.9% From DKI 4.0% 4.6% 4.0%
From Botabek 6.1% 6.8% 6.1% Inside DKI 3.6% 4.3% 3.7%
Inside Botabek 6.4% 7.1% 6.3% DKI-Botabek 5.5% 6.0% 5.7%
Source: JICA Study Team
0
100
200
300
400
1995 2000 2005 2010 2015
Year
Inde
x
PopulationGRDPPer-capita IncomeTotal Vehicle TripRegistered VehiclesRegistered Vehicles (Estimation)
Source : Compilation by JICA Study Team
Figure 4.2.1 Jabotabek Sosio-Economic and Traffic Growth Comparison(Indexed to Year 2000)
4-10
The Study on Integrated Transport Master Plan for JABOTABEK (Phase I) Final Report Volume IV (Review of Jakarta Outer Ring Road Project) Chapter 4
4-11
Botabek-related trips are forecast to have trip demand growths which are higher than those for DKI Jakarta. These differential growth rates are a direct reflection of the increasing activities within the Botabek area as well as the continued interaction between DKI Jakarta and Botabek.
Trip matrices were forecast for each of the design years; internal study area travel demand was prepared using the calibrated trip distribution models and separately modeled external trips were added to the internal trips to create total 2000, 2005 and 2015 vehicle trip matrices. These were converted to equivalent pcu matrices, that formed the basis for estimating travel demand.
The expected growth of traffic demand related to Botabek, which do not necessarily pass the central part of Jakarta, would augment the importance of the JORR because it will provide detour route for these trips.
4.3 Projected JORR Demand 2005 and 2015
4.3.1 Network Development
An important function of the transport model is the allocation of zone-to-zone movements to roadway facilities and to chosen routes. The road network encompasses a number of essential elements which include, in the most generic sense, arterial and tollway components. Each system will vary over time. Future year networks are thus based on the 2000 network adjusted by planned road improvements and new constructions; the arterial system in accordance with development plans promulgated by each local government in Jabotabek; and the tollway system in line with the probable schedule of implementation.
The following three networks were utilized for traffic demand forecasting on the road network in the Study area:
1. The 2000 network comprising of existing principal road facilities within Jabotabek,
2. The 2005 network encompassing the 2000 network and the inclusion of the Jakarta Outer Ring Road system; and
3. The 2015 network based on the DKI 2010 Plan and Botabek region road development plans as indicated in the respective master plans.
4.3.2 Projected Demand
The utilization of Jabotabek road facilities is, in line with increasing trip demand, expected to intensify in the future. Study area pcu-kilometers of travel are forecast to grow to 112.6 million in 2005 and 198.5 million by 2015. In other words, total trip activity by all road-based modes of transport is likely to almost double in a decade. The importance of higher-order, freeway-class roads in meeting this demand is indisputable.
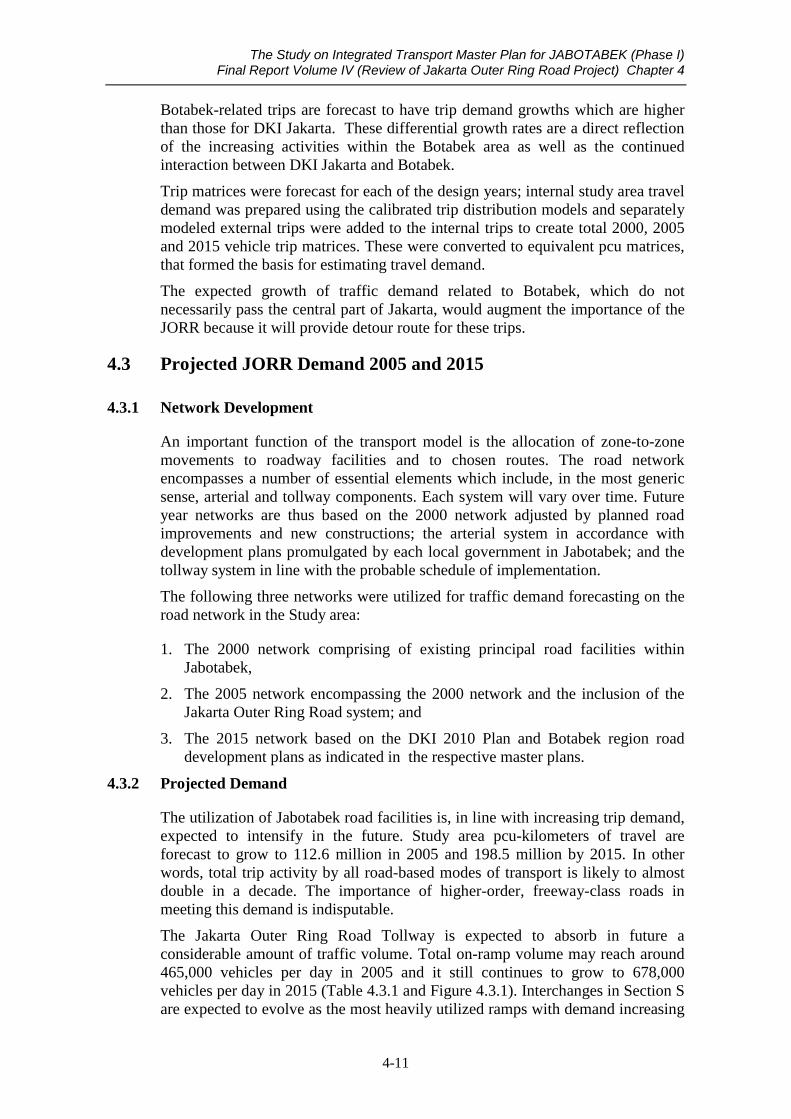
The Jakarta Outer Ring Road Tollway is expected to absorb in future a considerable amount of traffic volume. Total on-ramp volume may reach around 465,000 vehicles per day in 2005 and it still continues to grow to 678,000 vehicles per day in 2015 (Table 4.3.1 and Figure 4.3.1). Interchanges in Section S are expected to evolve as the most heavily utilized ramps with demand increasing
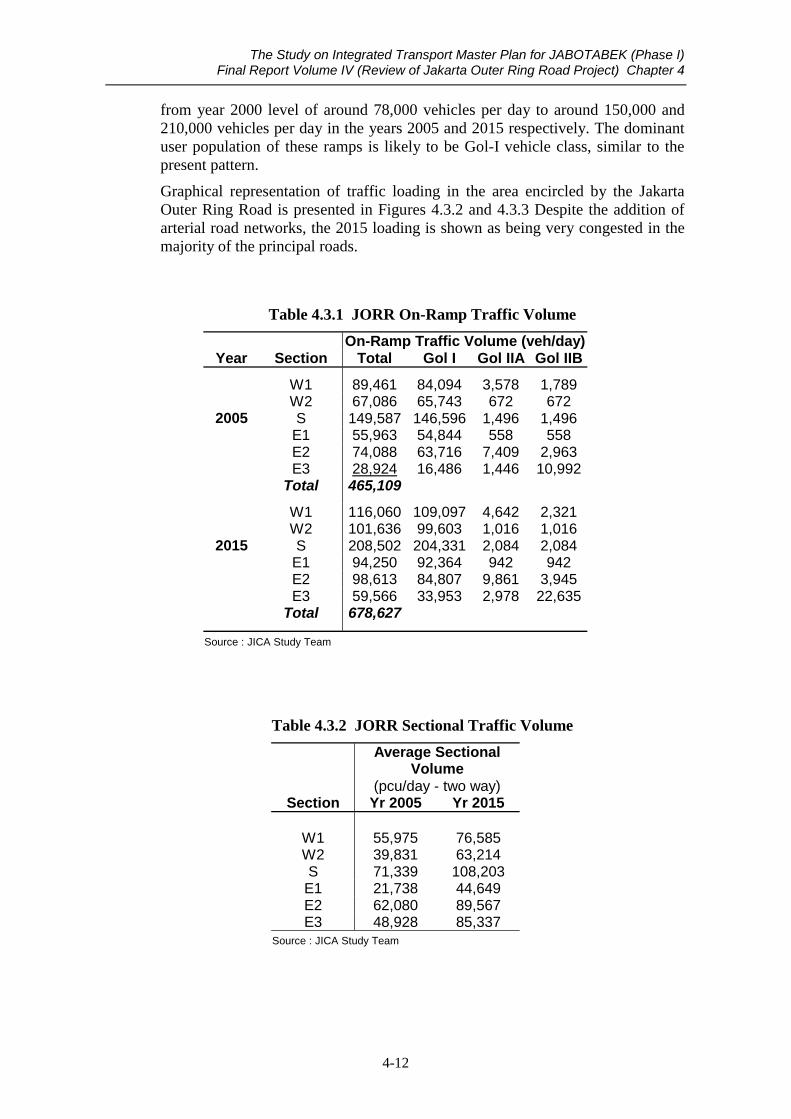
The Study on Integrated Transport Master Plan for JABOTABEK (Phase I) Final Report Volume IV (Review of Jakarta Outer Ring Road Project) Chapter 4
4-12
from year 2000 level of around 78,000 vehicles per day to around 150,000 and 210,000 vehicles per day in the years 2005 and 2015 respectively. The dominant user population of these ramps is likely to be Gol-I vehicle class, similar to the present pattern.
Graphical representation of traffic loading in the area encircled by the Jakarta Outer Ring Road is presented in Figures 4.3.2 and 4.3.3 Despite the addition of arterial road networks, the 2015 loading is shown as being very congested in the majority of the principal roads.
Table 4.3.1 JORR On-Ramp Traffic Volume
On-Ramp Traffic Volume (veh/day) Year Section Total Gol I Gol IIA Gol IIB
W1 89,461 84,094 3,578 1,789 W2 67,086 65,743 672 672
2005 S 149,587 146,596 1,496 1,496 E1 55,963 54,844 558 558 E2 74,088 63,716 7,409 2,963 E3 28,924 16,486 1,446 10,992 Total 465,109
W1 116,060 109,097 4,642 2,321 W2 101,636 99,603 1,016 1,016
2015 S 208,502 204,331 2,084 2,084 E1 94,250 92,364 942 942 E2 98,613 84,807 9,861 3,945 E3 59,566 33,953 2,978 22,635 Total 678,627
Source : JICA Study Team
Table 4.3.2 JORR Sectional Traffic Volume
Average Sectional
Volume (pcu/day - two way)
Section Yr 2005 Yr 2015
W1 55,975 76,585 W2 39,831 63,214 S 71,339 108,203
E1 21,738 44,649 E2 62,080 89,567 E3 48,928 85,337
Source : JICA Study Team

The Study on Integrated Transport Master Plan for JABOTABEK (Phase I) Final Report Volume IV (Review of Jakarta Outer Ring Road Project) Chapter 4
4-13
Section S, is also forecast to carry the highest traffic volume of all JORR sections, with an average sectional volume of almost 71,000 and 108,000 pcu per day both ways in 2005 and 2015 respectively. The other JORR sections’ volume in 2005 range between 21,000 and 62,000 pcu per day two way, while in the year 2015 the range would be between 44,600 to 89,500 pcu per day for both directions (Table 4.3.2 and Figure 4.3.4). The projected sectional volumes suggest that up to the year 2015 demand can, in principle, generally be adequately accommodated by a six-lane cross section.
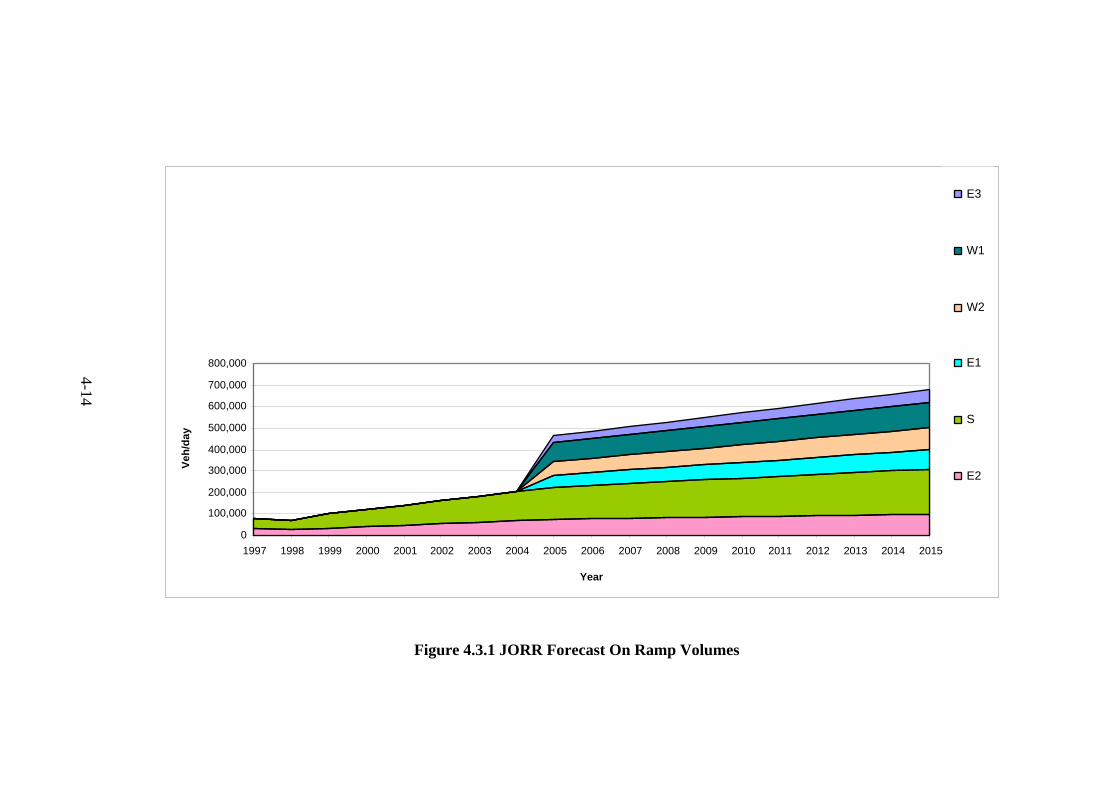
Figure 4.3.1 JORR Forecast On Ramp Volumes
0
100,000
200,000
300,000
400,000
500,000
600,000
700,000
800,000
1997 1998 1999 2000 2001 2002 2003 2004 2005 2006 2007 2008 2009 2010 2011 2012 2013 2014 2015
Year
Veh/
day
E3
W1
W2
E1
S
E2
4-14


0
20,000
40,000
60,000
80,000
100,000
120,000
140,000
160,000
Kayu
Bes
ar-P
enjar
ingan
Daan M
ogot-
Kayu
Bes
ar
Kebo
n Jer
uk-D
aan M
ogot
Meruy
a-Ke
bon J
eruk
Joglo
-Mer
uya
Petu
kang
an-Jo
glo
Keba
yora
n Lam
a-Pe
tuka
ngan
Veter
an-K
ebay
oran
Lama
Ciput
at Ra
ya-V
etera
n
PdPin
ang T
mr-PdP
inang
Brt
Fatm
awati
Brt-
PdPin
ang T
mr
Ampe
ra B
rt-Fa
tmaw
ati T
mr
LtAgu
ng B
rt-Am
pera
Tmr
Gedon
g Brt-
LtAgu
ng T
mr
Kp.R
ambu
tan-G
edon
g Brt
TMII
Junc
tion-
KpRb
tan
Bambu
Apu
s-Tam
an M
ini
Setu
-Bam
bu A
pus
Jatiw
arna
-Setu
Jati A
sih-Ja
tiwar
na
Jati A
sih-C
ikunir
Cikun
ir-Bin
tara
Bintar
a-Ca
kung
Caku
ng -C
ilincin
g
Two-
Way
Veh
/day
2005 Volume2015 Volume
Figure 4.3.4 JORR Estimated Daily Section Flows
4-17

The Study on Integrated Transport Master Plan for JABOTABEK (Phase I) Final Report Volume IV (Review of Jakarta Outer Ring Road Project) Chapter 4
4-18
4.3.3 Necessity for Further Analysis on Toll Collecting System8
As was the case found in other JORR studies conducted in the past, traffic demand projection mentioned in section 4.3.2 above was forecast under the assumption that a closed toll collection system with distance proportional toll rate (i.e. the system currently operational in JORR sections S and E2) is applied to all future JORR sections.
The basic premise for the adoption of the distance proportional tariff was that this system would entail a fair treatment to tollway users, as drivers only pay for the distance traveled. However, it is apparent that without proper integration between JORR and the Jakarta Intra Urban Tollroad (JIUT), it would be difficult to expect an optimum distribution of traffic throughout the available tollway system.
Within the context of metropolitan Jabotabek transportation system, JORR is expected to bear the responsibility of satisfying both regional and urban travel functions. The facility must serve as a connector between regional tollways, offer linkage potential between regional and urban tollways, provide a bypass route for Jakarta and concurrently absorb shorter distance intra urban trips between activity presences located along Jakarta’s periphery.
Results of traffic demand projection employing a closed system (see section 4.3.2) show that a considerable amount of traffic is absorbed by JORR, thereby relieving JIUT and the surrounding arterial roads from an excessive traffic loading. It is worth noting, however, that unexpected competition between JORR and the existing toll facilities could happen if tariff difference between parallel sections is too high. Such a situation is seen in section E1 of JORR (see Figure 4.3.2 and 4.3.3), whereby drivers opt to using the cheaper sections of Jakarta-Cikampek and Jagorawi tollroads rather than through JORR section E1. An equitable toll system is therefore necessary to ensure the effective function of JORR.
Current plans call for an evolution of toll structure into two cohesive system:
• The Jakarta Intra Urban Tollway (JIUT) will continue as a flat toll system, and
• All other tollroads (i.e. JORR and related regional tollroads) are likely to transition to an integrated system, either flat or distance proportional system, possibly with a uniform toll rate.
As a test case to examine traffic behavior towards different toll collection systems, an additional traffic demand projection was undertaken assuming a “double flat tariff system” for JORR. Under this system, both JORR and JIUT are assumed to employ a flat tariff at a certain toll rate. Prediction of the suitable toll rate for each tollway system is tricky, as it involves many factors. For presentation purposes, however, a similar toll rate of Rp. 3,000 per entry is adopted for both JORR and JIUT. Result of this exercise is presented in Figure 4.3.5 and 4.3.6 for the years 2005 and 2015 respectively.
8 ) See also Section 5.3.2 for further discussion on toll collection system.

Figure 4.3.5Traffic Assignment 2005Double Flat Tariff System
10,000 30,000 50,000
LEGEND
Unit : pcu/day/dir
ORR-W1
ORR-W2
ORR-S ORR-E1
ORR-E2
ORR-E3
SITRAMP JABOTABEKTheStudyon
IntegratedTransportationMasterPlanforJABOTABEK
(PhaseI)
4-19

Figure 4.3.6Traffic Assignment 2015Double Flat Tariff System
10,000 30,000 50,000
LEGEND
Unit : pcu/day/dir
ORR-W1
ORR-W2
ORR-S ORR-E1
ORR-E2
ORR-E3
SITRAMP JABOTABEKTheStudyon
IntegratedTransportationMasterPlanforJABOTABEK
(PhaseI)
4-20
The Study on Integrated Transport Master Plan for JABOTABEK (Phase I) Final Report Volume IV (Review of Jakarta Outer Ring Road Project) Chapter 4
4-21
As shown in Figure 4.3.5 and 4.3.6, the application of a Rp. 3,000 flat tariff on the entire stretch of JORR brings about relatively better utilization of JORR in terms of total traffic. Although drivers traveling short distances might avoid using JORR, the average trip length on JORR would become longer since drivers traveling long distances are attracted to use JORR because of relative benefit they could enjoy compared to competing routes. This has resulted in higher cross-sectional traffic volume. Under this system, Section E1 of JORR, for example, could attract much higher cross sectional traffic if compared to the closed system.
Needless to say that toll rate settings play an important role to achieve desirable traffic volume of JORR. While an Rp 3,000 flat tariff might produce better traffic, the net revenue collected from such a toll rate is not necessarily better than, for example, if the tariff is doubled or if a distance proportional tariff is adopted.
Thus, selection of the most suitable toll collection system is understandably not solely based on traffic demand. Factors influencing system selection could include, among others:
• Whether JORR will be implemented as “piece meal” or “single entity”; • The availability of traffic control and tollway information system; • Physical effects to tollway construction including toll related facilities; • Financial effects to total revenue; • Impact to overall road network in Jabotabek; • Legal matters, and so forth.
To response to this challenge, a more in-depth examination is required through investigative, yet practical, approaches given the overall level of financial risk inherent to the project. It is concurrently recognized that the complexity of the project requires the formation of unique arrangements and fiscal/operational techniques to include cross-jurisdictional agreements, negotiated rates, pre-agreed settlements, cooperative ventures and potential sources of financing the project.
Comprehensive finalization of these items at this study review level is not expected, given the understandable difficulties of all parties involved to enter into fixed agreements at such tentative juncture. Nevertheless, findings from the current analysis permit the formation of a realistic framework within which the current financial analysis is performed.
low
s