Embed Size (px)
Citation preview
PART 1: Germany, Italia, France, Spain and Belgium
17.3.2015
Yukyeong Kim
Summary of European country’s PV applicationsBased on the IEA-PVPS-Annual Report
For FinSolar ProjectAalto University School of Business
GERMANYSummary ofNational survey report of PV power applications in GERMANY 2013
2
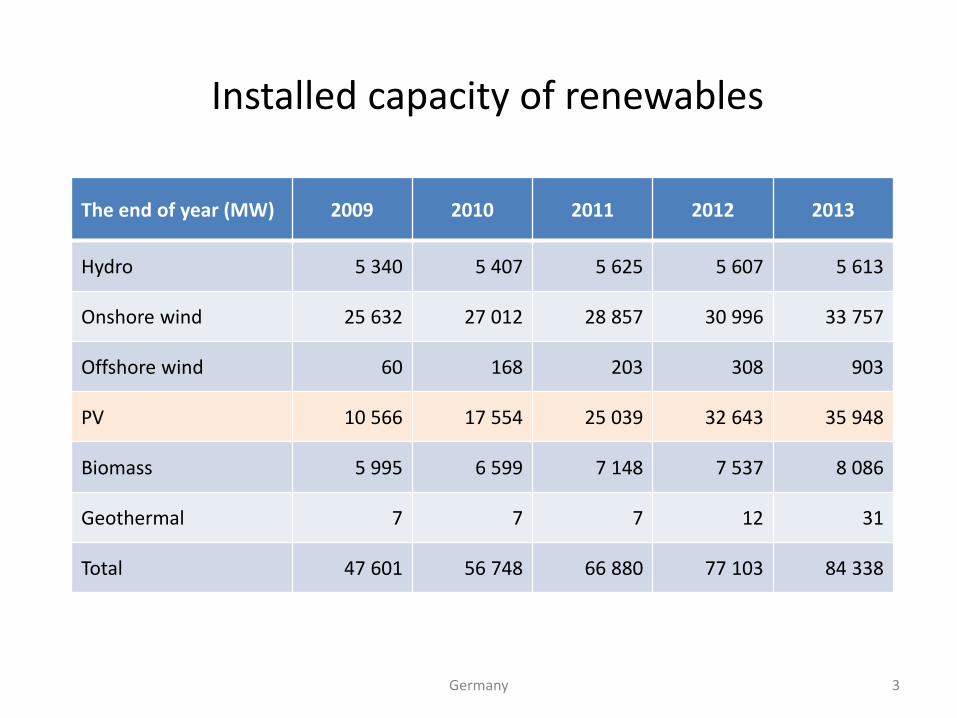
Installed capacity of renewables
The end of year (MW) 2009 2010 2011 2012 2013
Hydro 5 340 5 407 5 625 5 607 5 613
Onshore wind 25 632 27 012 28 857 30 996 33 757
Offshore wind 60 168 203 308 903
PV 10 566 17 554 25 039 32 643 35 948
Biomass 5 995 6 599 7 148 7 537 8 086
Geothermal 7 7 7 12 31
Total 47 601 56 748 66 880 77 103 84 338
Germany 3
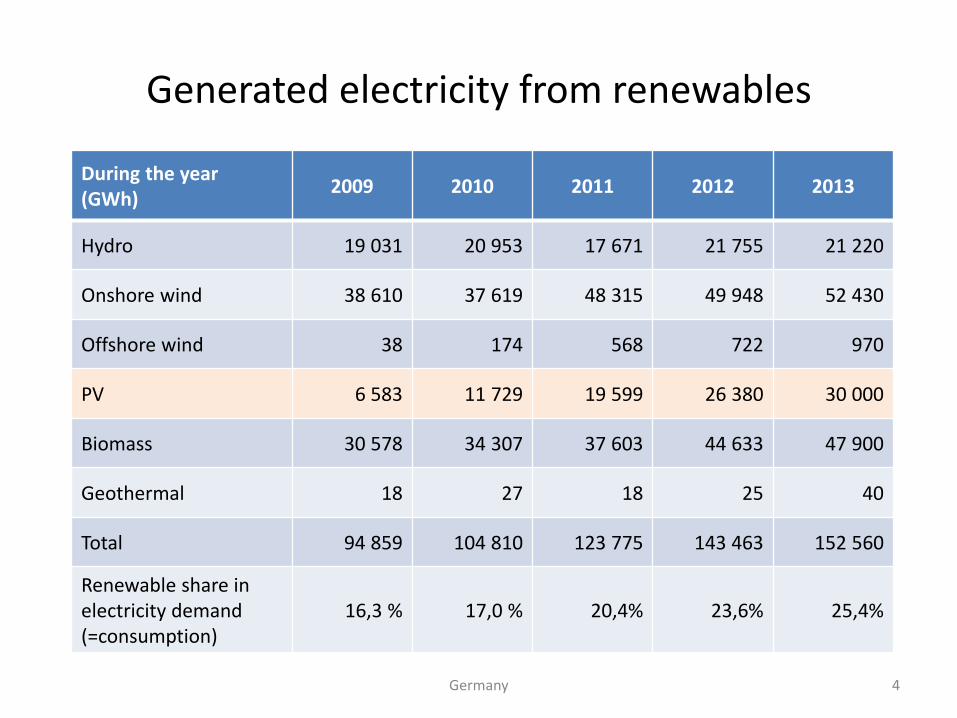
Generated electricity from renewables
During the year(GWh)
2009 2010 2011 2012 2013
Hydro 19 031 20 953 17 671 21 755 21 220
Onshore wind 38 610 37 619 48 315 49 948 52 430
Offshore wind 38 174 568 722 970
PV 6 583 11 729 19 599 26 380 30 000
Biomass 30 578 34 307 37 603 44 633 47 900
Geothermal 18 27 18 25 40
Total 94 859 104 810 123 775 143 463 152 560
Renewable share in electricity demand(=consumption)
16,3 % 17,0 % 20,4% 23,6% 25,4%
Germany 4
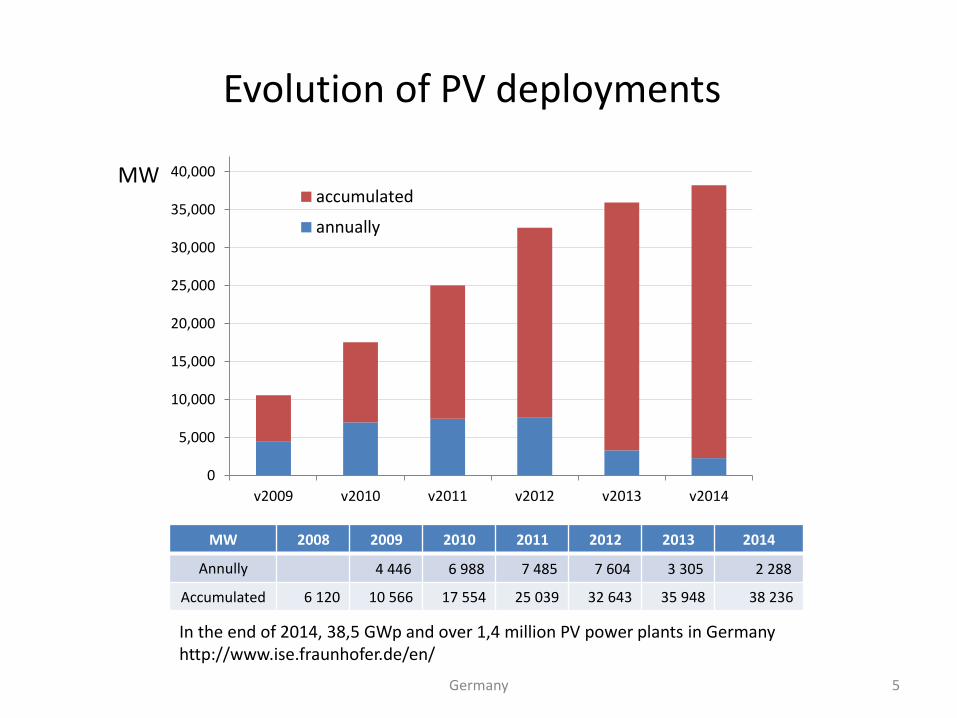
Evolution of PV deployments
MW 2008 2009 2010 2011 2012 2013 2014
Annully 4 446 6 988 7 485 7 604 3 305 2 288
Accumulated 6 120 10 566 17 554 25 039 32 643 35 948 38 236
0
5,000
10,000
15,000
20,000
25,000
30,000
35,000
40,000
v2009 v2010 v2011 v2012 v2013 v2014
accumulated
annually
In the end of 2014, 38,5 GWp and over 1,4 million PV power plants in Germanyhttp://www.ise.fraunhofer.de/en/
Germany 5
MW
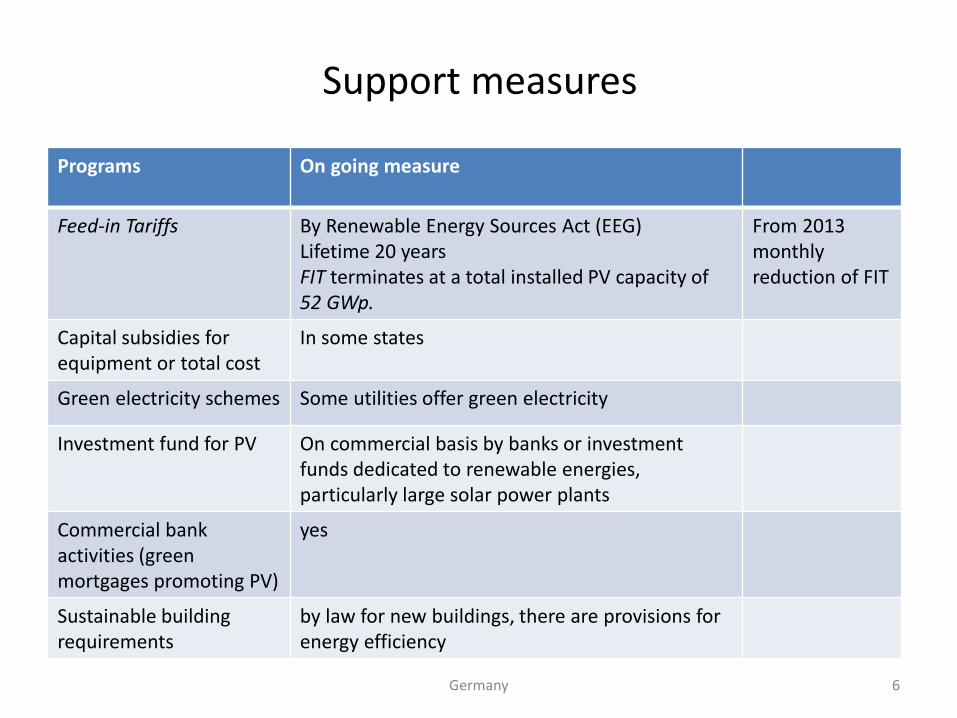
Support measures
Programs On going measure
Feed-in Tariffs By Renewable Energy Sources Act (EEG) Lifetime 20 yearsFIT terminates at a total installed PV capacity of 52 GWp.
From 2013 monthlyreduction of FIT
Capital subsidies for equipment or total cost
In some states
Green electricity schemes Some utilities offer green electricity
Investment fund for PV On commercial basis by banks or investment funds dedicated to renewable energies, particularly large solar power plants
Commercial bank activities (green mortgages promoting PV)
yes
Sustainable buildingrequirements
by law for new buildings, there are provisions for energy efficiency
Germany 6
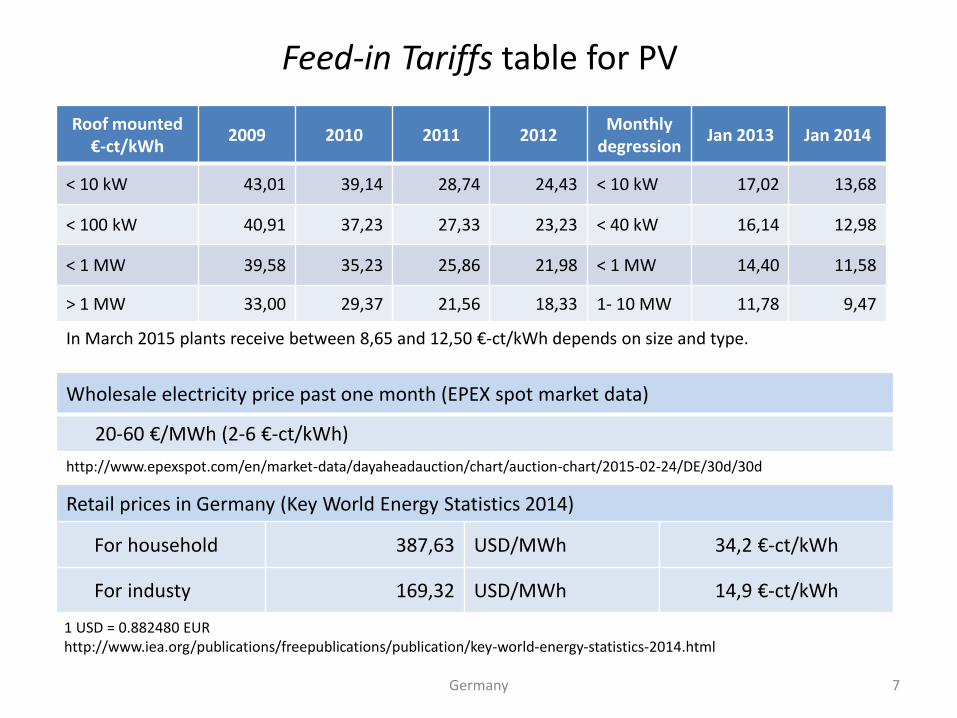
Feed-in Tariffs table for PV
Wholesale electricity price past one month (EPEX spot market data)
20-60 €/MWh (2-6 €-ct/kWh)
http://www.epexspot.com/en/market-data/dayaheadauction/chart/auction-chart/2015-02-24/DE/30d/30d
Retail prices in Germany (Key World Energy Statistics 2014)
For household 387,63 USD/MWh 34,2 €-ct/kWh
For industy 169,32 USD/MWh 14,9 €-ct/kWh
1 USD = 0.882480 EURhttp://www.iea.org/publications/freepublications/publication/key-world-energy-statistics-2014.html
Roof mounted€-ct/kWh
2009 2010 2011 2012Monthly
degressionJan 2013 Jan 2014
< 10 kW 43,01 39,14 28,74 24,43 < 10 kW 17,02 13,68
< 100 kW 40,91 37,23 27,33 23,23 < 40 kW 16,14 12,98
< 1 MW 39,58 35,23 25,86 21,98 < 1 MW 14,40 11,58
> 1 MW 33,00 29,37 21,56 18,33 1- 10 MW 11,78 9,47
In March 2015 plants receive between 8,65 and 12,50 €-ct/kWh depends on size and type.
Germany 7
ITALIASummary ofNational survey report of PV power applications in ITALIA 2013
8
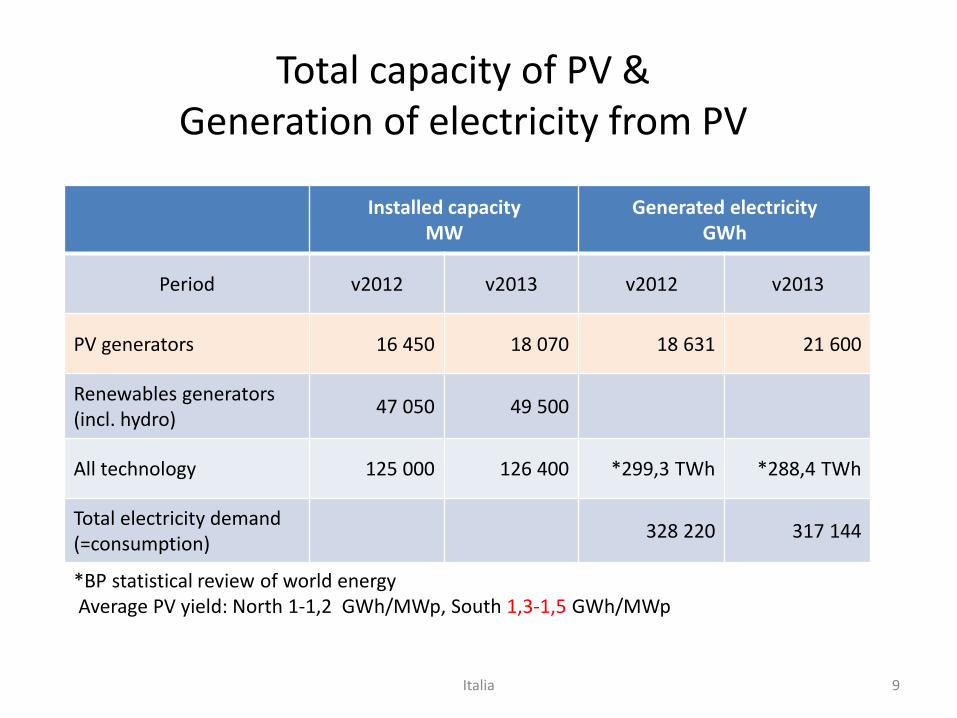
Installed capacityMW
Generated electricityGWh
Period v2012 v2013 v2012 v2013
PV generators 16 450 18 070 18 631 21 600
Renewables generators(incl. hydro)
47 050 49 500
All technology 125 000 126 400 *299,3 TWh *288,4 TWh
Total electricity demand(=consumption)
328 220 317 144
*BP statistical review of world energyAverage PV yield: North 1-1,2 GWh/MWp, South 1,3-1,5 GWh/MWp
Total capacity of PV &Generation of electricity from PV
Italia 9
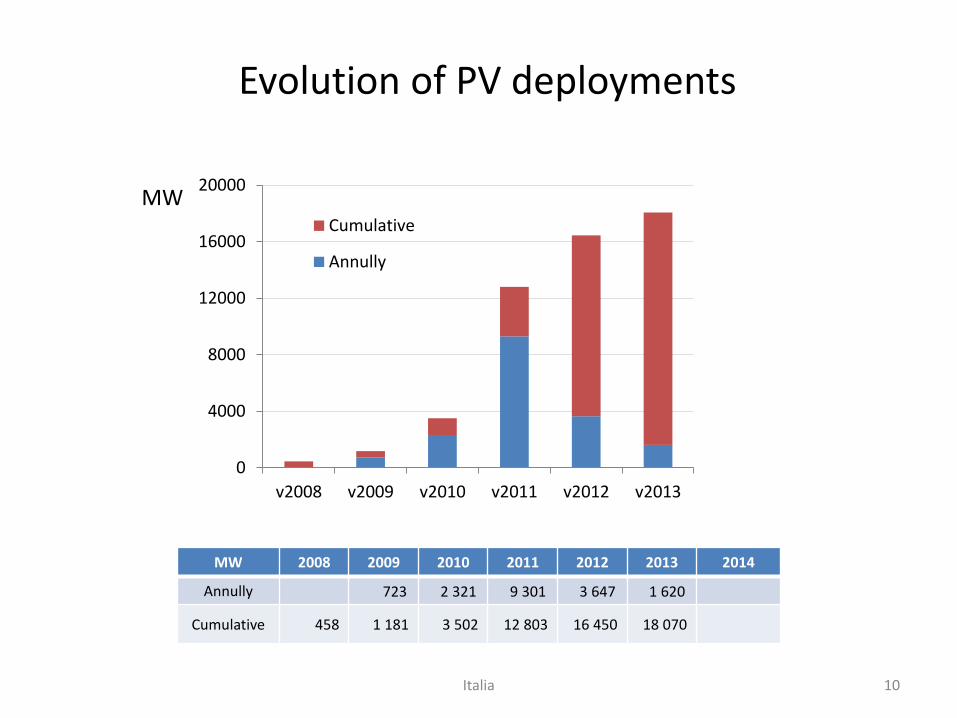
MW 2008 2009 2010 2011 2012 2013 2014
Annully 723 2 321 9 301 3 647 1 620
Cumulative 458 1 181 3 502 12 803 16 450 18 070
Evolution of PV deployments
0
4000
8000
12000
16000
20000
v2008 v2009 v2010 v2011 v2012 v2013
Cumulative
Annully
Italia 10
MW
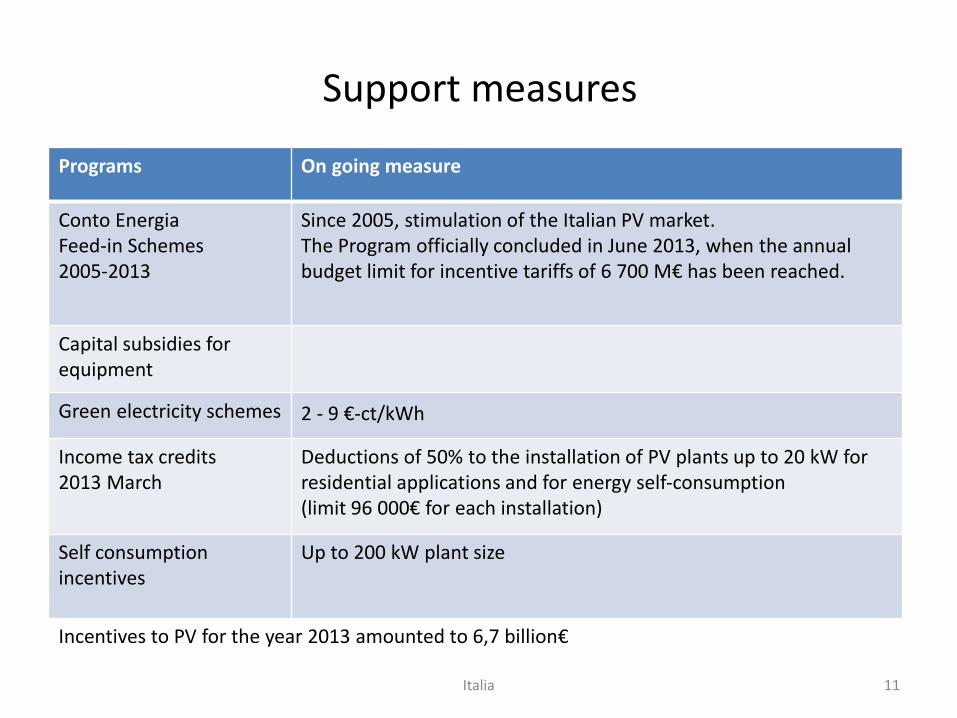
Support measures
Programs On going measure
Conto EnergiaFeed-in Schemes2005-2013
Since 2005, stimulation of the Italian PV market. The Program officially concluded in June 2013, when the annualbudget limit for incentive tariffs of 6 700 M€ has been reached.
Capital subsidies for equipment
Green electricity schemes 2 - 9 €-ct/kWh
Income tax credits2013 March
Deductions of 50% to the installation of PV plants up to 20 kW for residential applications and for energy self-consumption (limit 96 000€ for each installation)
Self consumptionincentives
Up to 200 kW plant size
Incentives to PV for the year 2013 amounted to 6,7 billion€
Italia 11
Conta Energia
• The feed-in scheme is the programme which grants incentives for electricity generated by photovoltaic (PV) plants connected to the grid.
• Italy introduced this support scheme in 2005 (28 July 2005, First feed-in scheme).
• PV plants with a minimum capacity of 1 kW and connected to the grid may benefit from a feed-in tariff, which is based on the electricity produced. The tariff differs depending on the capacity and type of plant and is granted over a period of 20 years.
• The scheme provides a tariff for the electricity produced. The electricity fed into the grid may be purchased by GSE (ritiro dedicato) or economically offset with the value of electricity withdrawn from the grid (net metering - scambio sul posto) service.
• Starting from the first half of 2013 and on, the tariff will be made up of both the incentives and the value of electricity. A specific tariff will be applied to the self-consumed electricity.
http://www.gse.it/en/feedintariff/Pages/default.aspx
Italia 12
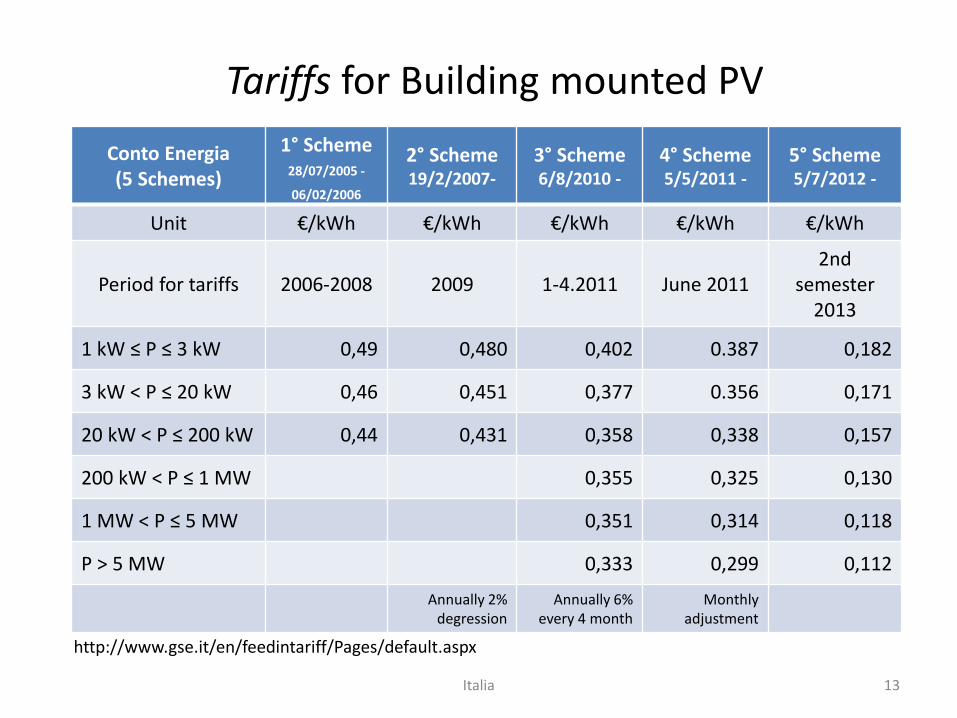
Tariffs for Building mounted PV
Conto Energia(5 Schemes)
1° Scheme28/07/2005 -
06/02/2006
2° Scheme19/2/2007-
3° Scheme6/8/2010 -
4° Scheme5/5/2011 -
5° Scheme5/7/2012 -
Unit €/kWh €/kWh €/kWh €/kWh €/kWh
Period for tariffs 2006-2008 2009 1-4.2011 June 20112nd
semester2013
1 kW ≤ P ≤ 3 kW 0,49 0,480 0,402 0.387 0,182
3 kW < P ≤ 20 kW 0,46 0,451 0,377 0.356 0,171
20 kW < P ≤ 200 kW 0,44 0,431 0,358 0,338 0,157
200 kW < P ≤ 1 MW 0,355 0,325 0,130
1 MW < P ≤ 5 MW 0,351 0,314 0,118
P > 5 MW 0,333 0,299 0,112
Annually 2% degression
Annually 6%every 4 month
Monthlyadjustment
http://www.gse.it/en/feedintariff/Pages/default.aspx
Italia 13
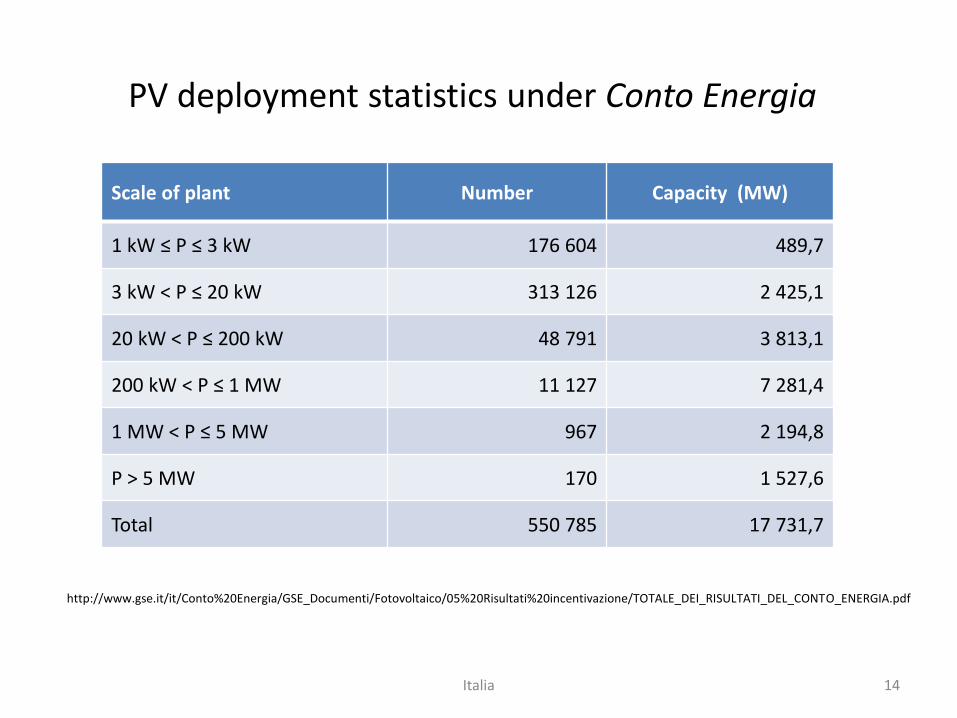
PV deployment statistics under Conto Energia
Scale of plant Number Capacity (MW)
1 kW ≤ P ≤ 3 kW 176 604 489,7
3 kW < P ≤ 20 kW 313 126 2 425,1
20 kW < P ≤ 200 kW 48 791 3 813,1
200 kW < P ≤ 1 MW 11 127 7 281,4
1 MW < P ≤ 5 MW 967 2 194,8
P > 5 MW 170 1 527,6
Total 550 785 17 731,7
http://www.gse.it/it/Conto%20Energia/GSE_Documenti/Fotovoltaico/05%20Risultati%20incentivazione/TOTALE_DEI_RISULTATI_DEL_CONTO_ENERGIA.pdf
Italia 14
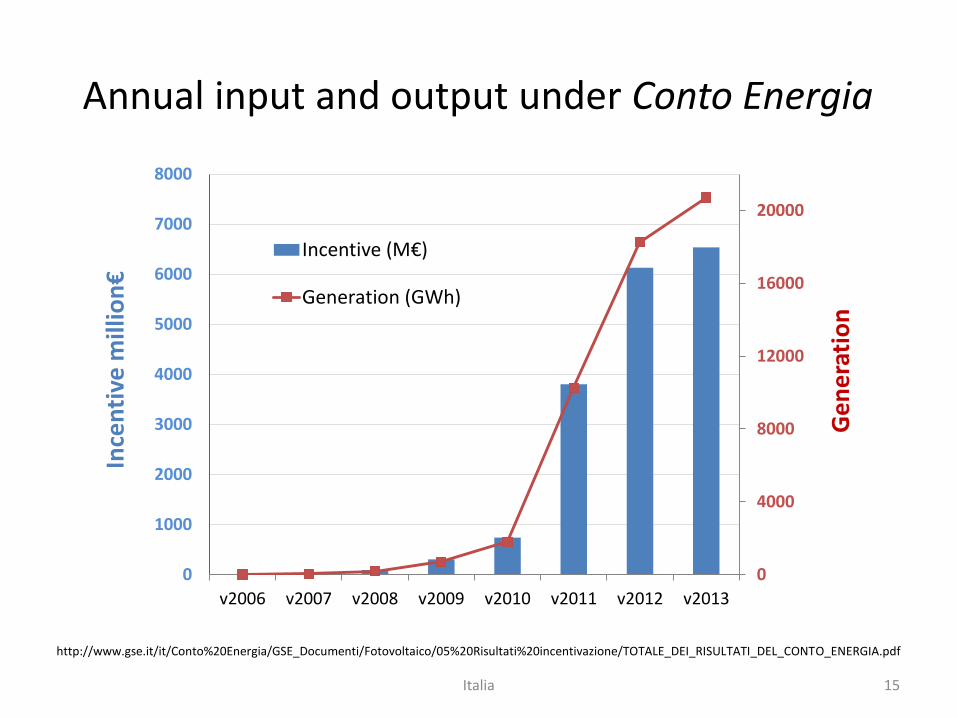
Annual input and output under Conto Energia
0
4000
8000
12000
16000
20000
0
1000
2000
3000
4000
5000
6000
7000
8000
v2006 v2007 v2008 v2009 v2010 v2011 v2012 v2013
Ge
ne
rati
on
Ince
nti
vem
illio
n€
Incentive (M€)
Generation (GWh)
http://www.gse.it/it/Conto%20Energia/GSE_Documenti/Fotovoltaico/05%20Risultati%20incentivazione/TOTALE_DEI_RISULTATI_DEL_CONTO_ENERGIA.pdf
Italia 15
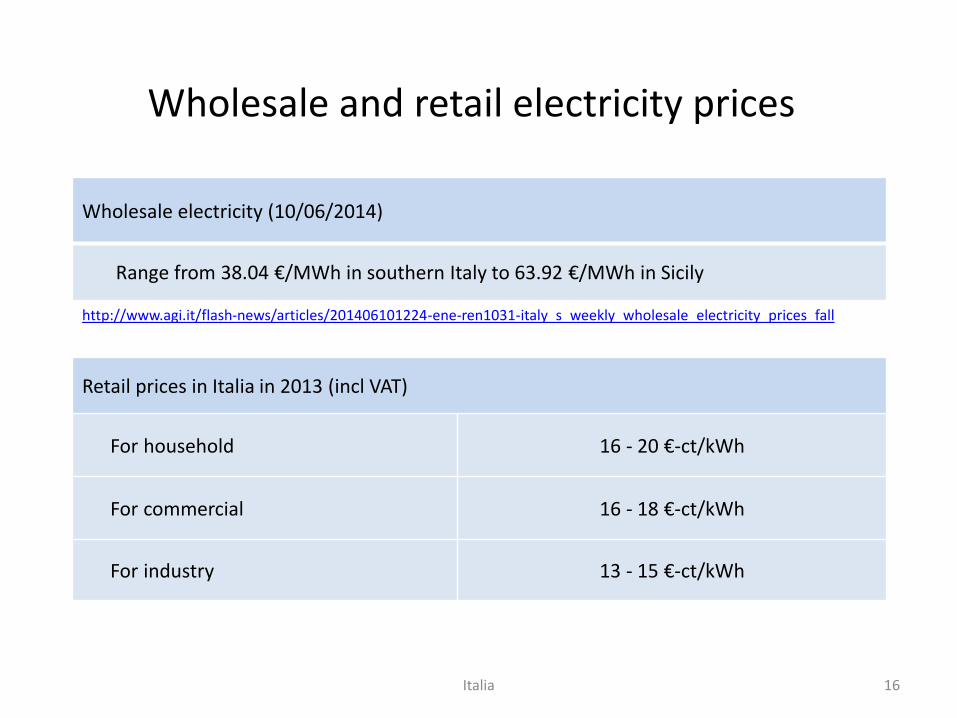
Wholesale and retail electricity prices
Wholesale electricity (10/06/2014)
Range from 38.04 €/MWh in southern Italy to 63.92 €/MWh in Sicily
http://www.agi.it/flash-news/articles/201406101224-ene-ren1031-italy_s_weekly_wholesale_electricity_prices_fall
Retail prices in Italia in 2013 (incl VAT)
For household 16 - 20 €-ct/kWh
For commercial 16 - 18 €-ct/kWh
For industry 13 - 15 €-ct/kWh
Italia 16
FRANCESummary ofNational survey report of PV power applications in FRANCE 2013
17
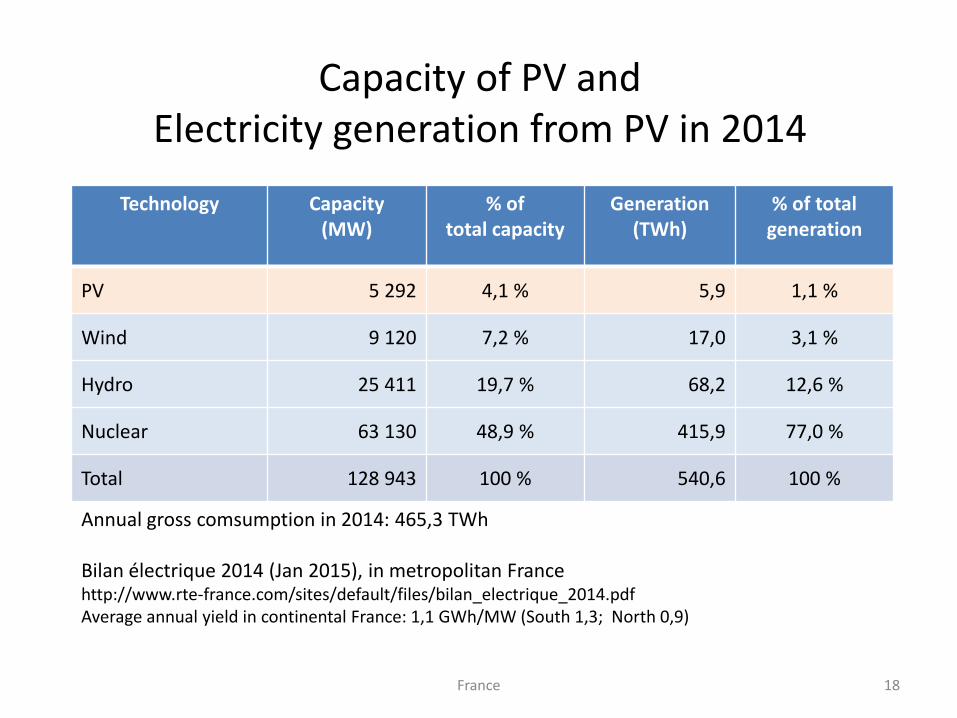
Capacity of PV and Electricity generation from PV in 2014
Technology Capacity(MW)
% oftotal capacity
Generation(TWh)
% of totalgeneration
PV 5 292 4,1 % 5,9 1,1 %
Wind 9 120 7,2 % 17,0 3,1 %
Hydro 25 411 19,7 % 68,2 12,6 %
Nuclear 63 130 48,9 % 415,9 77,0 %
Total 128 943 100 % 540,6 100 %
Annual gross comsumption in 2014: 465,3 TWh
Bilan électrique 2014 (Jan 2015), in metropolitan Francehttp://www.rte-france.com/sites/default/files/bilan_electrique_2014.pdfAverage annual yield in continental France: 1,1 GWh/MW (South 1,3; North 0,9)
France 18

PV deployments statistics in 2014
Scale of plantTotally the end of 2014 Annually during 2014
Number Capacity (MW) Number Capacity (MW)
p ≤ 3 kW 274 358 735 10 658 31
3 < p ≤ 9 kW 40 774 249 12 449 82
9 < p ≤ 36 kW 15 823 392 834 24
36 < p ≤ 100 kW 8 962 696 1 828 156
100 < p ≤ 250 kW 5 258 917 238 47
> 250 kW 1 058 2 642 112 587
Total 346 233 5 631 26 119 927
Tableau de bord éolien-photovoltaïque au quatrième trimestre 2014 (Feb 2015)http://www.statistiques.developpement-durable.gouv.fr/energie-climat/s/energies-renouvelables.htmlIn metropolitan and overseas, preliminary results may be revised following quarters
France 19
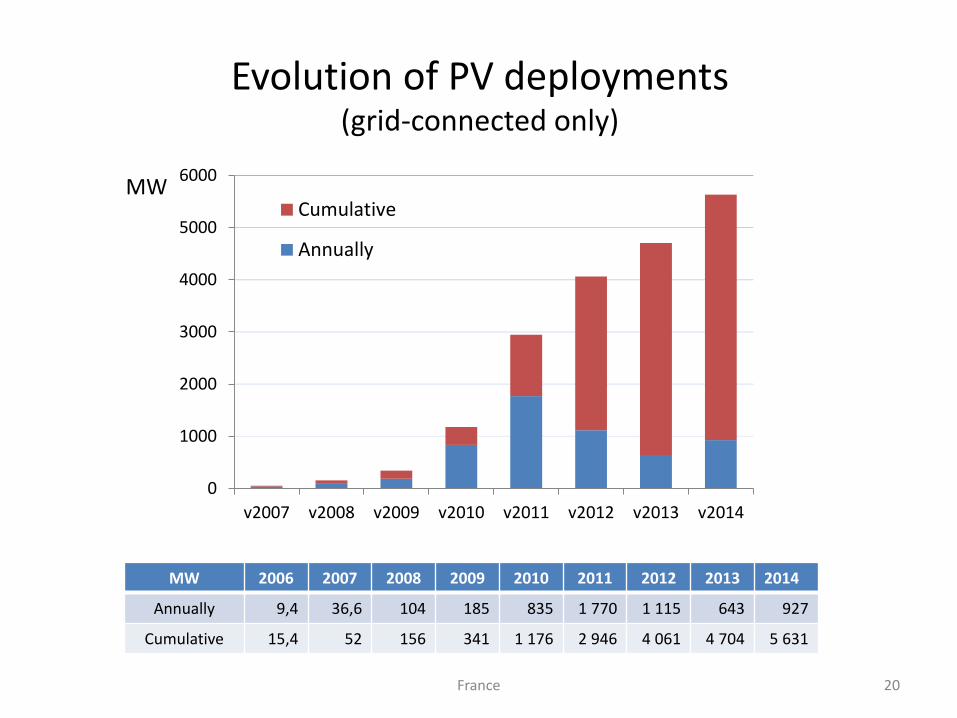
Evolution of PV deployments(grid-connected only)
MW 2006 2007 2008 2009 2010 2011 2012 2013 2014
Annually 9,4 36,6 104 185 835 1 770 1 115 643 927
Cumulative 15,4 52 156 341 1 176 2 946 4 061 4 704 5 631
0
1000
2000
3000
4000
5000
6000
v2007 v2008 v2009 v2010 v2011 v2012 v2013 v2014
Cumulative
Annually
France 20
MW
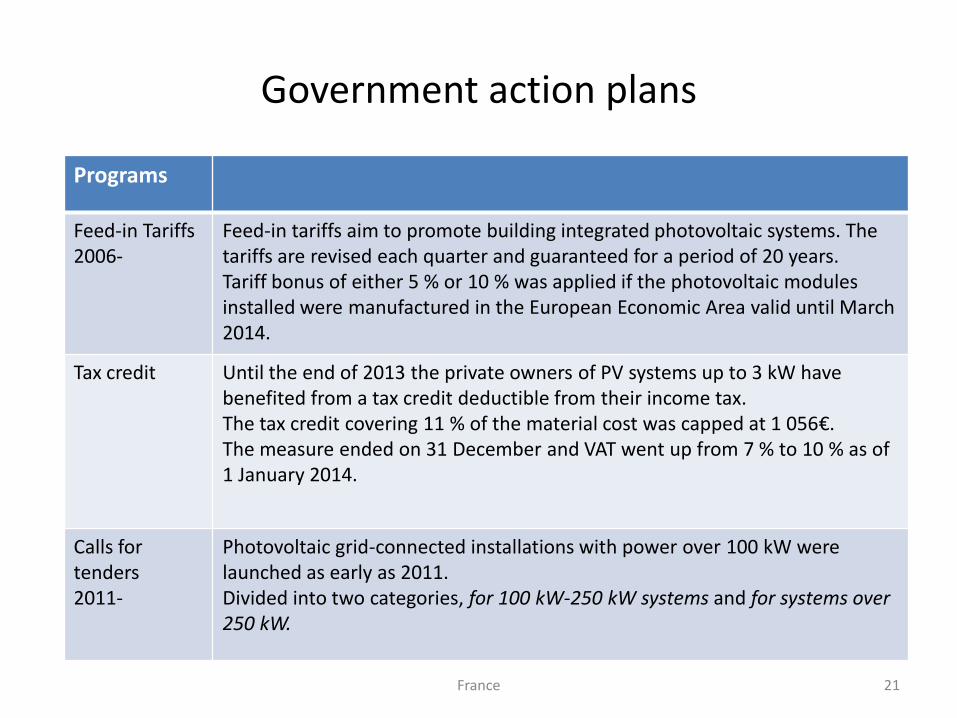
Government action plans
Programs
Feed-in Tariffs2006-
Feed-in tariffs aim to promote building integrated photovoltaic systems. The tariffs are revised each quarter and guaranteed for a period of 20 years. Tariff bonus of either 5 % or 10 % was applied if the photovoltaic modules installed were manufactured in the European Economic Area valid until March 2014.
Tax credit Until the end of 2013 the private owners of PV systems up to 3 kW have benefited from a tax credit deductible from their income tax. The tax credit covering 11 % of the material cost was capped at 1 056€. The measure ended on 31 December and VAT went up from 7 % to 10 % as of 1 January 2014.
Calls for tenders2011-
Photovoltaic grid-connected installations with power over 100 kW were launched as early as 2011.Divided into two categories, for 100 kW-250 kW systems and for systems over250 kW.
France 21
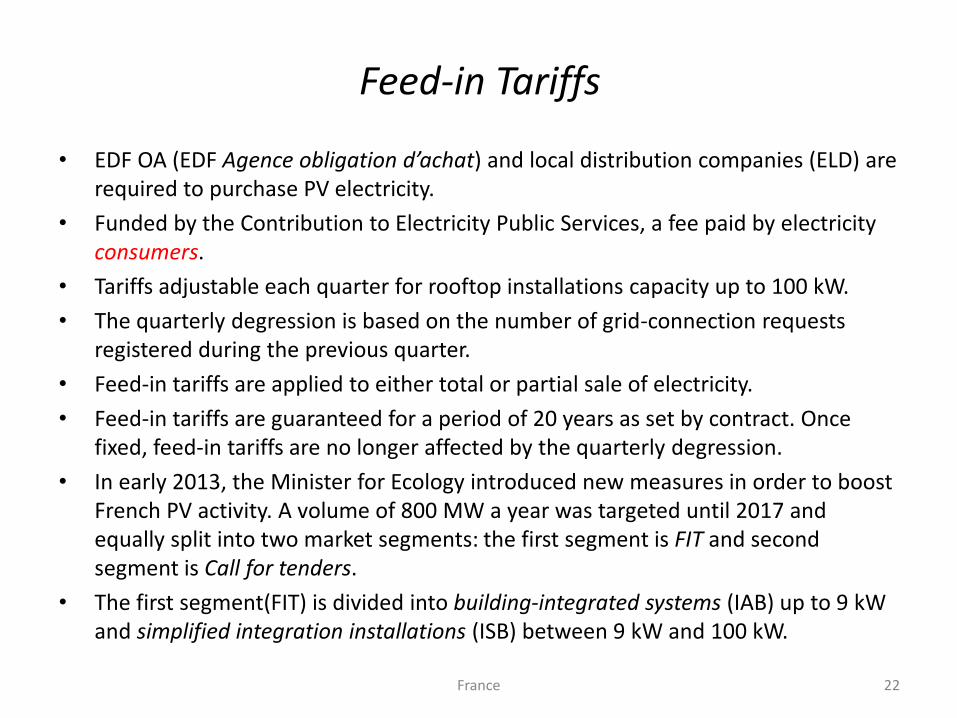
Feed-in Tariffs
• EDF OA (EDF Agence obligation d’achat) and local distribution companies (ELD) are required to purchase PV electricity.
• Funded by the Contribution to Electricity Public Services, a fee paid by electricity consumers.
• Tariffs adjustable each quarter for rooftop installations capacity up to 100 kW.
• The quarterly degression is based on the number of grid-connection requests registered during the previous quarter.
• Feed-in tariffs are applied to either total or partial sale of electricity.
• Feed-in tariffs are guaranteed for a period of 20 years as set by contract. Once fixed, feed-in tariffs are no longer affected by the quarterly degression.
• In early 2013, the Minister for Ecology introduced new measures in order to boost French PV activity. A volume of 800 MW a year was targeted until 2017 and equally split into two market segments: the first segment is FIT and secondsegment is Call for tenders.
• The first segment(FIT) is divided into building-integrated systems (IAB) up to 9 kW and simplified integration installations (ISB) between 9 kW and 100 kW.
France 22
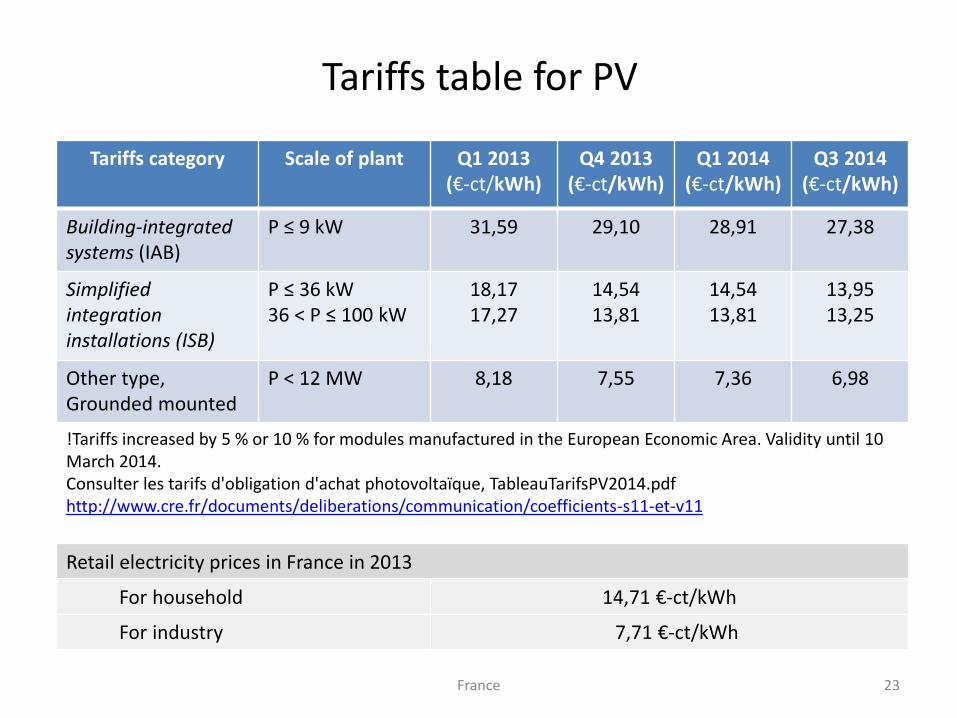
Tariffs table for PV
Tariffs category Scale of plant Q1 2013 (€-ct/kWh)
Q4 2013 (€-ct/kWh)
Q1 2014 (€-ct/kWh)
Q3 2014 (€-ct/kWh)
Building-integrated systems (IAB)
P ≤ 9 kW 31,59 29,10 28,91 27,38
Simplifiedintegrationinstallations (ISB)
P ≤ 36 kW 36 < P ≤ 100 kW
18,17 17,27
14,54 13,81
14,5413,81
13,9513,25
Other type, Grounded mounted
P < 12 MW 8,18 7,55 7,36 6,98
!Tariffs increased by 5 % or 10 % for modules manufactured in the European Economic Area. Validity until 10 March 2014.Consulter les tarifs d'obligation d'achat photovoltaïque, TableauTarifsPV2014.pdfhttp://www.cre.fr/documents/deliberations/communication/coefficients-s11-et-v11
Retail electricity prices in France in 2013
For household 14,71 €-ct/kWh
For industry 7,71 €-ct/kWh
France 23
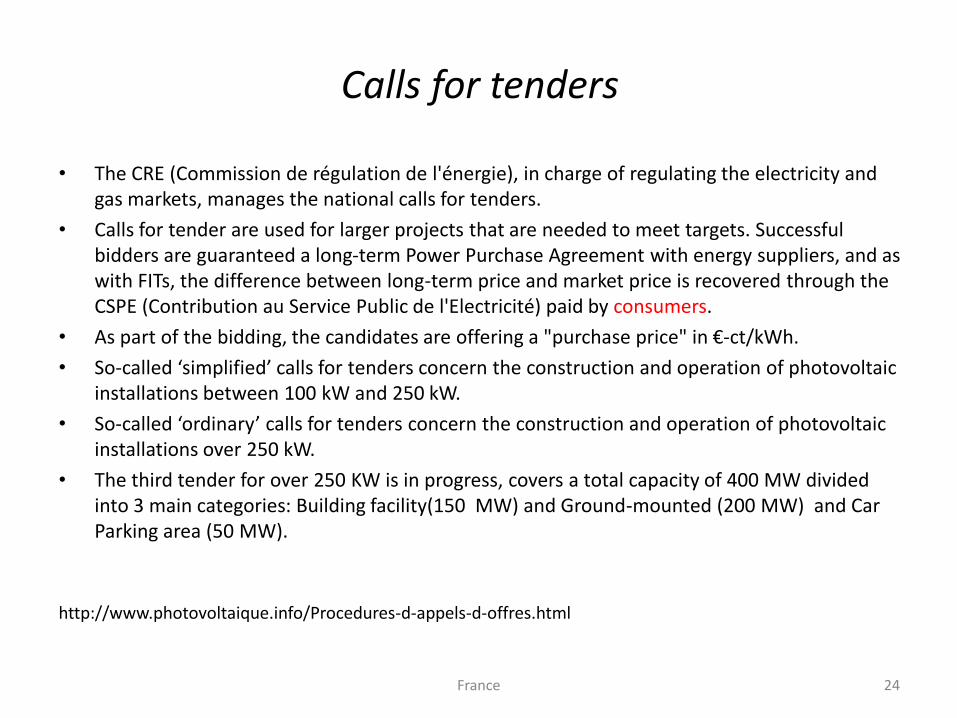
Calls for tenders
• The CRE (Commission de régulation de l'énergie), in charge of regulating the electricity and gas markets, manages the national calls for tenders.
• Calls for tender are used for larger projects that are needed to meet targets. Successful bidders are guaranteed a long-term Power Purchase Agreement with energy suppliers, and as with FITs, the difference between long-term price and market price is recovered through the CSPE (Contribution au Service Public de l'Electricité) paid by consumers.
• As part of the bidding, the candidates are offering a "purchase price" in €-ct/kWh.
• So-called ‘simplified’ calls for tenders concern the construction and operation of photovoltaic installations between 100 kW and 250 kW.
• So-called ‘ordinary’ calls for tenders concern the construction and operation of photovoltaic installations over 250 kW.
• The third tender for over 250 KW is in progress, covers a total capacity of 400 MW divided into 3 main categories: Building facility(150 MW) and Ground-mounted (200 MW) and Car Parking area (50 MW).
http://www.photovoltaique.info/Procedures-d-appels-d-offres.html
France 24
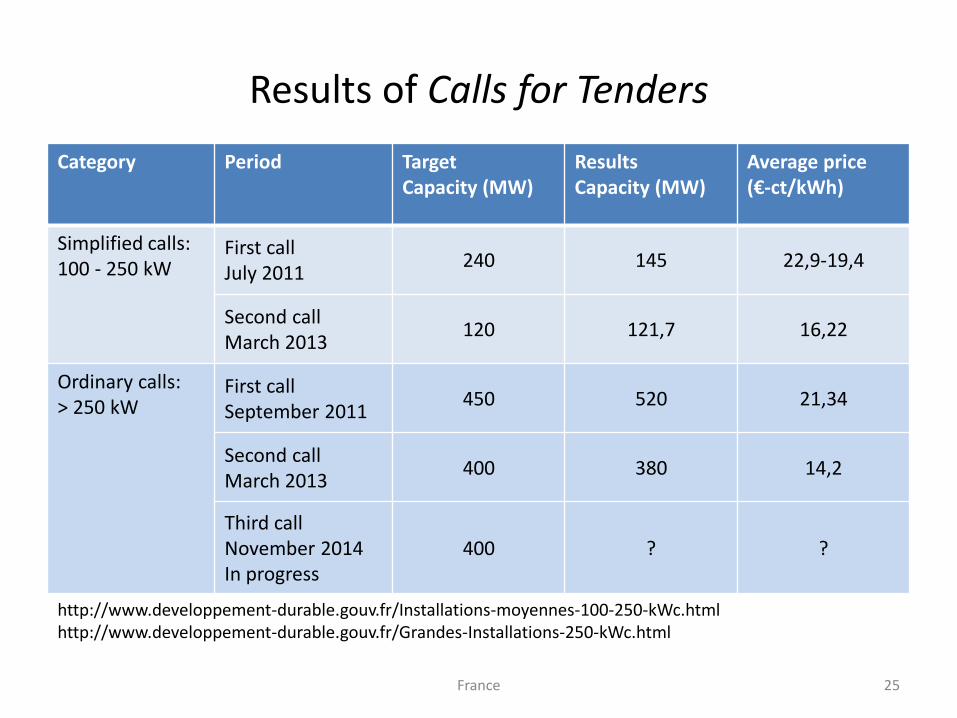
Results of Calls for Tenders
Category Period Target Capacity (MW)
ResultsCapacity (MW)
Average price(€-ct/kWh)
Simplified calls:100 - 250 kW
First callJuly 2011
240 145 22,9-19,4
Second callMarch 2013
120 121,7 16,22
Ordinary calls: > 250 kW
First callSeptember 2011
450 520 21,34
Second callMarch 2013
400 380 14,2
Third callNovember 2014In progress
400 ? ?
http://www.developpement-durable.gouv.fr/Installations-moyennes-100-250-kWc.htmlhttp://www.developpement-durable.gouv.fr/Grandes-Installations-250-kWc.html
France 25
SPAINSummary ofNational survey report of PV power applications in SPAIN 2013
26
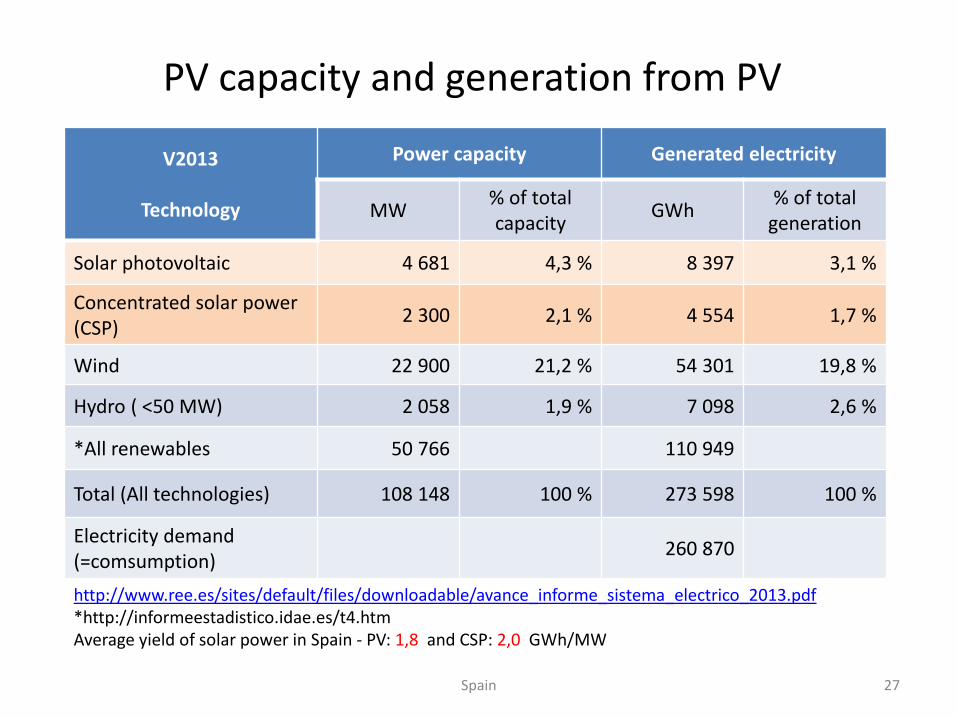
PV capacity and generation from PV
V2013
Technology
Power capacity Generated electricity
MW% of totalcapacity
GWh% of total
generation
Solar photovoltaic 4 681 4,3 % 8 397 3,1 %
Concentrated solar power(CSP)
2 300 2,1 % 4 554 1,7 %
Wind 22 900 21,2 % 54 301 19,8 %
Hydro ( <50 MW) 2 058 1,9 % 7 098 2,6 %
*All renewables 50 766 110 949
Total (All technologies) 108 148 100 % 273 598 100 %
Electricity demand(=comsumption)
260 870
http://www.ree.es/sites/default/files/downloadable/avance_informe_sistema_electrico_2013.pdf*http://informeestadistico.idae.es/t4.htmAverage yield of solar power in Spain - PV: 1,8 and CSP: 2,0 GWh/MW
Spain 27
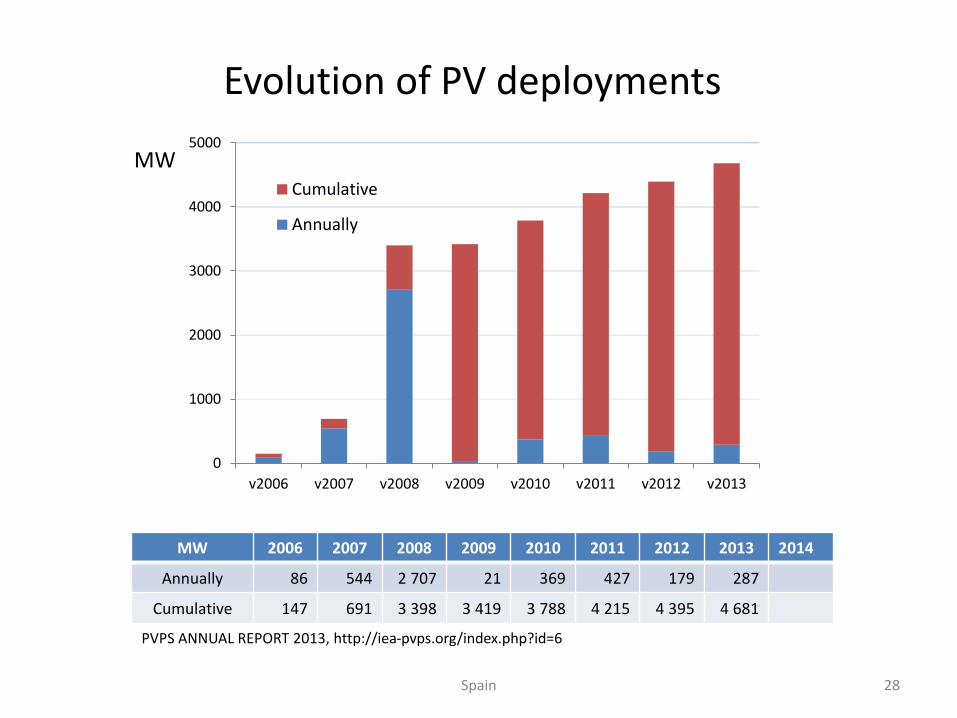
Evolution of PV deployments
MW 2006 2007 2008 2009 2010 2011 2012 2013 2014
Annually 86 544 2 707 21 369 427 179 287
Cumulative 147 691 3 398 3 419 3 788 4 215 4 395 4 681
PVPS ANNUAL REPORT 2013, http://iea-pvps.org/index.php?id=6
0
1000
2000
3000
4000
5000
v2006 v2007 v2008 v2009 v2010 v2011 v2012 v2013
Cumulative
Annually
Spain 28
MW
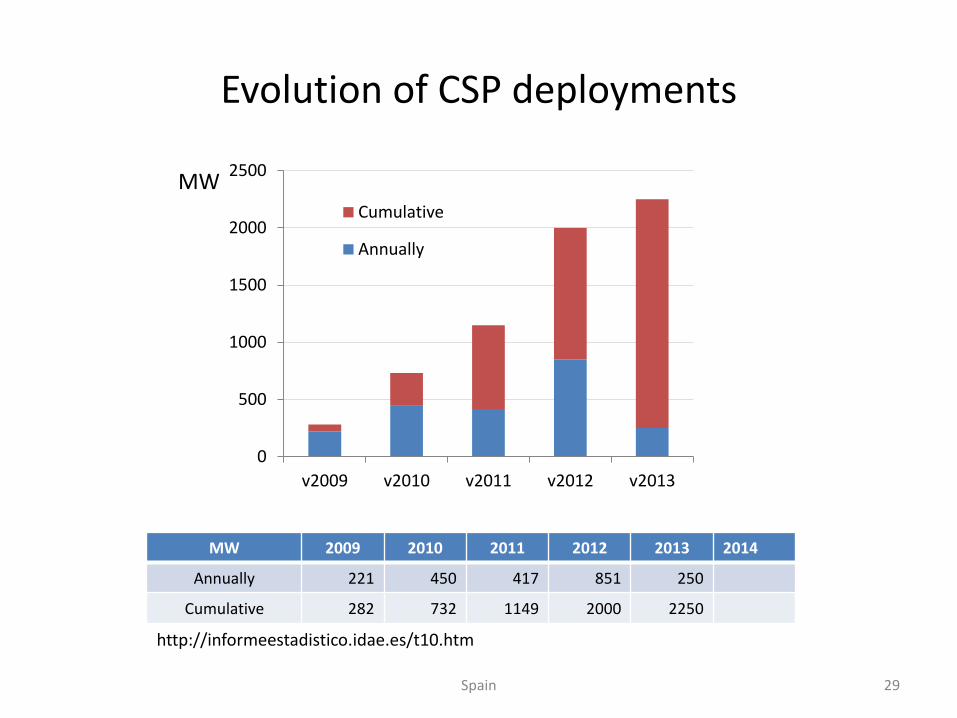
Evolution of CSP deployments
MW 2009 2010 2011 2012 2013 2014
Annually 221 450 417 851 250
Cumulative 282 732 1149 2000 2250
http://informeestadistico.idae.es/t10.htm
0
500
1000
1500
2000
2500
v2009 v2010 v2011 v2012 v2013
Cumulative
Annually
Spain 29
MW
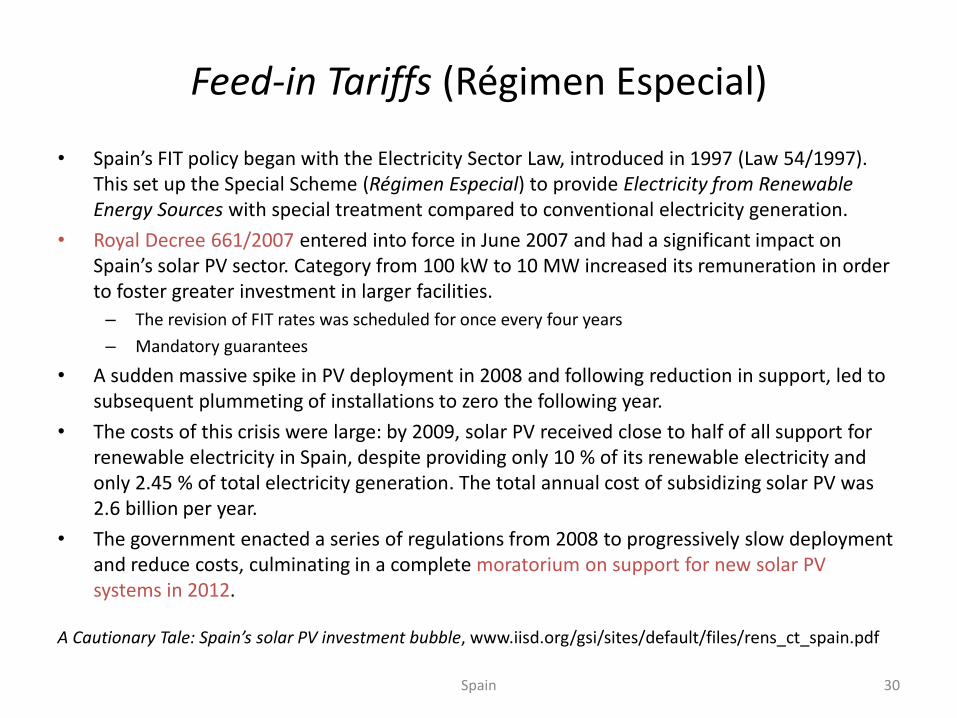
Feed-in Tariffs (Régimen Especial)
• Spain’s FIT policy began with the Electricity Sector Law, introduced in 1997 (Law 54/1997). This set up the Special Scheme (Régimen Especial) to provide Electricity from Renewable Energy Sources with special treatment compared to conventional electricity generation.
• Royal Decree 661/2007 entered into force in June 2007 and had a significant impact on Spain’s solar PV sector. Category from 100 kW to 10 MW increased its remuneration in order to foster greater investment in larger facilities.
– The revision of FIT rates was scheduled for once every four years
– Mandatory guarantees
• A sudden massive spike in PV deployment in 2008 and following reduction in support, led to subsequent plummeting of installations to zero the following year.
• The costs of this crisis were large: by 2009, solar PV received close to half of all support for renewable electricity in Spain, despite providing only 10 % of its renewable electricity and only 2.45 % of total electricity generation. The total annual cost of subsidizing solar PV was 2.6 billion per year.
• The government enacted a series of regulations from 2008 to progressively slow deployment and reduce costs, culminating in a complete moratorium on support for new solar PV systems in 2012.
A Cautionary Tale: Spain’s solar PV investment bubble, www.iisd.org/gsi/sites/default/files/rens_ct_spain.pdf
Spain 30
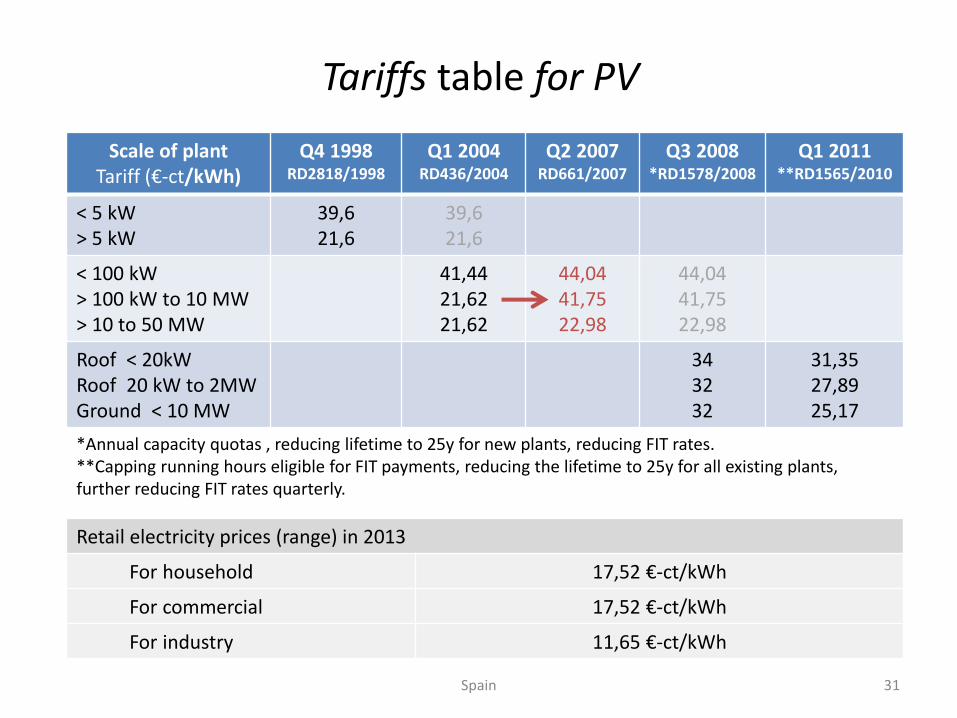
Tariffs table for PV
Scale of plantTariff (€-ct/kWh)
Q4 1998RD2818/1998
Q1 2004RD436/2004
Q2 2007 RD661/2007
Q3 2008*RD1578/2008
Q1 2011 **RD1565/2010
< 5 kW> 5 kW
39,621,6
39,621,6
< 100 kW > 100 kW to 10 MW> 10 to 50 MW
41,4421,6221,62
44,0441,7522,98
44,0441,7522,98
Roof < 20kWRoof 20 kW to 2MWGround < 10 MW
343232
31,3527,8925,17
*Annual capacity quotas , reducing lifetime to 25y for new plants, reducing FIT rates.**Capping running hours eligible for FIT payments, reducing the lifetime to 25y for all existing plants, further reducing FIT rates quarterly.
Retail electricity prices (range) in 2013
For household 17,52 €-ct/kWh
For commercial 17,52 €-ct/kWh
For industry 11,65 €-ct/kWh
Spain 31
No subsidy, no feed-in tariff
Unsubsidized solar power gives it a go in Spain• The plant, developed by independent renewable company Enerpro, is located in
the Southern Spain province of Seville. Step by step, the company is building the solar arrays, that follow the sun's move from east to west every day. The first megawatt is already plugged in, and the company is working to complete the 2.5 MW of the plant at their 6 hectare field. They plan to connect 12 MW in different plants this year, and to start with plants 300 MW in size next year. All at pool prices, because the total cost of their electricity, including investment and O&M, makes it the cheapest in the pool, Enerpro says.
• Enerpro is the first, but not the only one. Last year the Spanish electricity transmission system operator (Red Electrica de España), had received close to 200 applications for more than 40,000 MW of PV plants to connect to the Spanish grids. All those plants are waiting for procedural green light to access the grid, while their investors are valuing the fact that electricity from new PV plants can now compete in the market without any support system to make the investment profitable.
http://www.greenpeace.org.uk/newsdesk/energy/analysis/subsidy-free-solar-takes-spain#comments, Feb 2014
Spain 32
BELGIUMSummary ofNational survey report of PV power applications in BELGIUM 2013
33
Belgium 34
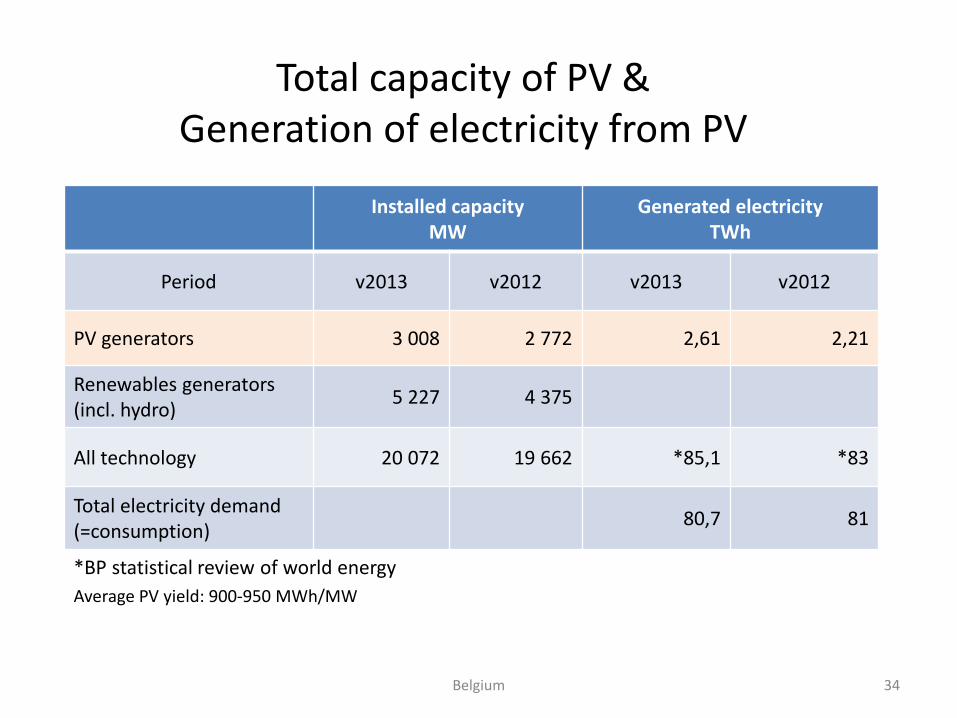
Installed capacityMW
Generated electricityTWh
Period v2013 v2012 v2013 v2012
PV generators 3 008 2 772 2,61 2,21
Renewables generators(incl. hydro)
5 227 4 375
All technology 20 072 19 662 *85,1 *83
Total electricity demand(=consumption)
80,7 81
*BP statistical review of world energy
Average PV yield: 900-950 MWh/MW
Total capacity of PV &Generation of electricity from PV
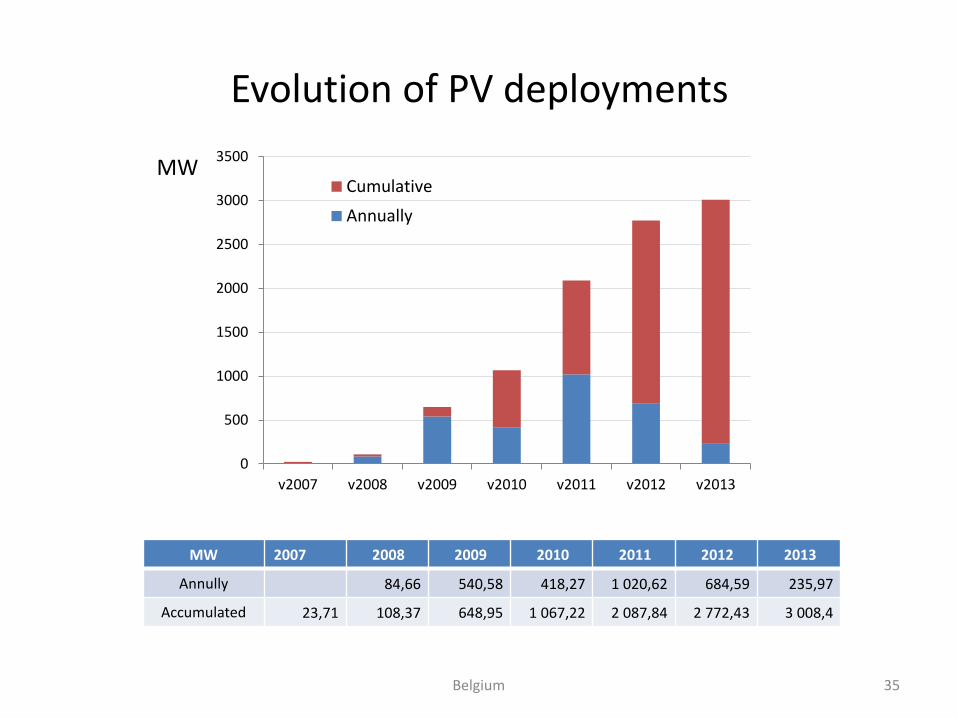
Evolution of PV deployments
MW 2007 2008 2009 2010 2011 2012 2013
Annully 84,66 540,58 418,27 1 020,62 684,59 235,97
Accumulated 23,71 108,37 648,95 1 067,22 2 087,84 2 772,43 3 008,4
Belgium 35
0
500
1000
1500
2000
2500
3000
3500
v2007 v2008 v2009 v2010 v2011 v2012 v2013
Cumulative
Annually
MW
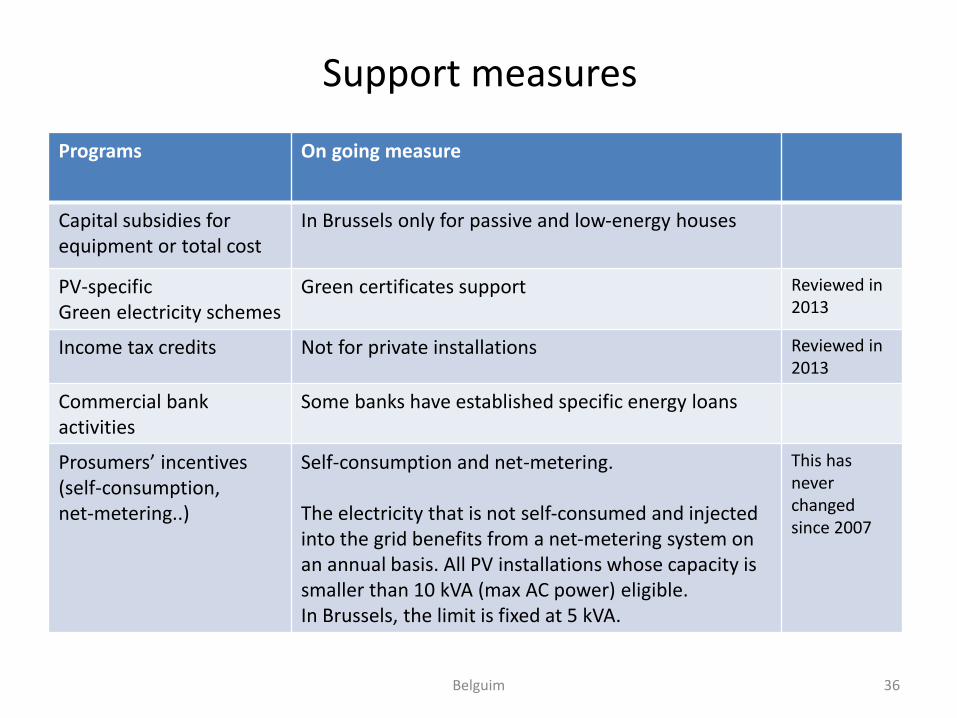
Support measures
Programs On going measure
Capital subsidies for equipment or total cost
In Brussels only for passive and low-energy houses
PV-specificGreen electricity schemes
Green certificates support Reviewed in 2013
Income tax credits Not for private installations Reviewed in 2013
Commercial bank activities
Some banks have established specific energy loans
Prosumers’ incentives(self-consumption, net-metering..)
Self-consumption and net-metering.
The electricity that is not self-consumed and injected into the grid benefits from a net-metering system on an annual basis. All PV installations whose capacity is smaller than 10 kVA (max AC power) eligible. In Brussels, the limit is fixed at 5 kVA.
This has never changed since 2007
Belguim 36
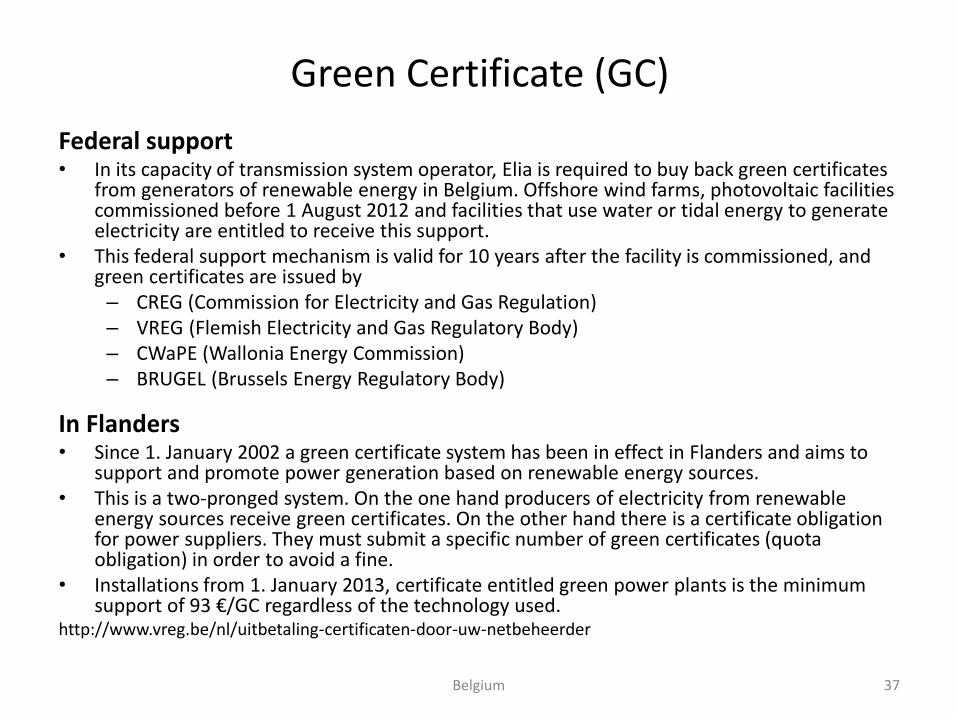
Green Certificate (GC)
Federal support• In its capacity of transmission system operator, Elia is required to buy back green certificates
from generators of renewable energy in Belgium. Offshore wind farms, photovoltaic facilities commissioned before 1 August 2012 and facilities that use water or tidal energy to generate electricity are entitled to receive this support.
• This federal support mechanism is valid for 10 years after the facility is commissioned, and green certificates are issued by – CREG (Commission for Electricity and Gas Regulation)– VREG (Flemish Electricity and Gas Regulatory Body)– CWaPE (Wallonia Energy Commission) – BRUGEL (Brussels Energy Regulatory Body)
In Flanders• Since 1. January 2002 a green certificate system has been in effect in Flanders and aims to
support and promote power generation based on renewable energy sources.• This is a two-pronged system. On the one hand producers of electricity from renewable
energy sources receive green certificates. On the other hand there is a certificate obligation for power suppliers. They must submit a specific number of green certificates (quota obligation) in order to avoid a fine.
• Installations from 1. January 2013, certificate entitled green power plants is the minimum support of 93 €/GC regardless of the technology used.
http://www.vreg.be/nl/uitbetaling-certificaten-door-uw-netbeheerder
Belgium 37
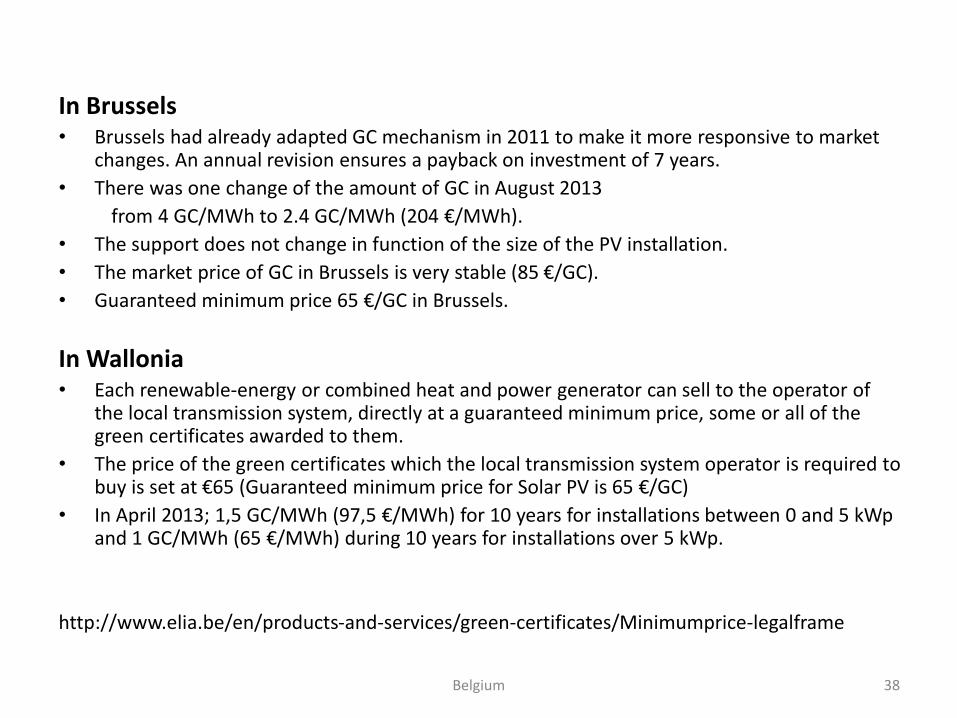
In Brussels• Brussels had already adapted GC mechanism in 2011 to make it more responsive to market
changes. An annual revision ensures a payback on investment of 7 years.
• There was one change of the amount of GC in August 2013
from 4 GC/MWh to 2.4 GC/MWh (204 €/MWh).
• The support does not change in function of the size of the PV installation.
• The market price of GC in Brussels is very stable (85 €/GC).
• Guaranteed minimum price 65 €/GC in Brussels.
In Wallonia• Each renewable-energy or combined heat and power generator can sell to the operator of
the local transmission system, directly at a guaranteed minimum price, some or all of the green certificates awarded to them.
• The price of the green certificates which the local transmission system operator is required to buy is set at €65 (Guaranteed minimum price for Solar PV is 65 €/GC)
• In April 2013; 1,5 GC/MWh (97,5 €/MWh) for 10 years for installations between 0 and 5 kWpand 1 GC/MWh (65 €/MWh) during 10 years for installations over 5 kWp.
http://www.elia.be/en/products-and-services/green-certificates/Minimumprice-legalframe
Belgium 38
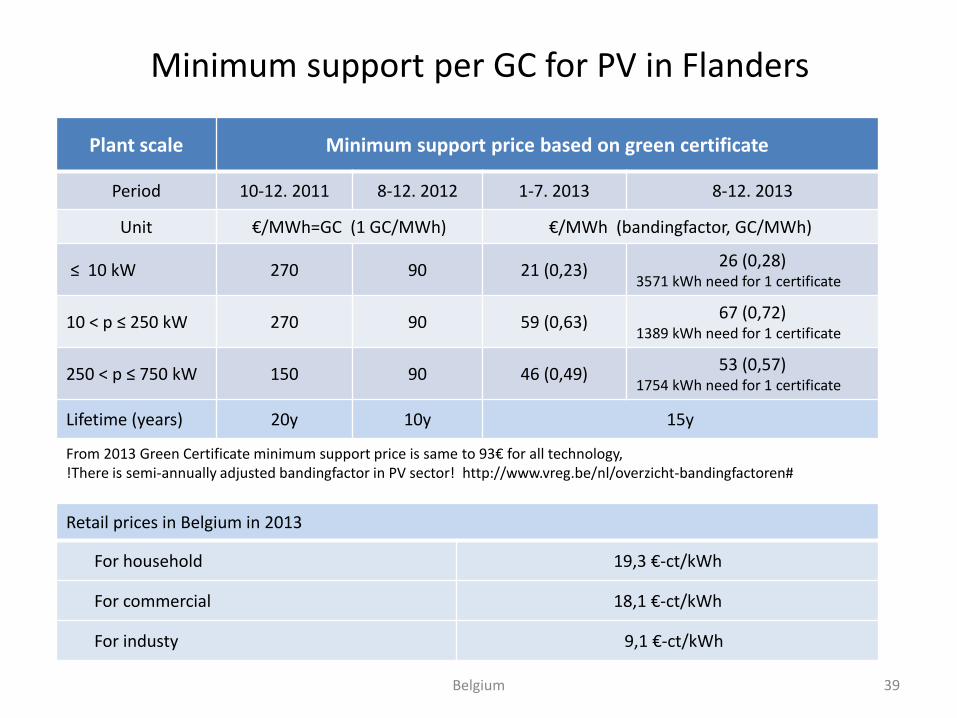
Minimum support per GC for PV in Flanders
Retail prices in Belgium in 2013
For household 19,3 €-ct/kWh
For commercial 18,1 €-ct/kWh
For industy 9,1 €-ct/kWh
Plant scale Minimum support price based on green certificate
Period 10-12. 2011 8-12. 2012 1-7. 2013 8-12. 2013
Unit €/MWh=GC (1 GC/MWh) €/MWh (bandingfactor, GC/MWh)
≤ 10 kW 270 90 21 (0,23)26 (0,28)
3571 kWh need for 1 certificate
10 < p ≤ 250 kW 270 90 59 (0,63)67 (0,72)
1389 kWh need for 1 certificate
250 < p ≤ 750 kW 150 90 46 (0,49)53 (0,57)
1754 kWh need for 1 certificate
Lifetime (years) 20y 10y 15y
From 2013 Green Certificate minimum support price is same to 93€ for all technology, !There is semi-annually adjusted bandingfactor in PV sector! http://www.vreg.be/nl/overzicht-bandingfactoren#
Belgium 39
Useful links
• National Survey Reports, IEA-PVPS Annual Report: http://iea-pvps.org/index.php?id=93
• http://www.ise.fraunhofer.de/en/
• http://www.erneuerbare-energien.de/SiteGlobals/EE/Forms/Listen/Publikationen/Publikationen_Formular.html?oneOfTheseWords=Suchbegriff+eingeben
• http://www.gse.it/en/feedintariff/Pages/default.aspx
• http://www.gse.it/it/Conto%20Energia/GSE_Documenti/Fotovoltaico/05%20Risultati%20incentivazione/TOTALE_DEI_RISULTATI_DEL_CONTO_ENERGIA.pdf
• http://www.rte-france.com/sites/default/files/bilan_electrique_2014.pdf
• http://www.statistiques.developpement-durable.gouv.fr/energie-climat/s/energies-renouvelables.html
• http://www.cre.fr/documents/deliberations/communication/coefficients-s11-et-v11
• http://www.developpement-durable.gouv.fr/Quel-est-le-dispositif-de-soutien.html
• http://informeestadistico.idae.es/t10.htm
• http://www.ree.es/sites/default/files/downloadable/avance_informe_sistema_electrico_2013.pdf
• http://www.elia.be/en/products-and-services/green-certificates/Minimumprice-legalframe
• http://www.vreg.be/nl/overzicht-bandingfactoren#
• Country map images taken from http://europa.eu/about-eu/countries/index_en.htm
Link 40