Embed Size (px)
Citation preview
E-COMMERCEINDUSTRY REPORT
JUNE 2016
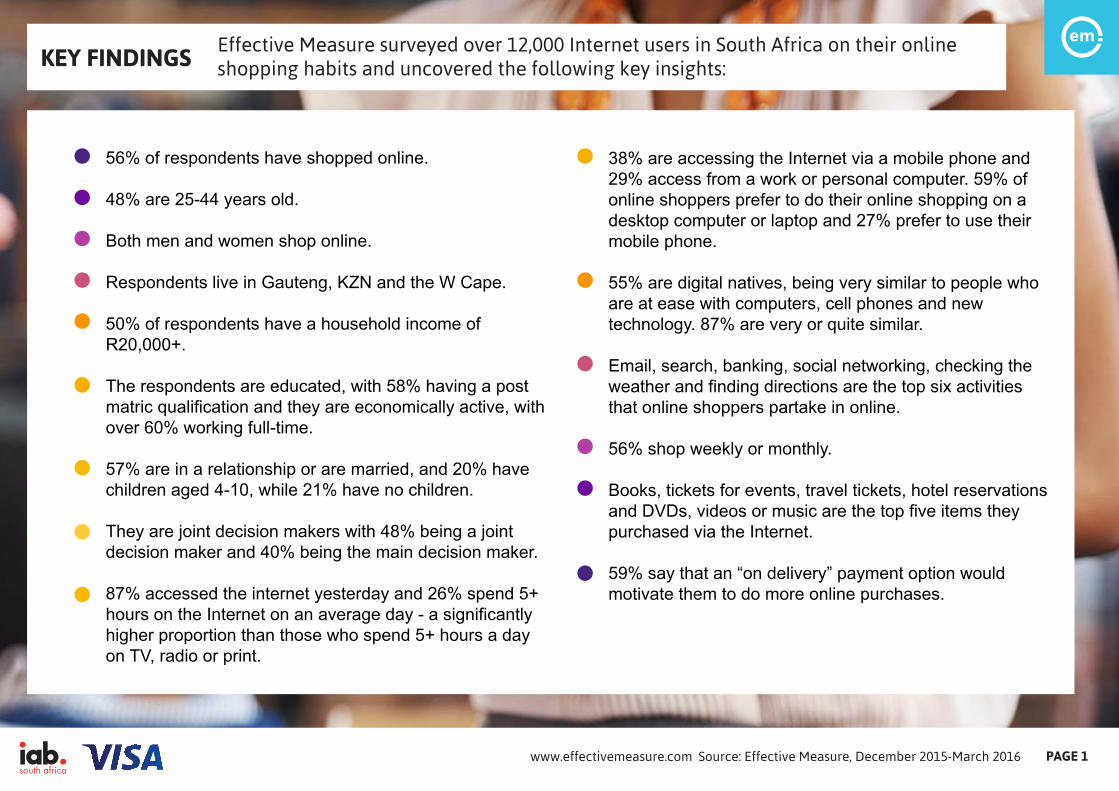
KEY FINDINGS E�ective Measure surveyed over 12,000 Internet users in South Africa on their onlineshopping habits and uncovered the following key insights:
56% of respondents have shopped online.
48% are 25-44 years old.
Both men and women shop online.
Respondents live in Gauteng, KZN and the W Cape.
50% of respondents have a household income of R20,000+.
The respondents are educated, with 58% having a post matric qualification and they are economically active, with over 60% working full-time.
57% are in a relationship or are married, and 20% have children aged 4-10, while 21% have no children.
They are joint decision makers with 48% being a joint decision maker and 40% being the main decision maker.
87% accessed the internet yesterday and 26% spend 5+ hours on the Internet on an average day - a significantly higher proportion than those who spend 5+ hours a day on TV, radio or print.
38% are accessing the Internet via a mobile phone and 29% access from a work or personal computer. 59% of online shoppers prefer to do their online shopping on a desktop computer or laptop and 27% prefer to use their mobile phone.
55% are digital natives, being very similar to people who are at ease with computers, cell phones and newtechnology. 87% are very or quite similar.
Email, search, banking, social networking, checking the weather and finding directions are the top six activities that online shoppers partake in online.
56% shop weekly or monthly.
Books, tickets for events, travel tickets, hotel reservations and DVDs, videos or music are the top five items they purchased via the Internet.
59% say that an “on delivery” payment option wouldmotivate them to do more online purchases.
Source: E�ective Measure, December 2015-March 2016 www.e�ectivemeasure.com PAGE 1
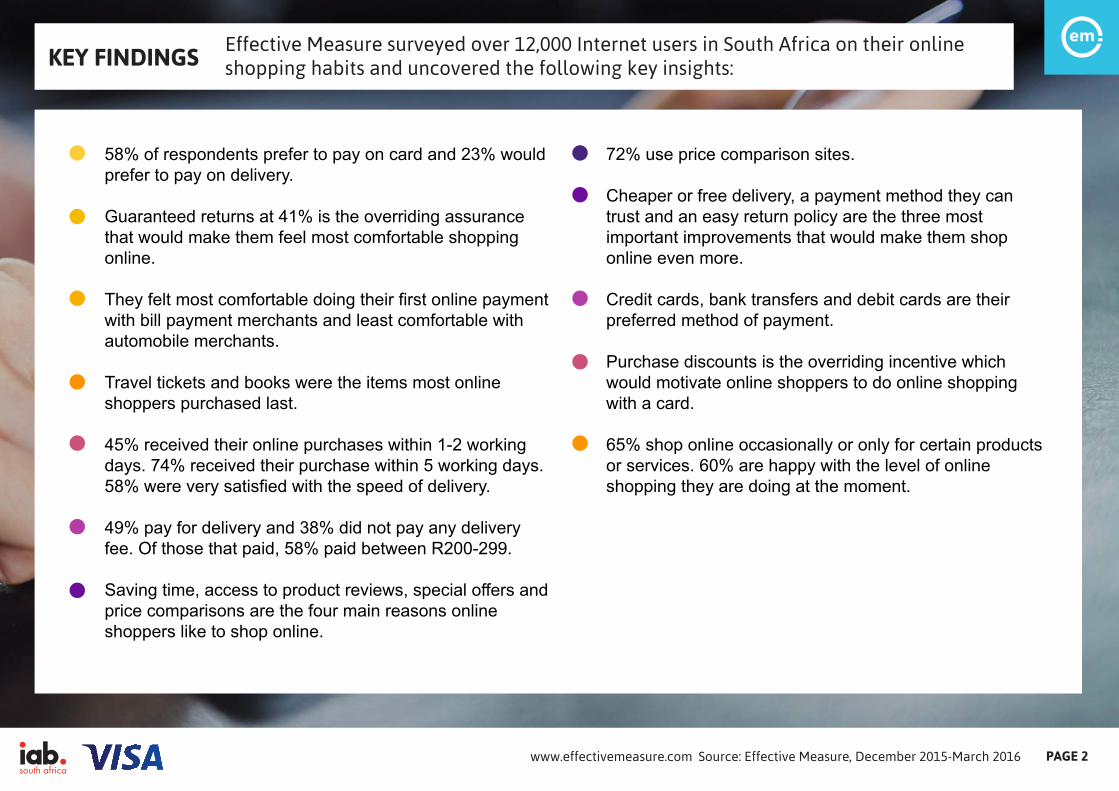
KEY FINDINGS E�ective Measure surveyed over 12,000 Internet users in South Africa on their onlineshopping habits and uncovered the following key insights:
58% of respondents prefer to pay on card and 23% would prefer to pay on delivery.
Guaranteed returns at 41% is the overriding assurance that would make them feel most comfortable shopping online.
They felt most comfortable doing their first online payment with bill payment merchants and least comfortable with automobile merchants.
Travel tickets and books were the items most onlineshoppers purchased last.
45% received their online purchases within 1-2 working days. 74% received their purchase within 5 working days. 58% were very satisfied with the speed of delivery.
49% pay for delivery and 38% did not pay any delivery fee. Of those that paid, 58% paid between R200-299.
Saving time, access to product reviews, special offers and price comparisons are the four main reasons onlineshoppers like to shop online.
72% use price comparison sites.
Cheaper or free delivery, a payment method they can trust and an easy return policy are the three mostimportant improvements that would make them shop online even more.
Credit cards, bank transfers and debit cards are their preferred method of payment.
Purchase discounts is the overriding incentive which would motivate online shoppers to do online shopping with a card.
65% shop online occasionally or only for certain products or services. 60% are happy with the level of onlineshopping they are doing at the moment.
Source: E�ective Measure, December 2015-March 2016 www.e�ectivemeasure.com PAGE 2
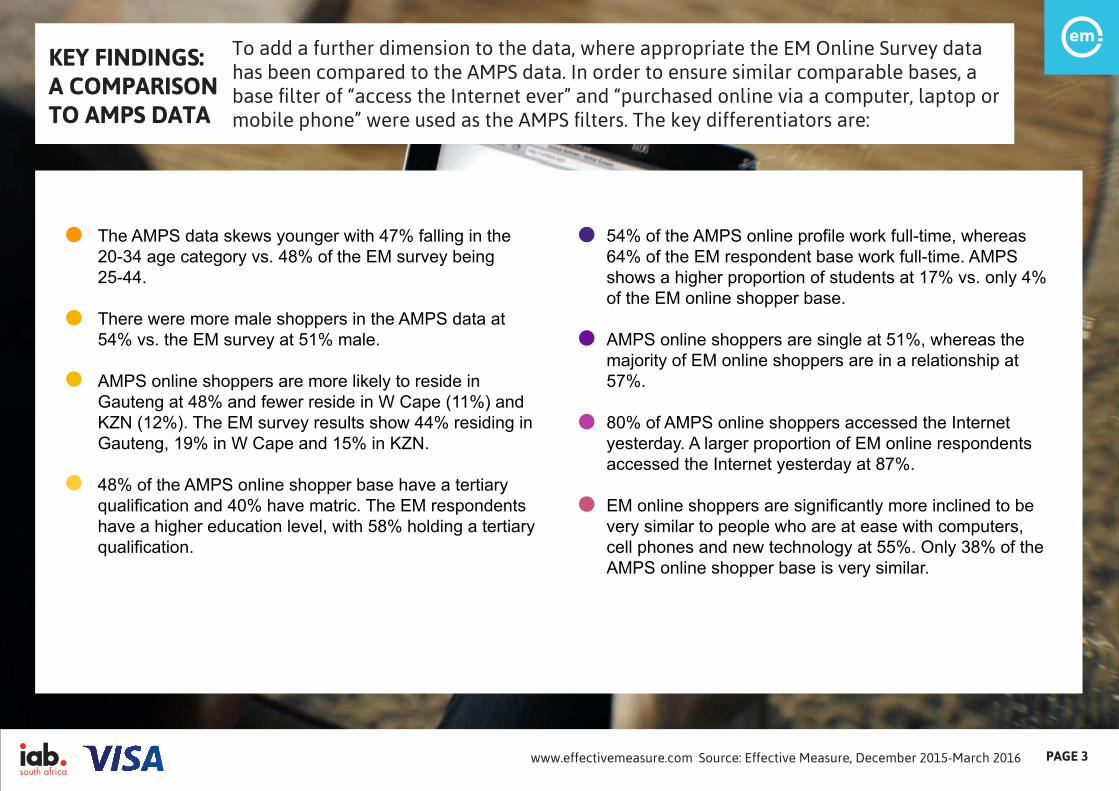
KEY FINDINGS:A COMPARISONTO AMPS DATA
To add a further dimension to the data, where appropriate the EM Online Survey datahas been compared to the AMPS data. In order to ensure similar comparable bases, abase filter of “access the Internet ever” and “purchased online via a computer, laptop ormobile phone” were used as the AMPS filters. The key di�erentiators are:
1
The AMPS data skews younger with 47% falling in the 20-34 age category vs. 48% of the EM survey being 25-44.
There were more male shoppers in the AMPS data at 54% vs. the EM survey at 51% male.
AMPS online shoppers are more likely to reside inGauteng at 48% and fewer reside in W Cape (11%) and KZN (12%). The EM survey results show 44% residing in Gauteng, 19% in W Cape and 15% in KZN.
48% of the AMPS online shopper base have a tertiary qualification and 40% have matric. The EM respondents have a higher education level, with 58% holding a tertiary qualification.
54% of the AMPS online profile work full-time, whereas 64% of the EM respondent base work full-time. AMPS shows a higher proportion of students at 17% vs. only 4% of the EM online shopper base.
AMPS online shoppers are single at 51%, whereas the majority of EM online shoppers are in a relationship at 57%.
80% of AMPS online shoppers accessed the Internet yesterday. A larger proportion of EM online respondents accessed the Internet yesterday at 87%.
EM online shoppers are significantly more inclined to be very similar to people who are at ease with computers, cell phones and new technology at 55%. Only 38% of the AMPS online shopper base is very similar.
Source: E�ective Measure, December 2015-March 2016 www.e�ectivemeasure.com PAGE 3
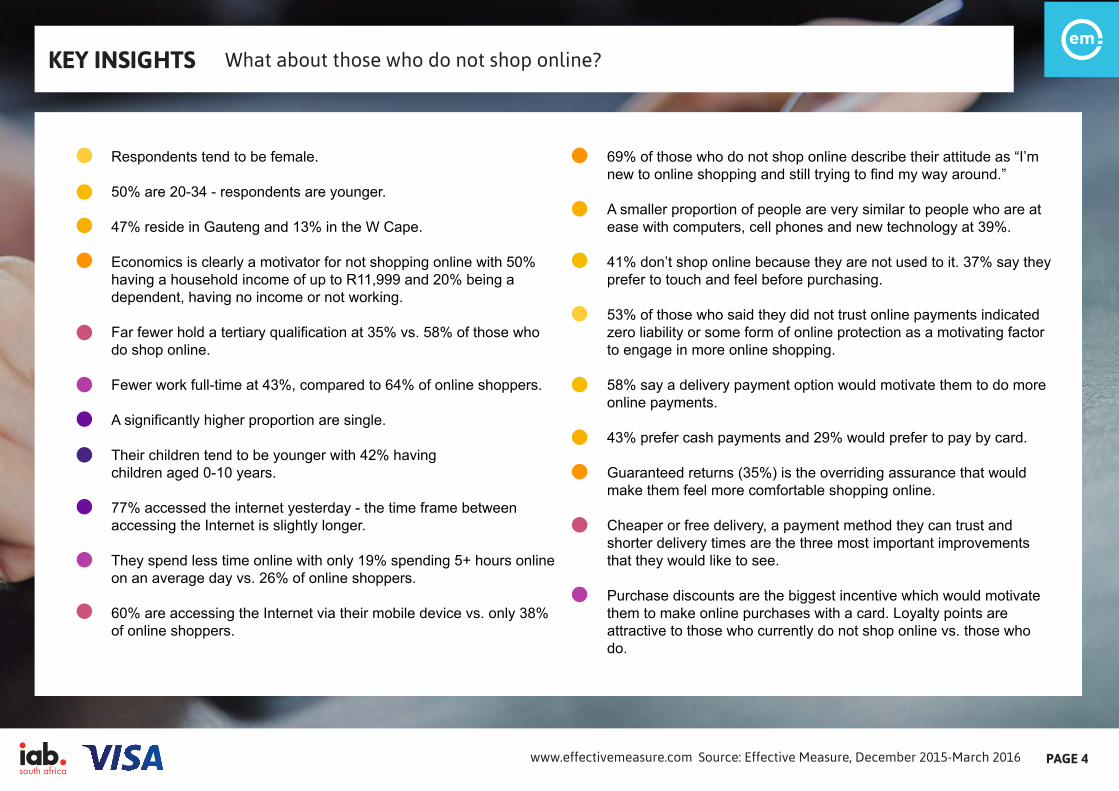
KEY INSIGHTS What about those who do not shop online?
Respondents tend to be female.
50% are 20-34 - respondents are younger.
47% reside in Gauteng and 13% in the W Cape.
Economics is clearly a motivator for not shopping online with 50% having a household income of up to R11,999 and 20% being a dependent, having no income or not working.
Far fewer hold a tertiary qualification at 35% vs. 58% of those who do shop online.
Fewer work full-time at 43%, compared to 64% of online shoppers.
A significantly higher proportion are single.
Their children tend to be younger with 42% havingchildren aged 0-10 years.
77% accessed the internet yesterday - the time frame between accessing the Internet is slightly longer.
They spend less time online with only 19% spending 5+ hours online on an average day vs. 26% of online shoppers.
60% are accessing the Internet via their mobile device vs. only 38% of online shoppers.
69% of those who do not shop online describe their attitude as “I’m new to online shopping and still trying to find my way around.”
A smaller proportion of people are very similar to people who are at ease with computers, cell phones and new technology at 39%.
41% don’t shop online because they are not used to it. 37% say they prefer to touch and feel before purchasing.
53% of those who said they did not trust online payments indicated zero liability or some form of online protection as a motivating factor to engage in more online shopping.
58% say a delivery payment option would motivate them to do more online payments.
43% prefer cash payments and 29% would prefer to pay by card.
Guaranteed returns (35%) is the overriding assurance that would make them feel more comfortable shopping online.
Cheaper or free delivery, a payment method they can trust and shorter delivery times are the three most important improvements that they would like to see.
Purchase discounts are the biggest incentive which would motivate them to make online purchases with a card. Loyalty points are attractive to those who currently do not shop online vs. those who do.
Source: E�ective Measure, December 2015-March 2016 www.e�ectivemeasure.com PAGE 4
DEMOGRAPHICS
Source: E�ective Measure, December 2015-March 2016 www.e�ectivemeasure.com PAGE 5
EM
AMPS
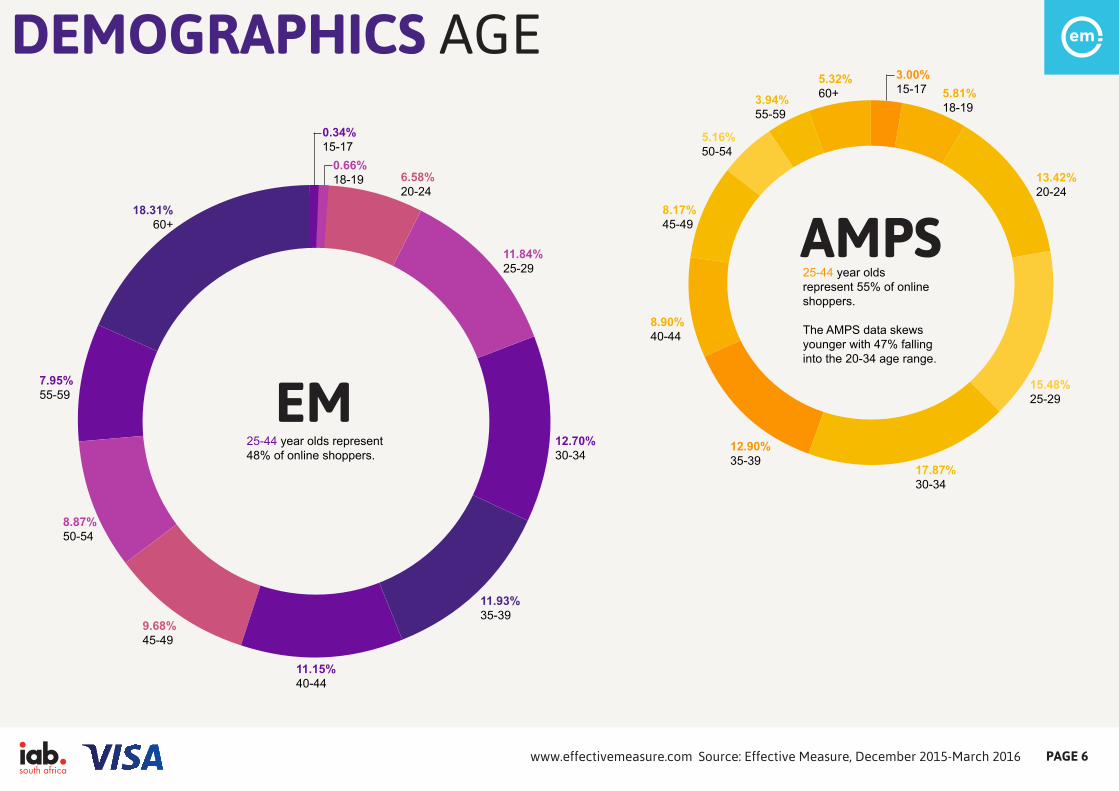
0.34%15-17
0.66%18-19 6.58%
20-24
11.84%25-29
12.70%30-34
11.93% 35-39
11.15% 40-44
9.68% 45-49
8.87% 50-54
7.95% 55-59
18.31% 60+
3.00% 15-17 5.81%
18-19
13.42% 20-24
15.48% 25-29
17.87% 30-34
12.90% 35-39
8.90% 40-44
8.17% 45-49
5.16% 50-54
3.94% 55-59
5.32% 60+
DEMOGRAPHICS AGE
25-44 year oldsrepresent 55% of online shoppers.
The AMPS data skews younger with 47% falling into the 20-34 age range.
25-44 year olds represent 48% of online shoppers.
Source: E�ective Measure, December 2015-March 2016 www.e�ectivemeasure.com PAGE 6
DEMOGRAPHICS GENDER
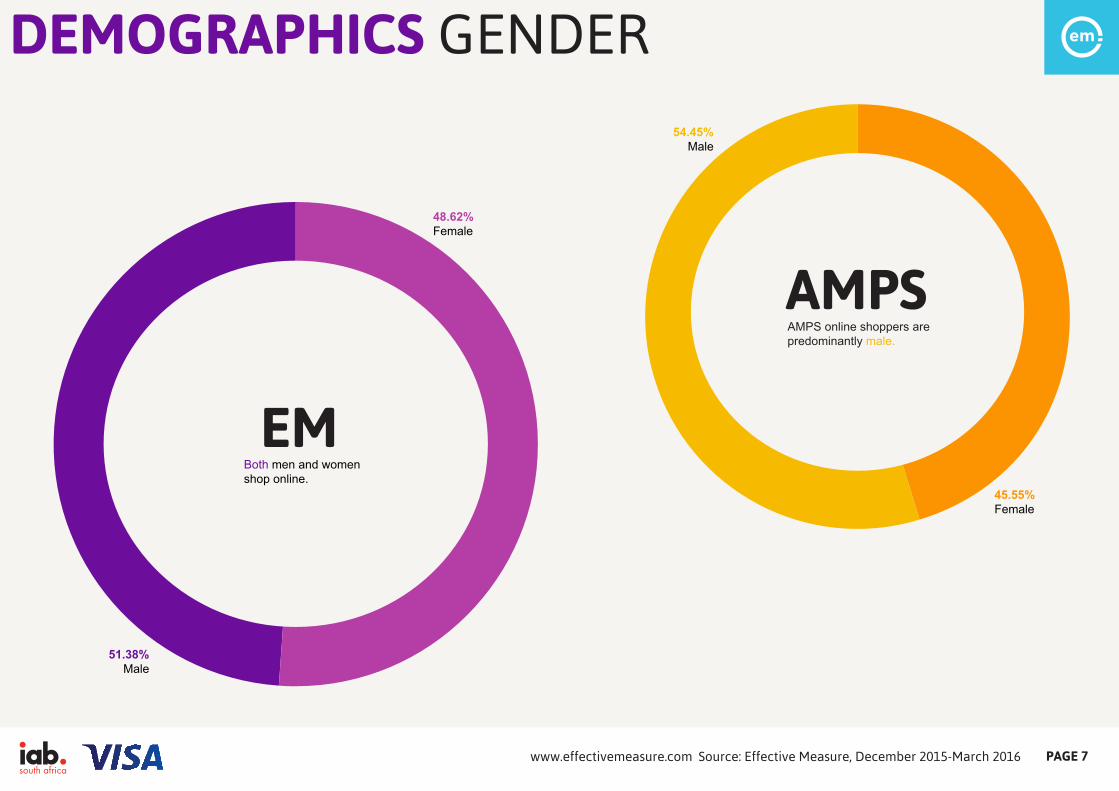
EMBoth men and women shop online.
48.62% Female
51.38% Male
45.55% Female
54.45% Male
AMPSAMPS online shoppers are predominantly male.
Source: E�ective Measure, December 2015-March 2016 www.e�ectivemeasure.com PAGE 7
DEMOGRAPHICS LOCATION
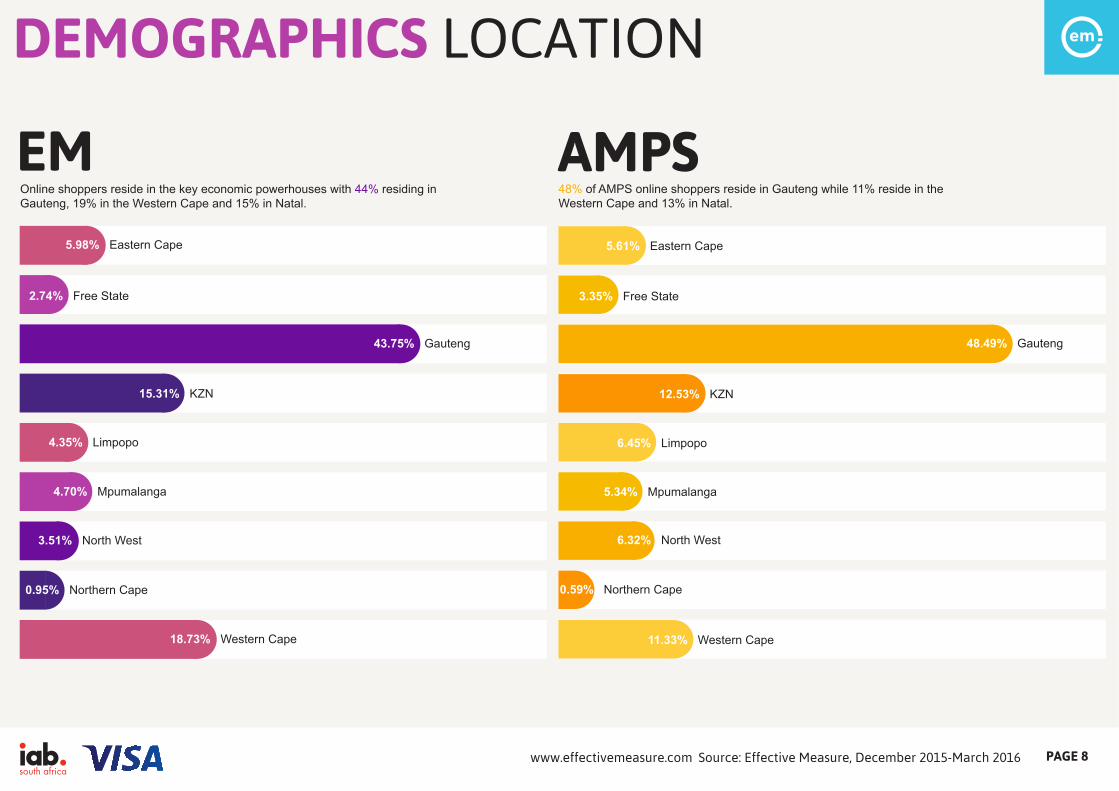
AMPSEM5.98% Eastern Cape
2.74% Free State
0.95% Northern Cape
43.75% Gauteng
15.31% KZN
4.35% Limpopo
4.70% Mpumalanga
3.51% North West
18.73% Western Cape
48.49% Gauteng
5.61% Eastern Cape
3.35% Free State
12.53% KZN
6.45% Limpopo
5.34% Mpumalanga
6.32% North West
0.59% Northern Cape
11.33% Western Cape
Online shoppers reside in the key economic powerhouses with 44% residing in Gauteng, 19% in the Western Cape and 15% in Natal.
48% of AMPS online shoppers reside in Gauteng while 11% reside in the Western Cape and 13% in Natal.
Source: E�ective Measure, December 2015-March 2016 www.e�ectivemeasure.com PAGE 8
DEMOGRAPHICS HOUSEHOLD INCOME
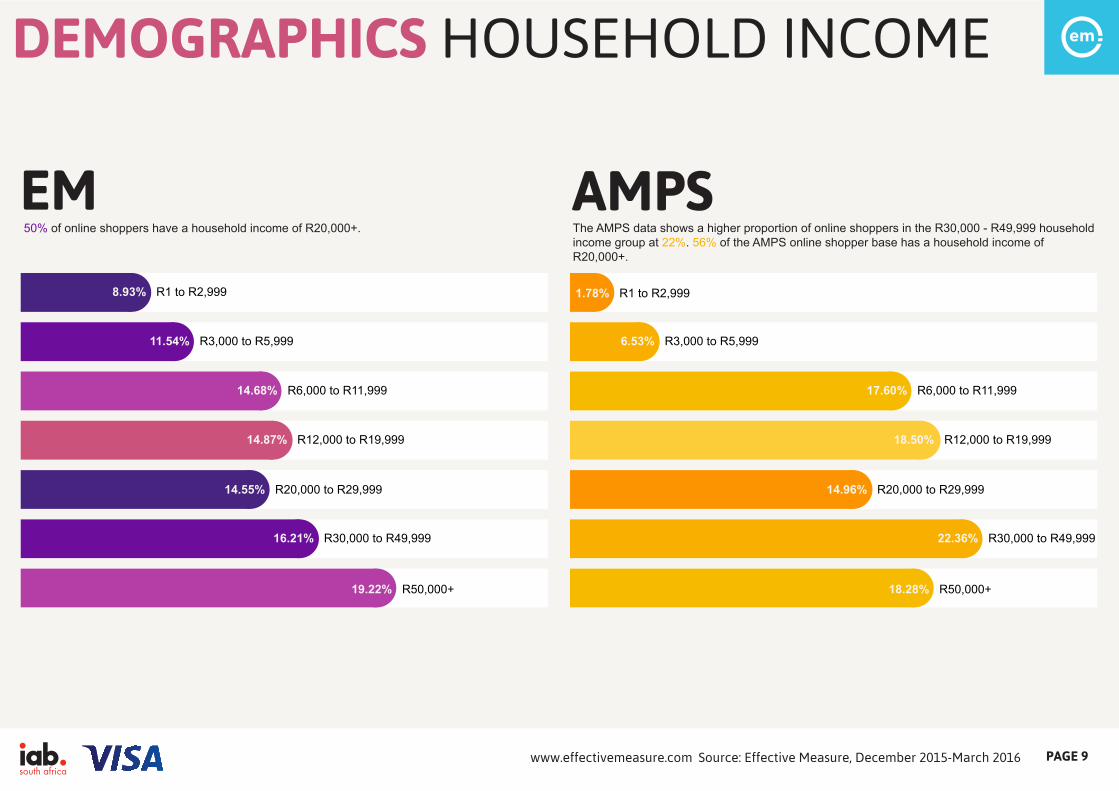
AMPSEM50% of online shoppers have a household income of R20,000+. The AMPS data shows a higher proportion of online shoppers in the R30,000 - R49,999 household
income group at 22%. 56% of the AMPS online shopper base has a household income of R20,000+.
8.93% R1 to R2,999
11.54% R3,000 to R5,999
14.68% R6,000 to R11,999
14.87% R12,000 to R19,999
14.55% R20,000 to R29,999
16.21% R30,000 to R49,999
19.22% R50,000+
1.78% R1 to R2,999
6.53% R3,000 to R5,999
17.60% R6,000 to R11,999
18.50% R12,000 to R19,999
14.96% R20,000 to R29,999
22.36% R30,000 to R49,999
18.28% R50,000+
Source: E�ective Measure, December 2015-March 2016 www.e�ectivemeasure.com PAGE 9
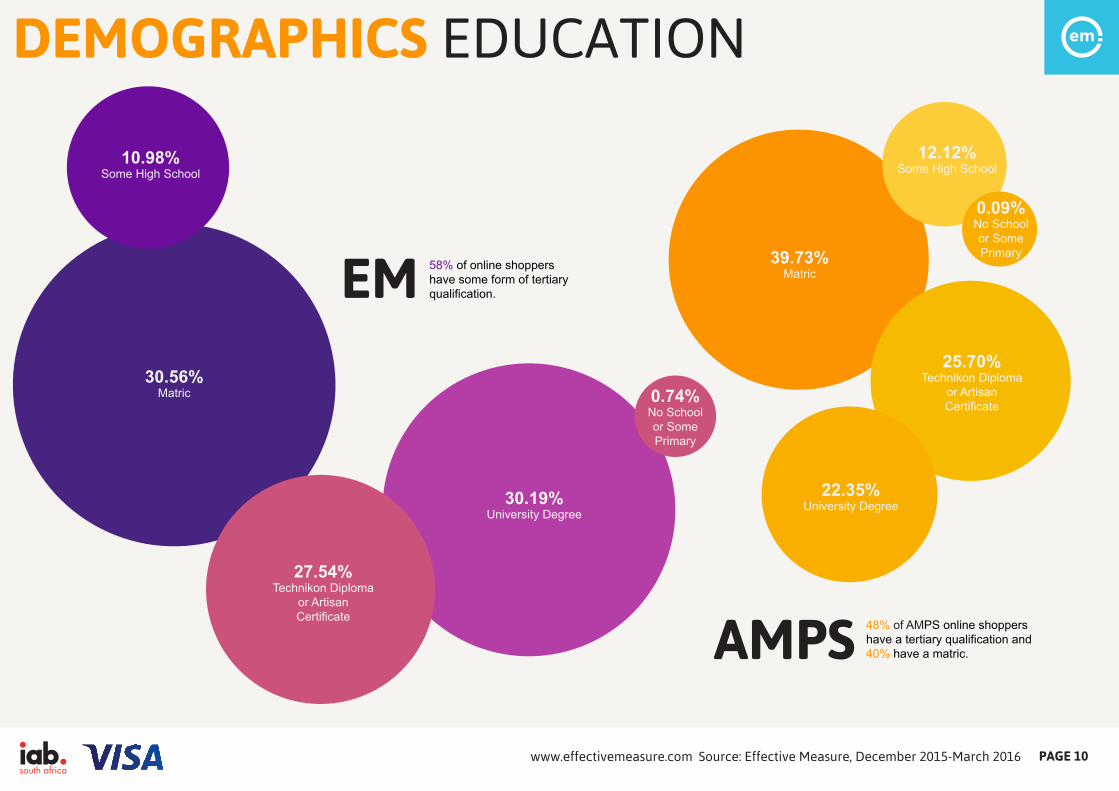
DEMOGRAPHICS EDUCATION
EM 58% of online shoppers have some form of tertiary qualification.
AMPS 48% of AMPS online shoppers have a tertiary qualification and 40% have a matric.
30.56%Matric
30.19%University Degree
27.54%Technikon Diploma
or ArtisanCertificate
10.98%Some High School
0.74%No Schoolor SomePrimary
0.09%No Schoolor SomePrimary39.73%
Matric
22.35%University Degree
25.70%Technikon Diploma
or ArtisanCertificate
12.12%Some High School
Source: E�ective Measure, December 2015-March 2016 www.e�ectivemeasure.com PAGE 10
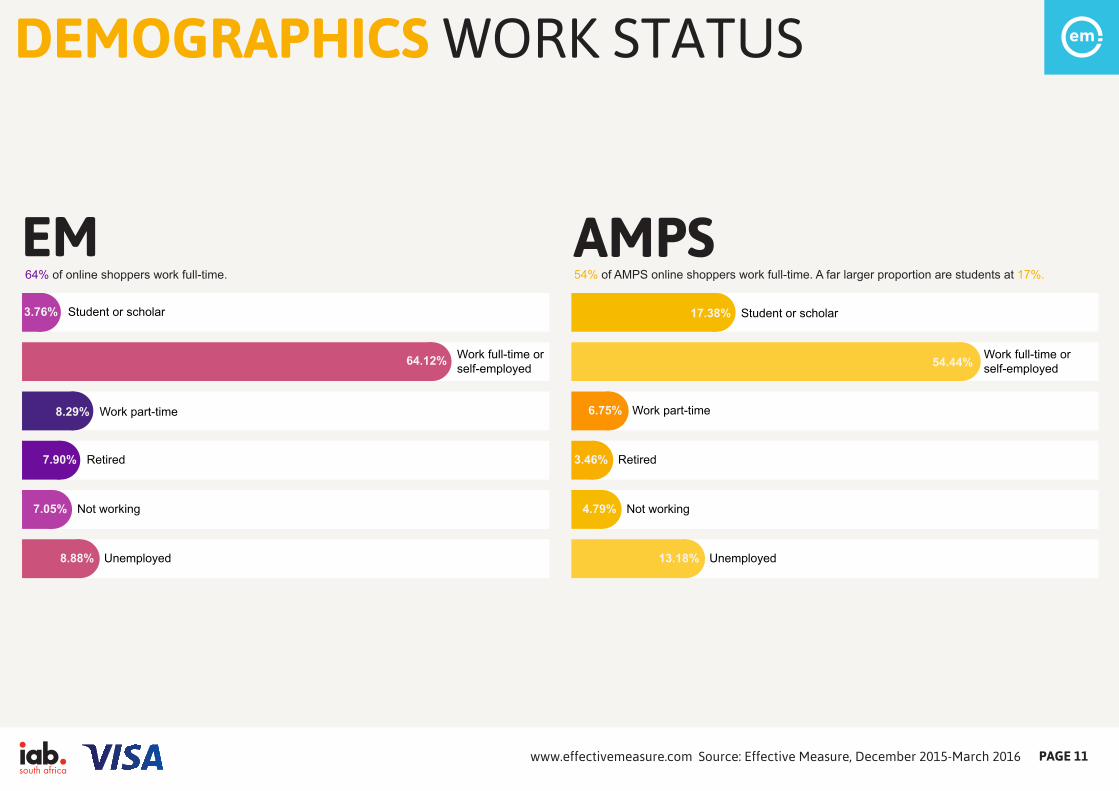
DEMOGRAPHICS WORK STATUS
AMPSEM64% of online shoppers work full-time. 54% of AMPS online shoppers work full-time. A far larger proportion are students at 17%.
3.76% Student or scholar
64.12%
8.29% Work part-time
7.90% Retired
7.05% Not working
8.88% Unemployed
17.38% Student or scholar
54.44%
6.75% Work part-time
3.46% Retired
4.79% Not working
13.18% Unemployed
Work full-time orself-employed
Work full-time orself-employed
Source: E�ective Measure, December 2015-March 2016 www.e�ectivemeasure.com PAGE 11
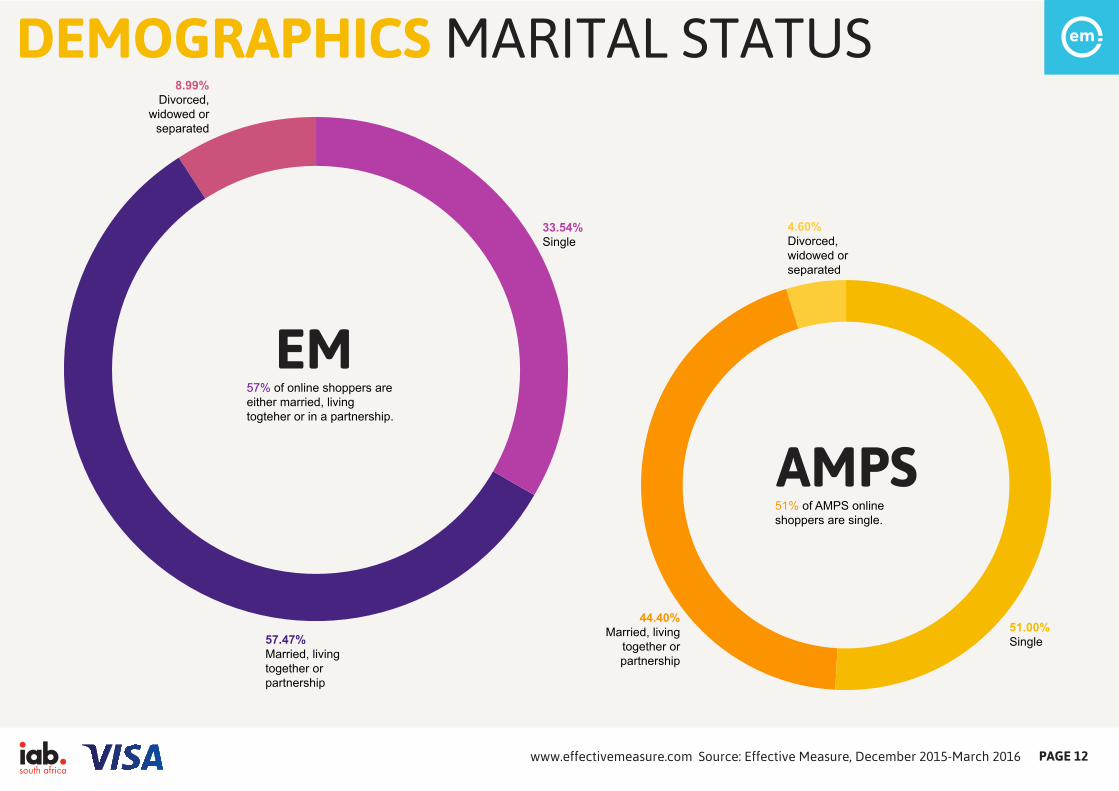
DEMOGRAPHICS MARITAL STATUS
EM57% of online shoppers are either married, living togteher or in a partnership.
AMPS51% of AMPS online shoppers are single.
57.47%Married, living together or partnership
33.54% Single
8.99%Divorced,
widowed or separated
4.60%Divorced, widowed or separated
51.00%Single
44.40%Married, living
together or partnership
Source: E�ective Measure, December 2015-March 2016 www.e�ectivemeasure.com PAGE 12
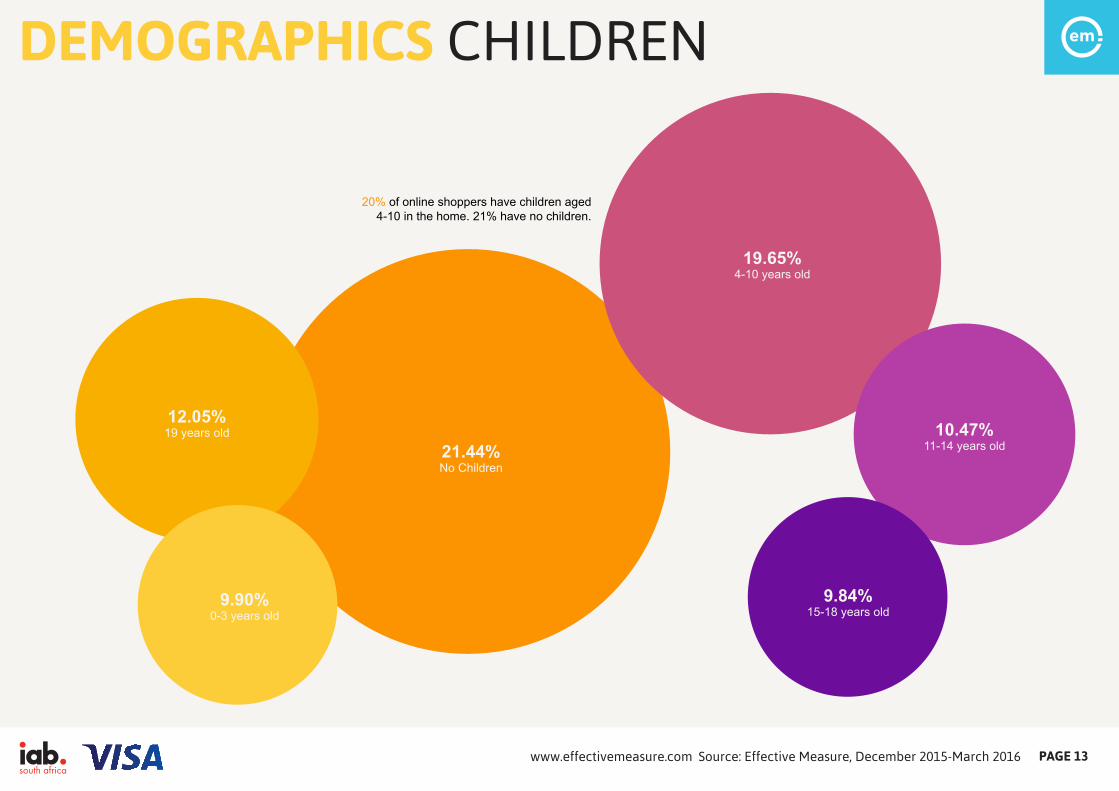
DEMOGRAPHICS CHILDREN
20% of online shoppers have children aged4-10 in the home. 21% have no children.
21.44%No Children
19.65%4-10 years old
12.05%19 years old 10.47%
11-14 years old
9.90%0-3 years old
9.84%15-18 years old
Source: E�ective Measure, December 2015-March 2016 www.e�ectivemeasure.com PAGE 13
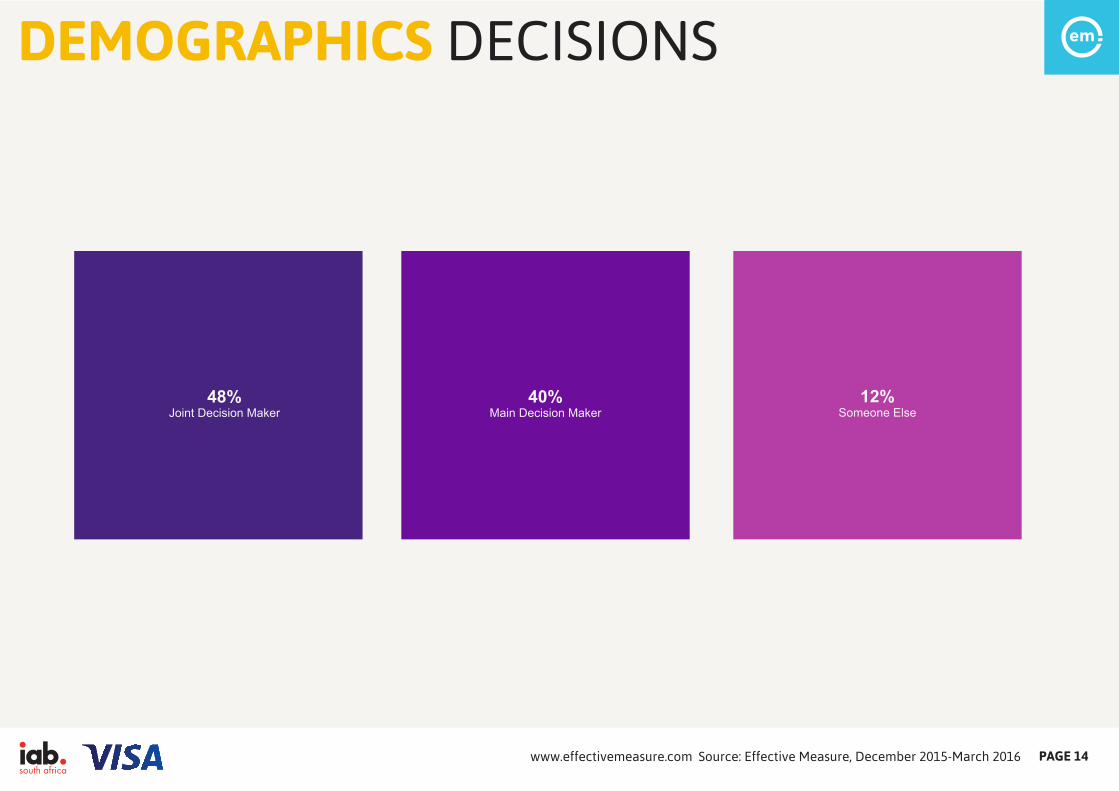
DEMOGRAPHICS DECISIONS
48%Joint Decision Maker
40%Main Decision Maker
12%Someone Else
Source: E�ective Measure, December 2015-March 2016 www.e�ectivemeasure.com PAGE 14
INSIGHTSINSIGHTS
Source: E�ective Measure, December 2015-March 2016 www.e�ectivemeasure.com PAGE 15
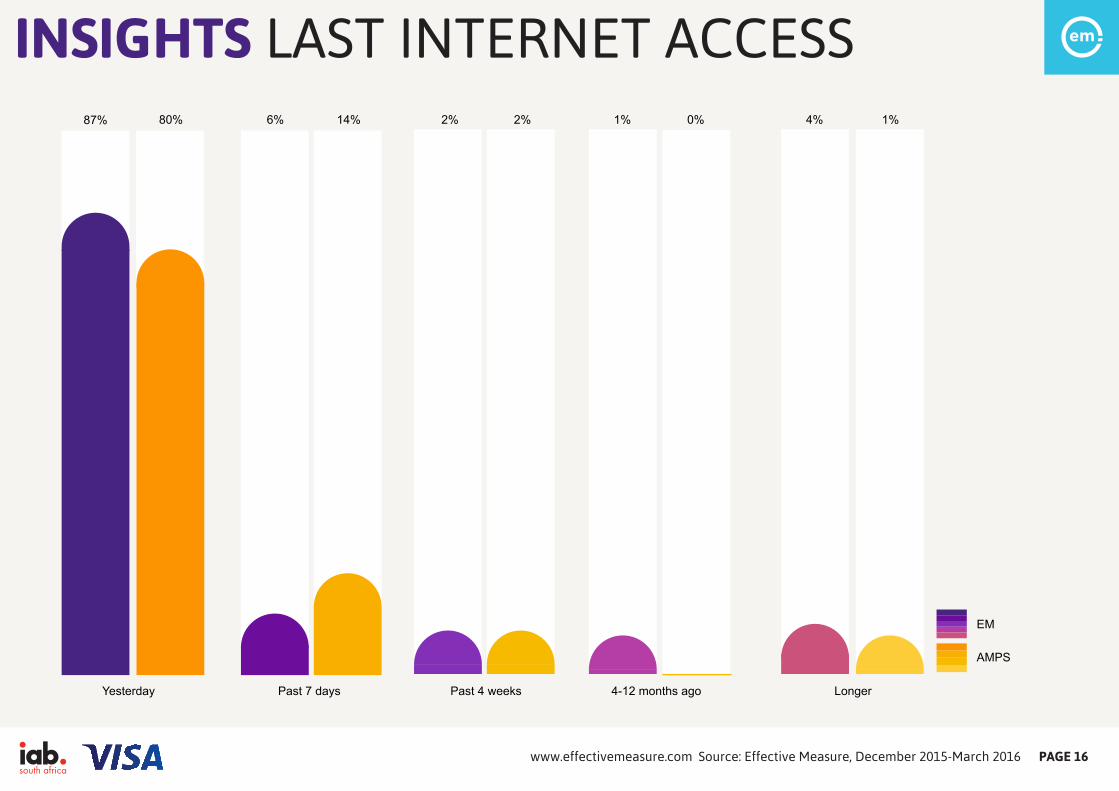
INSIGHTS LAST INTERNET ACCESS87% 80% 6% 14% 2% 2% 1% 0% 4% 1%
Yesterday Past 7 days Past 4 weeks 4-12 months ago Longer
AMPS
EM
Source: E�ective Measure, December 2015-March 2016 www.e�ectivemeasure.com PAGE 16
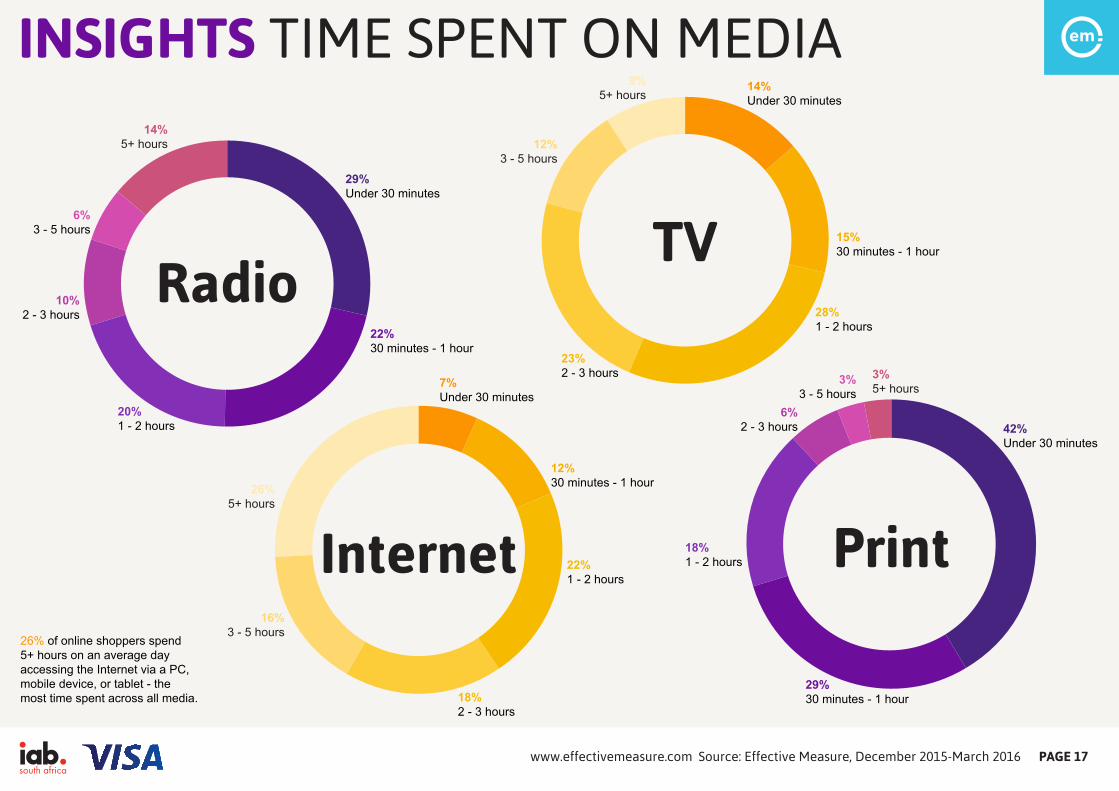
INSIGHTS TIME SPENT ON MEDIA
Radio
29%Under 30 minutes
22%30 minutes - 1 hour
20%1 - 2 hours
10%2 - 3 hours
6%3 - 5 hours
14%5+ hours
15%30 minutes - 1 hourTV
14%Under 30 minutes
28%1 - 2 hours
23%2 - 3 hours
12%3 - 5 hours
9%5+ hours
Internet
7%Under 30 minutes
12%30 minutes - 1 hour
22%1 - 2 hours
18%2 - 3 hours
16%3 - 5 hours
26%5+ hours
42%Under 30 minutes
29%30 minutes - 1 hour
18%1 - 2 hours
6%2 - 3 hours
3%3 - 5 hours
3%5+ hours
26% of online shoppers spend5+ hours on an average dayaccessing the Internet via a PC,mobile device, or tablet - themost time spent across all media.
Source: E�ective Measure, December 2015-March 2016 www.e�ectivemeasure.com PAGE 17
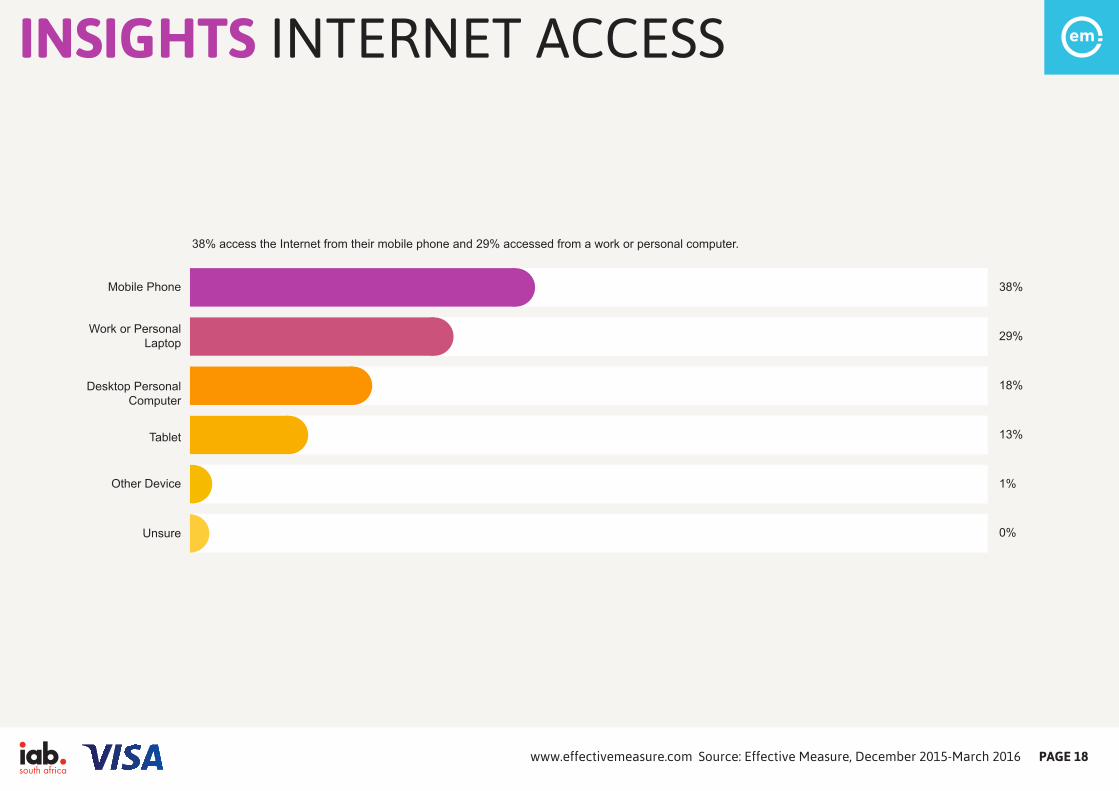
INSIGHTS INTERNET ACCESS
38% access the Internet from their mobile phone and 29% accessed from a work or personal computer.
Mobile Phone 38%
Work or Personal Laptop
Desktop Personal Computer
Tablet
Other Device
Unsure
29%
18%
13%
1%
0%
Source: E�ective Measure, December 2015-March 2016 www.e�ectivemeasure.com PAGE 18
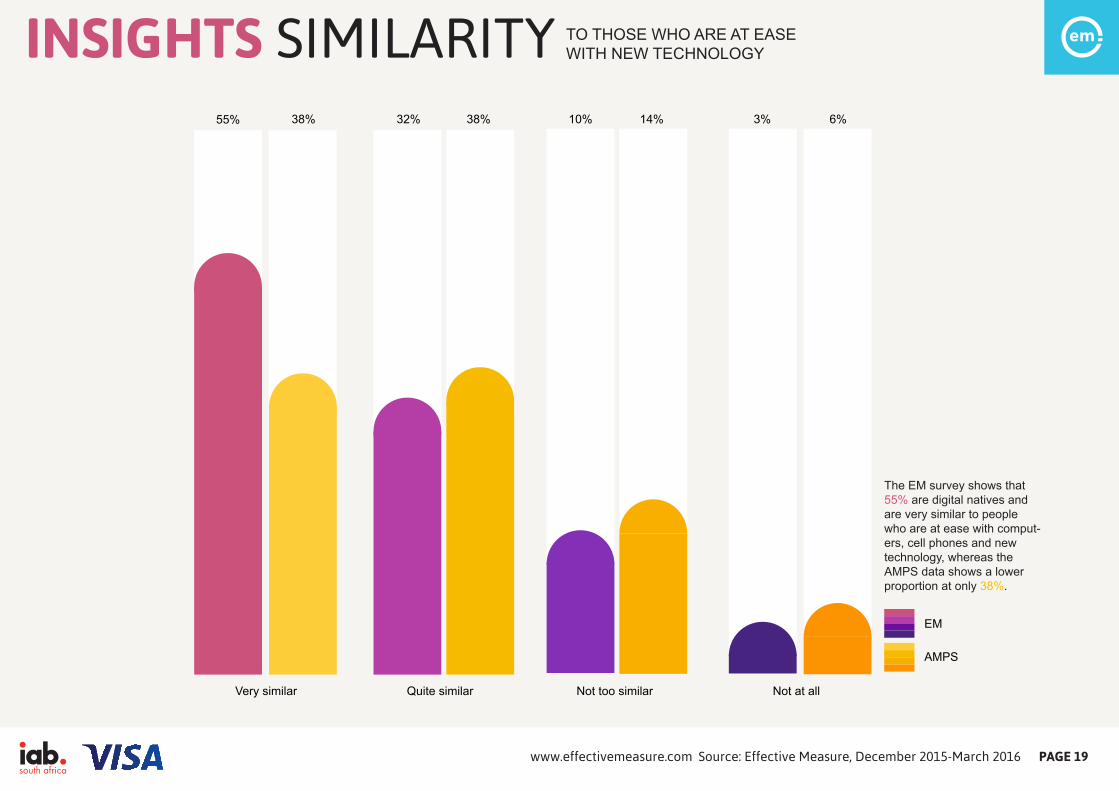
INSIGHTS SIMILARITY TO THOSE WHO ARE AT EASE WITH NEW TECHNOLOGY
55% 38% 32% 38% 10% 14% 3% 6%
Very similar Quite similar Not too similar Not at all
AMPS
EM
The EM survey shows that 55% are digital natives and are very similar to people who are at ease with comput-ers, cell phones and new technology, whereas the AMPS data shows a lower proportion at only 38%.
Source: E�ective Measure, December 2015-March 2016 www.e�ectivemeasure.com PAGE 19
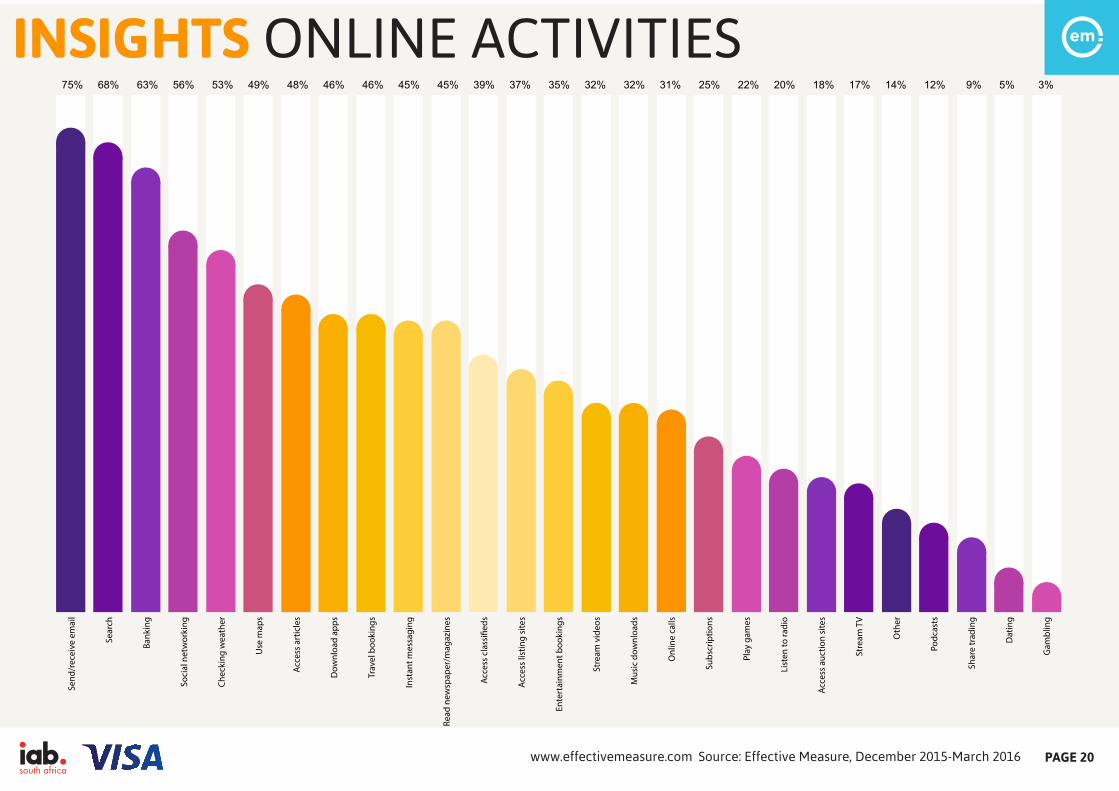
INSIGHTS ONLINE ACTIVITIES75% 68% 63% 56% 53% 49% 48% 46% 46% 45% 45% 39% 37% 35% 32% 32% 31% 25% 22% 20% 18% 17% 14% 12% 9% 5% 3%
Send
/rec
eive
em
ail
Sear
ch
Bank
ing
Soci
al n
etw
orki
ng
Chec
king
wea
ther
Use
map
s
Acce
ss a
rtic
les
Dow
nloa
d ap
ps
Trav
el b
ooki
ngs
Inst
ant m
essa
ging
Read
new
spap
er/m
agaz
ines
Acce
ss c
lass
i�ed
s
Acce
ss li
stin
g si
tes
Ente
rtai
nmen
t boo
king
s
Stre
am v
ideo
s
Mus
ic d
ownl
oads
Onl
ine
calls
Subs
crip
tions
Play
gam
es
List
en to
radi
o
Acce
ss a
uctio
n si
tes
Stre
am T
V
Oth
er
Podc
asts
Shar
e tr
adin
g
Dat
ing
Gam
blin
g
Source: E�ective Measure, December 2015-March 2016 www.e�ectivemeasure.com PAGE 20
ONLINE SHOPPING
Source: E�ective Measure, December 2015-March 2016 www.e�ectivemeasure.com PAGE 21
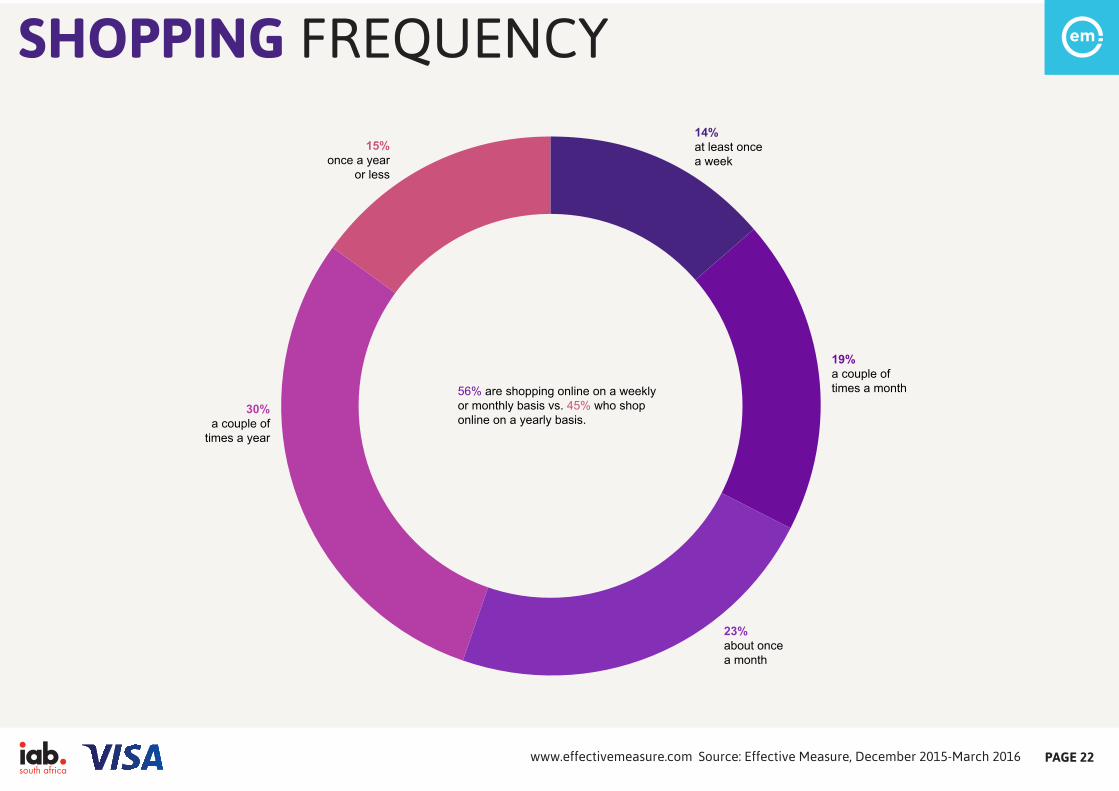
SHOPPING FREQUENCY
56% are shopping online on a weeklyor monthly basis vs. 45% who shoponline on a yearly basis.
14%at least oncea week
19%a couple oftimes a month
23%about oncea month
30%a couple of
times a year
15%once a year
or less
Source: E�ective Measure, December 2015-March 2016 www.e�ectivemeasure.com PAGE 22
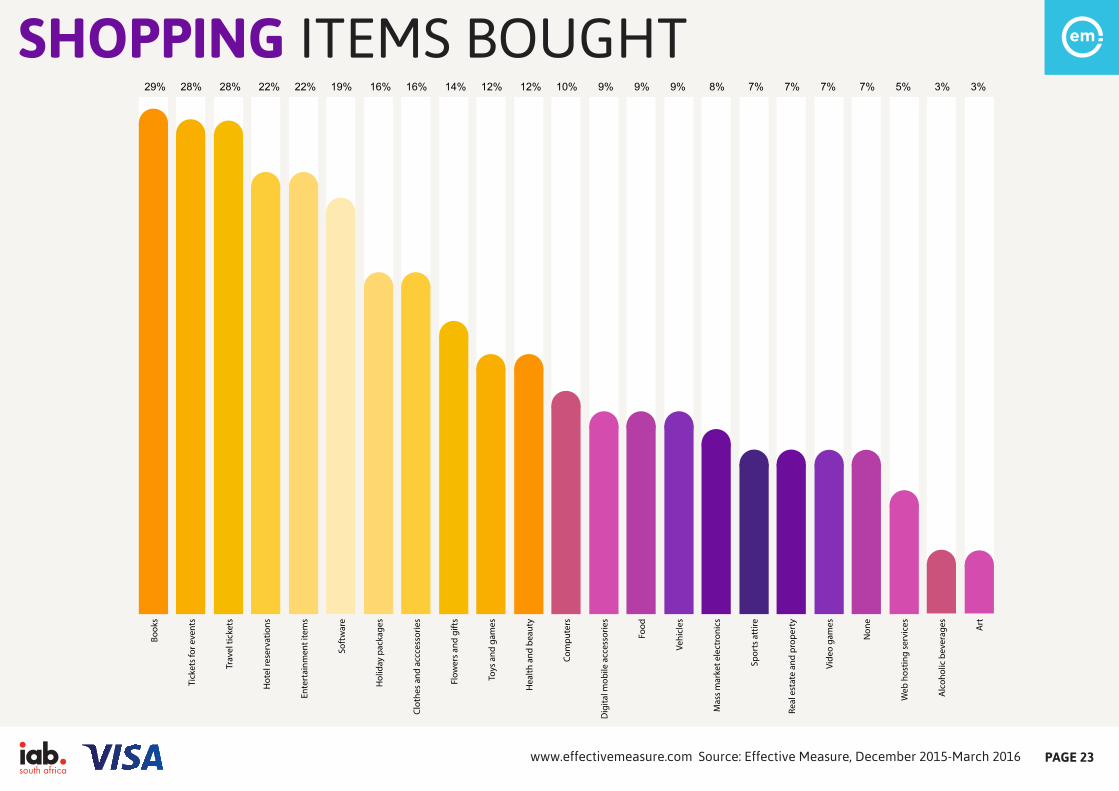
SHOPPING ITEMS BOUGHT29% 28% 28% 22% 22% 19% 16% 16% 14% 12% 12% 10% 9% 9% 9% 8% 7% 7% 7% 7% 5% 3% 3%
Book
s
Tick
ets
for e
vent
s
Trav
el ti
cket
s
Hot
el re
serv
atio
ns
Ente
rtai
nmen
t ite
ms
Soft
war
e
Hol
iday
pac
kage
s
Clot
hes
and
accc
esso
ries
Flow
ers
and
gift
s
Toys
and
gam
es
Hea
lth a
nd b
eaut
y
Com
pute
rs
Dig
ital m
obile
acc
esso
ries
Food
Vehi
cles
Mas
s m
arke
t ele
ctro
nics
Spor
ts a
ttire
Real
est
ate
and
prop
erty
Vide
o ga
mes
Non
e
Web
hos
ting
serv
ices
Alc
ohol
ic b
ever
ages Art
Source: E�ective Measure, December 2015-March 2016 www.e�ectivemeasure.com PAGE 23
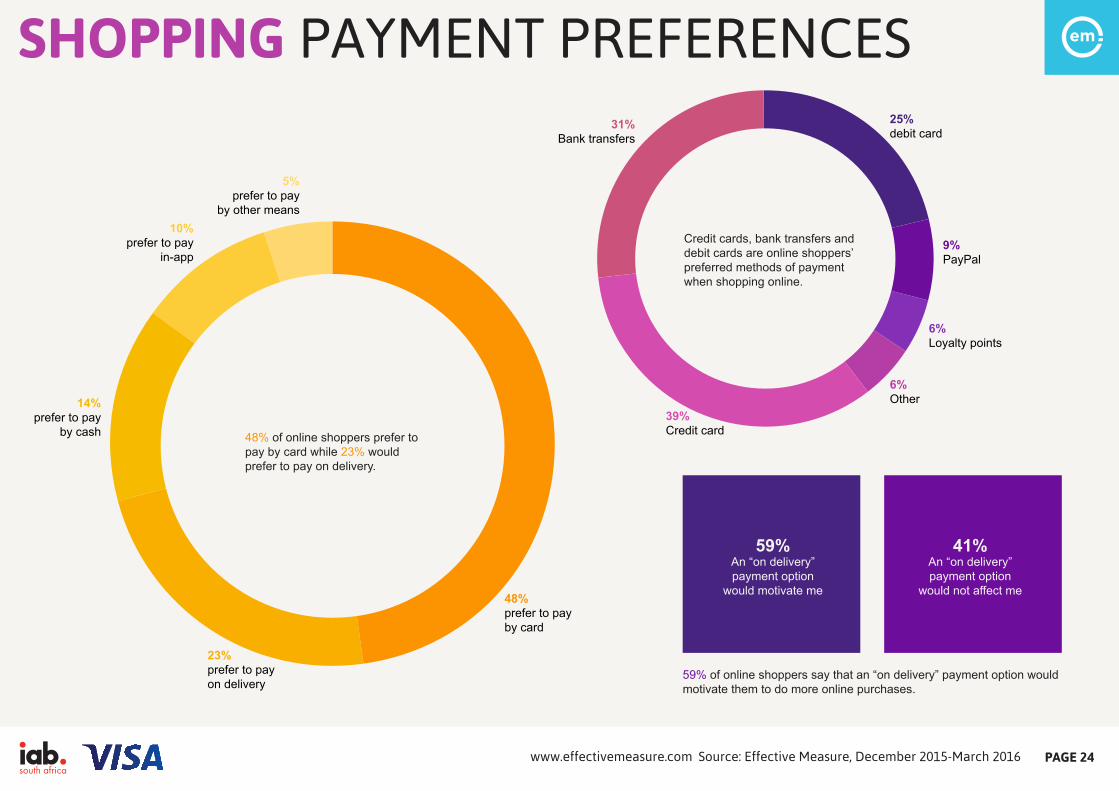
SHOPPING PAYMENT PREFERENCES
59%An “on delivery” payment option
would motivate me
41%An “on delivery” payment option
would not affect me
59% of online shoppers say that an “on delivery” payment option would motivate them to do more online purchases.
48%prefer to payby card
48% of online shoppers prefer to pay by card while 23% would prefer to pay on delivery.
23%prefer to payon delivery
14%prefer to pay
by cash
10%prefer to pay
in-app
5%prefer to pay
by other means
Credit cards, bank transfers and debit cards are online shoppers’ preferred methods of payment when shopping online.
25%debit card
9%PayPal
6%Loyalty points
6%Other
39%Credit card
31%Bank transfers
Source: E�ective Measure, December 2015-March 2016 www.e�ectivemeasure.com PAGE 24
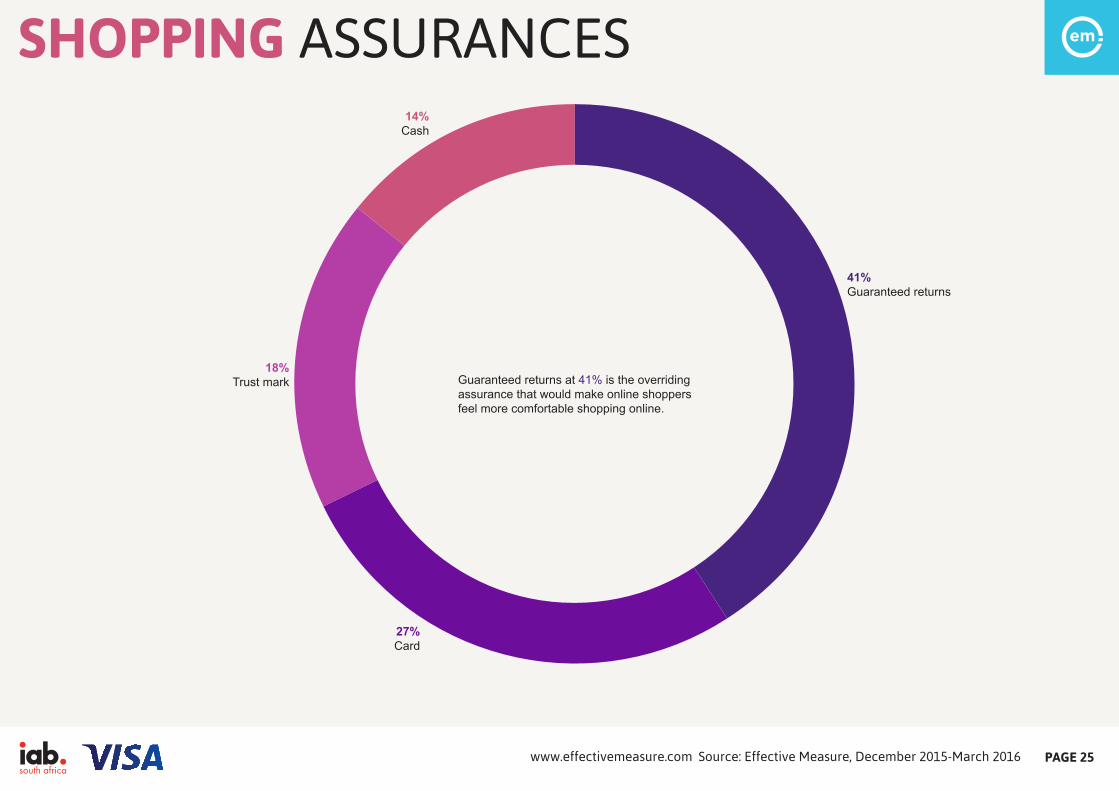
SHOPPING ASSURANCES
Guaranteed returns at 41% is the overridingassurance that would make online shoppersfeel more comfortable shopping online.
14%Cash
18%Trust mark
27%Card
41%Guaranteed returns
Source: E�ective Measure, December 2015-March 2016 www.e�ectivemeasure.com PAGE 25
SHOPPING ONLINE PAYMENT COMFORT
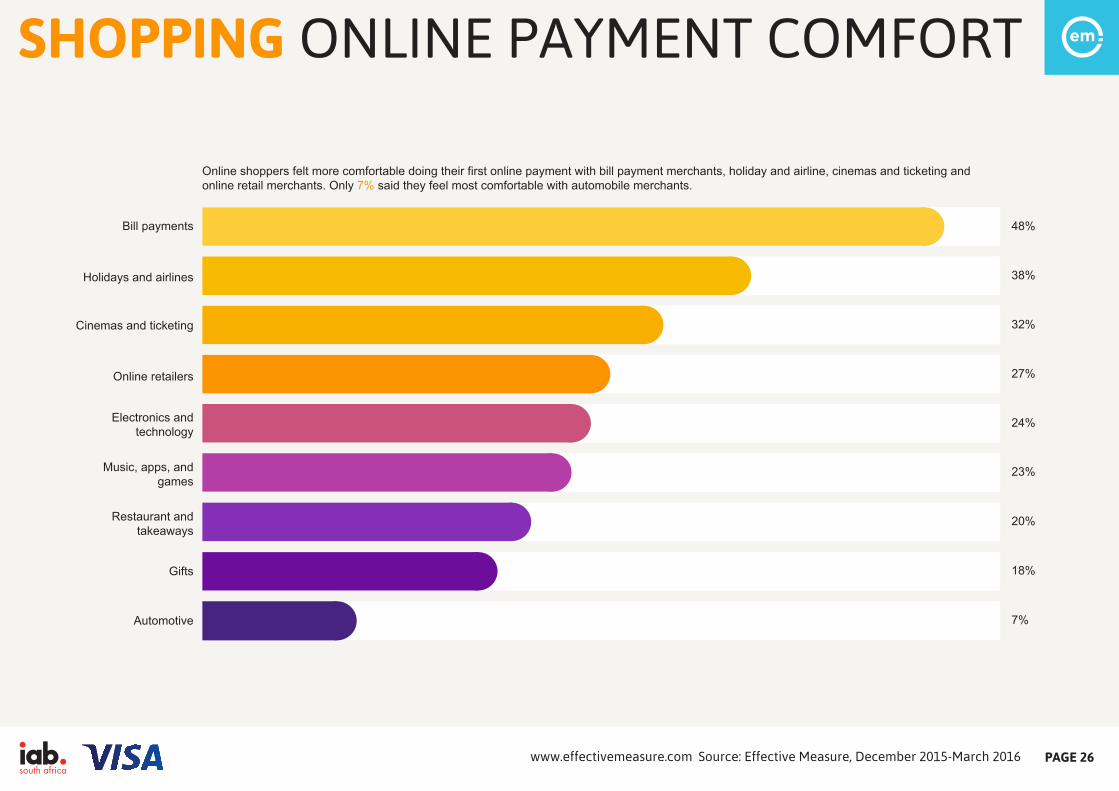
Online shoppers felt more comfortable doing their first online payment with bill payment merchants, holiday and airline, cinemas and ticketing and online retail merchants. Only 7% said they feel most comfortable with automobile merchants.
Bill payments 48%
Holidays and airlines
Cinemas and ticketing
Online retailers
Electronics and technology
Music, apps, and games
38%
32%
27%
24%
23%
Restaurant and takeaways
20%
Gifts 18%
Automotive 7%
Source: E�ective Measure, December 2015-March 2016 www.e�ectivemeasure.com PAGE 26
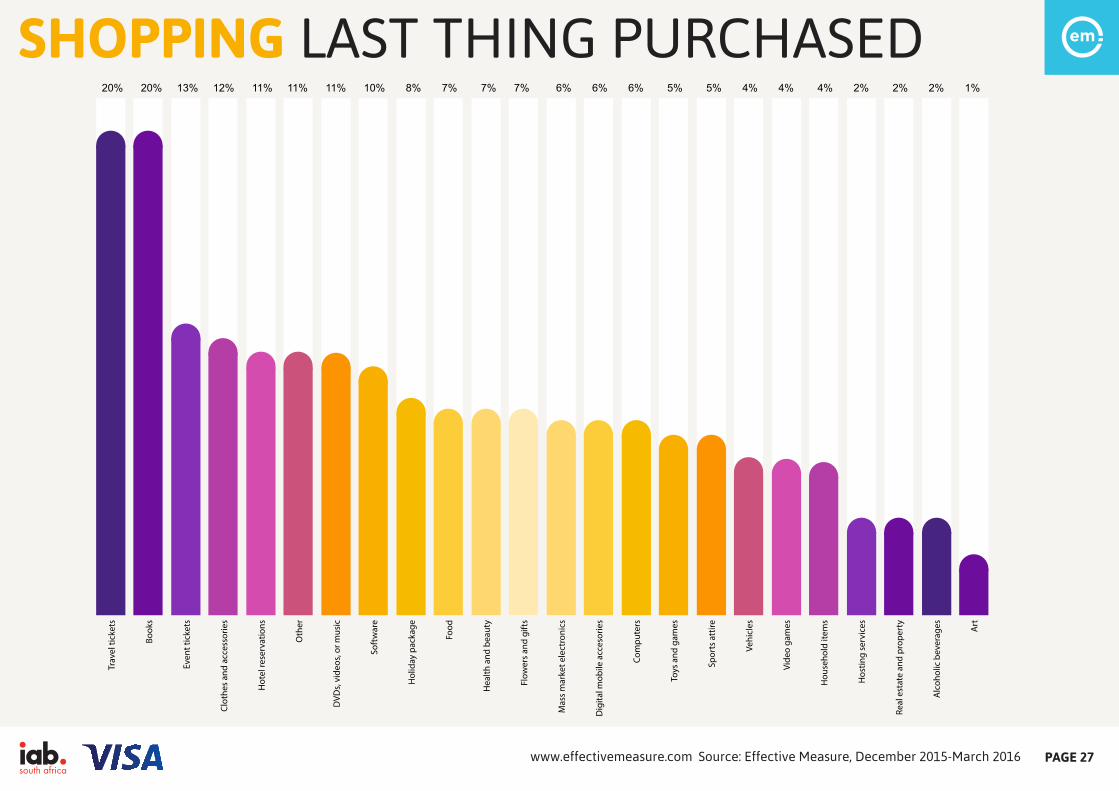
SHOPPING LAST THING PURCHASED20% 20% 13% 12% 11% 11% 11% 10% 8% 7% 7% 7% 6% 6% 6% 5% 5% 4% 4% 4% 2% 2% 2% 1%
Trav
el ti
cket
s
Book
s
Even
t tic
kets
Clot
hes
and
acce
ssor
ies
Hot
el re
serv
atio
ns
Oth
er
DVD
s, vi
deos
, or m
usic
Soft
war
e
Hol
iday
pac
kage
Food
Hea
lth a
nd b
eaut
y
Flow
ers
and
gift
s
Mas
s m
arke
t ele
ctro
nics
Dig
ital m
obile
acc
esor
ies
Com
pute
rs
Toys
and
gam
es
Spor
ts a
ttire
Vehi
cles
Vide
o ga
mes
Hou
seho
ld it
ems
Hos
ting
serv
ices
Real
est
ate
and
prop
erty
Alc
ohol
ic b
ever
ages Art
Source: E�ective Measure, December 2015-March 2016 www.e�ectivemeasure.com PAGE 27
SHOPPING DELIVERY TIME
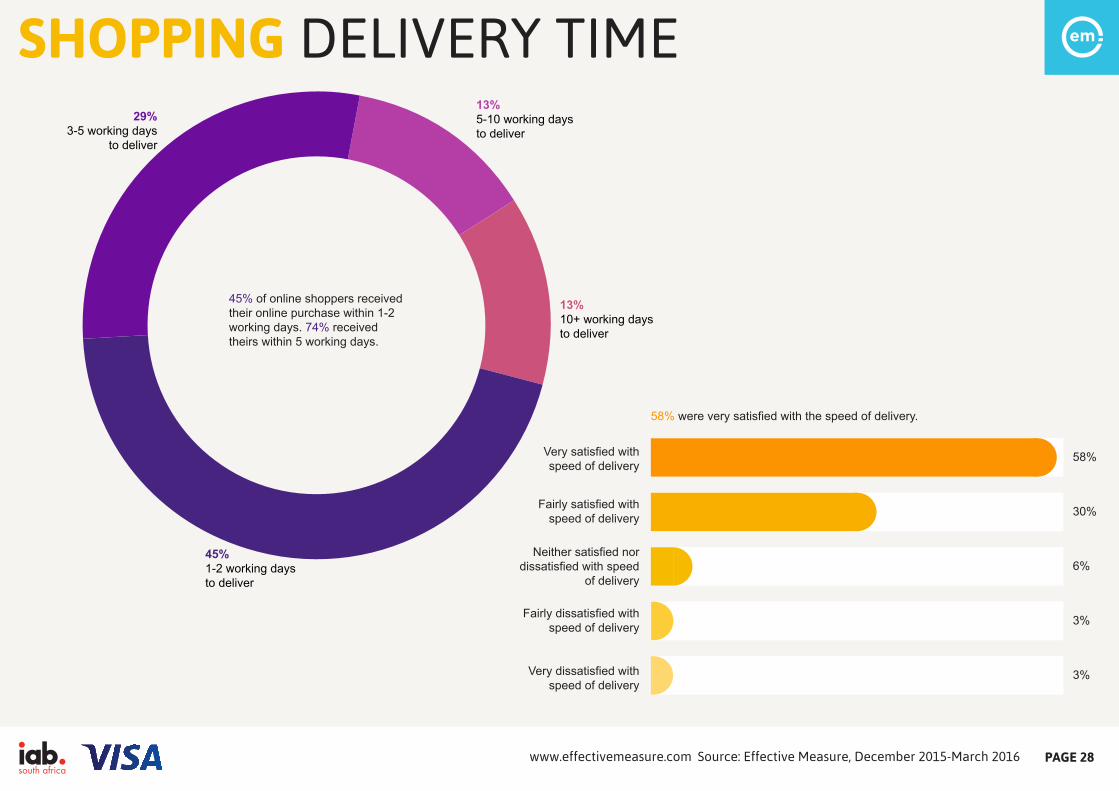
45% of online shoppers received their online purchase within 1-2 working days. 74% received theirs within 5 working days.
29%3-5 working days
to deliver
58% were very satisfied with the speed of delivery.
Very satisfied with speed of delivery
58%
Fairly satisfied with speed of delivery
Neither satisfied nor dissatisfied with speed
of delivery
Fairly dissatisfied with speed of delivery
Very dissatisfied with speed of delivery
30%
6%
3%
3%
13%5-10 working daysto deliver
13%10+ working daysto deliver
45%1-2 working daysto deliver
Source: E�ective Measure, December 2015-March 2016 www.e�ectivemeasure.com PAGE 28
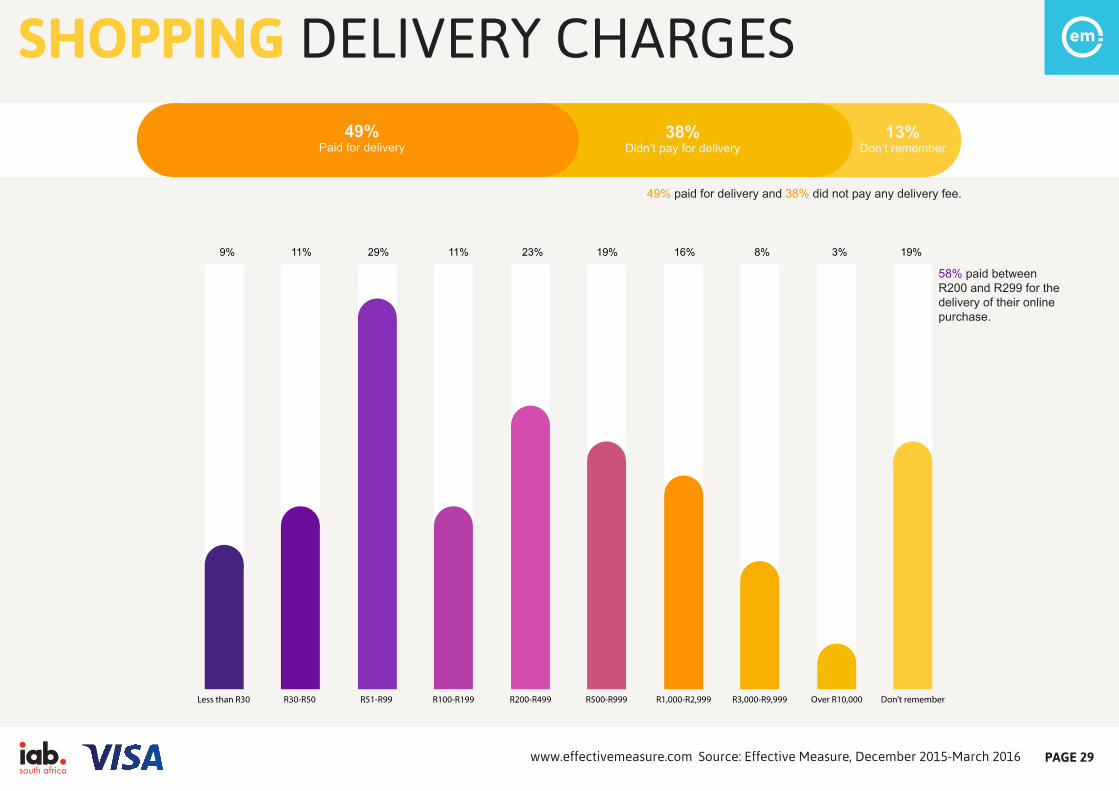
SHOPPING DELIVERY CHARGES49%
Paid for delivery38%
Didn’t pay for delivery13%
Don’t remember
9% 11% 29% 11% 23% 19% 16% 8% 3% 19%
Less than R30
49% paid for delivery and 38% did not pay any delivery fee.
R30-R50 R51-R99 R100-R199 R200-R499 R500-R999 R1,000-R2,999 R3,000-R9,999 Over R10,000 Don’t remember
58% paid between R200 and R299 for the delivery of their online purchase.
Source: E�ective Measure, December 2015-March 2016 www.e�ectivemeasure.com PAGE 29
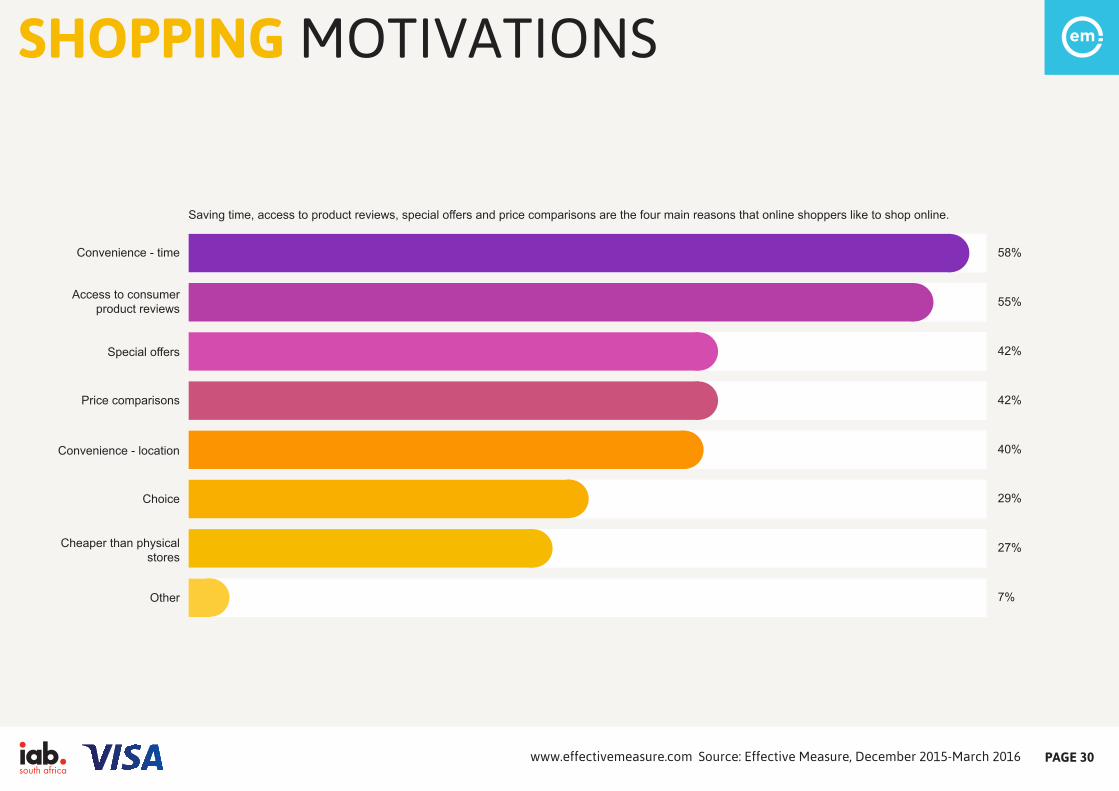
SHOPPING MOTIVATIONS
Saving time, access to product reviews, special offers and price comparisons are the four main reasons that online shoppers like to shop online.
Convenience - time 58%
Access to consumer product reviews
Special offers
Price comparisons
Convenience - location
Choice
55%
42%
42%
40%
29%
Cheaper than physical stores
27%
Other 7%
Source: E�ective Measure, December 2015-March 2016 www.e�ectivemeasure.com PAGE 30
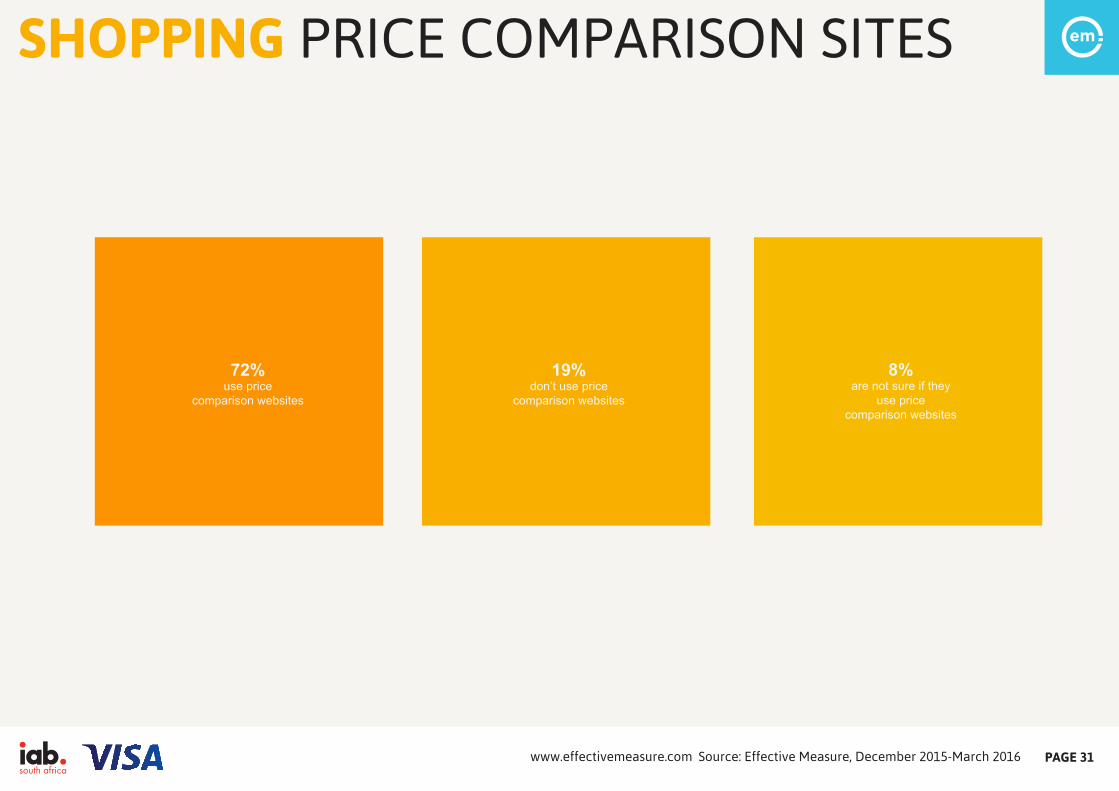
SHOPPING PRICE COMPARISON SITES
72%use price
comparison websites
19%don’t use price
comparison websites
8%are not sure if they
use pricecomparison websites
Source: E�ective Measure, December 2015-March 2016 www.e�ectivemeasure.com PAGE 31
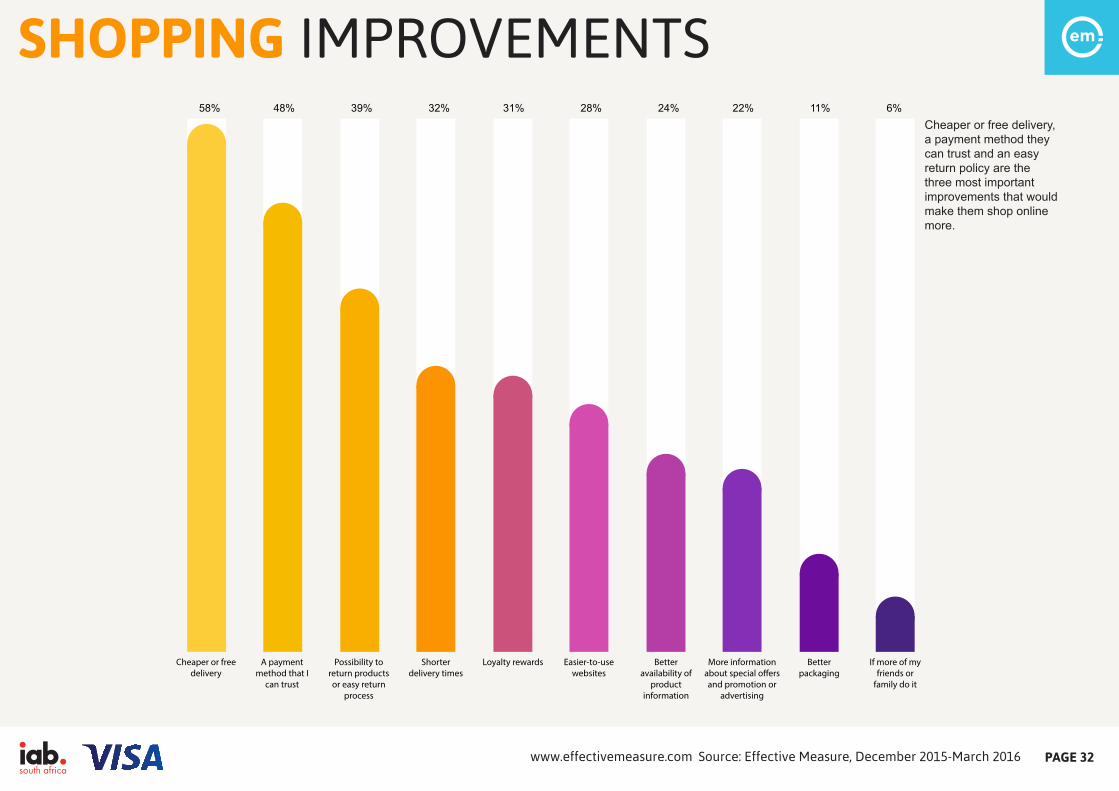
SHOPPING IMPROVEMENTS58% 48% 39% 32% 31% 28% 24% 22% 11% 6%
Cheaper or freedelivery
A paymentmethod that I
can trust
Possibility toreturn productsor easy return
process
Shorterdelivery times
Loyalty rewards Easier-to-usewebsites
Betteravailability of
productinformation
More informationabout special o�ersand promotion or
advertising
Betterpackaging
If more of myfriends or
family do it
Cheaper or free delivery, a payment method they can trust and an easy return policy are the three most important improvements that would make them shop online more.
Source: E�ective Measure, December 2015-March 2016 www.e�ectivemeasure.com PAGE 32
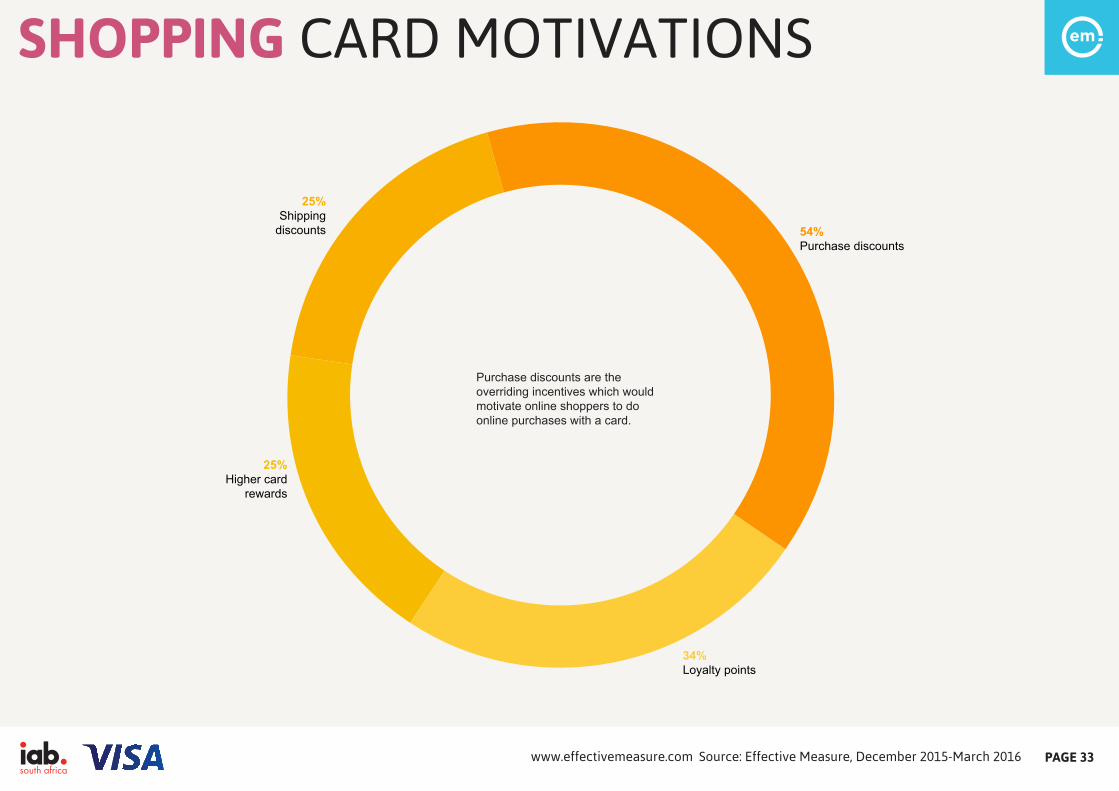
SHOPPING CARD MOTIVATIONS
Purchase discounts are the overriding incentives which would motivate online shoppers to do online purchases with a card.
54%Purchase discounts
34%Loyalty points
25%Higher card
rewards
25%Shipping
discounts
Source: E�ective Measure, December 2015-March 2016 www.e�ectivemeasure.com PAGE 33
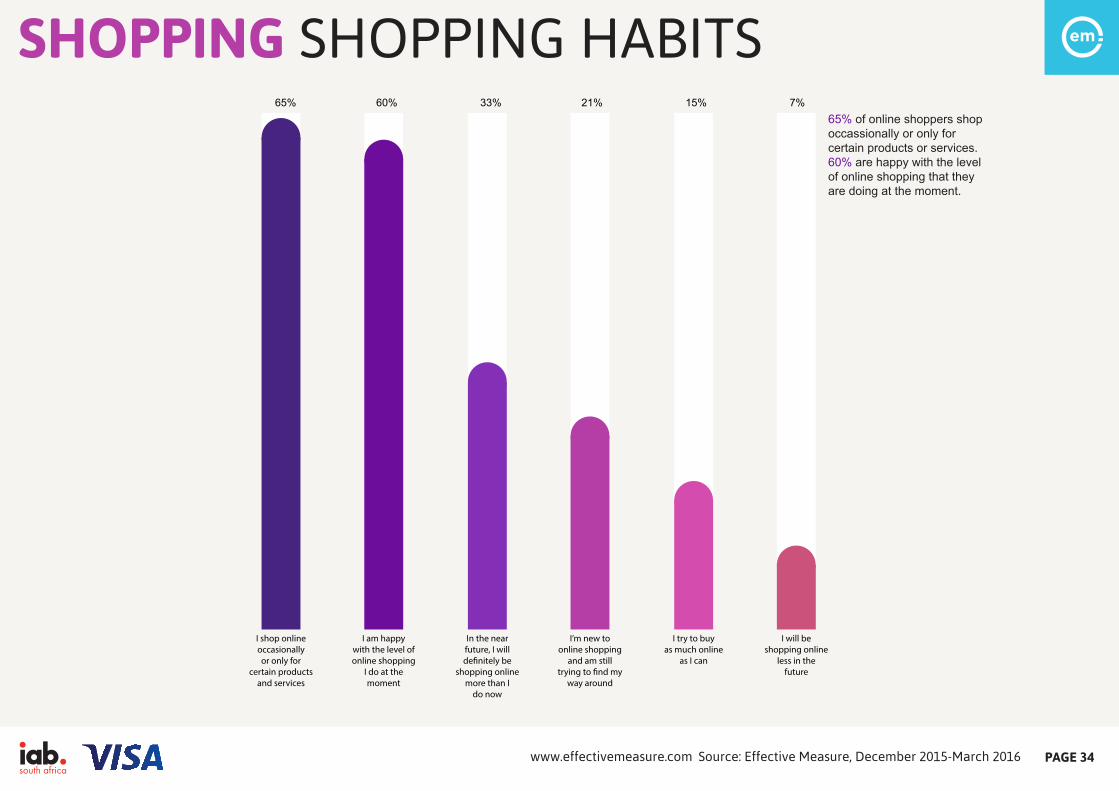
SHOPPING SHOPPING HABITS65% 60% 33% 21% 15% 7%
I shop onlineoccasionallyor only for
certain productsand services
I am happywith the level ofonline shopping
I do at themoment
In the nearfuture, I willde�nitely be
shopping onlinemore than I
do now
I’m new toonline shopping
and am stilltrying to �nd my
way around
I try to buyas much online
as I can
I will beshopping online
less in thefuture
65% of online shoppers shop occassionally or only for certain products or services. 60% are happy with the level of online shopping that they are doing at the moment.
Source: E�ective Measure, December 2015-March 2016 www.e�ectivemeasure.com PAGE 34
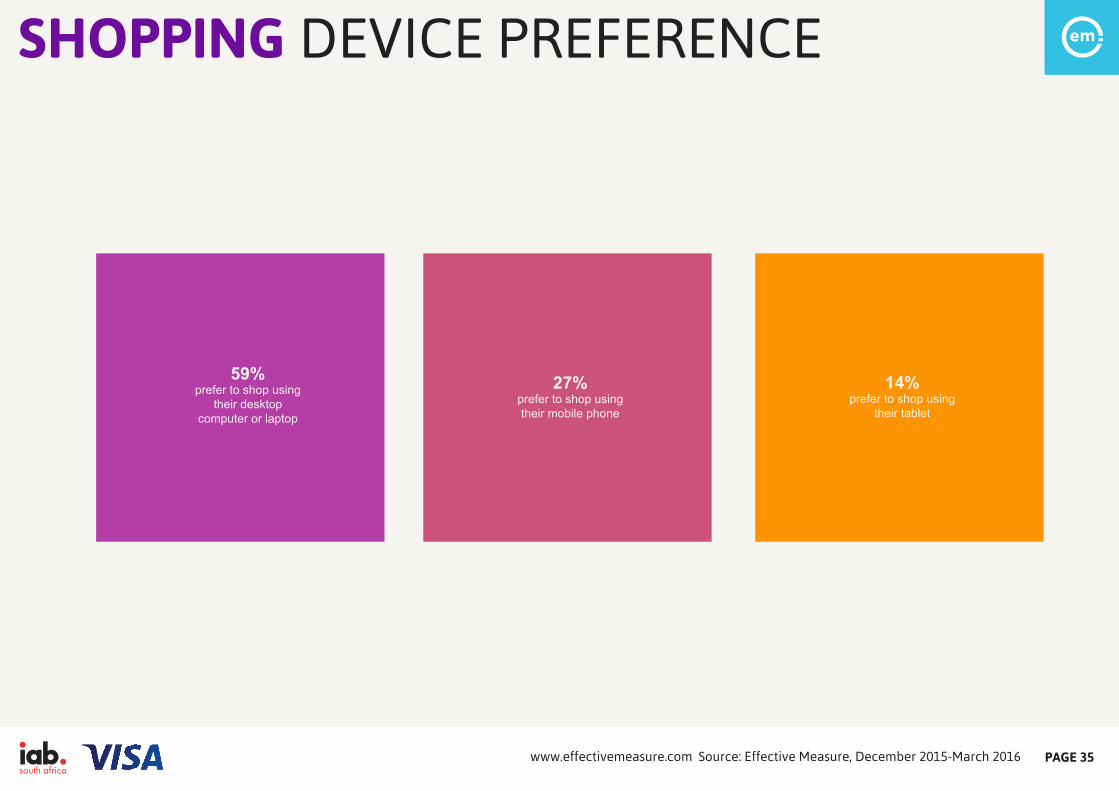
SHOPPING DEVICE PREFERENCE
59%prefer to shop using
their desktop computer or laptop
27%prefer to shop using their mobile phone
14%prefer to shop using
their tablet
Source: E�ective Measure, December 2015-March 2016 www.e�ectivemeasure.com PAGE 35
THOSE WHO NEVERSHOP ONLINE
Source: E�ective Measure, December 2015-March 2016 www.e�ectivemeasure.com PAGE 36
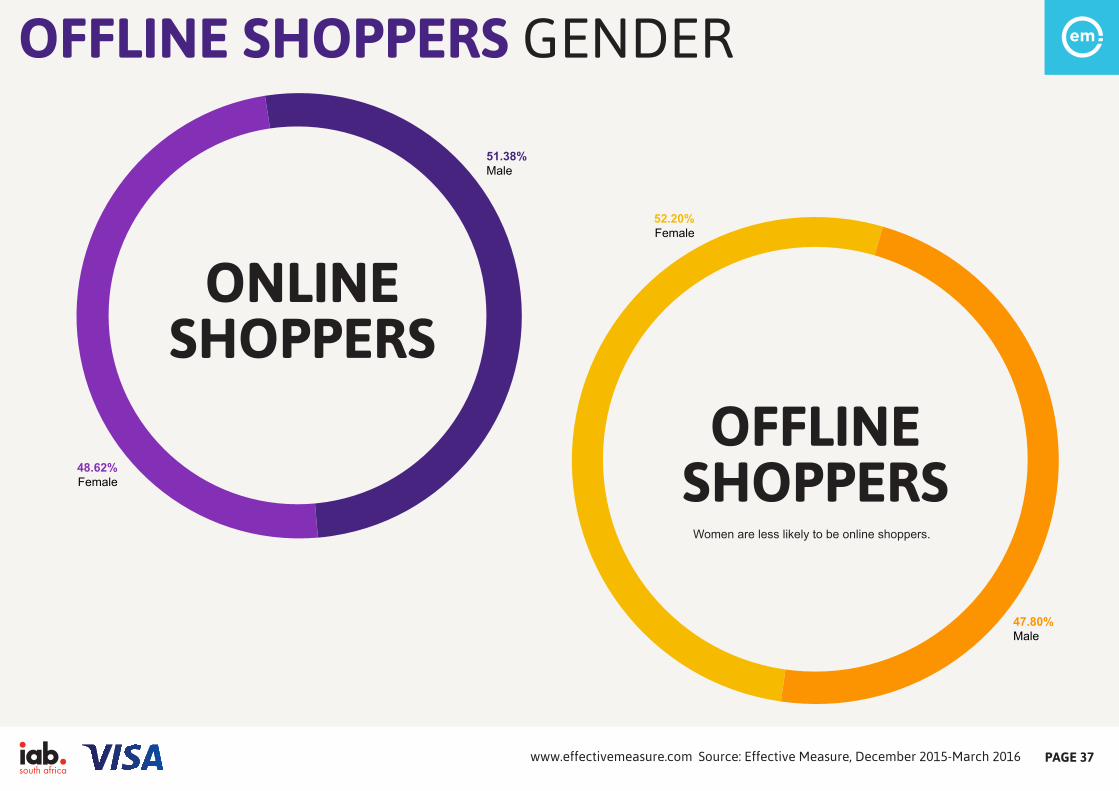
OFFLINE SHOPPERS GENDER
ONLINESHOPPERS
OFFLINESHOPPERS
51.38%Male
47.80%Male
48.62%Female
52.20%Female
Women are less likely to be online shoppers.
Source: E�ective Measure, December 2015-March 2016 www.e�ectivemeasure.com PAGE 37
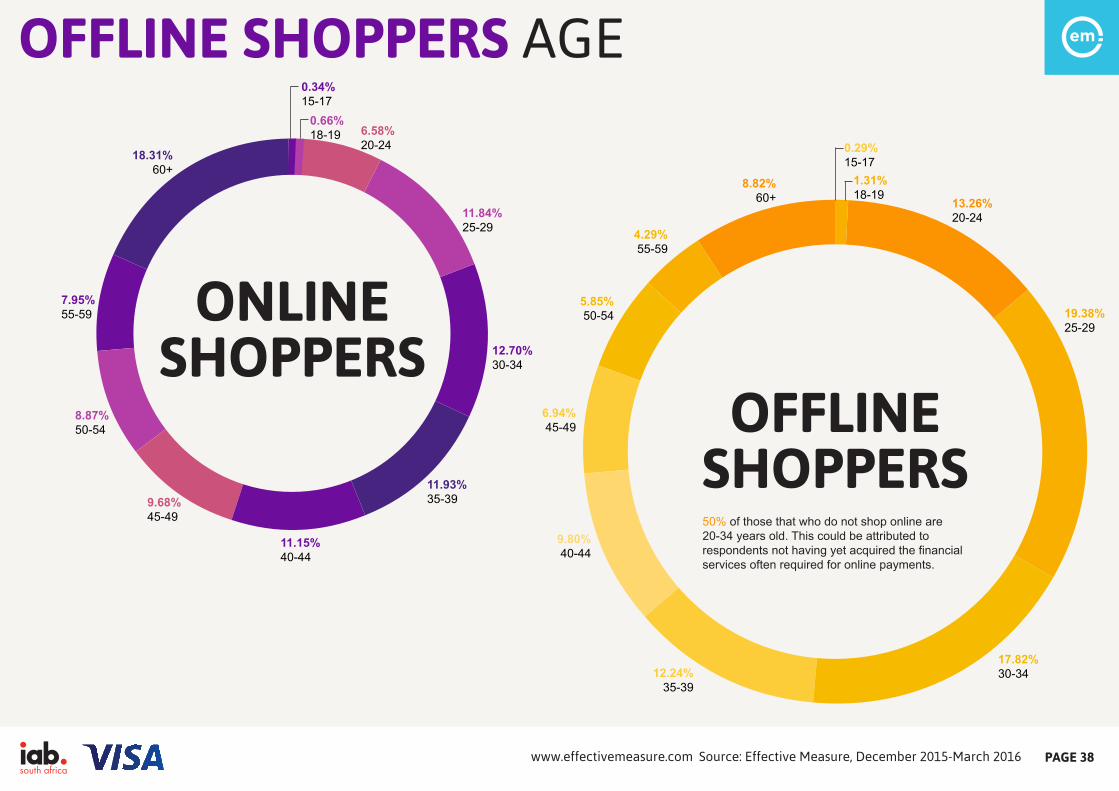
OFFLINE SHOPPERS AGE
ONLINESHOPPERS
0.34% 15-17
0.66% 18-19 6.58%
20-24
11.84% 25-29
12.70% 30-34
11.93% 35-39
11.15% 40-44
9.68% 45-49
8.87% 50-54
7.95% 55-59
18.31% 60+
OFFLINESHOPPERS50% of those that who do not shop online are 20-34 years old. This could be attributed to respondents not having yet acquired the financial services often required for online payments.
0.29% 15-17
1.31% 18-19
19.38% 25-29
13.26% 20-24
12.24% 35-39
9.80% 40-44
6.94% 45-49
5.85% 50-54
4.29% 55-59
8.82%60+
17.82% 30-34
Source: E�ective Measure, December 2015-March 2016 www.e�ectivemeasure.com PAGE 38
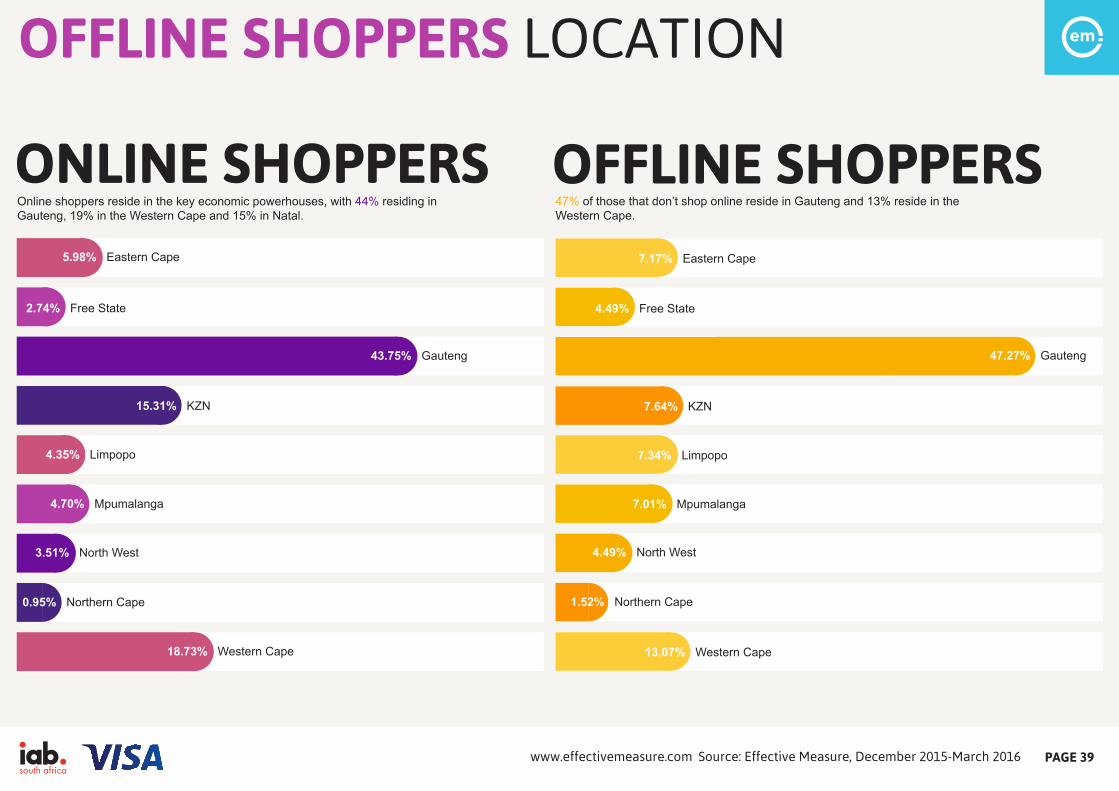
OFFLINE SHOPPERS LOCATION
OFFLINE SHOPPERSONLINE SHOPPERS5.98% Eastern Cape
2.74% Free State
0.95% Northern Cape
43.75% Gauteng
15.31% KZN
4.35% Limpopo
4.70% Mpumalanga
3.51% North West
18.73% Western Cape
47.27% Gauteng
7.17% Eastern Cape
4.49% Free State
7.64% KZN
7.34% Limpopo
7.01% Mpumalanga
4.49% North West
1.52% Northern Cape
13.07% Western Cape
Online shoppers reside in the key economic powerhouses, with 44% residing in Gauteng, 19% in the Western Cape and 15% in Natal.
47% of those that don’t shop online reside in Gauteng and 13% reside in the Western Cape.
Source: E�ective Measure, December 2015-March 2016 www.e�ectivemeasure.com PAGE 39
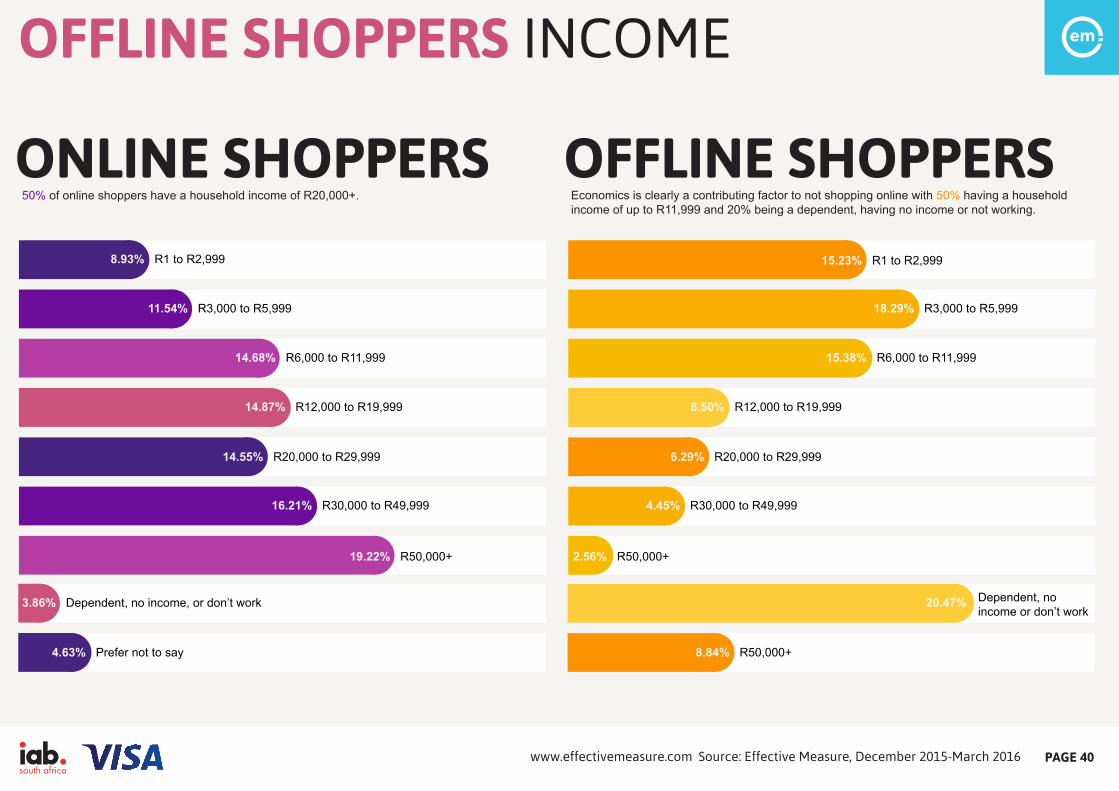
OFFLINE SHOPPERS INCOME
OFFLINE SHOPPERSONLINE SHOPPERS50% of online shoppers have a household income of R20,000+. Economics is clearly a contributing factor to not shopping online with 50% having a household
income of up to R11,999 and 20% being a dependent, having no income or not working.
8.93% R1 to R2,999
11.54% R3,000 to R5,999
14.68% R6,000 to R11,999
14.87% R12,000 to R19,999
14.55% R20,000 to R29,999
16.21% R30,000 to R49,999
19.22% R50,000+
15.23% R1 to R2,999
18.29% R3,000 to R5,999
15.38% R6,000 to R11,999
8.50% R12,000 to R19,999
6.29% R20,000 to R29,999
4.45% R30,000 to R49,999
2.56% R50,000+
3.86% Dependent, no income, or don’t work
4.63% Prefer not to say
20.47%
8.84% R50,000+
Dependent, noincome or don’t work
Source: E�ective Measure, December 2015-March 2016 www.e�ectivemeasure.com PAGE 40
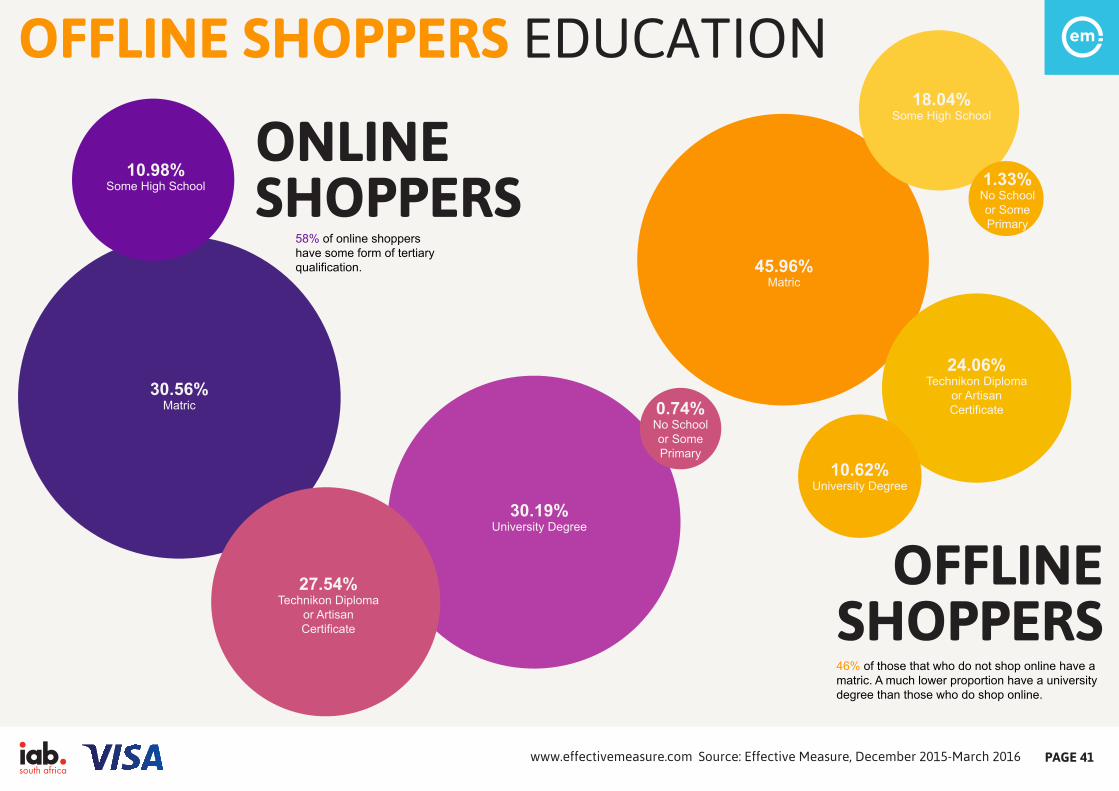
OFFLINE SHOPPERS EDUCATION
ONLINESHOPPERS
58% of online shoppers have some form of tertiary qualification.
OFFLINESHOPPERS46% of those that who do not shop online have a matric. A much lower proportion have a university degree than those who do shop online.
30.56%Matric
30.19%University Degree
27.54%Technikon Diploma
or ArtisanCertificate
10.98%Some High School
0.74%No Schoolor SomePrimary
1.33%No Schoolor SomePrimary
45.96%Matric
10.62%University Degree
24.06%Technikon Diploma
or ArtisanCertificate
18.04%Some High School
Source: E�ective Measure, December 2015-March 2016 www.e�ectivemeasure.com PAGE 41
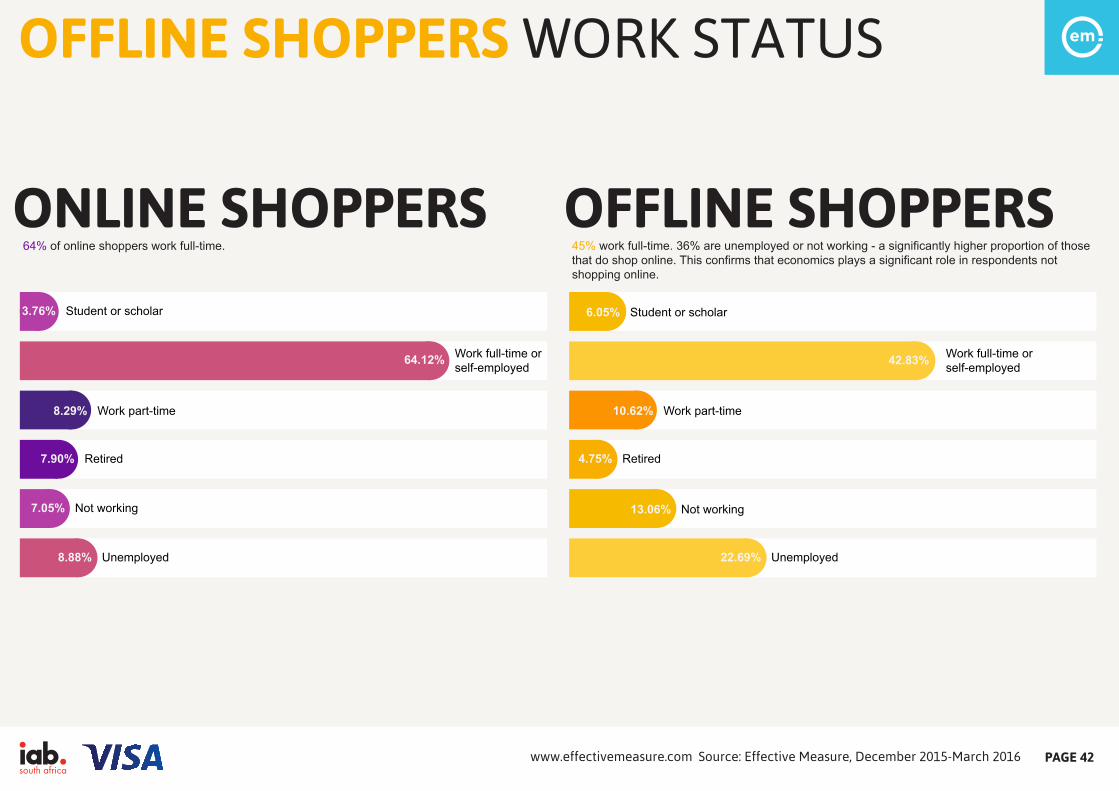
OFFLINE SHOPPERS WORK STATUS
OFFLINE SHOPPERSONLINE SHOPPERS64% of online shoppers work full-time. 45% work full-time. 36% are unemployed or not working - a significantly higher proportion of those
that do shop online. This confirms that economics plays a significant role in respondents not shopping online.
3.76% Student or scholar
64.12%
8.29% Work part-time
7.90% Retired
7.05% Not working
8.88% Unemployed
6.05% Student or scholar
42.83%
10.62% Work part-time
4.75% Retired
13.06% Not working
22.69% Unemployed
Work full-time orself-employed
Work full-time orself-employed
Source: E�ective Measure, December 2015-March 2016 www.e�ectivemeasure.com PAGE 42
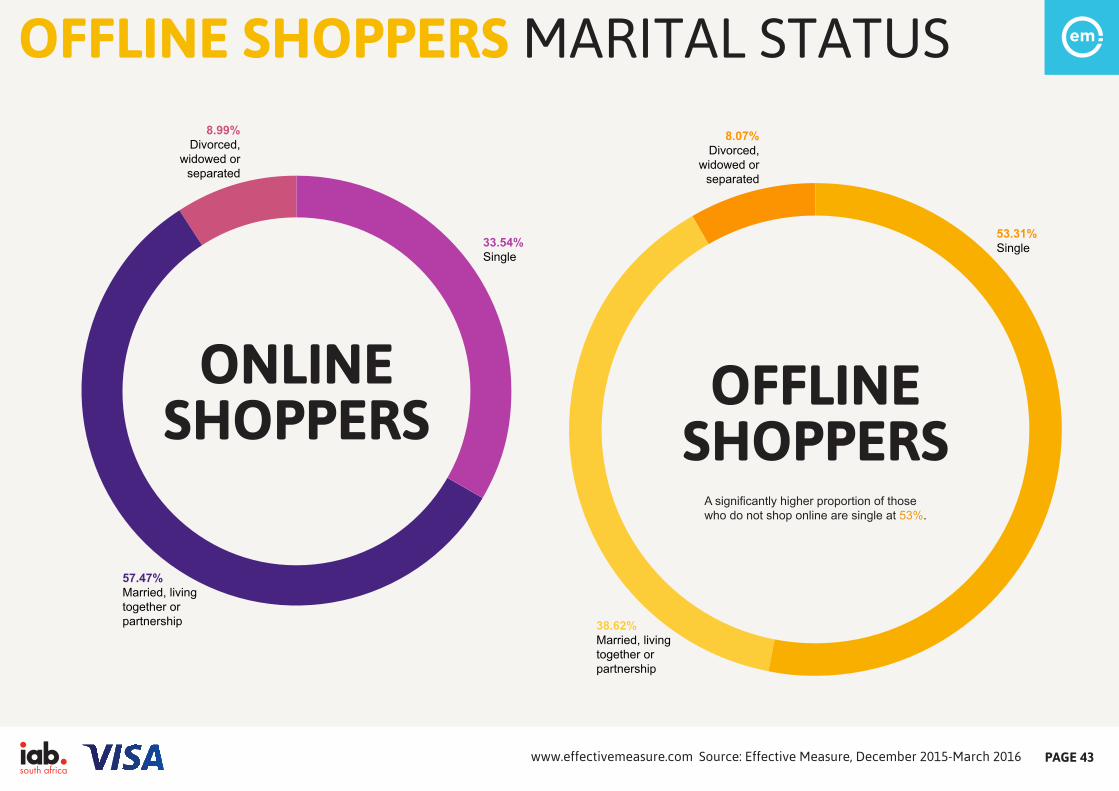
ONLINESHOPPERS
57.47%Married, living together or partnership
33.54% Single
8.99%Divorced,
widowed or separated
OFFLINE SHOPPERS MARITAL STATUS
A significantly higher proportion of those who do not shop online are single at 53%.
OFFLINESHOPPERS
53.31% Single
8.07%Divorced,
widowed or separated
38.62%Married, living together or partnership
Source: E�ective Measure, December 2015-March 2016 www.e�ectivemeasure.com PAGE 43
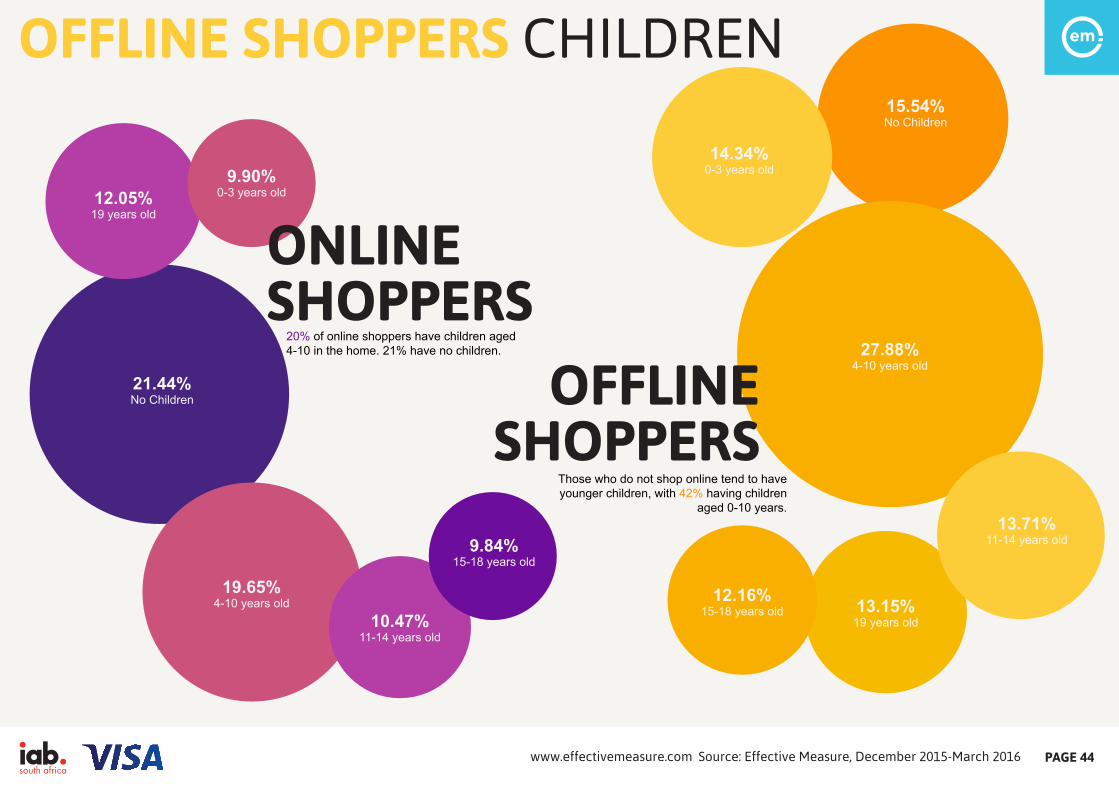
OFFLINE SHOPPERS CHILDREN
20% of online shoppers have children aged4-10 in the home. 21% have no children.
21.44%No Children
19.65%4-10 years old
12.05%19 years old
10.47%11-14 years old
9.90%0-3 years old
9.84%15-18 years old
15.54%No Children
27.88%4-10 years old
13.15%19 years old
13.71%11-14 years old
14.34%0-3 years old
12.16%15-18 years old
ONLINESHOPPERS
Those who do not shop online tend to have younger children, with 42% having children
aged 0-10 years.
OFFLINESHOPPERS
Source: E�ective Measure, December 2015-March 2016 www.e�ectivemeasure.com PAGE 44
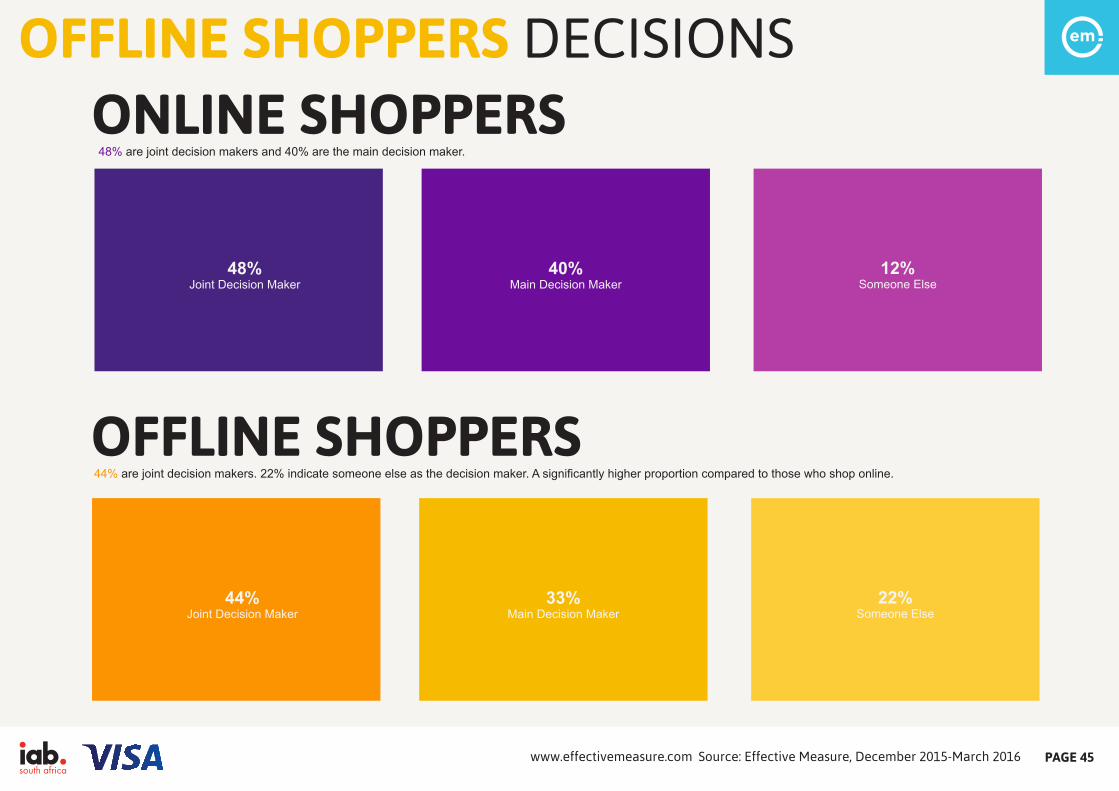
OFFLINE SHOPPERS DECISIONS
48%Joint Decision Maker
40%Main Decision Maker
12%Someone Else
44%Joint Decision Maker
33%Main Decision Maker
22%Someone Else
ONLINE SHOPPERS48% are joint decision makers and 40% are the main decision maker.
OFFLINE SHOPPERS44% are joint decision makers. 22% indicate someone else as the decision maker. A significantly higher proportion compared to those who shop online.
Source: E�ective Measure, December 2015-March 2016 www.e�ectivemeasure.com PAGE 45
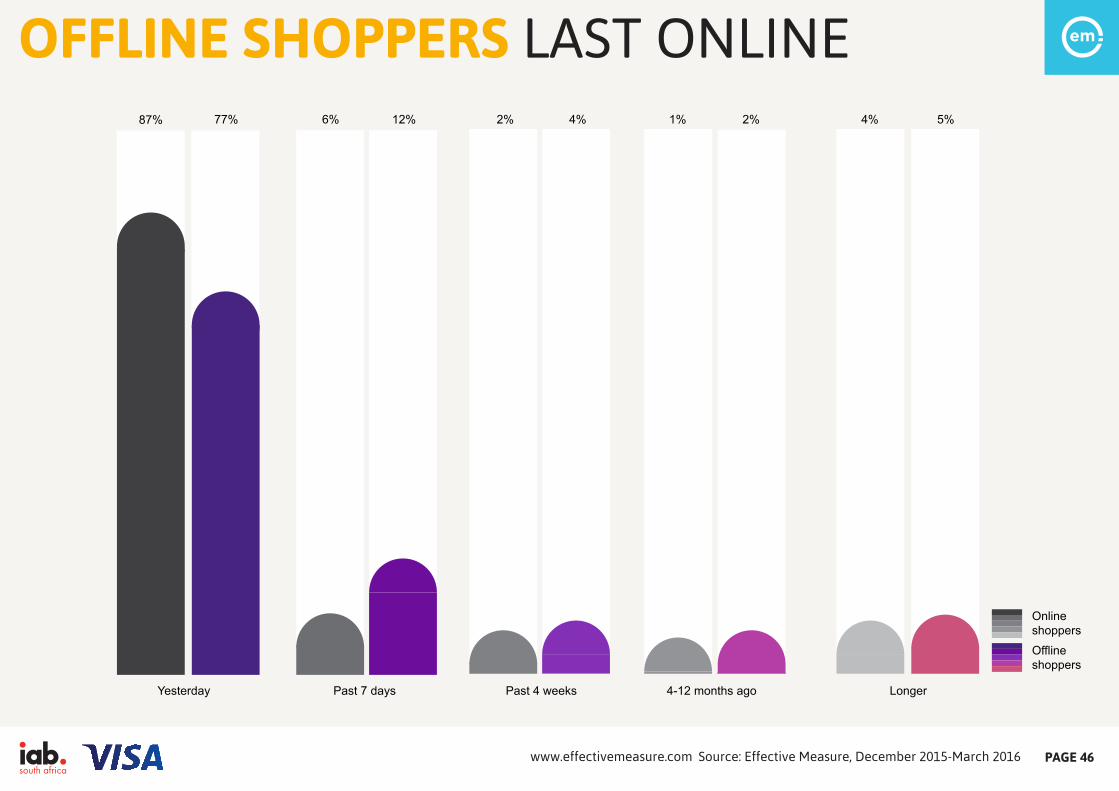
OFFLINE SHOPPERS LAST ONLINE87% 77% 6% 12% 2% 4% 1% 2% 4% 5%
Yesterday Past 7 days Past 4 weeks 4-12 months ago Longer
Offlineshoppers
Onlineshoppers
Source: E�ective Measure, December 2015-March 2016 www.e�ectivemeasure.com PAGE 46
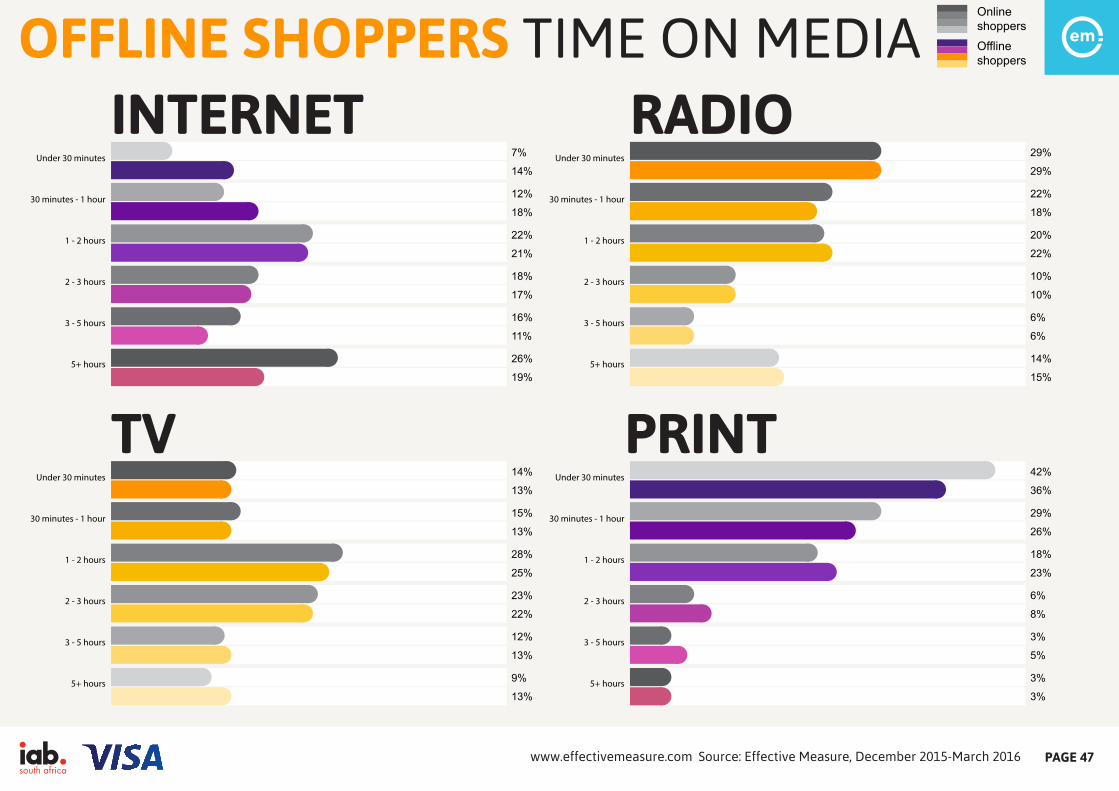
OFFLINE SHOPPERS TIME ON MEDIA
14%
13%
15%
13%
28%
25%
23%
22%
12%
13%
9%
13%
Under 30 minutes
30 minutes - 1 hour
1 - 2 hours
2 - 3 hours
3 - 5 hours
5+ hours
Offlineshoppers
Onlineshoppers
TV
7%
14%
12%
18%
22%
21%
18%
17%
16%
11%
26%
19%
Under 30 minutes
30 minutes - 1 hour
1 - 2 hours
2 - 3 hours
3 - 5 hours
5+ hours
INTERNET
42%
36%
29%
26%
18%
23%
6%
8%
3%
5%
3%
3%
Under 30 minutes
30 minutes - 1 hour
1 - 2 hours
2 - 3 hours
3 - 5 hours
5+ hours
29%
29%
22%
18%
20%
22%
10%
10%
6%
6%
14%
15%
Under 30 minutes
30 minutes - 1 hour
1 - 2 hours
2 - 3 hours
3 - 5 hours
5+ hours
RADIO
Source: E�ective Measure, December 2015-March 2016 www.e�ectivemeasure.com PAGE 47
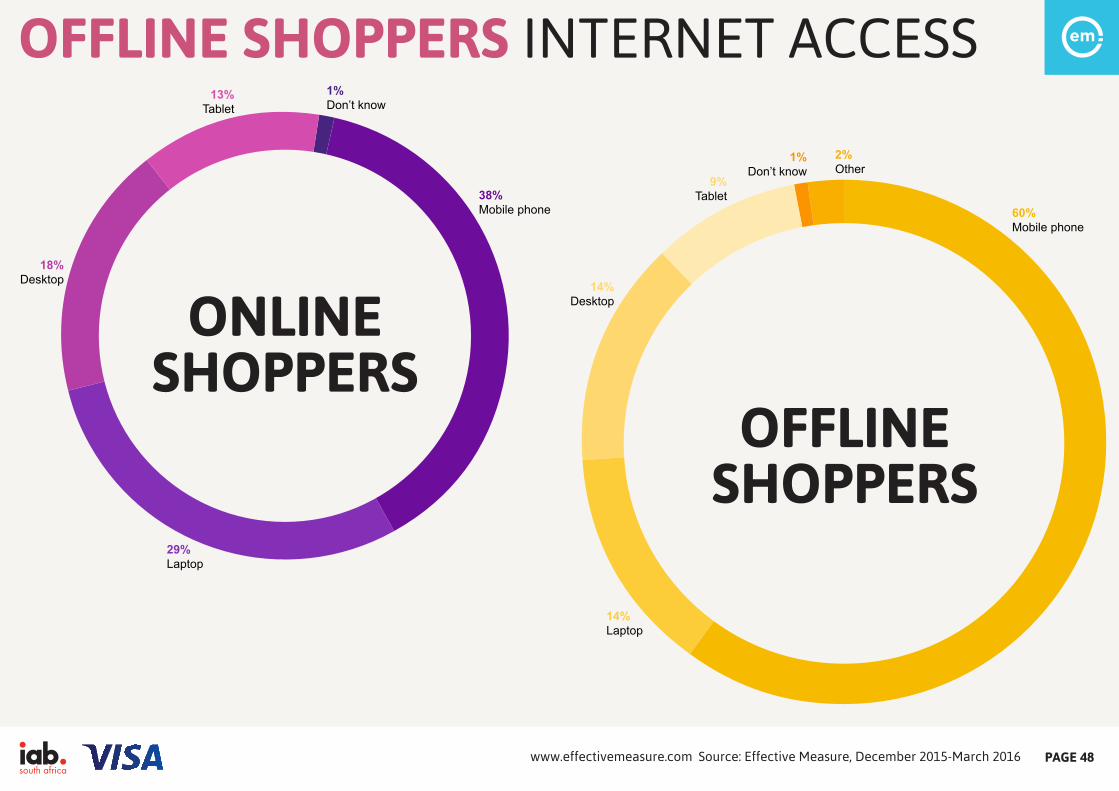
OFFLINE SHOPPERS INTERNET ACCESS
ONLINESHOPPERS
OFFLINESHOPPERS
38% Mobile phone
29% Laptop
18% Desktop
13%Tablet
1% Don’t know
60%Mobile phone
14%Laptop
14%Desktop
9%Tablet
1%Don’t know
2%Other
Source: E�ective Measure, December 2015-March 2016 www.e�ectivemeasure.com PAGE 48
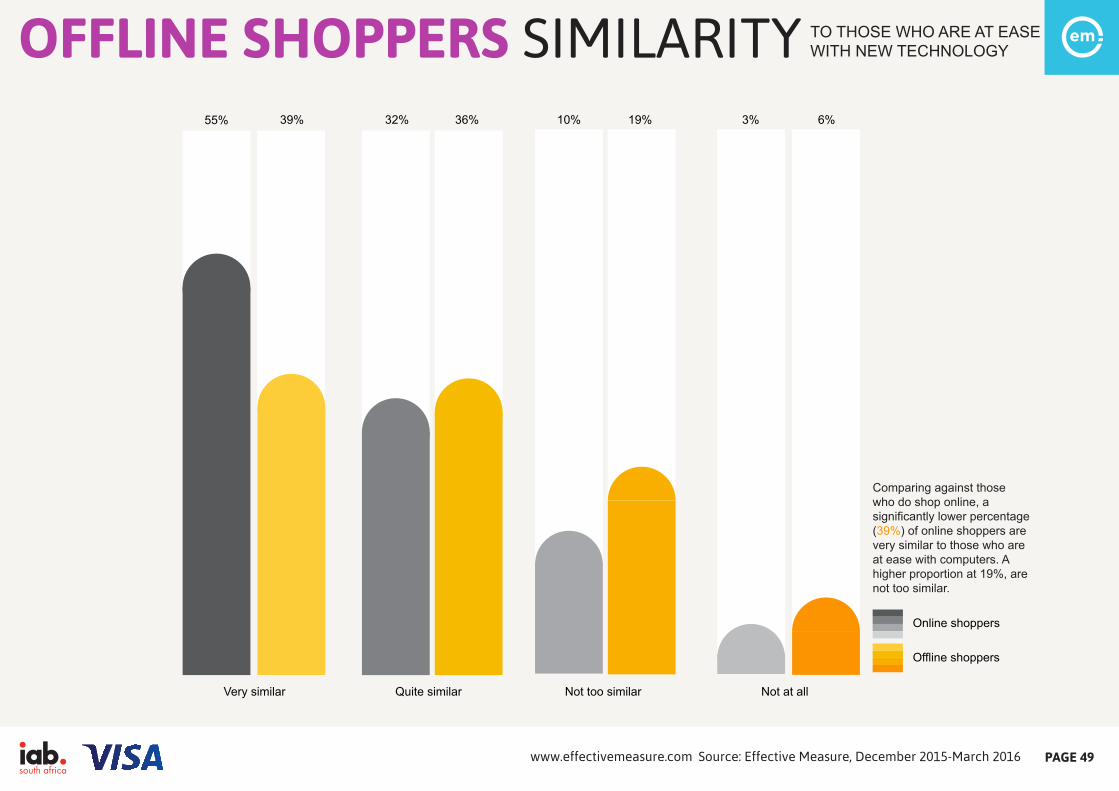
OFFLINE SHOPPERS SIMILARITY TO THOSE WHO ARE AT EASE WITH NEW TECHNOLOGY
55% 39% 32% 36% 10% 19% 3% 6%
Very similar Quite similar Not too similar Not at all
Offline shoppers
Online shoppers
Comparing against those who do shop online, a significantly lower percentage (39%) of online shoppers are very similar to those who are at ease with computers. A higher proportion at 19%, are not too similar.
Source: E�ective Measure, December 2015-March 2016 www.e�ectivemeasure.com PAGE 49
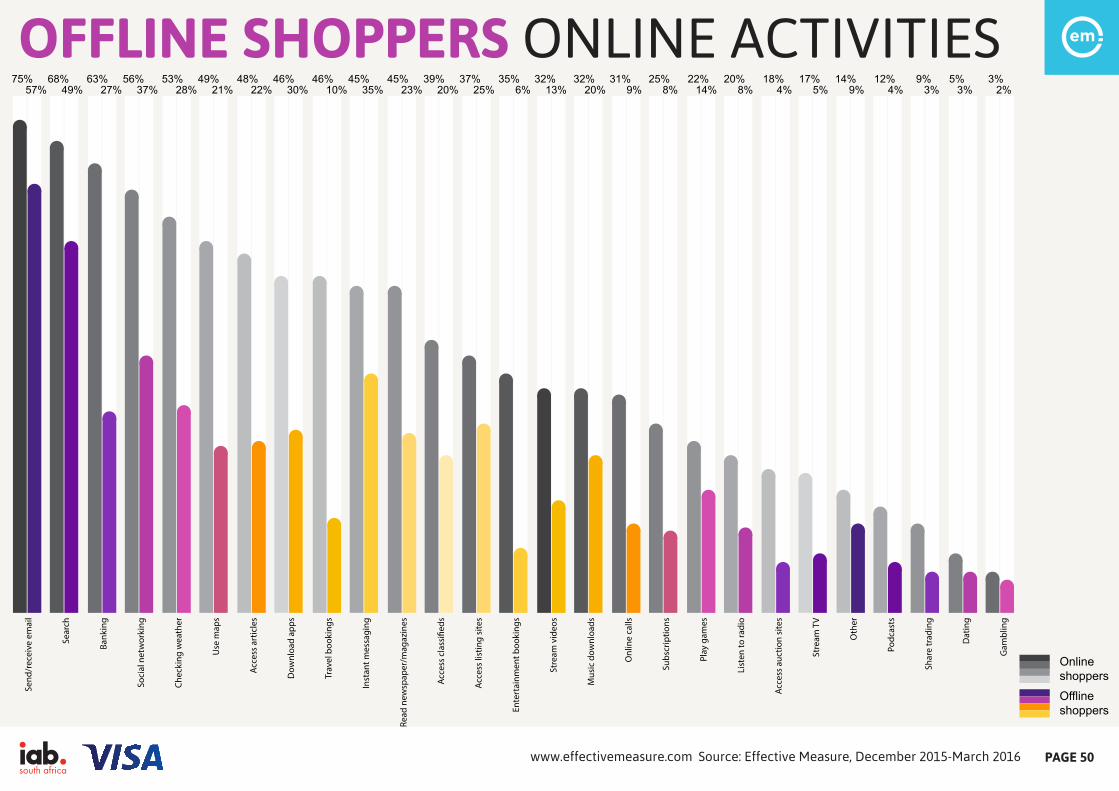
OFFLINE SHOPPERS ONLINE ACTIVITIES75% 68% 63% 56% 53% 49% 48% 46% 46% 45% 45% 39% 37% 35% 32% 32% 31% 25% 22% 20% 18% 17% 14% 12% 9% 5% 3%
Send
/rec
eive
em
ail
Sear
ch
Bank
ing
Soci
al n
etw
orki
ng
Chec
king
wea
ther
Use
map
s
Acce
ss a
rtic
les
Dow
nloa
d ap
ps
Trav
el b
ooki
ngs
Inst
ant m
essa
ging
Read
new
spap
er/m
agaz
ines
Acce
ss c
lass
i�ed
s
Acce
ss li
stin
g si
tes
Ente
rtai
nmen
t boo
king
s
Stre
am v
ideo
s
Mus
ic d
ownl
oads
Onl
ine
calls
Subs
crip
tions
Play
gam
es
List
en to
radi
o
Acce
ss a
uctio
n si
tes
Stre
am T
V
Oth
er
Podc
asts
Shar
e tr
adin
g
Dat
ing
Gam
blin
g
Offlineshoppers
Onlineshoppers
57% 49% 27% 37% 28% 21% 22% 30% 10% 35% 23% 20% 25% 6% 13% 20% 9% 8% 14% 8% 4% 5% 9% 4% 3% 3% 2%
Source: E�ective Measure, December 2015-March 2016 www.e�ectivemeasure.com PAGE 50
OFFLINE SHOPPERS REASONING
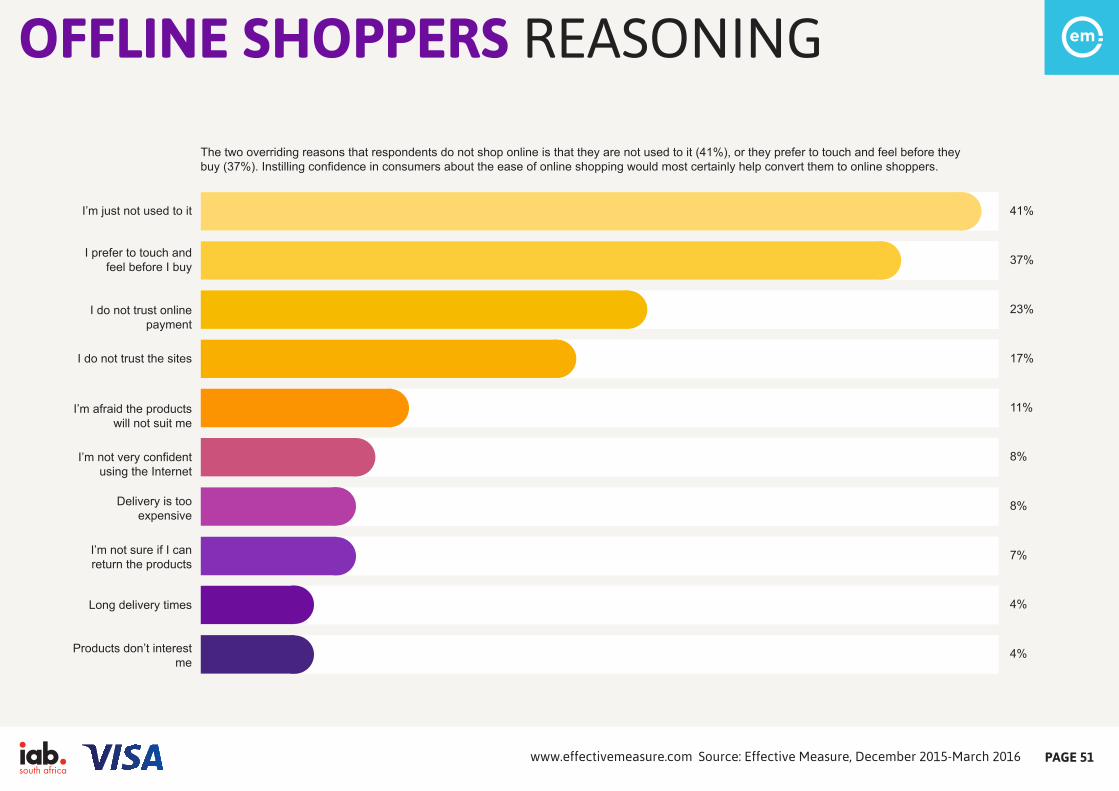
The two overriding reasons that respondents do not shop online is that they are not used to it (41%), or they prefer to touch and feel before they buy (37%). Instilling confidence in consumers about the ease of online shopping would most certainly help convert them to online shoppers.
I’m just not used to it 41%
I prefer to touch and feel before I buy
I do not trust online payment
I do not trust the sites
I’m afraid the products will not suit me
I’m not very confident using the Internet
37%
23%
17%
11%
8%
Delivery is too expensive
8%
I’m not sure if I can return the products
7%
Long delivery times 4%
Products don’t interest me
4%
Source: E�ective Measure, December 2015-March 2016 www.e�ectivemeasure.com PAGE 51
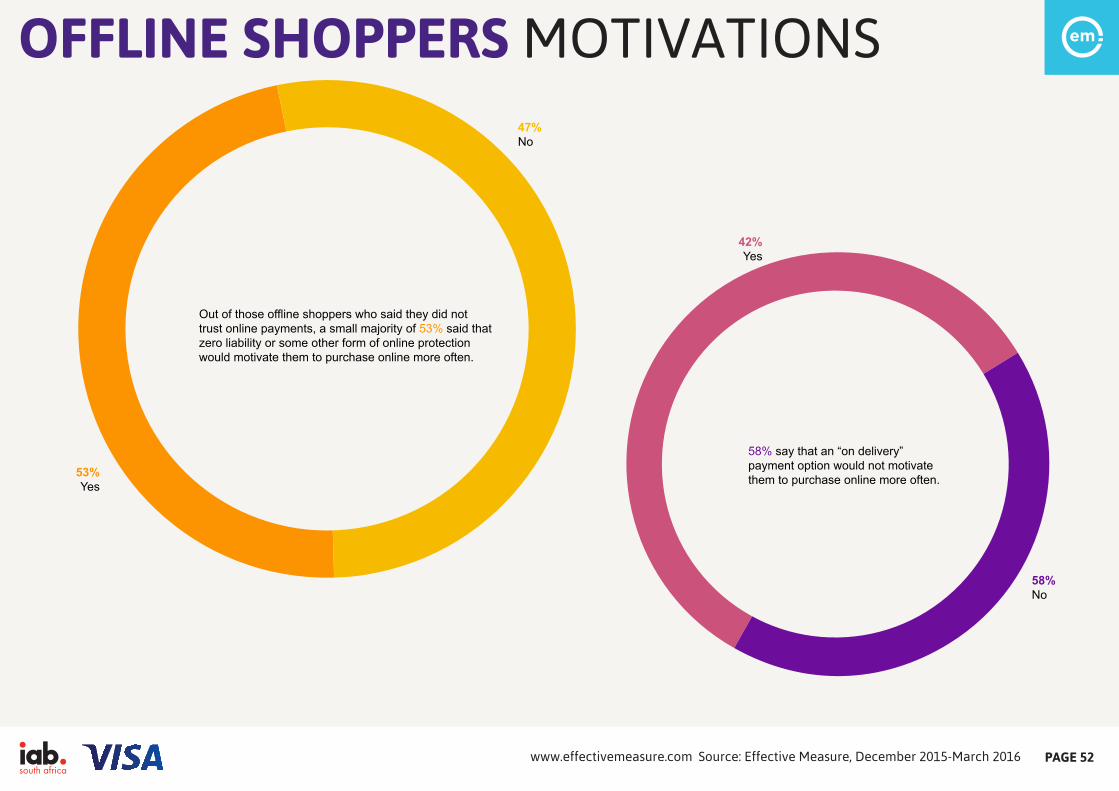
OFFLINE SHOPPERS MOTIVATIONS
53%Yes
47%No
Out of those offline shoppers who said they did not trust online payments, a small majority of 53% said that zero liability or some other form of online protection would motivate them to purchase online more often.
58%No
42%Yes
58% say that an “on delivery” payment option would not motivate them to purchase online more often.
Source: E�ective Measure, December 2015-March 2016 www.e�ectivemeasure.com PAGE 52
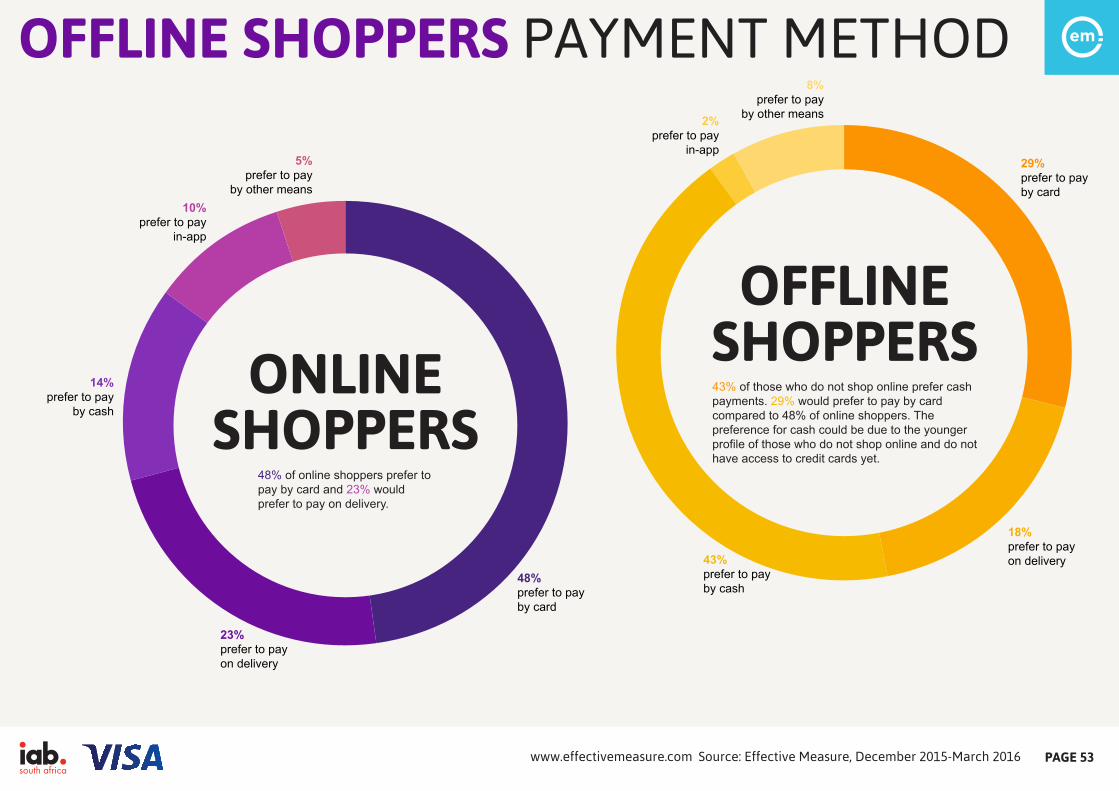
OFFLINE SHOPPERS PAYMENT METHOD
48%prefer to payby card
48% of online shoppers prefer to pay by card and 23% would prefer to pay on delivery.
23%prefer to payon delivery
14%prefer to pay
by cash
10%prefer to pay
in-app
5%prefer to pay
by other means
ONLINESHOPPERS
43% of those who do not shop online prefer cash payments. 29% would prefer to pay by card compared to 48% of online shoppers. Thepreference for cash could be due to the younger profile of those who do not shop online and do not have access to credit cards yet.
OFFLINESHOPPERS
29%prefer to payby card
18%prefer to payon delivery43%
prefer to payby cash
2%prefer to pay
in-app
8%prefer to pay
by other means
Source: E�ective Measure, December 2015-March 2016 www.e�ectivemeasure.com PAGE 53
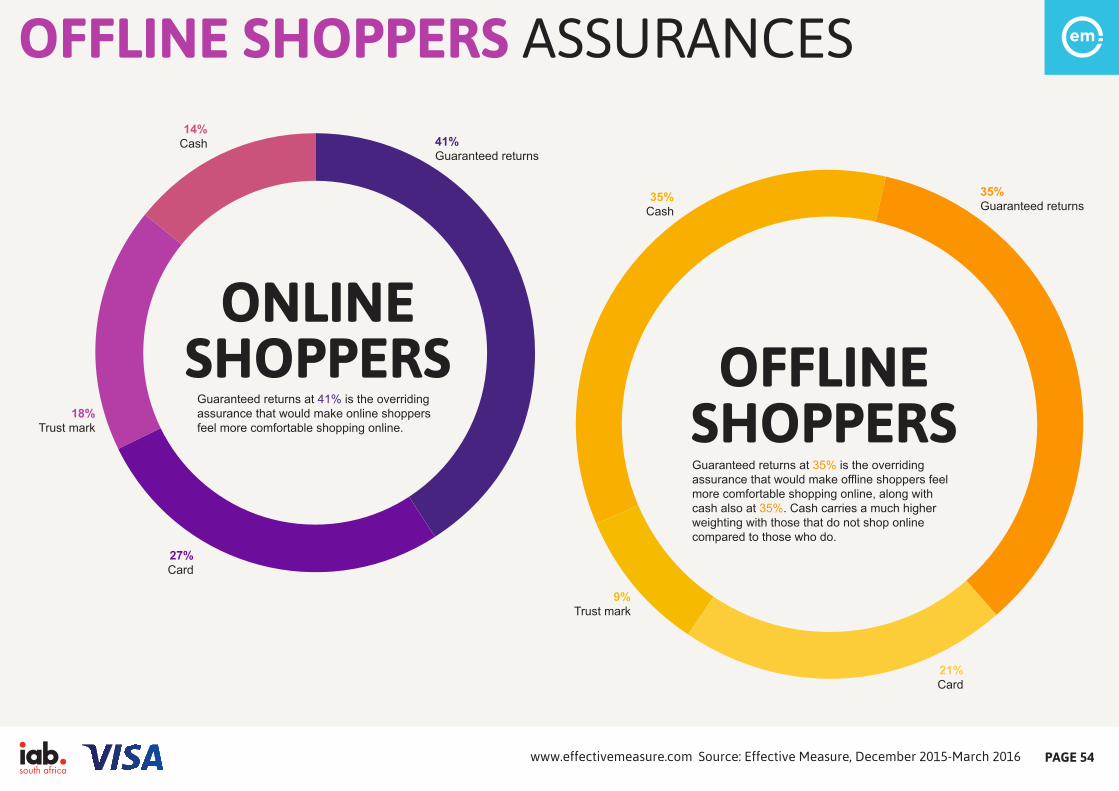
OFFLINE SHOPPERS ASSURANCES
Guaranteed returns at 41% is the overridingassurance that would make online shoppersfeel more comfortable shopping online.
14%Cash
18%Trust mark
27%Card
41%Guaranteed returns
ONLINESHOPPERS OFFLINE
SHOPPERSGuaranteed returns at 35% is the overriding assurance that would make offline shoppers feel more comfortable shopping online, along with cash also at 35%. Cash carries a much higher weighting with those that do not shop online compared to those who do.
35%Guaranteed returns
35%Cash
9%Trust mark
21%Card
Source: E�ective Measure, December 2015-March 2016 www.e�ectivemeasure.com PAGE 54
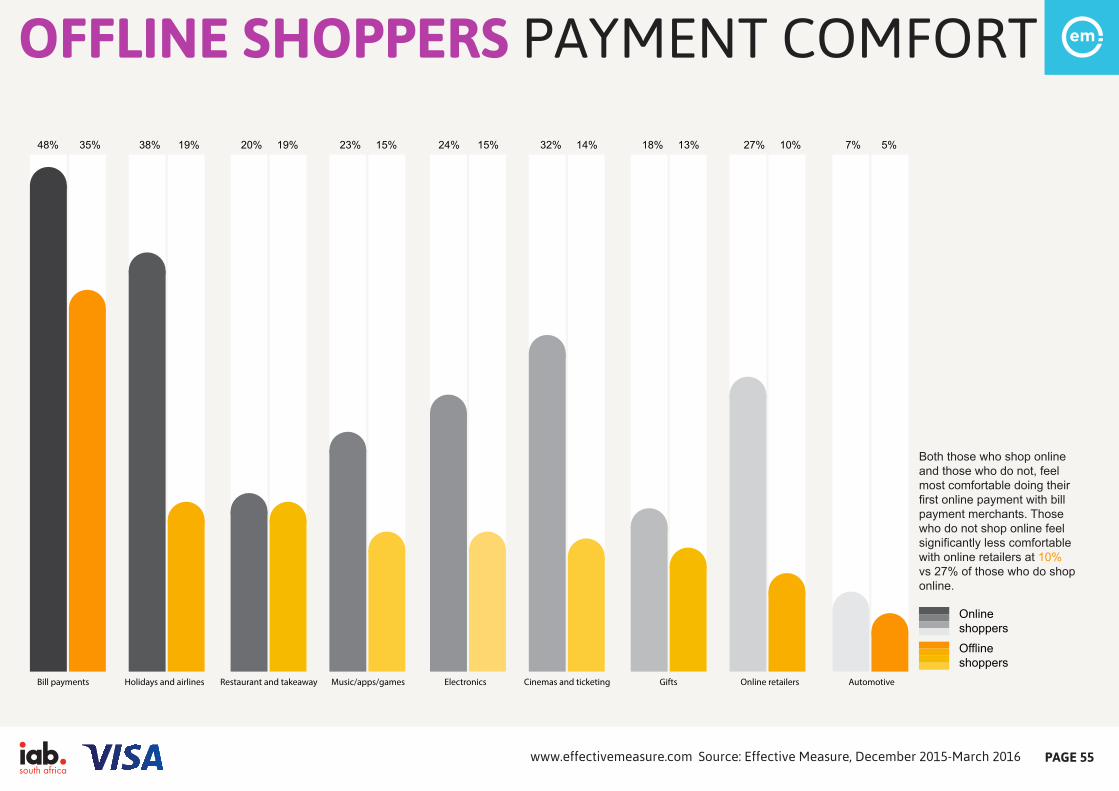
OFFLINE SHOPPERS PAYMENT COMFORT
Bill payments Holidays and airlines Restaurant and takeaway Music/apps/games Electronics Cinemas and ticketing Gifts Online retailers Automotive
48% 35% 38% 19% 20% 19% 23% 15% 24% 15% 32% 14% 18% 13% 27% 10% 7% 5%
Offlineshoppers
Onlineshoppers
Both those who shop online and those who do not, feel most comfortable doing their first online payment with bill payment merchants. Those who do not shop online feel significantly less comfortable with online retailers at 10% vs 27% of those who do shop online.
Source: E�ective Measure, December 2015-March 2016 www.e�ectivemeasure.com PAGE 55
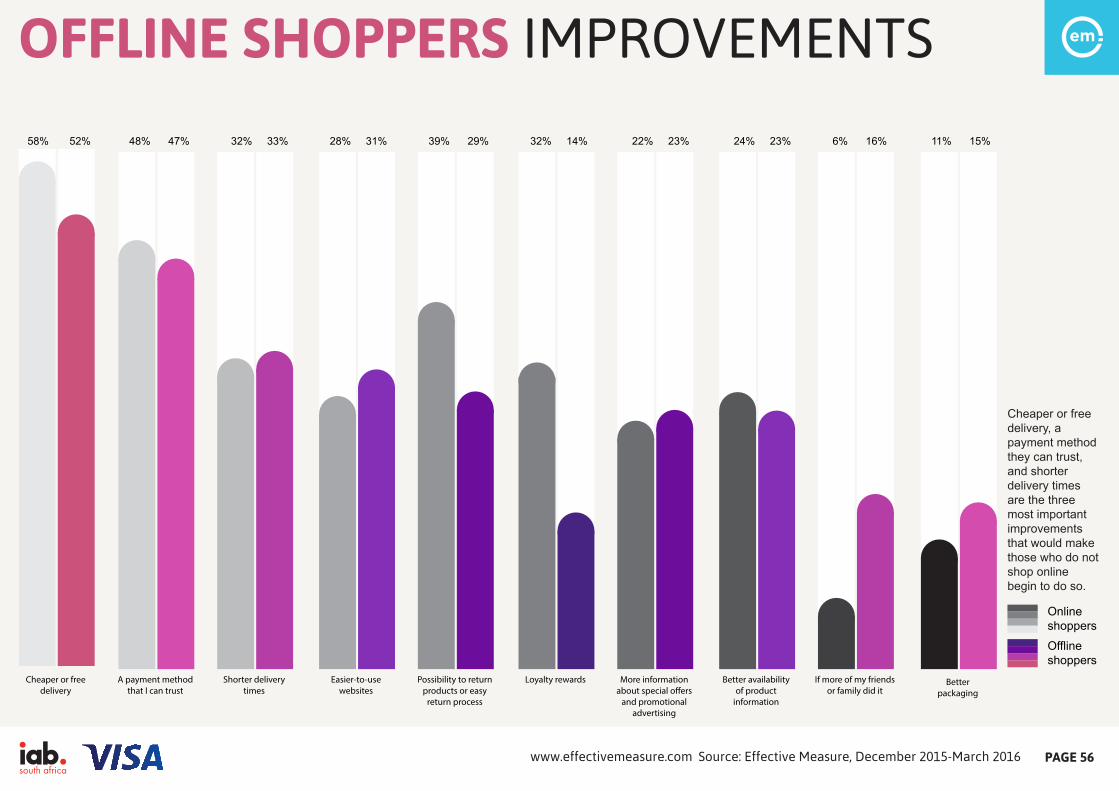
OFFLINE SHOPPERS IMPROVEMENTS
Cheaper or freedelivery
58% 52% 48% 47% 32% 33% 28% 31% 39% 29% 32% 14% 22% 23% 24% 23% 6% 16% 11% 15%
Offlineshoppers
Onlineshoppers
Cheaper or free delivery, a payment method they can trust, and shorter delivery times are the three most important improvements that would make those who do not shop online begin to do so.
A payment methodthat I can trust
Shorter deliverytimes
Easier-to-usewebsites
Possibility to returnproducts or easy
return process
Loyalty rewards More informationabout special o�ers
and promotionaladvertising
Better availabilityof product
information
If more of my friendsor family did it
Betterpackaging
Source: E�ective Measure, December 2015-March 2016 www.e�ectivemeasure.com PAGE 56
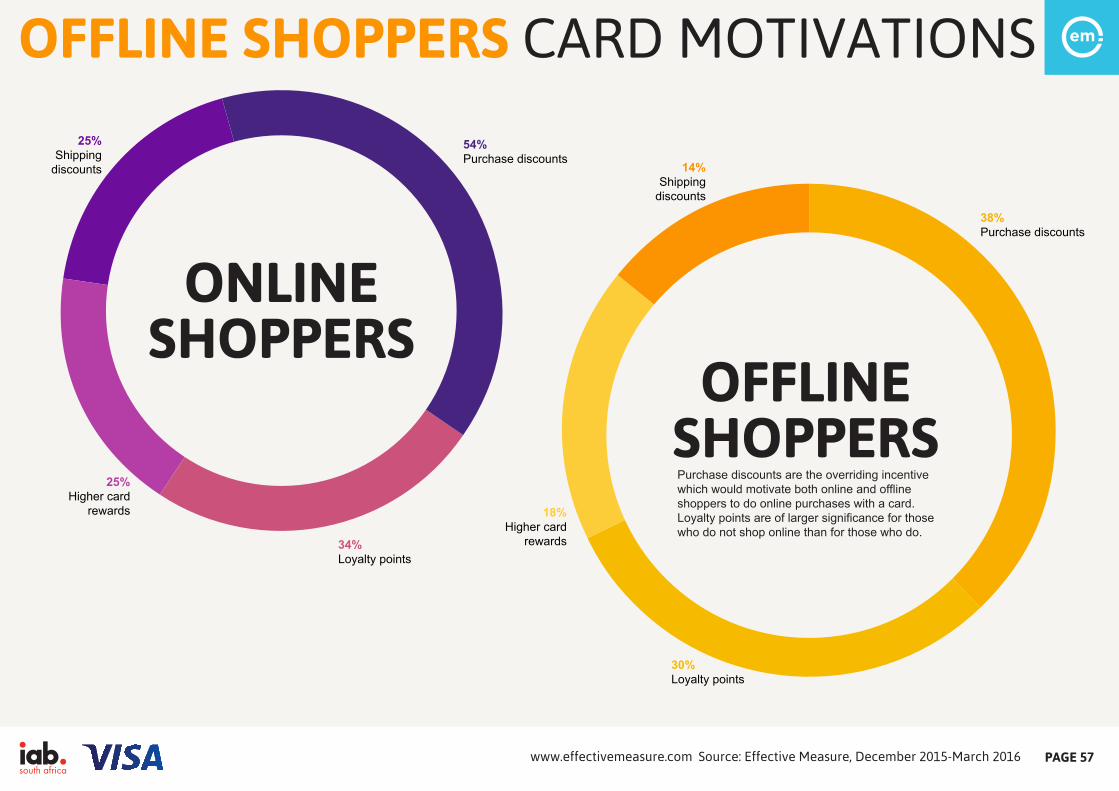
OFFLINE SHOPPERS CARD MOTIVATIONS
54%Purchase discounts
34%Loyalty points
25%Higher card
rewards
25%Shipping
discounts
ONLINESHOPPERS
OFFLINESHOPPERS
38%Purchase discounts
30%Loyalty points
18%Higher card
rewards
14%Shipping
discounts
Purchase discounts are the overriding incentive which would motivate both online and offline shoppers to do online purchases with a card. Loyalty points are of larger significance for those who do not shop online than for those who do.
Source: E�ective Measure, December 2015-March 2016 www.e�ectivemeasure.com PAGE 57
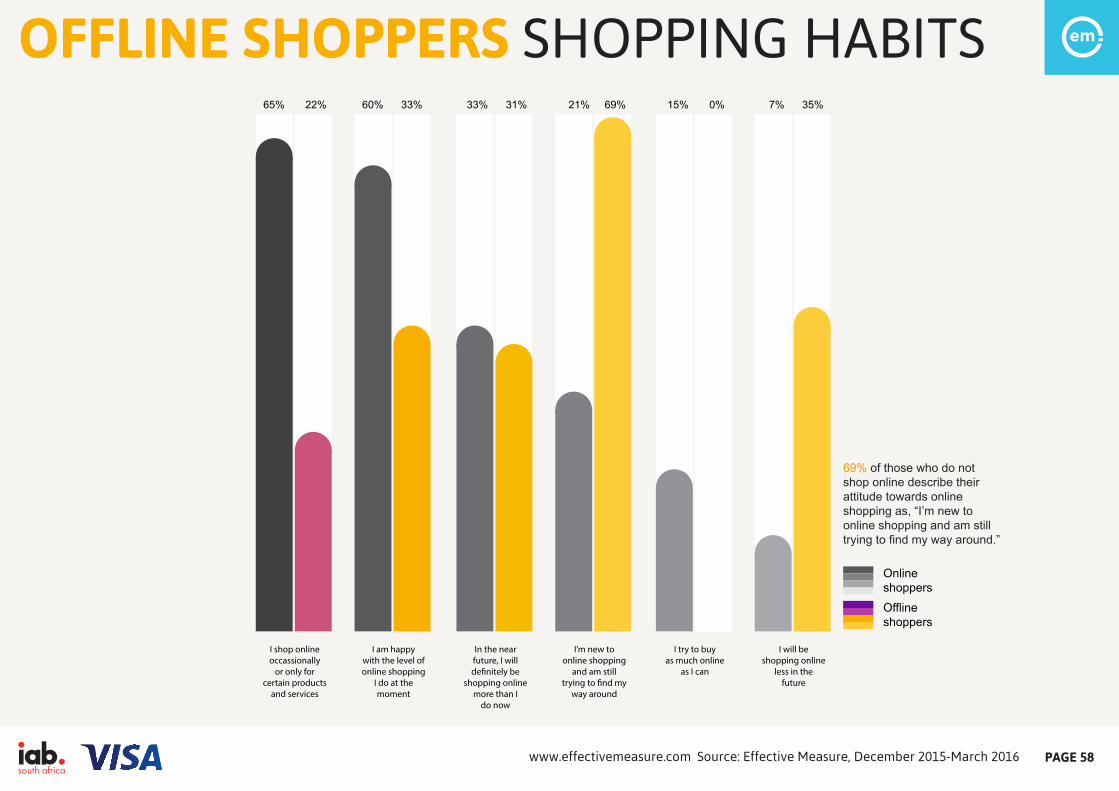
OFFLINE SHOPPERS SHOPPING HABITS 65% 22% 60% 33% 33% 31% 21% 69% 15% 0% 7% 35%
Offlineshoppers
Onlineshoppers
69% of those who do not shop online describe their attitude towards online shopping as, “I’m new to online shopping and am still trying to find my way around.”
I shop onlineoccassionally
or only forcertain products
and services
I am happywith the level ofonline shopping
I do at themoment
In the nearfuture, I willde�nitely be
shopping onlinemore than I
do now
I’m new toonline shopping
and am stilltrying to �nd my
way around
I try to buyas much online
as I can
I will beshopping online
less in thefuture
Source: E�ective Measure, December 2015-March 2016 www.e�ectivemeasure.com PAGE 58
APPENDIX SURVEY DEMOGRAPHICS
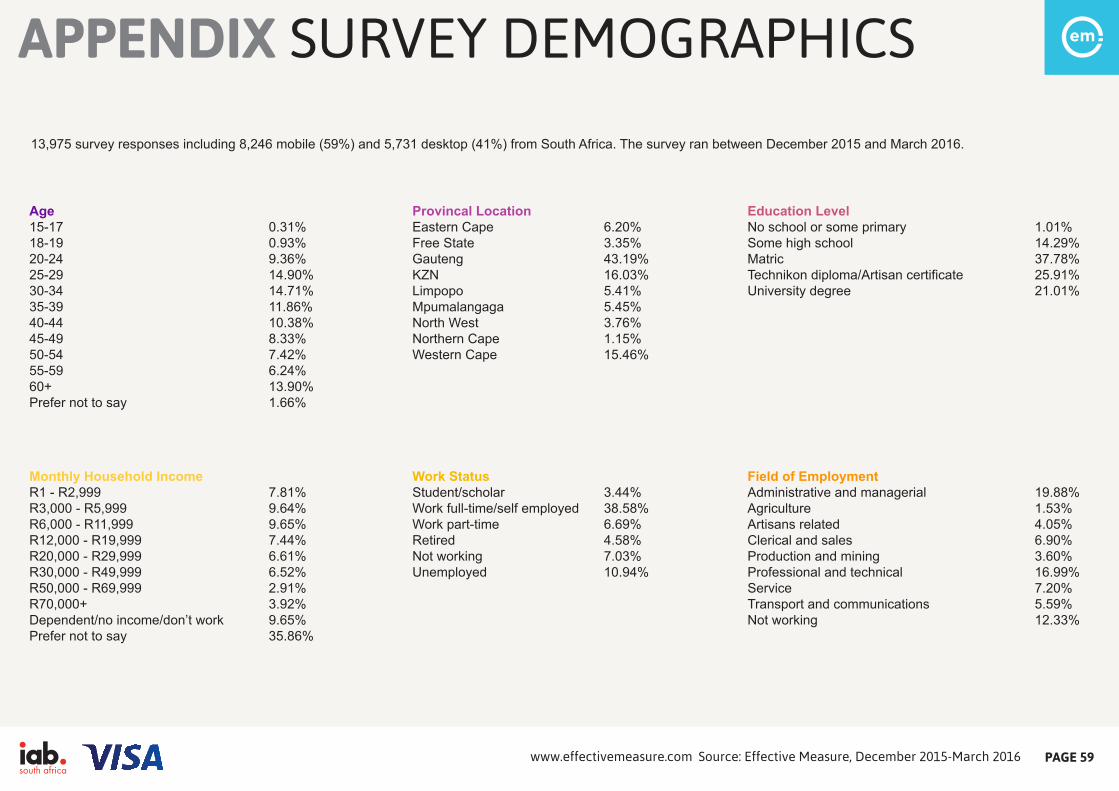
Age Provincal Location Education Level15-17 0.31% Eastern Cape 6.20% No school or some primary 1.01%18-19 0.93% Free State 3.35% Some high school 14.29%20-24 9.36% Gauteng 43.19% Matric 37.78%25-29 14.90% KZN 16.03% Technikon diploma/Artisan certificate 25.91%30-34 14.71% Limpopo 5.41% University degree 21.01%35-39 11.86% Mpumalangaga 5.45%40-44 10.38% North West 3.76%45-49 8.33% Northern Cape 1.15%50-54 7.42% Western Cape 15.46%55-59 6.24%60+ 13.90%Prefer not to say 1.66%
Monthly Household Income Work Status Field of EmploymentR1 - R2,999 7.81% Student/scholar 3.44% Administrative and managerial 19.88%R3,000 - R5,999 9.64% Work full-time/self employed 38.58% Agriculture 1.53%R6,000 - R11,999 9.65% Work part-time 6.69% Artisans related 4.05%R12,000 - R19,999 7.44% Retired 4.58% Clerical and sales 6.90%R20,000 - R29,999 6.61% Not working 7.03% Production and mining 3.60%R30,000 - R49,999 6.52% Unemployed 10.94% Professional and technical 16.99%R50,000 - R69,999 2.91% Service 7.20%R70,000+ 3.92% Transport and communications 5.59% Dependent/no income/don’t work 9.65% Not working 12.33%Prefer not to say 35.86%
13,975 survey responses including 8,246 mobile (59%) and 5,731 desktop (41%) from South Africa. The survey ran between December 2015 and March 2016.
Source: E�ective Measure, December 2015-March 2016 www.e�ectivemeasure.com PAGE 59
ABOUT
Effective Measure is a leading provider of digital audience, brand andadvertising effectiveness measurement and targeting solutions, bringingbest practice online measurement data to premium publishers, agencies,networks, advertisers and researchers. The EM solutions offer brands, mediaand agencies invested in Oceania, Europe, Southeast Asia, Middle East NorthAfrica and South Africa, a clear insight into their online audience and theever-growing Internet population. www.effectivemeasure.com.
ABOUT EFFECTIVE MEASUREThe Interactive Advertising Bureau South Africa, formerly the DMMA, is anindependent, voluntary, non-profit association focused on growing andsustaining a vibrant and profitable digital industry within South Africa. TheIAB South Africa represents the digital industry across all sectors including themedia, the marketing community, government and the public, and also acts asthe channel through which international bodies can enter the South Africandigital market. The IAB South Africa currently represents over 96 local onlinepublishers and over 93 creative, media and digital agencies, between themaccounting for more than 16 million local unique browsers and 440 million pageimpressions. The IAB South Africa strives to provide members with a platformthrough which they can engage, interact and address digital issues of commoninterest, thereby stimulating learning and commerce within the South Africandigital space.
To find out more about the IAB South Africa, visit the website www.dmma.co.za,Like them on Facebook https://www.facebook.com/thedmma or follow @iab_saon Twitter.
ABOUT THE IAB SOUTH AFRICA
Visa Inc. (NYSE: V) is a global payments technology company that connectsconsumers, businesses, financial institutions, and governments in more than 200countries and territories to fast, secure and reliable electronic payments. We operateone of the world’s most advanced processing networks — VisaNet — that iscapable of handling more than 65,000 transaction messages a second, with fraudprotection for consumers and assured payment for merchants. Visa is not a bank anddoes not issue cards, extend credit or set rates and fees for consumers. Visa’sinnovations, however, enable its financial institution customers to offer consumers morechoices: pay now with debit, pay ahead with prepaid or pay later with credit products.For more information, visit usa.visa.com/about-visa, visacorporate.tumblr.com and@VisaNews.
ABOUT VISA
Source: E�ective Measure, December 2015-March 2016 www.e�ectivemeasure.com PAGE 60