Embed Size (px)
Citation preview

Survey Toolbox
CPRS
March
2006
Ontario, CA
Survey Toolbox
Mary Jo Flynn
Senior Analyst Intergovernmental Relations
City of Anaheim
Dr. Katherine James
Department Chair, CSU Long Beach

Survey Toolbox
CPRS
March
2006
Ontario, CA
Evaluation Challenge:
Finding the key to keeping surveys and evaluations out of the box at the back of the closet!
Survey Toolbox
CPRS
March
2006
Ontario, CA
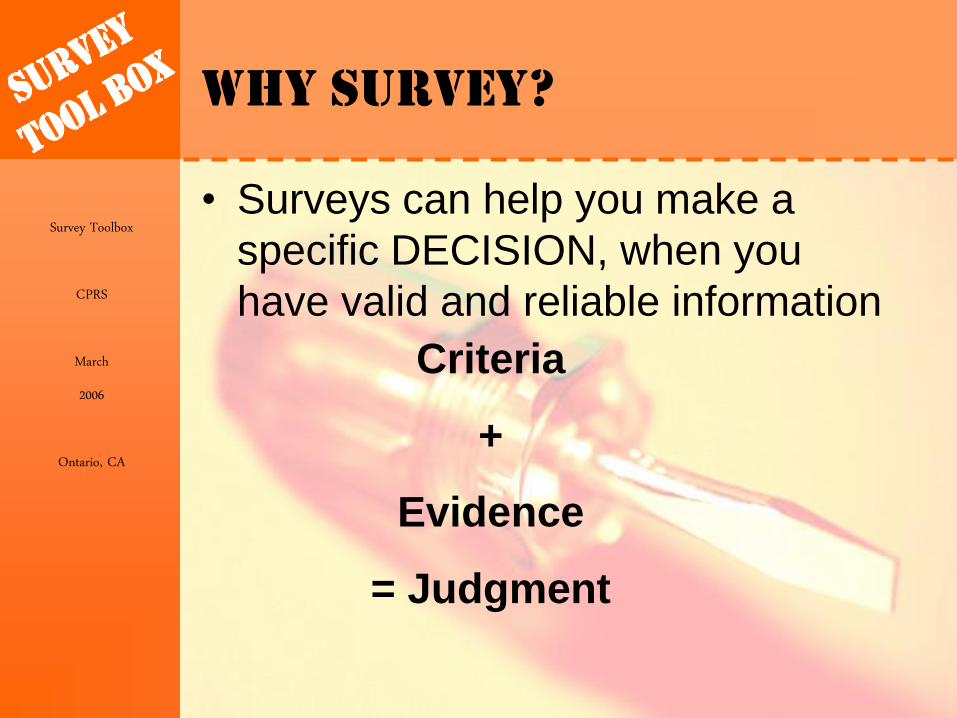
Why Survey?
• Surveys can help you make a
specific DECISION, when you
have valid and reliable information
Criteria
+
Evidence
= Judgment

Survey Toolbox
CPRS
March
2006
Ontario, CA
What is my DECISION?
• Do I need more budget money?
• Do I need to reduce or eliminate a program?
• Do I need to increase programming?

Survey Toolbox
CPRS
March
2006
Ontario, CA
Seeking Information
• What is it you really need to
know?
• Can you get any of this
information without asking for it?

Survey Toolbox
CPRS
March
2006
Ontario, CA
Other Sources of Data
• US Census
• School records
• Registration records or internal databases
• Historical/Library records
• Real estate records/sales
• Public records
• Universities and academic researchers
• Government archives
• Commercial information services
• Chamber of Commerce data
• Church records
• Building permits
• Voting records

Survey Toolbox
CPRS
March
2006
Ontario, CA
Seeking Information
Ask the 5 Ws
• Who is asking for the information?
• What will you measure?
• When do you need the
information?
• Where can you get information?
• Why is the information needed?

Survey Toolbox
CPRS
March
2006
Ontario, CA
If you have to ask…
• Prioritize
– Asking everything in one survey
will reduce the number of
responses
• Sequence the Questions
– Save the tough stuff for last
• Revise
– Draft, review, revise, review,
repeat

Survey Toolbox
CPRS
March
2006
Ontario, CA
Writing the questions
• Good questions should be
– Neutral
– Singular
– Clear

Survey Toolbox
CPRS
March
2006
Ontario, CA
Writing the questions
How often would you be interested
in participating in golf tournaments
at this golf course?
____________________________

Survey Toolbox
CPRS
March
2006
Ontario, CA
Writing the questions
How often would you be interested in participating in golf tournaments at this golf course?
Every time

Survey Toolbox
CPRS
March
2006
Ontario, CA
Writing GOOD questions
How often would you be interested in participating in golf tournaments at this golf course?
___ Once a year
___ Twice a year
___ Three times a year (every four months)
___ Four times a year (every three months)

Survey Toolbox
CPRS
March
2006
Ontario, CA
Writing GOOD questions:
Consider Your Decisions
How often would you be interested in participating in golf tournaments at this golf course?
___ Once a year
___ Twice a year
If your budget can only accommodate up to two tournaments, don’t ask if they want three of four:

Survey Toolbox
CPRS
March
2006
Ontario, CA
Where do we go
from here
• Types of Questions
• Organizing the responses
• Presenting the summary
(computerized charts)

Survey Toolbox
CPRS
March
2006
Ontario, CA
Question Designs:
Open Ended Questions
ADVANTAGES
• Allows the freedom to provide any answer
• Able to obtain answers or information that you haven’t thought of
CAUTION • You may find you
get any answer
• Can you read their handwriting?
• Requires TIME to compile responses

Survey Toolbox
CPRS
March
2006
Ontario, CA
Question Designs:
Multiple Choice
ADVANTAGES • Quick and easy for
respondents and you
• Responses must be distinct and clear
• Recommend including “does not apply / decline to state” to help determine if a question was skipped
CAUTION • Needs exhaustive
responses
– Or include “other please specify”
Survey Toolbox
CPRS
March
2006
Ontario, CA
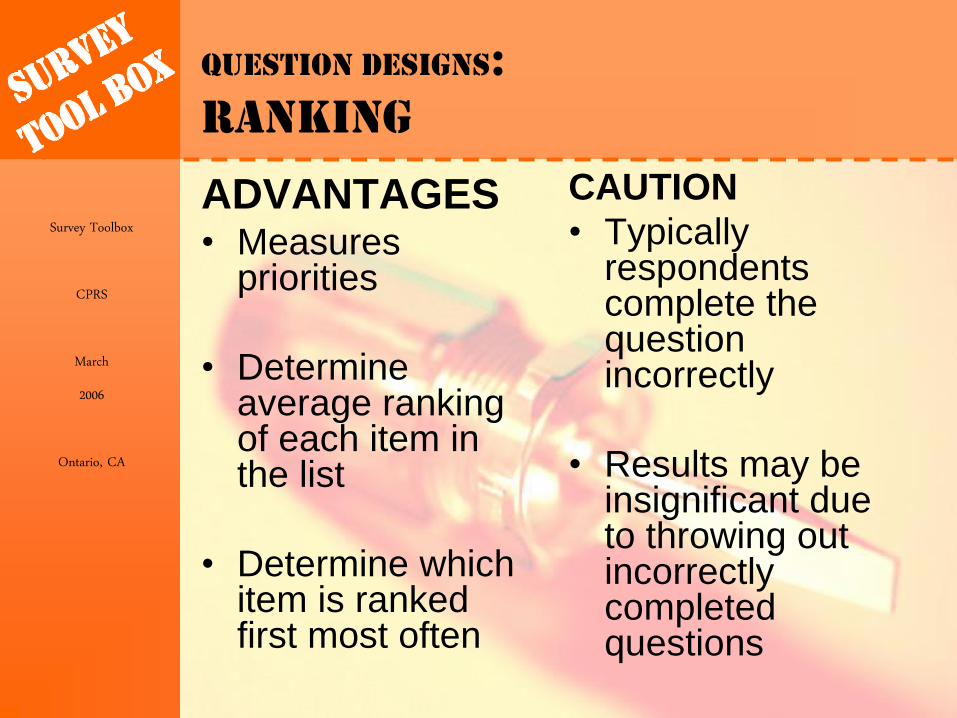
Question Designs:
Ranking
ADVANTAGES • Measures
priorities
• Determine average ranking of each item in the list
• Determine which item is ranked first most often
CAUTION
• Typically respondents complete the question incorrectly
• Results may be insignificant due to throwing out incorrectly completed questions

Survey Toolbox
CPRS
March
2006
Ontario, CA
Question Designs:
Rating
ADVANTAGES
• Can measure attitudes and values
• Quick and easy for respondents and you
CAUTION
• Some may reverse the scale unless it is really, really clear

Survey Toolbox
CPRS
March
2006
Ontario, CA
Format Your Results
• After designing the questions, while waiting for responses, you can format the results
• Use Excel to compile your data
• Plug the numbers in to your formatted
• Tables
• Charts
• Report cards
Survey Toolbox
CPRS
March
2006
Ontario, CA
Presenting Results
• Data Tables
• Charts / Graphs
– Pie Charts
– Bar Charts
• Rating
– Create a “Grade Report”
– Report a GPA

Survey Toolbox
CPRS
March
2006
Ontario, CA
Computer Generated
Charts

Survey Toolbox
CPRS
March
2006
Ontario, CA
Between Surveys &
Charts
• Organize the date
• Code the results
• Develop Excel files

Survey Toolbox
CPRS
March
2006
Ontario, CA
Let’s take a Look at
some examples

Survey Toolbox
CPRS
March
2006
Ontario, CA
How would you code this question?
Level of education completed:
__ Grade school
__ High school
__ Trade school
__ Some college
__ Bachelors degree
__ Some graduate school
__ Graduate degree

Survey Toolbox
CPRS
March
2006
Ontario, CA
Coding this question?
Level of education completed:
_1_ grade school
_2_ High school
_3_ Trade school
_4_ Some college
_5_ Bachelors degree
_6_ Some graduate school
_7_ Graduate degree

Survey Toolbox
CPRS
March
2006
Ontario, CA
The excel file for this question?
Survey Education Code Meaning
Survey 1 3 Trade School
Survey 2 4 Some College
Survey 3 3 Trade School
Survey 4 5 Bachelors
Survey 5 2 High School
Survey 6 7 Grad Degree

Survey Toolbox
CPRS
March
2006
Ontario, CA
Multiple Choice
• What did you like best about the
aerobics class? (check one)
___ Become more physically fit
___ Getting out of the house or job for awhile
___ Meeting other people
___ Having fun
___ Moving to the music
___ Having more energy

Survey Toolbox
CPRS
March
2006
Ontario, CA
Multiple Choice
0 20 40 60 80 100
Fitness
Getting Out
People
Fun
Music
Energy

Survey Toolbox
CPRS
March
2006
Ontario, CA
Ranking
• Please rank the following items from 1 to 5 in
order of your preference, with #1 = the activity you liked best #5 = the activity you liked least
Please use each number only once.
___ Horseback riding
___ Team games
___ Free Swimming
___ Evening Programs
___ Arts & Crafts

Survey Toolbox
CPRS
March
2006
Ontario, CA
Code by item
Survey Horseback
Riding
Team
Games
Free
Swim
Evening
Programs
Arts &
Crafts
1 1 5 4 4 3
2 2 1 1 2 4
3 3 2 2 1 5
4 4 3 5 3 2
5 5 4 3 5 6
6 6 6 6 6 1

Survey Toolbox
CPRS
March
2006
Ontario, CA
Code by ranking
Survey Ranked
1
Ranked
2
Ranked
3
Ranked
4
Ranked
5
1 Horseback Teams Arts Programs Swim
2 Teams Arts Horseback Programs Swim
3 Swim Teams Arts Horseback Programs
4 Programs Swim Horseback Arts Teams
5 Horseback Arts Swim Teams Programs
6 Swim Arts Programs Teams Horseback

Survey Toolbox
CPRS
March
2006
Ontario, CA
Rating instead of
Ranking
• Please rate your interest in the following
activities
Activity
Very
Interested
Interested
Barely
Interested
Not at all
interested
Horseback
riding
Free
Swimming
Arts & Crafts

Survey Toolbox
CPRS
March
2006
Ontario, CA
How would you code this question?
At our facility: Strongly
Agree
Agree
Disagree
Strongly
Disagree
Does Not
Apply
Staff were
friendly [ ] [ ] [ ] [ ] [ ]
Facilities were
nice [ ] [ ] [ ] [ ] [ ]
Restrooms were
clean [ ] [ ] [ ] [ ] [ ]
Rooms were cold [ ] [ ] [ ] [ ] [ ]

Survey Toolbox
CPRS
March
2006
Ontario, CA
Question Formats
Likert Scales
At our facility: Strongly
Agree
Agree
Disagree
Strongly
Disagree
Does
Not
Apply
Staff were friendly [ 4 ] [ 3 ] [ 2 ] [ 1 ] [ X ]
Facilities were nice [ 4 ] [ 3 ] [ 2 ] [ 1 ] [ X ]
Restrooms were
clean [ 4 ] [ 3 ] [ 2 ] [ 1 ] [ X ]
Rooms were cold [ 1 ] [2 ] [ 3 ] [ 4 ] [ X ]

Survey Toolbox
CPRS
March
2006
Ontario, CA
Rating: Version 1
• Please rate the following… – Scale
• Strongly Agree (SA)
• Agree (A)
• Disagree (D)
• Strongly Disagree (SD)
Question SA A D SD
The entrance to the campground was
attractive
Staff were friendly & courteous
The campsites were large enough
Survey Toolbox
CPRS
March
2006
Ontario, CA
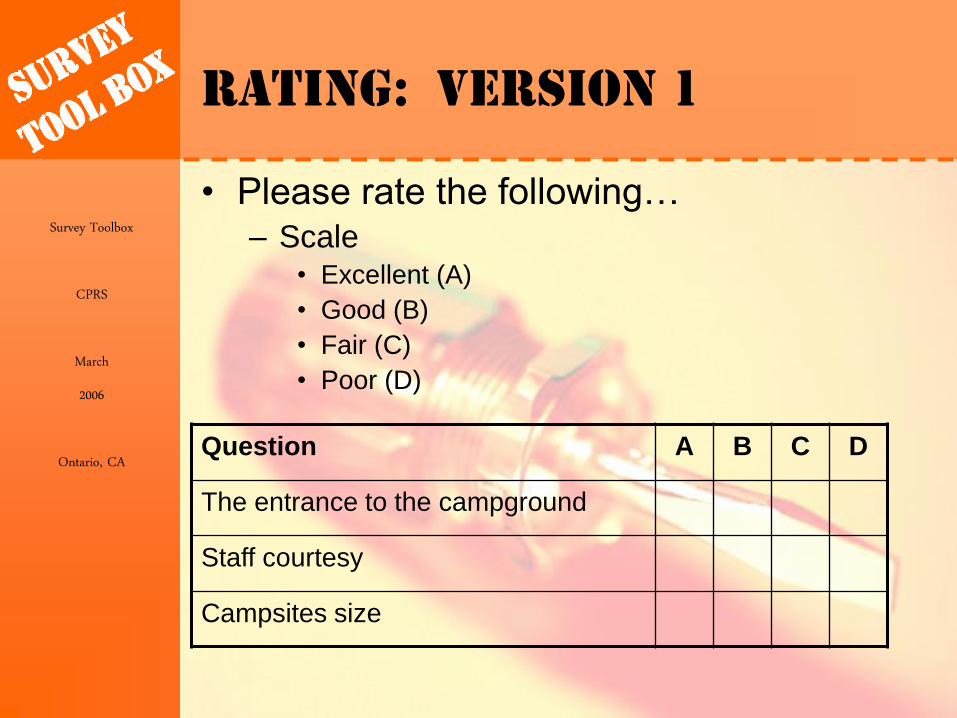
Rating: Version 1
• Please rate the following… – Scale
• Excellent (A)
• Good (B)
• Fair (C)
• Poor (D)
Question A B C D
The entrance to the campground
Staff courtesy
Campsites size

Survey Toolbox
CPRS
March
2006
Ontario, CA
Rating: Version 1
• Results can be read like a Report Card
Grade
The entrance to the campground B
Staff courtesy A
Campsites size D
Program Report Card

Survey Toolbox
CPRS
March
2006
Ontario, CA
Rating: Version 2
• Semantic differential
– Rating scale
– Anchor words at each end
Clean __ __ __ __ Dirty
Accessible __ __ __ __ Inaccessible
Dark __ __ __ __ Well lighted
Safe __ __ __ __ Dangerous
Please rate our facility:

Survey Toolbox
CPRS
March
2006
Ontario, CA
How would you code this question?
Our facility is:
Welcoming [ ] [ ] [ ] [ ] [ ] Unwelcoming
Clean [ ] [ ] [ ] [ ] [ ] Dirty
Crowded [ ] [ ] [ ] [ ] [ ] Spacious
Cold [ ] [ ] [ ] [ ] [ ] Hot
Survey Toolbox
CPRS
March
2006
Ontario, CA
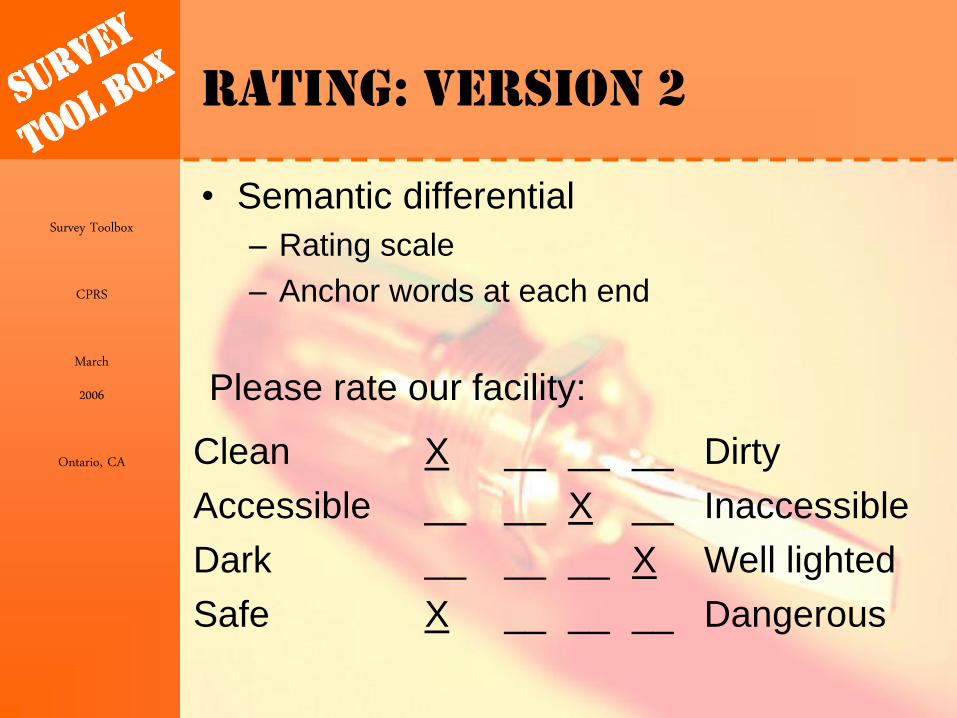
Rating: Version 2
• Semantic differential
– Rating scale
– Anchor words at each end
Clean X __ __ __ Dirty
Accessible __ __ X __ Inaccessible
Dark __ __ __ X Well lighted
Safe X __ __ __ Dangerous
Please rate our facility:

Survey Toolbox
CPRS
March
2006
Ontario, CA
Question Formats
Semantic Differential
Our facility is:
Welcoming [ 5 ] [ 4 ] [ 3 ] [ 2 ] [ 1 ] Unwelcoming
Clean [ 5 ] [ 4 ] [ 3 ] [ 2 ] [ 1 ] Dirty
Crowded [ 5 ] [ 4 ] [ 3 ] [ 2 ] [ 1 ] Spacious
Cold [-2] [-1] [0] [ 1 ] [ 2 ] Hot

Survey Toolbox
CPRS
March
2006
Ontario, CA
Rating: Version 2
• Semantic differential
Clean A
Accessible C
Lighting A
Safety A
Facility Report Card

Survey Toolbox
CPRS
March
2006
Ontario, CA
Importance Performance:
Importance
Please rate the level of importance of each item
Very Important
Important
Barely Important
Not at all Important
Networking
Opportunities
Manual Development
Knowledgeable
Speakers
Tasty Breakfast
Convenient Date &
Time
Template provides

Survey Toolbox
CPRS
March
2006
Ontario, CA
Importance Performance:
Performance
Please rate the level of performance of each item
Excellent
A
Good
B
Fair
C
Poor
D
Networking
Opportunities
Manual Development
Knowledgeable
Speakers
Tasty Breakfast
Convenient Date &
Time
Template provides
Survey Toolbox
CPRS
March
2006
Ontario, CA
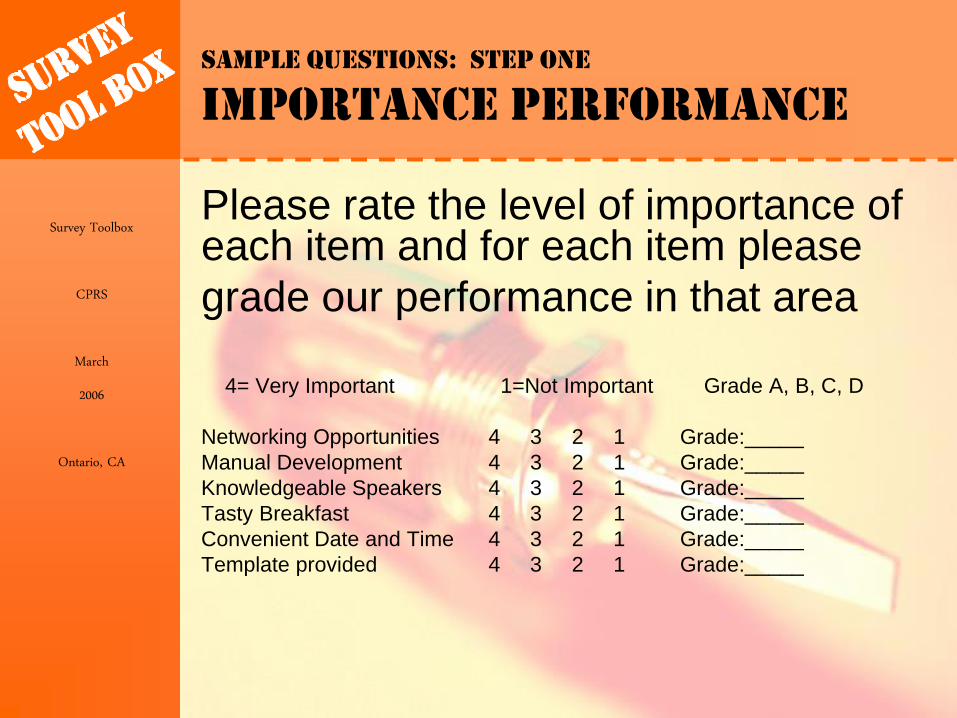
Sample Questions: Step One
Importance Performance
Please rate the level of importance of each item and for each item please
grade our performance in that area
4= Very Important 1=Not Important Grade A, B, C, D
Networking Opportunities 4 3 2 1 Grade:_____
Manual Development 4 3 2 1 Grade:_____
Knowledgeable Speakers 4 3 2 1 Grade:_____
Tasty Breakfast 4 3 2 1 Grade:_____
Convenient Date and Time 4 3 2 1 Grade:_____
Template provided 4 3 2 1 Grade:_____
Survey Toolbox
CPRS
March
2006
Ontario, CA
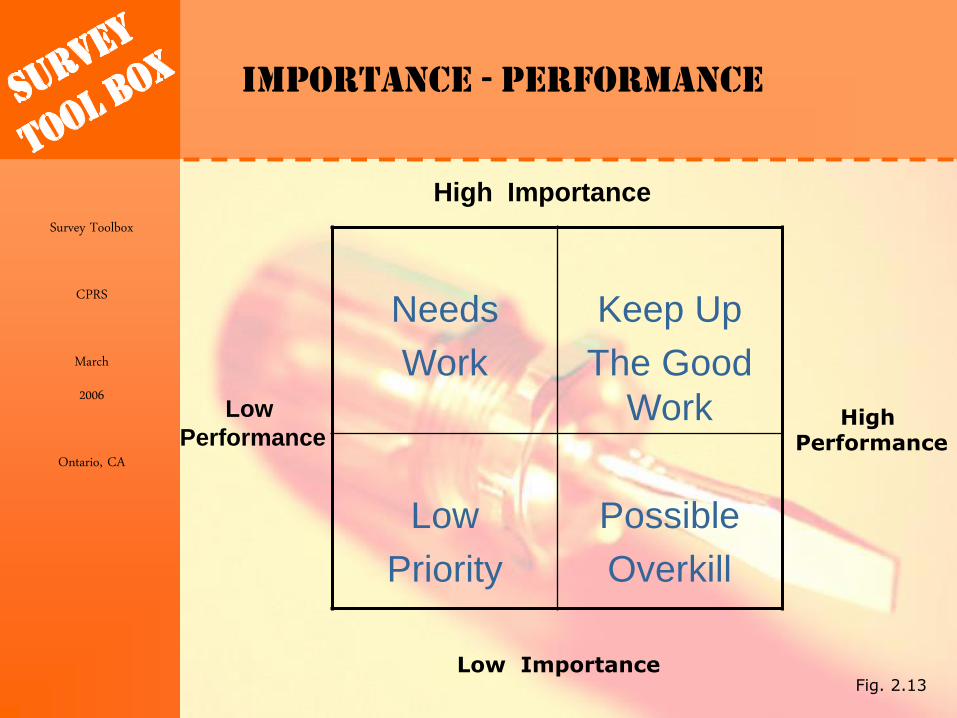
Importance - Performance
Needs
Work
Keep Up
The Good
Work
Low
Priority
Possible
Overkill
High Importance
Low Importance
High Performance
Low
Performance
Fig. 2.13
Survey Toolbox
CPRS
March
2006
Ontario, CA
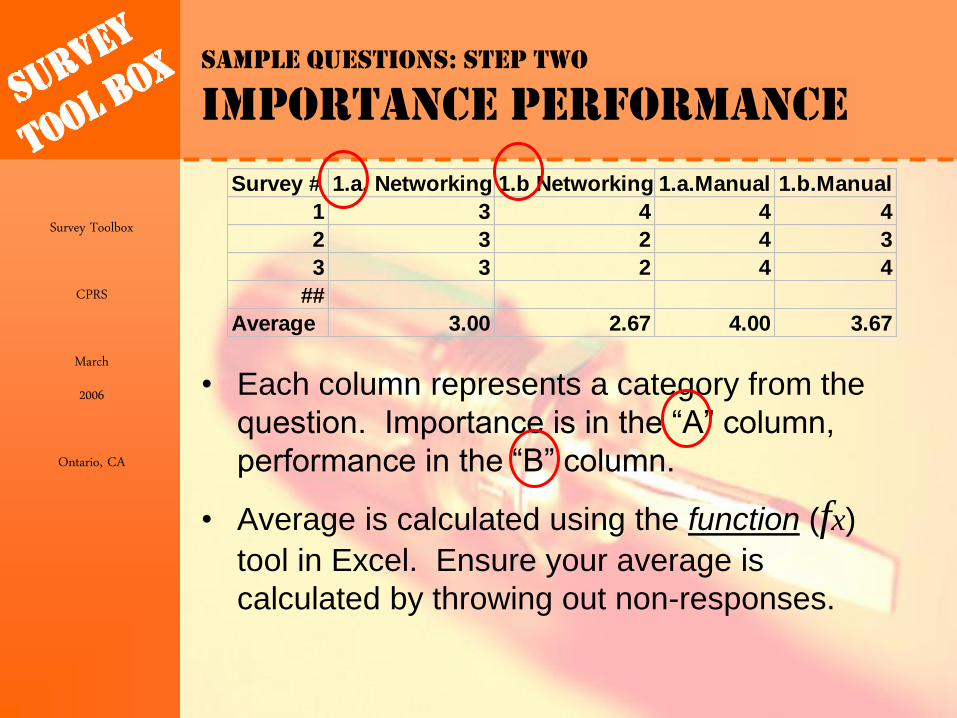
Sample Questions: Step Two
Importance Performance
Survey # 1.a. Networking 1.b Networking 1.a.Manual 1.b.Manual
1 3 4 4 4
2 3 2 4 3
3 3 2 4 4
##
Average 3.00 2.67 4.00 3.67
• Each column represents a category from the
question. Importance is in the “A” column,
performance in the “B” column.
• Average is calculated using the function (fx)
tool in Excel. Ensure your average is
calculated by throwing out non-responses.

Survey Toolbox
CPRS
March
2006
Ontario, CA
Sample Questions: Step Three
Importance Performance
Importance Performance
Networking 3.15 3.07
Manual Development 3.67 3.52
Speakers 3.69 3.43
Breakfast 3.03 3.68
Date & Time 3.15 3.61
Template 3.67 3.74
• Develop a table in Excel of your mean scores.
• Highlight the table and select chart type “XY Scatter”
• Format X axis as Importance
• Format Y axis as Performance
• Set scale so that Value Y axis crosses at 2.5
• Develop a key and/or re-label points on graph

Survey Toolbox
CPRS
March
2006
Ontario, CA
Sample Questions: Step Four
Importance Performance
Developing Your Aquatic Manual
6
23
45
1
1.00
2.00
3.00
4.00
1.00 2.00 3.00 4.00
Low <---Importance---> High
Lo
w <
---P
erf
orm
an
ce
---
>H
igh
• Establish your key, so that items on the chart
can be easily identified
• Write your analysis based on the position of
the items on the chart & recommendations for
improvement or elimination of items.
Key
1. Networking
2. Manual Development
3. Speakers
4. Breakfast
5. Date & Time
6. Template

Survey Toolbox
CPRS
March
2006
Ontario, CA
Politics & Surveys
• Evaluation systems & projects can be political in that they may support or refute the views that people hold
• By their nature, evaluations are political when the information is used to “manipulate” other people even though the manipulations may be positive
• Sometimes being asked a question is not bad – it may help to highlight & give credit to an elected official who has been on your side
“It is amazing what you can accomplish if you don’t care who gets the credit”

Survey Toolbox
CPRS
March
2006
Ontario, CA
Statistic Sample Calculators
• http://members.aol.com/johnp71/javastat.html
• http://www.macorr.com/ss_calculator.htm
• http://calculators.stat.ucla.edu/sampsize.phtml
• http://www.steinermarketing.com/calc_sample_size.htm
• Most surveys use: – 95% Confidence level
– 5 % Confidence Interval (the +/- statistic that newspapers typically report, e.g. +/- 5%)

Survey Toolbox
CPRS
March
2006
Ontario, CA
Resources: Internet Surveys
• Research indicates that most people respond to email within 8 hours of receipt and the remaining typically respond within 72 hours – (Dillman, 2000; Getz, 2000).
• Great way to collect data for projects when you need immediate results.
• Low cost to process information, initial investment can vary
– www.zoomerang.com
– www.surveymonkey.com

Survey Toolbox
CPRS
March
2006
Ontario, CA
Bibliography
• Dillman, Don. A. (2000). Mail and Internet
Surveys: The Tailored Design Method. John
Wiley & Sons, Inc. New York, NY.
• Henderson, Karla & Bialeschki, Deborah.
(1995). Evaluating leisure services: Making
enlightened decisions. Venture Publishing.
State College, PA.
• Huff, Darrell. (1954). How to lie with statistics.
W.W. Norton & Company. New York, NY.

Survey Toolbox
CPRS
March
2006
Ontario, CA
Contact Us
Dr. Katherine James
Department Chair
California State University, Long Beach
Mary Jo Flynn
Senior Analyst Intergovernmental Relations
City of Anaheim