Embed Size (px)
Citation preview

2006 International Student SurveyReport of the consolidated results from the four education sectors in Australia
September 2007In
ternatio
nal S
tud
ent S
urvey 2006 R
epo
rt of th
e con
solid
ated resu
lts from
the fo
ur ed
ucatio
n secto
rs in A
ustralia

About this report In 2005, Australian Education International (AEI) commissioned research to assess the overall satisfaction of international students studying in Australia. The research was conducted by Ipsos and focussed on international students in their final year of study. The research included all four sectors –Higher Education (HE), Vocational Education and Training (VET), Secondary School (Schools) and English Language Intensive Courses for Overseas Students (ELICOS).
This report presents the consolidated results from all four sectors combined.
About Australian Education International (AEI) AEI is the international arm of the Australian Government Department of Education, Science and Training (DEST). AEI promotes the export of Australian education and training services. It works to attract students from around the world to study in Australia and to ensure that international students have a successful and enjoyable study experience. For further information, please visit the website, www.dest.gov.au or www.aei.dest.gov.au. DEST/AEI own exclusive usage rights to this study unless otherwise noted or agreed.
Ipsos Australia Pty Ltd. Ipsos Australia Pty Ltd is a public opinion, market and social research firm. The Ipsos research team included: Erik Okerstrom, Wendy McInnes, Graeme Peacock, Fiona Collis, Stanislav Bondjakov and Preslav Bondjakov.
Acknowledgements AEI would like to thank Ipsos Australia Pty Ltd for undertaking this study, and the Australian educational institutions and peak bodies who participated in the research project. AEI would also would like to thank all the individuals who contributed by agreeing to interviews, supplying data and information and otherwise assisting in the conduct of the research.
Disclaimer The Commonwealth of Australia, its officers, employees or agents disclaim any responsibility for any loss howsoever caused whether due to negligence or otherwise from the use of information in this publication. No representation expressed or implied is made by the Commonwealth of Australia or any of its officers, employees or agents as to the currency, accuracy or completeness of the information contained in this report. The reader should rely on their own enquiries to independently confirm the information and comment on which they intend to act.
© Commonwealth of Australia 2007. This work is copyright. You may download, display, print and reproduce this material in unaltered form only (retaining this notice) for your personal, non-commercial use or use within your organisation. All other rights are reserved. Requests and enquiries concerning reproduction and rights should be addressed to Commonwealth Copyright Administration, GPO Box 2154, Canberra ACT 2601 or email: [email protected].

International Student Survey 2006 Report of the Consolidated Results from the Four Education Sectors in Australia
[ii]
Table of contents Executive Summary_____________________________________________________ 1
1. Background and objectives _________________________________________ 1 1.1 Research objectives........................................................................................................2
2. Research method __________________________________________________ 3 2.1 Research method and sample........................................................................................3 2.2 Sample characteristics....................................................................................................5
3. Overall satisfaction and advocacy ____________________________________ 8 3.1 Recommending studying in Australia ...........................................................................10 3.2 Satisfaction with the course being completed ..............................................................13 3.3 Satisfaction with the quality of education in Australia...................................................15 3.4 Satisfaction with the study experience in Australia.......................................................18 3.5 Satisfaction with living in Australia................................................................................19 3.6 Getting a good job.........................................................................................................20 3.7 Permanent Residency ..................................................................................................22 3.8 Summary of the Key Points ..........................................................................................23
4. Planning and choosing to study in Australia __________________________ 24 4.1 The most important factors in the decision to study in Australia ..................................24 4.2 Important factors in deciding to apply for a course or school in Australia ....................28 4.3 Influences on the decision to study in Australia............................................................33 4.4 English language skills on course commencement......................................................37 4.5 Summary of the Key Points ..........................................................................................39
5. Studying in Australia ______________________________________________ 41 5.1 Affordability of education in Australia............................................................................43 5.2 Access to employment and relevant work experience .................................................52 5.3 Visas .............................................................................................................................55 5.4 Use of support services ................................................................................................59 5.5 Integration into Australian society.................................................................................65 5.6 Summary of the Key Points ..........................................................................................70
6. Perceptions of the quality of education in Australia_____________________ 72 6.1 Satisfaction with course content ...................................................................................74 6.2 Satisfaction with the commitment of staff .....................................................................75 6.3 Satisfaction with teaching methods ..............................................................................76 6.4 Satisfaction with the quality of lectures/lessons ...........................................................77 6.5 Satisfaction with the course assessment......................................................................78

International Student Survey 2006 Report of the Consolidated Results from the Four Education Sectors in Australia
[iii]
6.6 Satisfaction with the quality of small classes................................................................79 6.7 Satisfaction with opportunities for one-on-one contact with academic staff .................80 6.8 Satisfaction with the range of subjects on offer ............................................................81 6.9 Satisfaction with the study workload.............................................................................82 6.10 Satisfaction with the opportunity to work on group projects .........................................83 6.11 Summary of the Key Points ..........................................................................................84
7. Future Career Plans and Aspirations _________________________________ 85 7.1 Summary of the Key Points ..........................................................................................87
8. International Students Survey 2007 – Follow-up Survey_________________ 88
List of tables Table 1: Sample sizes by sector and country/region of permanent residence and sector .................7 Table 2: Summary of key indicators of overall satisfaction by level of satisfaction.............................8 Table 3: Key indicators of overall satisfaction and advocacy by sector ..............................................8 Table 4: Recommend studying in Australia by country/region of permanent residence and
sector ............................................................................................................................12 Table 5: Satisfaction with course by country/region of permanent residence and sector.................14 Table 6: Satisfaction with quality of education by country/region of permanent residence
and sector .....................................................................................................................17 Table 7: Satisfaction with study experience by country/region of permanent residence and
sector ............................................................................................................................18 Table 8: Satisfaction with living in Australia by country/region of permanent residence and
sector ............................................................................................................................20 Table 9: Whether current studies are helpful for job prospects by country/region of
permanent residence and sector ..................................................................................21 Table 10: Whether planning to apply for permanent residency by country/region of
permanent residence and sector ..................................................................................22 Table 11: Importance of the factors in decision to study in Australia by country/region of
permanent residence and sector ..................................................................................26 Table 12: Importance of factors in decision to choose course/School by country/region of
permanent residence and sector ..................................................................................30 Table 13: Influences on decision to study in Australia by country/region of permanent
residence and sector.....................................................................................................34 Table 14: English language skills ......................................................................................................37 Table 15: Summary of key indicators of satisfaction related to cost, visas and employment
by level..........................................................................................................................41 Table 16: Key indicators of dissatisfaction with the study experience in Australia by sector............42 Table 17: Satisfaction with cost of course by country of permanent residence and sector ..............43 Table 18: Dissatisfaction with cost of course by country/region of permanent residence
and sector .....................................................................................................................44

International Student Survey 2006 Report of the Consolidated Results from the Four Education Sectors in Australia
[iv]
Table 19: Satisfaction with the cost of living by country of permanent residence and sector ............................................................................................................................46
Table 20: Dissatisfaction with the cost of living by country/region of permanent residence and sector .....................................................................................................................47
Table 21: Satisfaction with cost of obtaining visa by country/region of permanent home residence and sector.....................................................................................................49
Table 22: Dissatisfaction with total cost of obtaining visa by country/region of permanent residence and sector.....................................................................................................50
Table 23: Dissatisfaction with looking for part-time or casual work by country/region of permanent residence and sector ..................................................................................52
Table 24: Dissatisfaction with looking for holiday work by country/region of permanent residence and sector.....................................................................................................53
Table 25: Dissatisfaction with getting work experience in field of study by country/region of permanent residence and sector ..............................................................................55
Table 26: Dissatisfaction with length of time before visa expires after course by country/region of permanent residence and sector ......................................................56
Table 27: Dissatisfaction with time it took to obtain visa by country/region of permanent residence and sector ...................................................................................................57
Table 28: Dissatisfaction with ease of obtaining visa by country/region of permanent residence and sector.....................................................................................................58
Table 29: Key indicators usage and usefulness of support services by sector ................................59 Table 30: Use of student employment services and perceived usefulness by
country/region of permanent residence and sector ......................................................60 Table 31: Use of careers advisory service and perceived usefulness by country/region of
permanent residence and sector ..................................................................................61 Table 32: Use of health (medical) services and perceived usefulness by country/region of
permanent residence and sector ..................................................................................62 Table 33: Whether used induction or orientation programme by country/region of
permanent residence and sector ..................................................................................64 Table 34: Key indicators of integration by sector ..............................................................................65 Table 35: Treated with respect by Australian students by country/region of permanent
residence and sector.....................................................................................................66 Table 36: Whether were close friends with Australian students by country/region of
permanent residence and sector ..................................................................................67 Table 37: Key indicators of integration by sector ..............................................................................68 Table 38: Summary Key Indicators of quality of education by level of satisfaction .........................72 Table 39: Key indicators of perceptions of the quality of education by sector .................................73 Table 40: Satisfaction with course content by country/region of permanent residence and
sector ............................................................................................................................74 Table 41: Satisfaction with commitment of staff by country/region of permanent residence
and sector .....................................................................................................................75 Table 42: Satisfaction with methods of teaching by country/region of permanent
residence and sector.....................................................................................................76 Table 43: Satisfaction with quality of lecture/teaching by country/region of permanent
residence and sector.....................................................................................................77

International Student Survey 2006 Report of the Consolidated Results from the Four Education Sectors in Australia
[v]
Table 44: Satisfaction with course assessment by country/region of permanent residence and sector .....................................................................................................................78
Table 45: Satisfaction with quality of small classes by country/region of permanent residence and sector.....................................................................................................79
Table 46: Satisfaction with opportunities for one-on-one contact by country/region of permanent home residence and sector ........................................................................80
Table 47: Satisfaction with range of subjects to choose from by country of permanent residence and sector.....................................................................................................81
Table 48: Satisfaction with study workload by country/region of permanent residence and sector ............................................................................................................................82
Table 49: Satisfaction with opportunity to work on group projects by country/region of permanent home residence and sector ........................................................................83
Table 50: Key indicators of future career plans and aspiration by sector .........................................85 Table 51: Enrolling in further studies immediately following the completion of course by
country/region of permanent residence and sector ......................................................85 Table 52: Finding a job immediately following the completion of course by country/region
of permanent residence and sector ..............................................................................86
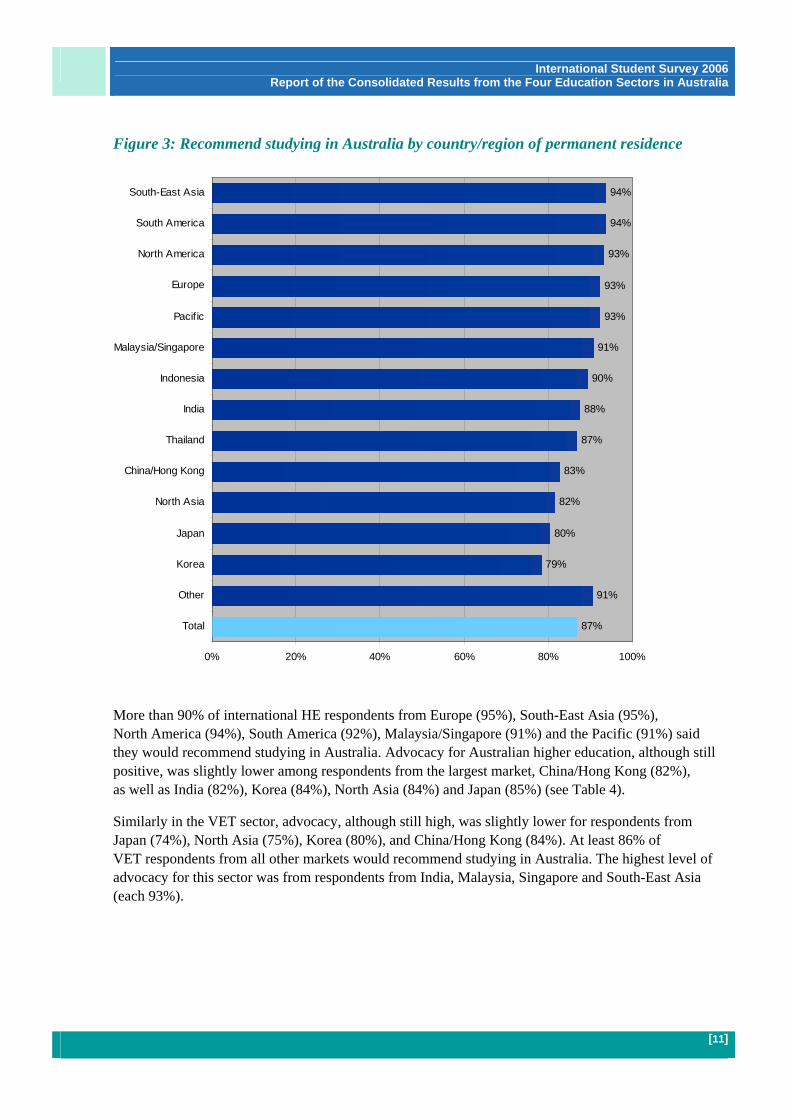
List of figures Figure 1: Percentage of respondents by country/region of permanent residence*.............................5 Figure 2: Would recommend studying in Australia by sector............................................................10 Figure 3: Would recommend studying in Australia by country/region of permanent
residence ......................................................................................................................11 Figure 4: Very satisfied or satisfied with course by country/region of permanent residence............13 Figure 5: Very satisfied or satisfied with quality of education by sector............................................15 Figure 6: Satisfaction with the quality of education by country/region of permanent
residence ......................................................................................................................16 Figure 7: Need for training in spoken and written English (Schools) ................................................38 Figure 8: Comparison between students’ satisfaction and dissatisfaction with the cost of
course by country/region of permanent residence ......................................................45 Figure 9: Comparison between students’ satisfaction and dissatisfaction with the cost of
living in Australia by country/region of permanent residence .......................................48
International Student Survey 2006 Report of the Consolidated Results from the Four Education Sectors in Australia
[1]
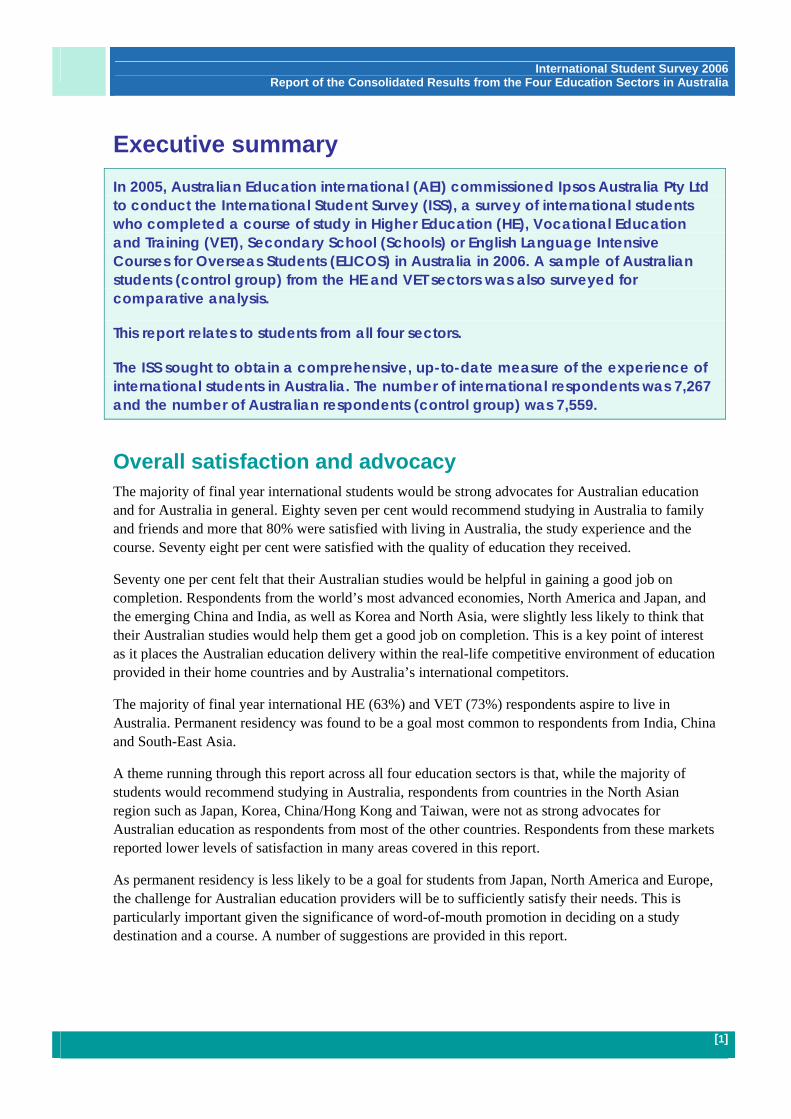
Executive summary In 2005, Australian Education international (AEI) commissioned Ipsos Australia Pty Ltd to conduct the International Student Survey (ISS), a survey of international students who completed a course of study in Higher Education (HE), Vocational Education and Training (VET), Secondary School (Schools) or English Language Intensive Courses for Overseas Students (ELICOS) in Australia in 2006. A sample of Australian students (control group) from the HE and VET sectors was also surveyed for comparative analysis.
This report relates to students from all four sectors.
The ISS sought to obtain a comprehensive, up-to-date measure of the experience of international students in Australia. The number of international respondents was 7,267 and the number of Australian respondents (control group) was 7,559.
Overall satisfaction and advocacy The majority of final year international students would be strong advocates for Australian education and for Australia in general. Eighty seven per cent would recommend studying in Australia to family and friends and more that 80% were satisfied with living in Australia, the study experience and the course. Seventy eight per cent were satisfied with the quality of education they received.
Seventy one per cent felt that their Australian studies would be helpful in gaining a good job on completion. Respondents from the world’s most advanced economies, North America and Japan, and the emerging China and India, as well as Korea and North Asia, were slightly less likely to think that their Australian studies would help them get a good job on completion. This is a key point of interest as it places the Australian education delivery within the real-life competitive environment of education provided in their home countries and by Australia’s international competitors.
The majority of final year international HE (63%) and VET (73%) respondents aspire to live in Australia. Permanent residency was found to be a goal most common to respondents from India, China and South-East Asia.
A theme running through this report across all four education sectors is that, while the majority of students would recommend studying in Australia, respondents from countries in the North Asian region such as Japan, Korea, China/Hong Kong and Taiwan, were not as strong advocates for Australian education as respondents from most of the other countries. Respondents from these markets reported lower levels of satisfaction in many areas covered in this report.
As permanent residency is less likely to be a goal for students from Japan, North America and Europe, the challenge for Australian education providers will be to sufficiently satisfy their needs. This is particularly important given the significance of word-of-mouth promotion in deciding on a study destination and a course. A number of suggestions are provided in this report.

International Student Survey 2006 Report of the Consolidated Results from the Four Education Sectors in Australia
[2]
The most important factors for international students in deciding to study in Australia Across all respondents and education sectors, the five most important factors in the decision to study in Australia were:
1. Australia is an English-speaking country; 2. Australia is safe and secure, or a safe place to live; 3. coming to Australia offered the opportunity to experience a new culture and lifestyle
(HE and VET sectors); 4. living in Australia offered the opportunity to live close to a beautiful, natural
environment (ELICOS and Schools sector); and 5. Australian schools offered a high quality of education (Schools sector).
It is notable that for HE and VET respondents from many Asian countries – including Malaysia/Singapore, Korea, Japan, North Asia, Indonesia and Thailand – the perceived cost of living was one of the three most important factors in the decision to study in Australia.
The most important factors in deciding on a course or school in Australia Across the HE, VET and ELICOS sectors, the perceived quality of education was almost universally the most important factor in the decision to apply for the course in Australia. This was also the most important factor for Schools respondents.
Where the quality of education was not the most important factor, it ranked second or third to:
the perception that the course would improve the respondents’ chances of employment (for European HE respondents and VET respondents from North Asia and South America)
the reputation of the institution (for VET respondents from North America and Pacific countries for whom the reputation of the course was also one of the three most important factors)
the protection (in some cases a perception rather than reality) provided to international ELICOS respondents by the ESOS Act (for respondents from Pacific countries).
Generally, the second and third most important factors were the perception that the course would increase their chances of employment and the reputation of the university or institution particularly for the HE and VET sectors. The third most important factor in the ELICOS sector was the protection provided, or perceived to be provided, to international students by the ESOS Act.

International Student Survey 2006 Report of the Consolidated Results from the Four Education Sectors in Australia
[3]
The strongest influences on the decision to study in Australia Personal recommendation was considered to be a critical factor for ELICOS students in choosing a college. In 11 of the 12 key countries for which analysis was possible, the recommendation by an education/study agent was one of the three most important factors in choosing the college (with India as the exception). In the same 11 markets, the recommendation of a friend or relative supporting the college was also one of the three most important factors. This shows that maximising existing students’ satisfaction with their study experience in Australia is critical to the future of the ELICOS industry in Australia.
Other key factors influencing the choice of ELICOS college are more varied by market:
awareness of the college (important to respondents from Malaysia/Singapore, Thailand, Korea, North Asia and South America);
good student support services (important to respondents from Europe, India, Indonesia, South-East Asia and Japan); and
the ELICOS course being part of a package to do further studies in Australia (important to respondents from China/Hong Kong, India and the Pacific countries).
Consistent with the ELICOS sector, for both the HE and VET sectors, personal recommendation was one of the most important influences on the decision to study in Australia – both through family and friends at home, and people who were studying or had studied in Australia. These were two of the three most important influences in both sectors, as well as information on the internet. Other factors among the top three influences for specific markets included:
information about Australia in the media (for HE respondents from China/Hong Kong, South-East Asia and Japan, and VET respondents from Europe, Japan, Indonesia and South America);
education fairs and exhibitions (important to HE respondents from Malaysia/Singapore, India, Thailand and North Asia);
education/study agents (important to HE respondents from South America and VET respondents from Korea); and
promotion and advertising of Australian education at home (important to HE respondents from South America).
It is important to note that 72% of students in the HE, VET and ELICOS sectors used an agent to help them with their arrangements in coming to Australia. Ninety one per cent of these, or 66% of the total sample including Schools, used an education/study agent. The service provided by agents was rated as very good or good by 66% of these students, as average by 25%, and as not very good or poor by 11%.

International Student Survey 2006 Report of the Consolidated Results from the Four Education Sectors in Australia
[4]
English language skills on course commencement The majority of HE and VET respondents (73%) felt their English language skills were up to the level required for their studies when they started their course in Australia. The proportion was slightly higher in the HE sector (75%) compared with VET sector (70%). Twenty one per cent of respondents across both sectors felt they were in need of formal training or coursework, which they received when they required it (19% HE, 23% VET), while 5% felt that they were in need of formal training or coursework, which they received later than required (4% HE, 5% VET). One per cent of international students reported that they were in need of formal training or coursework to improve their English language skills and they never received it.
Schools students were asked whether they needed extra help with their spoken and/or written English when they started their studies at school in Australia. More than half (52%) felt they needed extra help with both spoken and written English on commencement of their studies; a further 16% reported needing extra help with their written English only; and another 7% felt that they needed help with their spoken English only. Therefore, almost 76% of international Schools students required extra help with their English language skills at the beginning of their Australian schooling.
The Schools students were then asked whether they received the extra help they needed. Just over half of those who felt that they needed assistance with their spoken or written English actually received assistance when they needed it (55%). Twenty six per cent received help later than they needed it and 10% of this group (8% of all Schools students) reported never receiving the help they needed. A small group did not know or did not answer this question.
The experience of studying in Australia While the majority of international respondents would be advocates for Australian education and for Australia in general, there were three key issues that generated notable levels of dissatisfaction:
cost; gaining employment and relevant work experience; and rules associated with visas.
The cost of studying in Australia Cost was an issue for many international respondents in Australia – 35% were dissatisfied or very dissatisfied with the cost of the course (the same proportion reported being satisfied); 26% were dissatisfied with the cost of living (46% satisfied); and 31% were dissatisfied with the total cost of obtaining a visa (41% satisfied).
Across the four sectors, dissatisfaction with the cost of the course (35%) was highest among respondents from North Asia (48%), Japan (44%), Malaysia/Singapore (43%) and Europe (40%). The HE sector (41%) had the highest level of dissatisfaction with the cost of the course compared to VET (27%) and ELICOS (29%).

International Student Survey 2006 Report of the Consolidated Results from the Four Education Sectors in Australia
[5]
Across the HE, VET and ELICOS sectors, 31% of respondents expressed dissatisfaction with the cost of obtaining their visa. This was more a concern for HE (36%) and ELICOS (33%) respondents than respondents enrolled in VET (23%). Overall, respondents from North Asia (49%), South America (45%), Japan (44%), North America (43%), Europe (41%) and Korea (36%) were more likely to be dissatisfied with the cost of the visa.
In summary, cost issues were a concern to a significant minority of all final year international respondents. These need to be kept under control to maximise Australia’s potential in the international education market, particularly in the minds of potential students from countries such as Japan and Korea.
Gaining employment and relevant work experience While a higher proportion of students in all sectors (42%) were satisfied with the opportunity to find part-time or casual work in Australia, 18% were dissatisfied with this aspect. Dissatisfaction was more common among HE (20%) and VET respondents (18%) and lower among respondents studying at ELICOS (12%) and Secondary School (8%) levels.
Dissatisfaction with the opportunity to find vacation work, though only measured among respondents in the HE and VET sectors, was also 18% (compared with 37% satisfied). Little difference was reported between respondents in the HE (19%) and VET (17%) sectors on this aspect.
The greatest concern in the employment area for HE and VET respondents was the opportunity to gain Australian work experience in their field of study. A third of international respondents in these two sectors (33%) were dissatisfied with this aspect, with only 34% satisfied, and the concern was far greater in the HE (40%) sector compared to VET (22%). Across the two sectors, Indian (46%), South American (44%) and Chinese/Hong Kong (38%) respondents were more likely to be dissatisfied, two of which are regions most interested in seeking permanent residency in Australia.
Visas A significant minority of international respondents reported dissatisfaction with the length of time before their visa expired following the completion of their course (24% compared with 53% satisfied); with the time it took to get their visa (23% dissatisfied compared with 61% satisfied); and with the ease of obtaining a visa (16% dissatisfied compared with 66% satisfied). Each of these issues was a significantly higher concern for HE respondents than for those in the VET and ELICOS sectors.
Dissatisfaction across the HE, VET and ELICOS sectors about the length of time before the visa expired following the completion of the course was highest among respondents from South America (32%), Europe (27%), and Malaysia/Singapore, Indonesia and Korea (each 26%).
A similar level of dissatisfaction (23%) was expressed by international respondents across the HE, VET and ELICOS sectors concerning the time it took to get the visa to Australia. Overall, dissatisfaction was highest among respondents from China/Hong Kong (31%), Japan and South America (each 26%).

International Student Survey 2006 Report of the Consolidated Results from the Four Education Sectors in Australia
[6]
Dissatisfaction with the ease of obtaining a visa was slightly lower overall (16%) than dissatisfaction with the length of time before the visa expired (24%) or the length of time taken to get the visa in the first place (23%). Across the HE, VET and ELICOS sectors, there was little variation by country on the ease of obtaining the visa, with slightly higher dissatisfaction reported by respondents from China/Hong Kong and Europe (each 19%), and Indonesia and South America (each 18%).
The use and usefulness of institutional support services provided for international students The vast majority of international respondents who used support services through their institution found them useful. However, given the employment and work experience issues discussed above, more could be done to encourage the use of student employment and careers advisory services.
Health and medical services were used by a relatively higher proportion of international respondents than student employment and careers advisory services. It may be worth encouraging international students to attend induction or orientation programmes so that these support services can become better known and used.
The integration of international students into Australian society Of respondents from the Schools, VET and HE sectors, 70% felt they were treated with respect and courtesy by Australian students. This feeling was higher for HE respondents (76%) than VET (65%) or Secondary students (61%). Across the three sectors in which this aspect was measured, students from Korea (45%), Thailand (51%) and Japan (59%) were less likely to feel they were treated with respect (followed by China/Hong Kong (65%) and North Asia (66%)).
Across the four sectors, respondents from Pacific countries and North America (each 84%) and Europe (81%) were more likely to have close friends with Australian students. Respondents from Thailand (55%), North Asia (60%), China/Hong Kong (61%) and Korea (63%) were less likely to have such friendships.
A group of international respondents studying in Australia reported having no close friends among Australian students. Many of these respondents would have liked to have more Australian students as friends. The main barriers to achieving this appeared to be the often perceived lack of interest among Australian students in having international students as friends, compounded by the belief that Australian students should take the first steps to make friends with international students. Their English language skills stopped some international respondents from making friends with Australians.
Perceptions of the quality of education in Australia On the 10 key indicators measured concerning the quality of education delivered in Australia, reported satisfaction levels were in a relatively narrow range between 63% and 74% across the four sectors surveyed. On each indicator, respondents were much more likely to be satisfied than very satisfied.

International Student Survey 2006 Report of the Consolidated Results from the Four Education Sectors in Australia
[7]
The most interesting conclusion from this analysis is that satisfaction with the quality of education overall was greater than the satisfaction level reported for all but one of the 10 specific dimensions related to delivery (the exception being the quality of lectures being rated the same as the quality of education (83%) by ELICOS respondents).
These findings suggest that satisfaction with the study experience was determined by much more than what happened in the lecture theatre or classroom. The evidence presented showed that satisfaction with living in Australia (85%), the study experience (84%) and the course (82%) were all higher than reported satisfaction with the overall quality of education (78%).
Across all sectors, satisfaction with the course content (74%), commitment of staff, methods of teaching and quality of lectures or lessons (each 71%) was relatively high. It was lower concerning the range of subjects to choose from (67%), the study workload (65%) and the opportunity to work on group projects (63%). The remaining indicators were positioned in the middle of this range – quality of small classes and course assessment (each 69%), and opportunities for one-on-one contact with academic staff (68%).
Generally, it can be concluded that satisfaction with the dimensions of education delivery was lower for respondents from countries with greater cultural incongruence with Australia, notably Japan, Korea, China, North Asia and, to a lesser extent, South America. Partially, this could be related to inexperience with spoken English, but also appears to be related to differences in the Australian education system compared to their home country.
On key indicators of education delivery, such as the range of subjects, the quality of lectures, the methods of teaching and course assessment, North American respondents rated their experience lower than average.
Future career plans and aspirations Across all sectors, a third of all international respondents intended to enrol in further studies immediately following the completion of their current course in Australia (34%). This is a source of great potential for Australian education in the immediate future – by encouraging these young people to pursue their future studies in this country. For instance, among final year HE students who plan to immediately enrol in further studies, international students are much more likely to enrol in postgraduate courses than Australian students, offering a major market for future masters degrees and doctorates in this country.
The vast majority of Schools respondents said they would immediately enrol in further studies (78%), as did 43% of VET respondents, 36% of ELICOS respondents, and 19% of HE respondents. Across the four sectors, respondents from South-East Asia (46%), China/Hong Kong (41%), Thailand (38%) and Korea (36%) had a higher likelihood of enrolling in further studies.
Across all sectors, 43% of international respondents planned to find a job immediately after completing their current course. This was the aim of 56% of HE respondents, 36% of VET respondents, 18% of ELICOS respondents and 11% of final year Schools respondents. Overall, respondents from Malaysia/Singapore (58%), India (51%), Indonesia (48%) and the Pacific countries (45%) were among those who were more likely to be planning to find a job immediately after the completion of their course.

International Student Survey 2006 Report of the Consolidated Results from the Four Education Sectors in Australia
[8]
Twenty three per cent of respondents were neither planning to seek a job nor enrol in further studies on completion of their current course. They either had no plans, indicated they would travel or have extended time off.
Follow-up survey in 2007
In September 2007, a follow-up survey will be sent to up to 2,000 international students who participated in the initial International Student Survey in 2006.
This follow-up survey will be limited to graduates in the HE and VET sectors. The purpose of the survey is to measure the employment and/or further education outcomes of international students following their graduation. Control groups of up to 500 Australian graduates from each of the two sectors will also be asked to participate in this follow-up survey.
In addition, as part of Phase 2, 20 in-depth case studies will be conducted in late 2007 with students, employers and parents from five different countries including Australia.

International Student Survey 2006 Report of the Consolidated Results from the Four Education Sectors in Australia
[1]
1. Background and objectives
Australia is the world’s fifth largest provider of education to international students, after the USA, UK, Germany and France1. Australian Education International’s (AEI) mission is to promote and protect Australia’s reputation as a provider of quality education and training to international students. In 2005, AEI commissioned Ipsos Australia Pty Ltd to conduct the International Student Survey (ISS) to obtain a comprehensive, up-to-date measure of the experiences of international students in Australia and to ascertain their future career plans and aspirations. A sample of Australian higher education and vocational education and training students was also surveyed as a control group for comparative analysis.
In 2006, questionnaires were completed by 7,267 international students:
3,585 final year international Higher Education students 2,393 final year international VET students 705 final year international Schools students
584 ELICOS students.
In addition, 7,046 Australian final year HE students and 513 final year Australian VET students served as control groups.
In total, more than 14,000 students participated in the 2006 International Student Survey, in almost equal proportions of international and Australian students.
Information from the ISS will help identify current strengths and key issues that can be addressed to enhance the quality of the study experience for international students in Australia.
The ISS involved surveying four education sectors – Higher Education (HE), Vocational Education and Training (VET), Secondary Schools (Schools) and English Language Intensive Courses for Overseas Students (ELICOS). For the HE and VET sectors a control group of Australian students was surveyed for comparative purposes. The research involved three phases: qualitative research; a pilot quantitative survey; and the main quantitative survey. In late 2005, qualitative research was conducted among HE, VET, Schools and ELICOS students. It also conducted a pilot quantitative survey of international and Australian students who were completing a course of study at VET institutions in Australia. The pilot study tested the methodological approach proposed for the conduct of the ISS including the content and design of the survey instrument.
1 Source UNESCO Institute for Statistics – UIS/FS/05/02 (Updated Nov 2005) www.uis.unesco.org

International Student Survey 2006 Report of the Consolidated Results from the Four Education Sectors in Australia
[2]
It is expected that the research will provide valuable information to industry and government on the experience of both international and Australian students in Australian institutions. The results will help institutions identify specific areas where the level of student services are well regarded and other areas in which they can be more responsive to international student’s needs.
Detailed reports on each of the four sectors – HE, VET, ELICOS and Schools – have been prepared separately and are available through AEI. These reports also include copies of the questionnaire instruments that were completed by self-administration either in hard copy forms or online. This report presents the key findings of the survey from an analysis of the four education sectors combined, and focuses on the international students surveyed. It is an overview of the four sectors and not designed to replace the need for careful review of the individual sector reports.
1.1 Research objectives The main objectives for the ISS research project were:
to obtain information about international students’ experiences before arriving in Australia with respect to their choices to study in Australia;
to measure international students’ level of satisfaction with education, pastoral and support services, social integration and their overall satisfaction with their stay in Australia; and
to ascertain the future career plans and aspirations of international students subsequent to the completion of their studies.

International Student Survey 2006 Report of the Consolidated Results from the Four Education Sectors in Australia
[3]
2. Research method
2.1 Research method and sample
2.1.1 Qualitative phase The purpose of the qualitative research was to provide an in-depth understanding of the attitudes and experiences of international students in Australia and their ongoing support needs. The qualitative research also guided the design of the quantitative questionnaire.
Key issues explored in the qualitative research included:
students’ choice sets and decision processes in choosing to study in Australia; main influences on students’ decision, including family, friends and intermediaries, such as
Australian Education Centres and broader media; alternatives to studying in Australia, and their relative advantages and disadvantages
compared to Australia; satisfaction with information provided to students before their arrival and during their stay,
and ways that this could have been improved; level of satisfaction with education, pastoral and support services received during students
stay in Australia and specific ways that these could have been improved; level of social integration and overall satisfaction with students’ stay in Australia and how it
could be improved; future career plans and aspirations once students complete their course of study; preferred employment and further education outcomes; other key issues faced by international students in Australia and ways in which their time in
Australia could have been improved; and whether students would recommend Australia to other people in their country as a study
destination (including reasons for and against).
This exploratory phase of the research was based on a series of focus group discussions with HE, VET and Schools students in their final year of study. The group discussions were conducted with international students from a range of countries, as well as a control group conducted with Australian HE and VET students.
In addition, a series of interviews was conducted with representatives from providers and peak bodies.

International Student Survey 2006 Report of the Consolidated Results from the Four Education Sectors in Australia
[4]
2.1.2 Quantitative research A self-completion survey was developed from the results of the qualitative research and previous research in the area of international student markets. The questionnaire comprised 44 multi-part questions and took approximately 30 minutes to complete. The survey questionnaire was then modified for Australian students with a focus on obtaining comparative information. Copies of questionnaires can be found in the appendices of each sector report. The surveys were administered in the following ways:
HE international students: self-completion mail-back survey (n=1,216; 34%) online completion (n=2,369; 66%).
HE Australian students: self-completion mail-back survey (n=920; 13%) online completion (n=6,126; 87%).
VET international students:
self-completion in the classroom with a consultant available to answer any queries or address any difficulties (information on number of respondents is not available)
self-completion mail-back survey (n=2,233; 93%)
online completion (n=160;7%).
VET Australian students:
self-completion in the classroom with a consultant available to answer any queries or address any difficulties (information on number of respondents is not available)
self-completion mail-back survey (n=330; 64%)
online completion (n=183; 36%).
Schools international students:
self-completion in the classroom with a consultant available to answer any queries or address any difficulties (n=230; 33%)
self-completion mail-back survey (n=475; 67%).
ELICOS international students:
self-completion in the classroom with a consultant available to answer any queries or address any difficulties (n=291; 50%)
self-completion mail-back survey (n=293; 50%).

International Student Survey 2006 Report of the Consolidated Results from the Four Education Sectors in Australia
[5]
2.2 Sample characteristics In 2006, a total of 7,267 international students from 113 countries took part in the ISS.
Figure 1: Percentage of respondents by country/region of permanent residence
Note: 14 students did not nominate their country of permanent residence
Malaysia/Singapore
n=72918%
China/Hong Kong n=1983
27%
North Asia n=2103%
South America n=2093%
Pacific n=801%
Indonesia n=362
5%
South-East Asia n=4166%
Korea n=439
6%
India n=539
7%
Thailand n=336
5%
Japan n=355
5%
Europe n=6419%
North America n=2874%
Other n=667
9%

International Student Survey 2006 Report of the Consolidated Results from the Four Education Sectors in Australia
[6]
For the purposes of this report, some countries were combined to create 14 country/regions (see Figure 1). These countries/regions are:
China/Hong Kong (n=1983) Malaysia/Singapore (n=729) Europe (n=641)
(Denmark, France, Germany, Cyprus, Hungary, Ireland, Lithuania, Norway, Portugal, Slovakia, Sweden, United Kingdom, Austria, Czech Republic, Switzerland, Netherlands, Italy, Romania, Iceland, Russia/Russian Federation, Poland, Croatia, Estonia, Belgium, Greece, Finland, Bulgaria, Serbia, Spain, Slovenia, and Latvia)
India (n=539) Korea (n=439) South-East Asia (n=416)
(Bangladesh, Brunei, Cambodia, Philippines, Vietnam, Myanmar/Burma, Laos and East Timor)
Indonesia (n=362) Japan (n=355) Thailand (n=336) North America (n=287)
(the USA and Canada) North Asia (n=210)
(Mongolia, Taiwan and Macau) South America (n=209)
(Brazil, Colombia, El Salvador, Jamaica, Mexico, Peru, Venezuela, Chile, Argentina and Ecuador)
Pacific (n=80) (Fiji, Papua New Guinea, Samoa, New Zealand, New Caledonia, Vanuatu, Tonga, Solomon Islands and Tuvalu)
Other (n= 667) (including: Bahrain, Bhutan, Botswana, Egypt, Ghana, Iran, Israel, Jordan, Kenya, Kiribati, Kuwait, Lebanon, Libya, Madagascar, Malawi, Maldives, Mauritius, Nepal, Nigeria, Oman, Pakistan, Panama, Qatar, Reunion Island, Saudi Arabia, Seychelles, Sierra Leone, South Africa, Sri Lanka, Sudan, Syria, Tajikistan, Tanzania, Tunisia, Turkey, Uganda, United Arab Emirates, Zambia, Zimbabwe and more).
As shown in Table 1, in the HE sample, there were 3,585 students with the top five countries/regions comprising 69% of the total (China/Hong Kong, 28%; Malaysia/Singapore 18%; Europe 10%; India 7%; and North America, 6%).
In the VET sample, there were 2,393 students with the top five countries/regions making up 57% of the total (China/Hong Kong, 20%; India, 12%; South-East Asia, 9%; Korea, 8% and Europe, 8%).
In the ELICOS sector, 584 students responded to the survey. The top five countries/regions made up 79% of the total (Korea 26%, Japan 20%, Europe 13%, South America 12% and North Asia 8%).

International Student Survey 2006 Report of the Consolidated Results from the Four Education Sectors in Australia
[7]
For the Schools sector, the sample was made up of 705 students. The majority of the respondents in the Schools sector came from China or Hong Kong (65%) with the rest of the countries being more evenly spread (Korea 9%, Japan 6%, Malaysia/Singapore and Thailand 4% each). It should be noted that, for the Schools sample, all but three of the origin countries had sample sizes of less than 30 respondents making statistical analysis unreliable for these markets.
Table 1: Sample sizes by sector and country/region of permanent residence and sector
Samples size by country and % of total by sector
Country/Region HE VET ELICOS Schools TOTAL
China/Hong Kong n=1006 (28%) n=477 (20%) n=42 (7%) n=458 (65%) n=1983 (27%)
Malaysia/Singapore n=628 (18%) n=70 (3%) n=2* (0%) n=29* (4%) n=729 (10%)
Europe n=353 (10%) n=191 (8%) n=73 (13%) n=24* (3%) n=641 (9%)
India n=245 (7%) n=293 (12%) n=1* (0%) n=0* (0%) n=539 (7%)
Korea n=44 (1%) n=182 (8%) n=153 (26%) n=60 (9%) n=439 (6%)
South-East Asia n=164 (5%) n=226 (9%) n=6* (1%) n=20* (3%) n=416 (6%)
Indonesia n=213 (6%) n=129 (5%) n=2* (0%) n=18* (3%) n=362 (5%)
Japan n=67 (2%) n=130 (5%) n=114 (20%) n=44 (6%) n=355 (5%)
Thailand n=104 (3%) n=175 (7%) n=31 (5%) n=26* (4%) n=336 (5%)
North America n=232 (6%) n=55 (2%) n=0* (0%) n=0* (0%) n=287 (4%)
North Asia n=106 (3%) n=42 (2%) n=48 (8%) n=14* (2%) n=210 (3%)
South America n=65 (2%) n=71 (3%) n=69 (12%) n=4* (1%) n=209 (3%)
Pacific n=56 (2%) n=20* (1%) n=1* (0%) n=3* (0%) n=80 (1%)
Other n=302 (8%) n=332 (14%) n=28* (5%) n=5* (1%) n=667 (9%)
Not answered n=0* (0%) n=0* (0%) n=14* (2%) n=0* (0%) n=14* (0%)
Total n=3585 (100%) n=2393 (100%) n=584 (100%) n=705 (100%) n=7267 (100%) * Cell size is less than 30 respondents – treat with caution and as indicative only.

International Student Survey 2006 Report of the Consolidated Results from the Four Education Sectors in Australia
[8]
3. Overall satisfaction and advocacy
The majority of international respondents would be strong advocates for Australian education and for Australia in general. The majority of final year international HE and VET respondents aspired to live in Australia.
Table 2 shows a summary of the levels of satisfaction reported by international students in Australia for four key indicators in 2006. The vast majority of students were satisfied or very satisfied with living in Australia (84%), the study experience in Australia (83%), the course (82%) and the quality of education (78%). Five per cent or fewer respondents reported being dissatisfied or very dissatisfied on three of these indicators with 8% reporting dissatisfaction with the quality of education.
Table 2: Summary of key indicators of overall satisfaction by level of satisfaction
Very satisfied
Satisfied Neither/ nor
Dissatisfied Very dissatisfied
Don't know
TOTAL
Satisfaction with living in Australia (all sectors)
22% 62% 11% 3% 0% 1% 100%
Satisfaction with study experience in Australia (HE, VET + Schools)
20% 63% 11% 4% 1% 1% 100%
Satisfaction with course (HE, VET + ELICOS)
20% 62% 12% 4% 1% 1% 100%
Satisfaction with quality of education (HE, VET + ELICOS)
20% 58% 13% 6% 2% 0% 100%
Base: All education sectors in which this question was asked.
When considering the key indicators by education sector (see Table 3), it is clear that the level of satisfaction reported was slightly lower among ELICOS respondents on all indicators except satisfaction with the quality of education, on which this sector rated the highest level of satisfaction.
VET respondents were more likely to think that their studies in Australia would be helpful in getting them a good job when they completed their course, and were slightly more likely to be planning to apply, or had already applied, for permanent residency in Australia. VET respondents were also slightly more likely to be satisfied with living in Australia compared to respondents from other sectors.
HE respondents reported higher levels satisfaction with the study experience and the course.

International Student Survey 2006 Report of the Consolidated Results from the Four Education Sectors in Australia
[9]
Table 3: Key indicators of overall satisfaction and advocacy by sector
Yes or very satisfied/satisfied Key indicators
HE VET ELICOS Schools TOTAL
Recommend studying in Australia 88% 87% 85% 82% 87%
Satisfied with living in Australia 84% 88% 79% 82% 85% Satisfied with study experience 85% 82% NA 84% 84%
Satisfied with course 83% 81% 76% NA 82% Satisfied with quality of education 77% 80% 83% NA 78%
Help in getting good job 68% 74% 68% 71% 71% Apply for permanent residency 63% 73% 21% NA 63%
The vast majority of respondents in all sectors would recommend studying in Australia to friends or family.

International Student Survey 2006 Report of the Consolidated Results from the Four Education Sectors in Australia
[10]
3.1 Recommending studying in Australia
Eighty seven per cent of international respondents would recommend studying in Australia.
The proportions were very high in all sectors, but were slightly higher in the HE (88%) and VET (87%) sectors compared to the ELICOS (85%) and Schools (82%) sectors.
Figure 2: Would recommend studying in Australia by sector
Advocacy across the four sectors was highest among respondents from South-East Asia and South America (each 94%), North America, Europe and Pacific countries (each 93%), Malaysia/Singapore (91%) and Indonesia (90%). Although still positive, advocacy was slightly lower among respondents from Korea (79%), Japan (80%), North Asia (82%) and China/Hong Kong (83%) (see Figure 3).
A common theme was found through this report. Results of the four sectors showed that while they would recommend studying in Australia, respondents from countries in the Northern Asian region such as Japan, Korea, China/Hong Kong and Taiwan, were not as strong advocates for Australian education as respondents from most of the other countries. Respondents from these markets reported lower levels of satisfaction in many areas covered in this report.
88% 87% 85% 82%87%
0%
20%
40%
60%
80%
100%
n=3162 n=2051 n=481 n=587 n=6281
HE VET/TAFE ELICOS SCHOOL TOTAL
International Student Survey 2006 Report of the Consolidated Results from the Four Education Sectors in Australia
[11]
Figure 3: Recommend studying in Australia by country/region of permanent residence
More than 90% of international HE respondents from Europe (95%), South-East Asia (95%), North America (94%), South America (92%), Malaysia/Singapore (91%) and the Pacific (91%) said they would recommend studying in Australia. Advocacy for Australian higher education, although still positive, was slightly lower among respondents from the largest market, China/Hong Kong (82%), as well as India (82%), Korea (84%), North Asia (84%) and Japan (85%) (see Table 4).
Similarly in the VET sector, advocacy, although still high, was slightly lower for respondents from Japan (74%), North Asia (75%), Korea (80%), and China/Hong Kong (84%). At least 86% of VET respondents from all other markets would recommend studying in Australia. The highest level of advocacy for this sector was from respondents from India, Malaysia, Singapore and South-East Asia (each 93%).
87%
91%
79%
80%
82%
83%
87%
88%
90%
91%
93%
93%
93%
94%
94%
0% 20% 40% 60% 80% 100%
Total
Other
Korea
Japan
North Asia
China/Hong Kong
Thailand
India
Indonesia
Malaysia/Singapore
Pacif ic
Europe
North America
South America
South-East Asia

International Student Survey 2006 Report of the Consolidated Results from the Four Education Sectors in Australia
[12]
Table 4: Recommend studying in Australia by country/region of permanent residence and sector
Recommend studying in Australia
Country/Region HE n=3162
VET n=2051
ELICOS n=481
Schools n=587
TOTAL n=6,281
Total 88% 87% 85% 82% 87% China/Hong Kong 82% 84% 80% 82% 83% Malaysia/Singapore 91% 93% 100%* 89%* 91% Europe 95% 88% 92% 91%* 93% India 82% 93% 100% 0%* 88% Korea 84% 80% 76% 77% 79% South-East Asia 95% 93% 100%* 95%* 94% Indonesia 89% 90% 100%* 94%* 90% Japan 85% 74% 88% 73% 80% Thailand 88% 86% 84%* 88%* 87% North America 94% 91% 0%* 0%* 93% North Asia 84% 75% 83% 79%* 82% South America 92% 91% 97% 100%* 94% Pacific 91% 95%* 100%* 100%* 93% Other 90% 91% 93%* 80%* 91% Not answered 0%* 0%* 43%* 0%* 3%* Q23 Would you recommend the following to friends or family? *Cell size is less than 30 respondents – treat with caution and as indicative only.
The pattern was similar among ELICOS respondents. For the majority of the markets, over 87% would recommend Australia with respondents from India, Malaysia/Singapore, Indonesia, other South-East Asian countries and Pacific countries all indicating that they would do so. Although still positive, the propensity to recommend studying in Australia was slightly lower for respondents from Korea (76%), China and Hong Kong (80%), and North Asia (83%).
More than four out of five Schools respondents would recommend studying in Australia, with statistically significant analysis only possible for China/Hong Kong (82%), Korea (77%) and Japan (73%).
In summary, high levels of advocacy were found among international respondents for studying in Australia, although advocacy was lower among respondents from Northern Asian region – particularly Korea, Japan, Taiwan and China/Hong Kong.

International Student Survey 2006 Report of the Consolidated Results from the Four Education Sectors in Australia
[13]
3.2 Satisfaction with the course being completed
Eighty two per cent of international respondents were very satisfied or satisfied with the course they were completing in Australia. Slightly more HE respondents were satisfied (83%) compared to respondents from the VET sector (81%) and ELICOS sector (76%).
Across the three sectors in which this issue was explored (HE, VET and ELICOS), course satisfaction was found to be highest among respondents from Pacific countries (95%), South-East Asia (92%), India (87%) and Malaysia/Singapore (86%). Although still positive, respondents from Japan (71%), Korea (72%), North Asia and South America (each 77%) and China/Hong Kong (78%) reported lower levels of satisfaction (see Figure 4).
Figure 4: Very satisfied or satisfied with course by country/region of permanent residence
HE respondents from the Pacific (95%), South-East Asia (90%), Malaysia/Singapore (86%), Thailand (85%) and India (85%) reported the highest levels of course satisfaction. Respondents from Korea (75%), North Asia (77%) and China/Hong Kong (78%) reported slightly lower levels of satisfaction with their course. Eighty per cent of Japanese and North American HE respondents said they were satisfied or very satisfied with their course (see Table 5).
82%
89%
71%
72%
77%
77%
78%
80%
80%
82%
83%
86%
87%
92%
95%
0% 20% 40% 60% 80% 100%
Total
Other
Japan
Korea
North Asia
South America
China/Hong Kong
Thailand
Indonesia
Europe
North America
Malaysia/Singapore
India
South-East Asia
Pacific

International Student Survey 2006 Report of the Consolidated Results from the Four Education Sectors in Australia
[14]
Among VET respondents, the highest levels of course satisfaction were reported by North American (96%), South-East Asian (93%) and Indian (88%) respondents. Lower levels of satisfaction were noted by respondents from Japan and South America (each 63%), North Asia (71%), Korea (73%), Indonesia (76%) and China/Hong Kong (77%). Again, there was a relatively lower course satisfaction found among respondents in the Northern Asian region than other countries.
Where statistical analysis was possible for ELICOS respondents, course satisfaction was highest for respondents from Europe (88%) and South America (87%) and lower for Korean (70%) and Japanese (74%) respondents.
Table 5: Satisfaction with course by country/region of permanent residence and sector
Very satisfied/satisfied with the course Country/Region HE
n=2985 VET
n=1924 ELICOS n=445
TOTAL n=5354
Total 83% 81% 76% 82% China/Hong Kong 78% 77% 79% 78% Malaysia/Singapore 86% 79% 100%* 86% Europe 83% 79% 88% 82% India 85% 88% 100%* 87% Korea 75% 73% 70% 72% South-East Asia 90% 93% 100%* 92% Indonesia 83% 76% 100%* 80% Japan 80% 63% 74% 71% Thailand 85% 79% 71%* 80% North America 80% 96% 0%* 83% North Asia 77% 71% 81% 77% South America 83% 63% 87% 77% Pacific 95% 95%* 100%* 95% Other 88% 92% 71%* 89% Not answered 0%* 0%* 29%* 2%* Q22 Overall, how satisfied are you with the course you are currently completing? (Tick one box only) * Cell size is less than 30 respondents – treat with caution and as indicative only.
In summary, most international respondents were satisfied with their course in Australia, with respondents from countries in the Northern Asia region a little less satisfied.

International Student Survey 2006 Report of the Consolidated Results from the Four Education Sectors in Australia
[15]
3.3 Satisfaction with the quality of education in Australia
Seventy eight per cent of international respondents were satisfied with the quality of the education they received in Australia.
Satisfaction with the quality of education was lower in the HE sector (77%) than in the VET sector (80%), and was highest in ELICOS (83%) sector. This order is the reverse of that reported for recommending studying in Australia or course satisfaction.
Figure 5: Very satisfied or satisfied with quality of education by sector
Across the three sectors for which this issue was explored (HE, VET and ELICOS), satisfaction with education quality was highest among respondents from Pacific countries (91%) and South-East Asia (87%). Although positive, slightly lower satisfaction was reported for respondents from Japan (70%), Korea (71%), South America (73%), North Asia and China/Hong Kong (each 74%) (see Figure 6).
77%80% 83%
78%
0%
20%
40%
60%
80%
100%
n=2765 n=1911 n=467 n=5143
HE VET/TAFE ELICOS TOTAL

International Student Survey 2006 Report of the Consolidated Results from the Four Education Sectors in Australia
[16]
Figure 6: Satisfaction with the quality of education by country/region of permanent residence
As seen in Table 6 on the following page, perceptions of the quality of education in the HE sector were highest for respondents from the Pacific (89%), Indonesia and Thailand (both 83%), Malaysia and Singapore (82%) and South-East Asia (80%). Quality perceptions were lower for respondents from North Asia (67%), South America (69%), China/Hong Kong (73%), Europe (73%) and Japan (74%), with India and North America (76% each). Expectations concerning the quality of HE may be slightly higher for respondents from these countries.
78%
85%
70%
71%
73%
74%
74%
77%
80%
81%
82%
82%
82%
87%
91%
0% 20% 40% 60% 80% 100%
Total
Other
Japan
Korea
South America
North Asia
China/Hong Kong
Europe
North America
Thailand
Indonesia
Malaysia/Singapore
India
South-East Asia
Pacif ic

International Student Survey 2006 Report of the Consolidated Results from the Four Education Sectors in Australia
[17]
Table 6: Satisfaction with quality of education by country/region of permanent residence and sector
Very satisfied/satisfied with quality of education
Country/Region HE n=2765
VET n=1911
ELICOS n=467
TOTAL n=5143
Total 77% 80% 83% 78% China/Hong Kong 73% 76% 78% 74% Malaysia/Singapore 82% 83% 100%* 82% Europe 73% 78% 93% 77% India 76% 87% 100%* 82% Korea 52%* 68% 79% 71% South-East Asia 80% 93% 100%* 87% Indonesia 83% 78% 100%* 82% Japan 74% 58% 81% 70% Thailand 83% 80% 74%* 81% North America 76% 96% 0%* 80% North Asia 67% 76% 87% 74% South America 69% 67% 81% 73% Pacific 89% 95%* 100%* 91% Other 81% 88% 88%* 85% Not answered 0%* 0%* 57%* 5%* Q20a How satisfied are you with each of the following aspects of the university at which you are studying? * Cell size is less than 30 respondents – treat with caution and as indicative only.
In the VET sector, 80% of respondents were satisfied or very satisfied with the quality of education they received in Australia. Overall, quality perceptions in this sector were highest for respondents from North America (96%), South-East Asia (93%) and India (87%). Perceptions of quality were lower than average for respondents from Japan (58%), South America (67%), Korea (68%), and North Asia and China/Hong Kong (each 76%).
For the markets in the ELICOS sector for which statistical analysis was reliable, satisfaction with the quality of education was highest amongst respondents from Europe (93%) and North Asia (87%) and lower for respondents from China/Hong Kong (78%) and Korea (79%).

International Student Survey 2006 Report of the Consolidated Results from the Four Education Sectors in Australia
[18]
3.4 Satisfaction with the study experience in Australia
More than 80% of international respondents were satisfied or very satisfied with their study experience in Australia (84%) – 85% of respondents in HE, 84% of respondents at School and 82% of respondents in the VET sector (this item was not measured in the ELICOS sector).
Across these three sectors, satisfaction with the study experience was highest for respondents from Pacific countries (92%), South-East Asia (91%), Europe (88%), Malaysia/Singapore and South America (each 87%). Although still positive, levels of satisfaction with the study experience were lower for respondents from Japan (73%), Korea (75%), China/Hong Kong (80%) and North Asia (82%).
Table 7: Satisfaction with study experience by country/region of permanent residence and sector
Very satisfied/satisfied with study experience Country/Region HE
n=3059 VET
n=1953 Schools n=605
TOTAL n=5617
Total 85% 82% 84% 84% China/Hong Kong 81% 78% 82% 80% Malaysia/Singapore 88% 83% 83%* 87% Europe 90% 84% 92%* 88% India 82% 88% 0%* 85% Korea 73% 71% 90% 75% South-East Asia 91% 91% 90%* 91% Indonesia 86% 81% 78%* 84% Japan 82% 65% 82% 73% Thailand 81% 82% 96%* 83% North America 81% 98% 0%* 85% North Asia 82% 81% 86%* 82% South America 88% 86% 100%* 87% Pacific 91% 95%* 100%* 92% Other 89% 89% 80%* 89% Q20b Overall, how satisfied are you with your study experience in Australia? (Tick one box only) * Cell size is less than 30 respondents – treat with caution and as indicative only.
Satisfaction with the HE experience was slightly higher for respondents from the Pacific and South-East Asia (both 91%), Europe (90%), Malaysia/Singapore (88%) and Indonesia (86%). Korean respondents (73%) were the only group to record a proportion below 80%.

International Student Survey 2006 Report of the Consolidated Results from the Four Education Sectors in Australia
[19]
In the VET sector, satisfaction with the study experience was highest among North American respondents (98%) followed by South-East Asia (91%), India (88%) and South America (86%). Lower levels of satisfaction with the study experience were reported by VET respondents from Japan (65%), Korea (71%) and China/Hong Kong (78%).
Where statistical analysis was possible among final year international School respondents, satisfaction with the study experience was above average for Korea (90%). The level of satisfaction for respondents from Japan and China/Hong Kong was 82% for both countries.
3.5 Satisfaction with living in Australia
Eighty five per cent of international respondents were satisfied or very satisfied with living in Australia. High levels of satisfaction were reported by respondents in all sectors – VET (88%), HE (84%), Schools (82%) and ELICOS (79%).
Across all sectors, satisfaction with living in Australia was highest among respondents from Europe (96%), South America (95%), South-East Asia (92%) and India (91%). Although still positive, it was lower for the majority of respondents from Japan (77%), Korea (78%), North Asia and China/Hong Kong (79%).
In the HE sector, satisfaction with living in Australia was highest among respondents from Europe (97%), South America (94%), South-East Asia (91%), North America (87%), India (87%), and Indonesia (86%). It was slightly lower for respondents from Korea (73%), North Asia (75%), China/Hong Kong (77%) and Japan (79%) (see Table 8).
VET respondents reporting the highest levels of satisfaction with living in Australia were from South America (97%), North America and Europe (each 96%), India (95%), South-East Asia (92%) and Indonesia (90%). Lower levels of satisfaction with living in Australia were reported by VET respondents from Japan (75%), North Asia (78%), Korea (80%), China/Hong Kong (81%) and Malaysia/Singapore (82%).
Satisfaction with living in Australia was also high amongst ELICOS respondents, particularly respondents from South America (94%), Europe (92%) and North Asia (88%). Slightly lower results were reported among respondents from Korea (75%), Japan (78%) and China/Hong Kong (81%).

International Student Survey 2006 Report of the Consolidated Results from the Four Education Sectors in Australia
[20]
Table 8: Satisfaction with living in Australia by country/region of permanent residence and sector
Very satisfied/satisfied with living in Australia Country/Region HE
n=3028 VET
n=2048 ELICOS n=464
Schools n=581
TOTAL n=6121
Total 84% 88% 79% 82% 85% China/Hong Kong 77% 81% 81% 81% 79% Malaysia/Singapore 83% 82% 100%* 86%* 83% Europe 97% 96% 92% 92%* 96% India 87% 95% 100%* 0%* 91% Korea 73% 80% 75% 86% 78% South-East Asia 91% 92% 100%* 100%* 92% Indonesia 86% 90% 100%* 71%* 87% Japan 79% 75% 78% 74% 77% Thailand 81% 84% 74%* 88%* 82% North America 87% 96% 0%* 0%* 89% North Asia 75% 78% 88% 75%* 79% South America 94% 97% 94% 100%* 95% Pacific 82% 90%* 100%* 67%* 84% Other 90% 93% 54%* 80%* 90% Not answered 0%* 0%* 21%* 0%* 2%* Q32b Overall, how satisfied are you with living in Australia? (Tick one box only) *Cell size is less than 30 respondents – treat with caution and as indicative only.
3.6 Getting a good job Seventy one per cent of international respondents felt that their current studies in Australia would be helpful in getting them a good job. This applied to two-thirds of HE and ELICOS respondents (each 68%), 70% of Schools respondents and 74% of VET respondents.
Across the four sectors, respondents from Pacific countries (84%), South America (82%), South-East Asia (80%), Thailand (79%), Indonesia and Europe (each 75%) were most likely to think that their Australian studies would help them get a good job. Respondents from North America (58%), Japan (59%), China/Hong Kong (62%), India (65%), Korea and North Asia (each 69%) were slightly less likely to feel this way (see Table 9).

International Student Survey 2006 Report of the Consolidated Results from the Four Education Sectors in Australia
[21]
Table 9: Whether current studies are helpful for job prospects by country/region of permanent residence and sector
Helpful in getting good job Country/Region HE
n=2463 VET
n=1744 ELICOS n=397
Schools n=506
TOTAL n=4604
Total 68% 74% 68% 71% 71% China/Hong Kong 58% 64% 67%* 70% 62% Malaysia/Singapore 68% 73% 100%* 69%* 72% Europe 78% 70% 75% 79%* 75% India 61% 80% 100%* 0%* 65% Korea 61%* 78% 68% 80% 69% South-East Asia 77% 87% 67%* 80%* 80% Indonesia 69% 79% 100%* 72%* 75% Japan 64% 54% 52% 59%* 59% Thailand 77% 80% 84%* 81%* 79% North America 77% 63% 0%* 0%* 58% North Asia 66% 79% 56%* 57%* 69% South America 86% 76% 93% 75%* 82% Pacific 88% 70%* 100%* 100%* 84% Other 80% 79% 64%* 80%* 78% Not answered 0%* 0%* 43%* 0%* 3%* Q24 Do you think your current studies in Australia will be helpful in getting you a good job when you complete your course? *Cell size is less than 30 respondents – treat with caution and as indicative only.
The HE respondents who were most likely to think that their Australian studies would be helpful in getting a good job were from Pacific countries (88%), South America (86%), Europe (78%), and North America, Thailand and South-East Asia (each 77%). Respondents less likely to think that their studies would help them get a good job were from China/Hong Kong (58%), India (61%), Japan (64%) and North Asia (66%).
VET respondents who were more likely to feel that their studies would help them obtain a good job were from South-East Asia (87%), India and Thailand (each 80%), North Asia and Indonesia (each 79%) and Korea (78%). The respondents who were less likely to feel that their studies would help were from Japan (54%), North America (63%), and China/Hong Kong (64%).
Little analysis was possible on this aspect for ELICOS and Schools respondents at the market level. However, South American (93%) and European (75%) ELICOS respondents were more likely to believe that their studies would help them get a good job, and only 52% of Japanese ELICOS respondents believed that their studies would help them with finding a job.
Among final year Schools respondents, 71% felt that their Australian studies would be helpful in getting them a good job in the future. The highest proportion who thought this were Korean students (80%).

International Student Survey 2006 Report of the Consolidated Results from the Four Education Sectors in Australia
[22]
3.7 Permanent residency Across the HE, VET and ELICOS sectors, 63% of international students were planning to apply, or had already applied, for permanent residency in Australia. Within each sector, 73% of VET respondents had applied, or were planning to apply compared to 63% of HE respondents and 21% of ELICOS respondents.
Table 10: Whether planning to apply for permanent residency by country/region of permanent residence and sector
Planning to apply or applied for permanent residency Country/Region HE
n=2284 VET
n=1689 ELICOS n=125
TOTAL n=4098
Total 63% 73% 21% 63% China/Hong Kong 75% 77% 38%* 75% Malaysia/Singapore 70% 71% 50%* 70% Europe 41% 58% 11%* 43% India 75% 82% 100%* 79% Korea 77% 79% 18%* 53% South-East Asia 56% 90% 17%* 74% Indonesia 63% 81% 100%* 70% Japan 54% 44% 9%* 33% Thailand 48% 69% 39%* 59% North America 34% 9%* 0%* 29% North Asia 51% 62%* 27%* 47% South America 55% 65% 25%* 48% Pacific 45%* 55%* 0%* 47% Other 69% 78% 50%* 73% Not answered 0%* 0%* 14%* 0%* Q35a Are you planning to apply or have you already applied for a permanent residency (PR) in Australia? (Tick one box only) * Cell size is less than 30 respondents – treat with caution and as indicative only.
Permanent residency in Australia was more likely to be the goal for respondents from India (79%), China/Hong Kong (75%), South-East Asia (74%), Malaysia/Singapore and Indonesia (each 70%). It was less likely to be a goal for respondents from North America (29%), Japan (33%), Europe (43%), North Asia and Pacific countries (each 47%) and South America (48%).
HE students from Korea (77%), China/Hong Kong and India (each 75%) and Malaysia/Singapore (70%) were most likely to seek permanent residency status, with those from North America (34%), Europe (41%), Thailand (48%) and North Asia (51%) less likely to do so.

International Student Survey 2006 Report of the Consolidated Results from the Four Education Sectors in Australia
[23]
In the VET sector, more than three-quarters of respondents from the following countries were seeking permanent residency – South-East Asia (90%), India (82%), Indonesia (81%), Korea (79%) and China/Hong Kong (77%). Lower proportions were reported by Japanese (44%), European (58%) and South American (65%) students.
Analysis by market was not possible in the ELICOS sector because of the relatively low proportion of students planning to apply for permanent residency in Australia.
3.8 Summary of key points Most respondents reported that they would be advocates for Australian education and most
were satisfied with their course, their study experience and with living in Australia. Satisfaction levels were often lower among respondents from Japan, Korea and
China/Hong Kong. The majority of respondents believed that their Australian studies would help them obtain
a good job. With the exception of ELICOS respondents, the majority of respondents aspired to gain
permanent residence in Australia. Permanent residency was found to be a goal most likely for students from India, China and South-East Asia.
Respondents from the world’s most advanced economies, North America and Japan, and the emerging economies of China and India, as well as Korea and North Asia, were slightly less likely to think that their Australian studies would help them get a good job on completion. This is a key point of interest as it places the Australian education delivery within the real-life competitive environment of education provided in their home countries and by Australia’s international competitors.
As the attraction of permanent residency is less likely to be a goal for students from Japan, North America and Europe, the challenge for Australian education providers will be to optimally satisfy their needs. This is particularly important given the significance of word-of-mouth promotion in deciding on a study destination and a course.
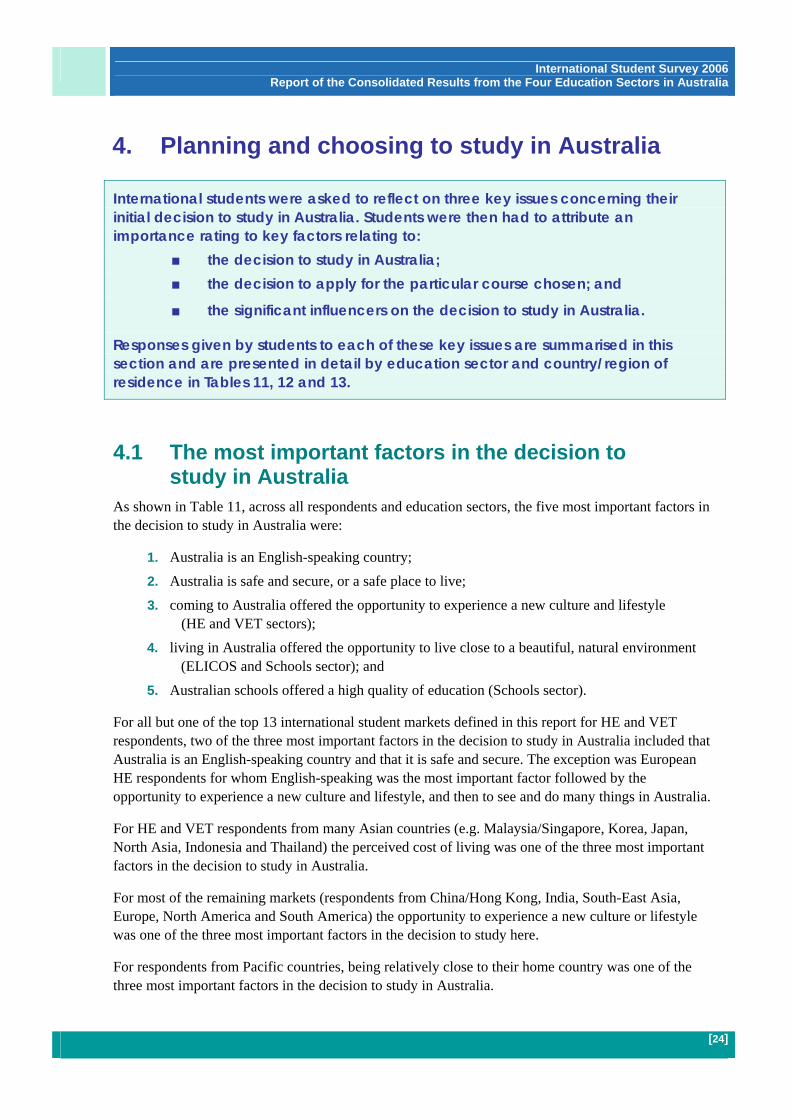
International Student Survey 2006 Report of the Consolidated Results from the Four Education Sectors in Australia
[24]
4. Planning and choosing to study in Australia
International students were asked to reflect on three key issues concerning their initial decision to study in Australia. Students were then had to attribute an importance rating to key factors relating to: the decision to study in Australia; the decision to apply for the particular course chosen; and
the significant influencers on the decision to study in Australia.
Responses given by students to each of these key issues are summarised in this section and are presented in detail by education sector and country/region of residence in Tables 11, 12 and 13.
4.1 The most important factors in the decision to study in Australia
As shown in Table 11, across all respondents and education sectors, the five most important factors in the decision to study in Australia were:
1. Australia is an English-speaking country; 2. Australia is safe and secure, or a safe place to live; 3. coming to Australia offered the opportunity to experience a new culture and lifestyle
(HE and VET sectors); 4. living in Australia offered the opportunity to live close to a beautiful, natural environment
(ELICOS and Schools sector); and 5. Australian schools offered a high quality of education (Schools sector).
For all but one of the top 13 international student markets defined in this report for HE and VET respondents, two of the three most important factors in the decision to study in Australia included that Australia is an English-speaking country and that it is safe and secure. The exception was European HE respondents for whom English-speaking was the most important factor followed by the opportunity to experience a new culture and lifestyle, and then to see and do many things in Australia.
For HE and VET respondents from many Asian countries (e.g. Malaysia/Singapore, Korea, Japan, North Asia, Indonesia and Thailand) the perceived cost of living was one of the three most important factors in the decision to study in Australia.
For most of the remaining markets (respondents from China/Hong Kong, India, South-East Asia, Europe, North America and South America) the opportunity to experience a new culture or lifestyle was one of the three most important factors in the decision to study here.
For respondents from Pacific countries, being relatively close to their home country was one of the three most important factors in the decision to study in Australia.
International Student Survey 2006 Report of the Consolidated Results from the Four Education Sectors in Australia
[25]
Being an English-speaking country was clearly the most important factor in the decision to study in Australia for ELICOS students, followed by the natural environment and safety and security. The high quality of education in Australia was one of the three most important factors mentioned by ELICOS respondents from China/Hong Kong, Malaysia/Singapore, Korea, South-East Asia, Indonesia, Thailand, South America and the Pacific countries. This emphasises the importance of delivering high quality education to these respondents so they will positively promote the Australian study experience on their return home. Proximity to home was an important factor for ELICOS respondents from Indonesia and the Pacific countries. Cost was an important issue for Korean ELICOS respondents.
The high quality of education provided in Australia, the opportunity to live close to the natural environment, and perceptions of safety, were the three most important factors reported by Schools respondents in the decision to study in Australia. The fact that Australia is an English-speaking country was one of the three most important factors mentioned by Schools respondents from most markets (Malaysia/Singapore, Indonesia, South-East Asia, North Asia, Korea, Japan, Thailand, Europe, South America and the Pacific countries). Some specific factors that were important for Schools respondents from specific markets were:
having relatives and friends in Australia (for Malaysian/Singapore school students); Australians being seen as friendly (for European school students); the low cost of education compared to other countries (for Korean, North Asian,
South-East Asian and Thai school students) and the low cost of living (for Thai students); and
the ability to work part-time in Australia (for South American school students).

International Student Survey 2006 Report of the Consolidated Results from the Four Education Sectors in Australia
[26]
Table 11: Importance of the factors in decision to study in Australia by country/region of permanent residence and sector
Country/Region HE n=3585
VET n=2393
ELICOS n=584
Schools n=705
English-speaking country (90%)
English-speaking country (94%)
English-speaking country (77%)
High quality of education (53%)
Safe and secure (87%)
Safe and secure (87%)
Live close to natural environment (60%)
Live close to natural environment (53%)
Total
Experience a new culture/lifestyle (78%)
Experience a new culture/lifestyle (79%)
Safe place to live (55%)
Safe place to live (50%)
English-speaking country (92%)
English-speaking country (94%)
English-speaking country (90%)
Live close to natural environment (58%)
Safe and secure (90%)
Safe and secure (82%)
Live close to natural environment (66%)
High quality of education (57%)
China/Hong Kong
Experience a new culture/lifestyle (80%)
Experience a new culture/lifestyle (75%)
High quality of education (63%)
Safe place to live (49%)
Safe and secure (91%)
Safe and secure (94%)
High quality of education (59%*)
Relative/friend(s) live in Australia (100%*)
Cost of living (87%) English-speaking country (90%)
Friend/relative recommended the school (52%*)
English-speaking country (100%*)
Malaysia/Singapore
English-speaking country (83%)
Cost of living (86%) Safe place to live (48%*)
Safe place to live (100%*)
English-speaking country (92%)
English-speaking country (91%)
Live close to beautiful/natural environment (67%*)
English-speaking country (75%)
Experience a new culture/lifestyle (82%)
Experience a new culture/lifestyle (75%)
Weather (58%*) Live close to beautiful/natural environment (67%)
Europe
Many things to see and do (75%)
Safe and secure (72%)
Safe place to live (46%*)
Friendly people (58%)
Safe and secure (93%)
Safe and secure (97%)
– –
English-speaking country (89%)
English-speaking country (94%)
– –
India
Experience a new culture/lifestyle (85%)
Experience a new culture/lifestyle (91%)
– –
English-speaking country (95%)
English-speaking country (97%)
High quality of education (48%*)
English-speaking country (70%)
Safe and secure (89%)
Cost of living (79%) Safe place to live (35%*)
Live close to beautiful/natural environment (53%)
Korea
Cost of living (77%) Safe and secure (78%)
Low cost of education compared to other countries (33%*)
Low cost of education compared to other countries (43%)
English-speaking country (96%)
English-speaking country (99%)
High quality of education (80%*)
English-speaking country (67%*)
Safe and secure (92%)
Safe and secure (95%)
Safe place to live (70%*)
High quality of education (67%*)
South-East Asia
Experience a new culture/lifestyle (81%)
Experience a new culture/lifestyle (83%)
Live close to beautiful/natural environment (55%*)
Low cost of education compared to other countries (50%*)
Continued over

International Student Survey 2006 Report of the Consolidated Results from the Four Education Sectors in Australia
[27]
Safe and secure (94%)
Safe and secure (95%)
Close to your home country (72%*)
English-speaking country (100%*)
English speaking country (94%)
English speaking country (94%)
High quality of education (50%*)
High quality of education (100%*)
Indonesia
Cost of living (84%) Cost of living (80%) Safe place to live (50%*)
Safe place to live (100%*)
English-speaking country (97%)
English speaking country (95%)
Safe place to live (68%)
English-speaking country (80%)
Safe and secure (89%)
Safe and secure (91%)
Live close to beautiful/natural environment (55%*)
Safe place to live (80%)
Japan
Cost of living (88%) Cost of living (85%) Visited Australia before (39%*)
Live close to beautiful/natural environment (64%)
English-speaking country (95%)
English-speaking country (97%)
High quality of education (58%*)
English-speaking country (71%*)
Safe and secure (91%)
Safe and secure (91%)
Safe place to live (58%*)
Low cost of education compared to other countries (61%*)
Thailand
Cost of living (84%) Cost of living (91%) Relative/friend(s) live in Australia (42%*)
Low cost of living compared to other countries (61%*)
English-speaking country (88%)
English-speaking country (82%)
– –
Experience a new culture/lifestyle (81%)
Experience a new culture/lifestyle (71%)
– –
North America
Safe and secure (81%)
Safe and secure (56%)
– –
Safe and secure (93%)
Safe and secure (93%)
Safe place to live (57%*)
English-speaking country (77%*)
English-speaking country (91%)
English-speaking country (90%)
Live close to beautiful/natural environment (57%*)
Live close to beautiful/natural environment (60%*)
North Asia
Cost of living (87%) Cost of living (79%) Visited Australia before (50%*)
Low cost of education compared to other countries (57%*)
English speaking country (91%)
English speaking country (96%)
Safe place to live (75%*)
English speaking country (74%)
Experience a new culture/lifestyle (88%)
Experience a new culture/lifestyle (90%)
High quality of education (50%*)
Live close to beautiful/natural environment (70%)
South America
Safe and secure (86%)
Safe and secure (89%)
Live close to beautiful/natural environment (50%*)
Able to work part-time (59%)
Relatively close to your home country (73%)
Safe and secure (89%*)
High quality of education (100%*)
English speaking country (100%*)
English speaking country (71%)
English speaking country (89%*)
Close to your home country (100%*)
Safe place to live (100%*)
Pacific
Safe and secure (63%)
Relatively close to your home country (79%*)
Safe place to live (50%*)
Live close to beautiful/natural environment (100%*)
*Cell size is less than 30 respondents – treat with caution and as indicative only. – indicates that no data has been collected for this particular cell Q12. (HET and VET) When you were deciding to study in Australia, how important were each of the following factors in your decision? (Tick only one box per row) Q13. (ELICOS) Why did you choose to study in Australia? (Tick as many as apply) Q11. (SCHOOLS) Why did you and/or your family choose to have you study in Australia? (Tick as many as apply)

International Student Survey 2006 Report of the Consolidated Results from the Four Education Sectors in Australia
[28]
4.2 Important factors in deciding to apply for a course or school in Australia
Across the HE, VET and ELICOS sectors, the perceived quality of education was almost universally the most important factor in the decision to apply for the course in Australia (see Table 12). This was also the most important factor for Schools respondents.
Where the quality of education was not the most important factor, it ranked second or third to:
the perception that the course would improve the respondents’ chances of employment for European HE respondents and VET respondents from North Asia and South America;
the reputation of the institution for VET respondents from North America and the Pacific, for whom the reputation of the course was also one of the three most important factors; and
the protection provided to international ELICOS respondents by the Education Services for Overseas Students (ESOS) Act for respondents from Pacific countries.
Generally, the second and third most important factors were the perception that the course would increase their chances of employment and the reputation of the university or institution particularly for the HE and VET sectors. The third most important factor in the ELICOS sector was the protection provided by the ESOS Act.
Other factors rated in the top three by respondents in the HE sector from specific countries were:
the reputation of the course for HE students from Malaysia/Singapore, Indonesia and India; and
the cost of the course for HE students from Korea and Japan.
Other factors rated in the top three by respondents in the VET sector from specific countries were:
the reputation of the course for VET respondents from Europe, India, North America and Pacific countries; and
the cost of the course for VET respondents from Korea, Japan, Thailand and South America.
The only additional factor to the main three mentioned by ELICOS respondents from any country was that the course was not available at home – an important factor for all respondents from Pacific countries.
In the Schools sector, the quality of education and the fact that Australia was an English-speaking country were critical factors in the decision to study here, along with the opportunity to live close to a beautiful natural environment and the safety and security in Australia. Personal recommendations were also a key factor in the selection of the school. An education/study agent’s recommendation was one of the three key factors in school selection in 10 of the 11 markets for which reliable analysis was possible (the exception being Pacific countries); as was the recommendation of a friend or relative also in 10 of the 11 markets (the exception being Europe). The important role of satisfied school leavers in recommending to future Secondary School students to Australia is highlighted here.
International Student Survey 2006 Report of the Consolidated Results from the Four Education Sectors in Australia
[29]
The school being in an attractive location was in the top three selection factors for Schools respondents from Europe, Japan, North Asia and the Pacific countries, while respondents from South America looked for good student support services.

International Student Survey 2006 Report of the Consolidated Results from the Four Education Sectors in Australia
[30]
Table 12: Importance of factors in decision to choose course/School by country/region of permanent residence and sector
Country/Region HE n=3585
VET n=2393
ELICOS n=584
Schools n=705
Quality of education (94%)
Quality of education (93%)
Quality of education (96%)
English-speaking country (77%)
Course will improve your chances of employment (90%)
Course will improve your chances of employment (87%)
Course will improve your chances of employment (78%)
Live close to beautiful, natural environment (60%)
Total
Reputation of the institution/university (89%)
Reputation of the institution/university (84%)
ESOS Act protects international students (71%)
Safe place to live (55%)
Quality of education (95%)
Quality of education (93%)
Quality of education (100%)
Education/study agent recommended the school (57%)
Course will improve your chances of employment (91%)
Course will improve your chances of employment (83%)
ESOS Act protects international students (85%)
Friend/relative recommended the school (35%)
China/Hong Kong
Reputation of the institution/university (90%)
Reputation of the institution/university (79%)
Course will improve your chances of employment (78%)
High quality of education (17%)
Quality of education (97%)
Quality of education (96%)
Quality of education (100%*)
Friend/relative recommended the school (52%*)
Reputation of the institution/university (95%)
Reputation of the institution/university (94%)
Course will improve your chances of employment (100%*)
High quality of education (41%*)
Malaysia/Singapore
Reputation of the course (94%)
Course will improve your chances of employment (87%)
ESOS Act protects international students (100%*)
Education/study agent recommended the school (31%*)
Course will improve your chances of employment (86%)
Quality of education (86%)
Quality of education (89%)
Like the location (46%*)
Quality of education (85%)
Reputation of the course (79%)
Course will improve your chances of employment (86%)
Education/study agent recommended the school (42%*)
Europe
Reputation of the institution/university (74%)
Reputation of the institution/university (75%)
ESOS Act protects international students (37%*)
High quality of education (25%*)
Quality of education (98%)
Quality of education (99%)
Quality of education (100%)
–
Reputation of the institution/university (96%)
Reputation of the course (98%)
Course will improve your chances of employment (100%)
–
India
Reputation of the course (96%)
Reputation of the institution/university (97%)
(ESOS) Act protects international students (100%)
–
Quality of education (91%)
Quality of education (84%)
Quality of education (99%)
Friend/relative recommended the school (43%*)
Course will improve your chances of employment (91%)
Course will improve your chances of employment (82%)
Course will improve your chances of employment (74%)
Education/study agent recommended the school (37%*)
Korea
Cost of the course (84%)
Cost of the course (79%)
(ESOS) Act protects international students (70%)
High quality of education (22%*)

International Student Survey 2006 Report of the Consolidated Results from the Four Education Sectors in Australia
[31]
Country/Region HE n=3585
VET n=2393
ELICOS n=584
Schools n=705
Quality of education (98%)
Quality of education (97%)
Quality of education (100%*)
Friend/relative recommended the school (65%*)
Reputation of the institution/university (93%)
Course will improve your chances of employment (94%)
Course will improve your chances of employment (100%*)
Education/study agent recommended the school (45%*)
South-East Asia
Course will improve your chances of employment (91%)
Reputation of the institution/university (92%)
ESOS Act protects international students (67%*)
High quality of education (40%*)
Quality of education (97%)
Quality of education (98%)
Quality of education (100%*)
Friend/relative recommended the School (71%*)
Reputation of the institution/university (95%)
Reputation of the institution/university (91%)
Course will improve your chances of employment (100%*)
Education/study agent recommended the School (41%*)
Indonesia
Reputation of the course (90%)
Course will improve your chances of employment (90%)
ESOS Act protects international students (100%*)
High quality of education (29%*)
Quality of education (88%)
Quality of education (87%)
Quality of education (93%)
Education/study agent recommended the school (36%*)
Course will improve your chances of employment (82%)
Course will improve your chances of employment (84%)
ESOS Act protects international students (81%)
Friend/relative recommended the school (32%*)
Japan
Cost of the course (73%)
Cost of the course (79%)
Course will improve your chances of employment (62%)
Like the location (30%*)
Quality of education (96%)
Quality of education (94%)
Quality of education (97%)
Friend/relative recommended the school (60%*)
Course will improve your chances of employment (90%)
Course will improve your chances of employment (91%)
Course will improve your chances of employment (87%*)
Education/study agent recommended the School (48%*)
Thailand
Reputation of the institution/university (82%)
Cost of the course (87%)
ESOS Act protects international students (65%*)
High quality of education (24%*)
Quality of education (91%)
Reputation of the institution/university (96%)
– –
Reputation of the institution/university (82%)
Quality of education (95%)
– –
North America
Course will improve your chances of employment (80%)
Reputation of the course (93%)
– –
Quality of education (93%)
Course will improve your chances of employment (95%)
Quality of education (96%)
Education/study agent recommended the School (71%*)
Course will improve your chances of employment (88%)
Quality of education (90%)
ESOS Act protects international students (87%)
Friend/relative recommended the school (50%*)
North Asia
Reputation of the institution/university (86%)
Reputation of the institution/university (83%)
Course will improve your chances of employment (79%)
Like the location (14%*)

International Student Survey 2006 Report of the Consolidated Results from the Four Education Sectors in Australia
[32]
Country/Region HE n=3585
VET n=2393
ELICOS n=584
Schools n=705
Quality of education (98%)
Course will improve your chances of employment (90%)
Quality of education (96%)
Friend/relative recommended the school (25%*)
Course will improve your chances of employment (97%)
Cost of the course (86%)
Course will improve your chances of employment (92%)
Education/study agent recommended the school (25%*)
South America
Reputation of the institution/university (91%)
Quality of education (85%)
ESOS Act protects international students (71%)
Good student support services (25%*)
Quality of education (95%)
Reputation of the institution/university (89%*)
ESOS Act protects international students (100%*)
Friend/relative recommended the school (67%*)
Course will improve your chances of employment (91%)
Reputation of the course (89%*)
Course was not available at home (100%*)
Like the location (33%*)
Pacific
Reputation of the institution/university (89%)
Quality of education (84%*)
Quality of education (100%*)
High quality of education (33%*)
*Cell size is less than 30 respondents – treat with caution and as indicative only. – indicates that no data has been collected for this particular cell. Q13. (HE and VET) When you were deciding to apply for this course in Australia how important were each of the following factors in your decision? (Tick only one box per row) Q14. (ELICOS) When you were deciding to apply for your current English Language (ELICOS) course in Australia how important were each of the following factors in your decision? (Tick only one box per row) Q13. (SCHOOLS) Why did you and/or your family choose the School you are in now? (Tick as many as apply)

International Student Survey 2006 Report of the Consolidated Results from the Four Education Sectors in Australia
[33]
4.3 Influences on the decision to study in Australia
ELICOS sector Personal recommendation was considered to be a critical factor for ELICOS students in choosing a college. In 11 of the 12 key countries for which analysis was possible, the recommendation by an education/study agent was one of the three most important factors in choosing the college (with India as the exception). In the same 11 markets, the recommendation of a friend or relative supporting the college was also one of the three most important factors. This shows that maximising existing students’ satisfaction with their study experience in Australia is critical to the future of the ELICOS industry in Australia (see Table 13).
Other key factors influencing the choice of ELICOS college were more varied by market:
awareness of the college – important to students from Malaysia/Singapore, Thailand, Korea, North Asia and South America;
good student support services – important to students from Europe, India, Indonesia, South-East Asia and Japan; and
the ELICOS course being part of a package to do further studies in Australia – important to students from China/Hong Kong, India and the Pacific countries.
HE and VET sectors Consistent with the ELICOS sector, in both the HE and VET sectors, personal recommendation was one of the most important influences on the decision to study in Australia – both through family and friends at home, and people who were studying or had studied in Australia. These were two of the three most important influences in both sectors, as well as information on the internet. Other factors among the top three influences for specific markets included:
information about Australia in the media – HE respondents from China/Hong Kong, South-East Asia and Japan, and VET respondents from Europe, Japan, Indonesia and South America;
education fairs and exhibitions – important to HE respondents from Malaysia/Singapore, India, Thailand and North Asia;
education/study agents – important to HE respondents from South America and VET respondents from Korea; and
promotion and advertising of Australian education at home – important to HE respondents from South America.
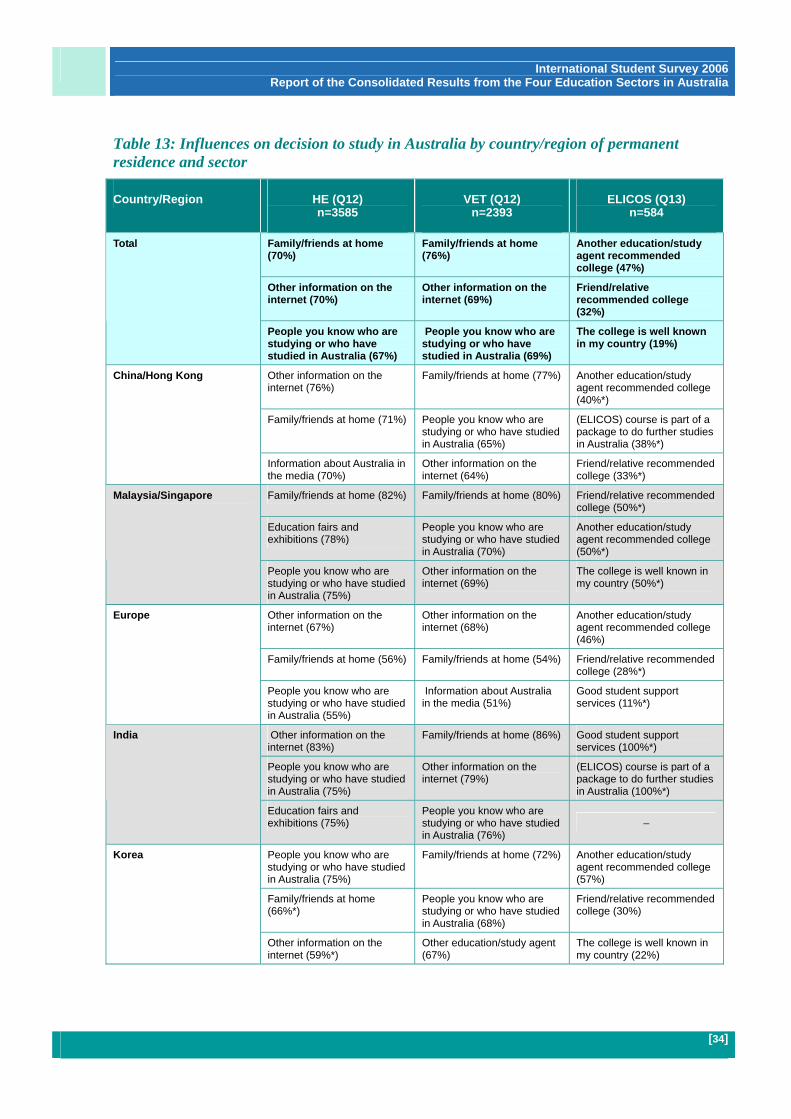
International Student Survey 2006 Report of the Consolidated Results from the Four Education Sectors in Australia
[34]
Table 13: Influences on decision to study in Australia by country/region of permanent residence and sector
Country/Region HE (Q12) n=3585
VET (Q12) n=2393
ELICOS (Q13) n=584
Family/friends at home (70%)
Family/friends at home (76%)
Another education/study agent recommended college (47%)
Other information on the internet (70%)
Other information on the internet (69%)
Friend/relative recommended college (32%)
Total
People you know who are studying or who have studied in Australia (67%)
People you know who are studying or who have studied in Australia (69%)
The college is well known in my country (19%)
Other information on the internet (76%)
Family/friends at home (77%) Another education/study agent recommended college (40%*)
Family/friends at home (71%) People you know who are studying or who have studied in Australia (65%)
(ELICOS) course is part of a package to do further studies in Australia (38%*)
China/Hong Kong
Information about Australia in the media (70%)
Other information on the internet (64%)
Friend/relative recommended college (33%*)
Family/friends at home (82%) Family/friends at home (80%) Friend/relative recommended college (50%*)
Education fairs and exhibitions (78%)
People you know who are studying or who have studied in Australia (70%)
Another education/study agent recommended college (50%*)
Malaysia/Singapore
People you know who are studying or who have studied in Australia (75%)
Other information on the internet (69%)
The college is well known in my country (50%*)
Other information on the internet (67%)
Other information on the internet (68%)
Another education/study agent recommended college (46%)
Family/friends at home (56%) Family/friends at home (54%) Friend/relative recommended college (28%*)
Europe
People you know who are studying or who have studied in Australia (55%)
Information about Australia in the media (51%)
Good student support services (11%*)
Other information on the internet (83%)
Family/friends at home (86%) Good student support services (100%*)
People you know who are studying or who have studied in Australia (75%)
Other information on the internet (79%)
(ELICOS) course is part of a package to do further studies in Australia (100%*)
India
Education fairs and exhibitions (75%)
People you know who are studying or who have studied in Australia (76%)
–
People you know who are studying or who have studied in Australia (75%)
Family/friends at home (72%) Another education/study agent recommended college (57%)
Family/friends at home (66%*)
People you know who are studying or who have studied in Australia (68%)
Friend/relative recommended college (30%)
Korea
Other information on the internet (59%*)
Other education/study agent (67%)
The college is well known in my country (22%)
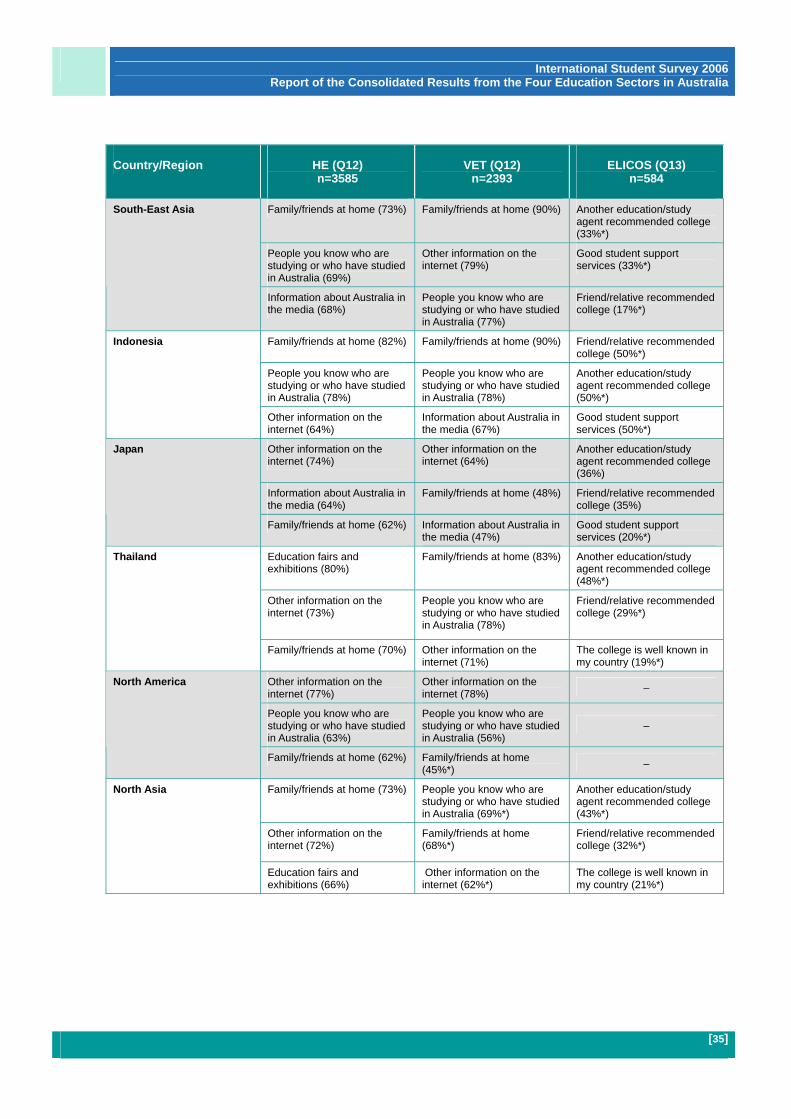
International Student Survey 2006 Report of the Consolidated Results from the Four Education Sectors in Australia
[35]
Country/Region HE (Q12) n=3585
VET (Q12) n=2393
ELICOS (Q13) n=584
Family/friends at home (73%) Family/friends at home (90%) Another education/study agent recommended college (33%*)
People you know who are studying or who have studied in Australia (69%)
Other information on the internet (79%)
Good student support services (33%*)
South-East Asia
Information about Australia in the media (68%)
People you know who are studying or who have studied in Australia (77%)
Friend/relative recommended college (17%*)
Family/friends at home (82%) Family/friends at home (90%) Friend/relative recommended college (50%*)
People you know who are studying or who have studied in Australia (78%)
People you know who are studying or who have studied in Australia (78%)
Another education/study agent recommended college (50%*)
Indonesia
Other information on the internet (64%)
Information about Australia in the media (67%)
Good student support services (50%*)
Other information on the internet (74%)
Other information on the internet (64%)
Another education/study agent recommended college (36%)
Information about Australia in the media (64%)
Family/friends at home (48%) Friend/relative recommended college (35%)
Japan
Family/friends at home (62%) Information about Australia in the media (47%)
Good student support services (20%*)
Education fairs and exhibitions (80%)
Family/friends at home (83%) Another education/study agent recommended college (48%*)
Other information on the internet (73%)
People you know who are studying or who have studied in Australia (78%)
Friend/relative recommended college (29%*)
Thailand
Family/friends at home (70%) Other information on the internet (71%)
The college is well known in my country (19%*)
Other information on the internet (77%)
Other information on the internet (78%) –
People you know who are studying or who have studied in Australia (63%)
People you know who are studying or who have studied in Australia (56%)
–
North America
Family/friends at home (62%) Family/friends at home (45%*) –
Family/friends at home (73%) People you know who are studying or who have studied in Australia (69%*)
Another education/study agent recommended college (43%*)
Other information on the internet (72%)
Family/friends at home (68%*)
Friend/relative recommended college (32%*)
North Asia
Education fairs and exhibitions (66%)
Other information on the internet (62%*)
The college is well known in my country (21%*)

International Student Survey 2006 Report of the Consolidated Results from the Four Education Sectors in Australia
[36]
Country/Region HE (Q12) n=3585
VET (Q12) n=2393
ELICOS (Q13) n=584
Other information on the internet (72%)
Other information on the internet (68%)
Another education/study agent recommended college (65%)
Promotion and advertising of Australian education in your home country (e.g., brochures) (49%)
Family/friends at home (66%) Friend/relative recommended college (36%*)
South America
Other education/study agent (46%)
Information about Australia in the media (61%)
The college is well known in my country (17%*)
People you know who are studying or who have studied in Australia (59%)
Family/friends at home (79%*)
Friend/relative recommended college (100%*)
Family/friends at home (55%) People you know who are studying or who have studied in Australia (74%*)
Another education/study agent recommended college (100%*)
Pacific
Other information on the internet (48%*)
Other information on the internet (67%*)
(ELICOS) course is part of a package to do further studies in Australia (100%*)
Note: Schools data could not be analysed by market. *Cell size is less than 30 respondents – treat with caution and as indicative only. – indicates that no data has been collected for this particular cell. Q14. (HET and VET) How much influence did each of the following have on your decision to study in Australia? (Tick only one box per row) Q16. (ELICOS) Why did you choose the college you are in now? (Tick as many as apply)

International Student Survey 2006 Report of the Consolidated Results from the Four Education Sectors in Australia
[37]
4.4 English language skills on course commencement
HE and VET sectors International students in the HE and VET sectors were asked to recall the level of their English language skills when they started their course. Their responses are presented below in Table 14.
Table 14: English language skills
Yes English language skills
HE VET TOTAL Up to level required for studies 75% 70% 73%
In need of formal training, which was received when required 19% 23% 21%
In need of formal training, which was received later than required 4% 5% 5%
In need of formal training, which was not received at all 2% 2% 1%
Total 100% 100% 100%
The majority of students (73%) felt that their English language skills were up to the level required for their studies. The proportion was slightly higher in the HE (75%) sector compared with VET sector (70%). Twenty one per cent of respondents across both sectors felt that they were in need of formal training or coursework, which they received when they required it (19% HE, 23% VET), while 5% felt that they were in need of formal training or coursework, which they received later than required (4% HE, 5% VET). One per cent said they were in need of formal training or coursework to improve their English language skills, which they did not receive at all.
Schools Schools respondents were asked whether they felt they needed extra help with their spoken and/or written English when they started studying at school in Australia. As Figure 7 shows 52% felt they needed extra help with both spoken and written English; a further 16% reported needing extra help with their written English only; and another 7% needed help with their spoken English only. Almost 76% of Schools respondents required extra help with their English language skills at the beginning of their schooling in Australia.
Schools respondents were then asked whether they received the extra help they needed with their spoken and/or written English. Just over half (55%) of those who felt that they needed help with their spoken or written English actually received assistance when they needed it; 26% received help but later than they needed it; and 10% of this group (8% of all students) reported never receiving the help they needed. A small group did not know or did not answer this question.

International Student Survey 2006 Report of the Consolidated Results from the Four Education Sectors in Australia
[38]
Figure 7: Need for training in spoken and written English (Schools)
7.1%
52.3%
5.7%
18.5%16.3%
0%
20%
40%
60%
Spoken Written Spoken and Written Neither Don't know
Percent
School students
International Student Survey 2006 Report of the Consolidated Results from the Four Education Sectors in Australia
[39]
4.5 Summary of key points Across all students and education sectors, the most important factors in the decision to study in Australia were:
1. Australia is an English-speaking country; 2. Australia is safe and secure, or a safe place to live; 3. coming to Australia offered the opportunity to experience a new culture and lifestyle
(HE and VET sectors); 4. coming to Australia also offered the opportunity to live close to a beautiful, natural
environment (ELICOS and Schools sector); and 5. Australian institutions offered a high quality of education.
For HE and VET respondents from many Asian countries (Malaysia/Singapore, Korea, Japan, North Asia, Indonesia and Thailand) the perceived cost of living was one of the three most important factors in the decision to study in Australia.
For HE and VET respondents from China/Hong Kong, India, South-East Asia, Europe, North America and South America, the opportunity to experience a new culture or lifestyle was one of the three most important factors in the decision to study here.
For Korean ELICOS respondents, the low cost of education compared to other countries was a key factor in deciding to study in Australia. It was also a key reason for Schools respondents from Korea, North Asia, South-East Asia and Thailand.
Across all four education sectors, the perceived quality of education was almost universally the most important factor in the decision to apply for the course in Australia.
Generally, the second and third most important factors in course selection were the perception that the course would increase the chances of employment and the reputation of the university or institution particularly for the HE and VET sectors. The third most important factor in the ELICOS sector was the protection provided by the ESOS Act.
The reputation of the university or VET course was a key factor for some groups of respondents, as was the cost of the course for Japan and Korean students.
As well as being English-speaking and offering high quality education, personal recommendations were reported as a key factor in the selection process by Schools respondents with an education/study agent’s recommendation or a recommendation from friend or relative one of the three key factors in school selection.
The personal recommendations of education/study agents and friends or relatives were also key factors in the selection of an ELICOS college.
In both the HE and VET sectors, personal recommendations were important influences on the decision to study in Australia (from both family and friends, and people who were studying or had studied in Australia).
International Student Survey 2006 Report of the Consolidated Results from the Four Education Sectors in Australia
[40]
Information about Australia in the media was important to HE respondents from China/Hong Kong, South-East Asia and Japan, and to VET respondents from Europe, Japan, Indonesia and South America. Education fairs and exhibitions were important sources of information for HE respondents from Malaysia/Singapore, India, Thailand and North Asia.
A relatively small group (around 6%) of both international HE and VET students required formal training for their English language skills at the start of their course, which they received later than required, or not at all. In addition, almost 76% of international Schools respondents needed extra help with their English language skills at the beginning of their schooling, and 8% of all school students surveyed said they never received it.

International Student Survey 2006 Report of the Consolidated Results from the Four Education Sectors in Australia
[41]
5. Studying in Australia
While the vast majority of international respondents were reported to be strong advocates for studying in Australia as well as for Australia in general, there were three key issues that generated significant levels of dissatisfaction. These issues related to cost, gaining employment and relevant work experience, and visas.
For costs, visas and employment in Australia, there was a higher proportion of satisfied respondents than dissatisfied students on all but one key indicator – satisfaction with the cost of the course, where satisfaction and dissatisfaction levels were identical (35% satisfied and dissatisfied, 27% neutral).
Table 15: Summary of key indicators of satisfaction related to cost, visas and employment by level
Very satisfied
Satisfied Neither/ nor
Dissatisfied Very dissatisfied
Don't know
TOTAL
Cost of course** (HE, VET + ELICOS) 6% 29% 27% 23% 12% 2% 100%
Cost of living (all sectors) 7% 39% 26% 20% 6% 2% 100%
Total cost of obtaining visa (HE, VET + ELICOS)
8% 33% 25% 22% 10% 2% 100%
Ease of obtaining visa (HE, VET + ELICOS)
19% 47% 16% 10% 6% 2% 100%
Time taken to get visa (HE, VET + ELICOS)
19% 42% 15% 14% 8% 2% 100%
Length of time before visa expires (HE, VET + ELICOS)
11% 42% 21% 17% 7% 2% 100%
Finding part-time or casual work (all sectors)
8% 34% 24% 13% 5% 15% 100%
Finding holiday work (HE + VET)
7% 30% 27% 14% 5% 18% 100%
Getting work experience in field of study (HE + VET)
9% 25% 21% 19% 14% 12% 100%
Base: All education sectors in which this question was asked
The other key indicators on which overall satisfaction and dissatisfaction levels were quite close were: satisfaction with gaining work experience in the student’s field of study
(34% satisfied, 33% dissatisfied, 21% neutral) satisfaction with the total cost of obtaining the visa
(41% satisfied, 32% dissatisfied, 25% neutral).

International Student Survey 2006 Report of the Consolidated Results from the Four Education Sectors in Australia
[42]
Table 16 presents the key indicators of dissatisfaction with the study experience in Australia by sector. The aim here is to identify the sectors in which reported dissatisfaction with each of the indicators was highest. It can be seen that dissatisfaction levels with cost factors were generally greater for international students in the HE sector, particularly dissatisfaction with the cost of course. Similarly dissatisfaction levels were higher for students in the HE sector concerning issues associated with visas, and obtaining work experience in the field of study.
Table 16: Key indicators of dissatisfaction with the study experience in Australia by sector
Key indicator HE VET ELICOS Schools TOTAL
Cost of the course 41% 27% 29% NA 35% Cost of living 28% 23% 26% 26% 26% Ease of obtaining a visa 21% 10% 10% NA 16% Time taken to obtain visa 27% 17% 16% NA 23% Total cost of obtaining visa 36% 23% 33% NA 31% Time visa expires after course 29% 18% 17% NA 24% Finding part-time or casual work 20% 18% 12% 8% 18%
Finding holiday work 19% 17% NA NA 18% Getting work experience in field of study 40% 22% NA NA 33%

International Student Survey 2006 Report of the Consolidated Results from the Four Education Sectors in Australia
[43]
5.1 Affordability of education in Australia A key determining factor in choosing Australia was the perceived lower cost compared to studying similar courses in other countries. The results suggested that cost was an issue for many international students in Australia as 35% were dissatisfied or very dissatisfied with the cost of the course; 26% with the cost of living; and 31% with the total cost of obtaining a visa. Whether the dissatisfaction levels were changing over time or in relation to Australia’s competitors is unknown at this stage. But this loss of cost-competitiveness could have a negative effect on the demand for education in Australia by international students.
5.1.1 Cost of course Across the HE, VET and ELICOS sectors, satisfaction levels with the cost of the course were the same as dissatisfaction levels (35%) (see Tables 17 and 18).
Table 17: Satisfaction with cost of course by country of permanent residence and sector
Very satisfied/satisfied with cost of course Country/Region HE
n=1027 VET
n=1131 ELICOS n=153
TOTAL n=2311
Total 28% 48% 27% 35% China/Hong Kong 25% 39% 23%* 29% Malaysia/Singapore 28% 43% 50%* 29% Europe 19% 42% 37%* 28% India 44% 72% 0%* 59% Korea 16%* 43% 23% 32% South-East Asia 33% 51% 67%* 44% Indonesia 32% 44% 100%* 37% Japan 15%* 19%* 19%* 18% Thailand 26%* 50% 29%* 40% North America 32% 76% 0%* 40% North Asia 17%* 40%* 11%* 21% South America 31%* 44% 42%* 39% Pacific 55% 55%* 100%* 56% Other 36% 50% 46%* 44% Q20a How satisfied are you with each of the following aspects of the university at which you are studying? *Cell size is less than 30 respondents – treat with caution and as indicative only.
Reported satisfaction with the cost of course was highest among students from India (59%), the Pacific countries (56%), South-East Asia (44%), Thailand and North America (each 40%) and South America (39%). It was lowest among students from Japan (18%), North Asia (21%), Europe (28%), China/Hong Kong and Malaysia/Singapore (each 29%) and Korea (32%).

International Student Survey 2006 Report of the Consolidated Results from the Four Education Sectors in Australia
[44]
Satisfaction with the cost of the course was significantly higher in the VET sector (48%) than in the HE (28%) or ELICOS (27%) sectors.
Sample sizes did not permit reliable analysis by market for the ELICOS sector.
In the HE sector, satisfaction was higher among students from Pacific countries (55%), India (44%), South-East Asia (33%) and North America (32%); and lower among those from Europe (19%) – though sample sizes prevent conclusions to be drawn for several markets.
In the VET sector, satisfaction with the cost of course was higher for North American (76%) and Indian (72%) students, and lower for those from China/Hong Kong (39%), Europe (42%), Malaysia/Singapore and Korea (each 43%) and Indonesia and South America (each 44%).
Table 18: Dissatisfaction with cost of course by country/region of permanent residence and sector
Dissatisfaction with cost of course Country/Region HE
n=1488 VET
n=636 ELICOS n=161
TOTAL n=2285
Total 41% 27% 29% 35% China/Hong Kong 43% 26% 33%* 37% Malaysia/Singapore 44% 30%* 0%* 43% Europe 48% 33% 19%* 40% India 34% 14% 0%* 23% Korea 57%* 24% 32% 31% South-East Asia 34% 25% 17%* 28% Indonesia 35% 26% 0%* 31% Japan 64% 45% 31% 44% Thailand 30% 24% 29%* 26% North America 37% 13%* 0%* 32% North Asia 58% 31%* 43%* 48% South America 38%* 33%* 20%* 30% Pacific 21%* 25%* 0%* 22% Other 36% 33% 12%* 33% Q20a How satisfied are you with each of the following aspects of the university at which you are studying? *Cell size is less than 30 respondents – treat with caution and as indicative only.
Across the four sectors, dissatisfaction with the cost of the course (35%) was highest among respondents from North Asia (48%), Japan (44%), Malaysia/Singapore (43%) and Europe (40%).
Dissatisfaction with the cost of the course was higher for students in the HE sector (41%) than those completing VET (27%) and ELICOS (29%) courses.

International Student Survey 2006 Report of the Consolidated Results from the Four Education Sectors in Australia
[45]
Figure 8: Comparison between students’ satisfaction and dissatisfaction with the cost of course by country/region of permanent residence
Totals do not add to 100% as ‘Neither satisfied nor dissatisfied’ responses have been excluded.
In the HE sector, 41% of respondents were dissatisfied or very dissatisfied with the cost of the course; dissatisfaction was highest among Japanese, North Asian and European students.
In the VET sector, Japanese and European respondents expressed the highest levels of dissatisfaction with the cost of the course. In the ELICOS sector, Japanese students were again the most dissatisfied along with Korean students.
35%
33%
44%
48%
40%
43%
37%
31%
31%
30%
26%
32%
28%
22%
23%
35%
44%
18%
21%
28%
29%
29%
32%
37%
39%
40%
40%
44%
56%
59%
0% 20% 40% 60%
Total
Other
Japan
North Asia
Europe
Malaysia/Singapore
China/Hong Kong
Korea
Indonesia
South America
Thailand
North America
South-East Asia
Pacif ic
India
% Very dissatisfied/dissatisf ied % Very satisfied/satisfied

International Student Survey 2006 Report of the Consolidated Results from the Four Education Sectors in Australia
[46]
5.1.2 Cost of living Almost half the international respondents surveyed were satisfied with the cost of living in Australia (46%). This was the case with more than half of the VET respondents (52%) compared to 44% in the HE sector, 42% for Schools and 40% for ELICOS.
Across all sectors, satisfaction with the cost of living in Australia was highest for respondents from India (71%), Europe (61%), the Pacific countries (58%) and South-East Asia (50%). It was lowest for students from North Asia (30%), Malaysia/Singapore (37%), Korea and Indonesia (each 38%) and China/Hong Kong and Japan (each 41%).
Table 19: Satisfaction with the cost of living by country of permanent residence and sector
Very satisfied/satisfied with cost of living Country/Region HE
n=1571 VET
n=1233 ELICOS n=219
Schools n=296
TOTAL n=3319
Total 44% 52% 40% 42% 46% China/Hong Kong 38% 45% 36%* 43% 41% Malaysia/Singapore 35% 54% 100%* 34%* 37% Europe 65% 57% 54% 50%* 61% India 60% 81% 100%* 0%* 71% Korea 34%* 38% 39% 40%* 38% South-East Asia 46% 54% 50%* 42%* 50% Indonesia 37% 41% 50%* 22%* 38% Japan 36%* 44% 36% 56%* 41% Thailand 39% 52% 37%* 40%* 46% North America 45% 53%* 0%* 0%* 47% North Asia 25%* 51%* 26%* 17%* 30% South America 49% 54% 42%* 0%* 48% Pacific 54% 65%* 100%* 67%* 58% Other 50% 50% 38%* 40%* 49% Not answered 0%* 0%* 29%* 0%* 2% Q32a How satisfied are you with each of the following aspects of living in Australia? (Tick only one box per row) *Cell size is less than 30 respondents – treat with caution and as indicative only.
As Table 20 shows, in the HE sector 28% of respondents were dissatisfied with the cost of living. Higher levels of dissatisfaction with this aspect were expressed by North Asian (49%), Malaysian/Singapore (37%) and North American (35%) students.
In the VET sector, dissatisfaction with the cost of living (23%) was highest among Japanese (33%), Korean (28%) and South-East Asian (27%) respondents.
In the ELICOS sector (26%), dissatisfaction was highest among respondents from North Asia (43%) and Japan (32%).

International Student Survey 2006 Report of the Consolidated Results from the Four Education Sectors in Australia
[47]
No statistical analysis by market was possible in the Schools sector due to the small sample sizes, although overall 26% of School respondents were dissatisfied with the cost of living.
Table 20: Dissatisfaction with the cost of living by country/region of permanent residence and sector
Very dissatisfied/dissatisfied with cost of living Country/Region HE
n=1018 VET
n=532 ELICOS n=144
Schools n=179
TOTAL n=1873
Total 28% 23% 26% 26% 26% China/Hong Kong 29% 23% 26%* 24% 27% Malaysia/Singapore 37% 23%* 0%* 45%* 36% Europe 12% 18% 17%* 13%* 14% India 20% 10%* 0%* 0%* 15% Korea 34%* 28% 23% 34%* 28% South-East Asia 23% 27% 17%* 16%* 24% Indonesia 30% 23%* 50%* 56%* 29% Japan 31%* 33% 32% 16%* 30% Thailand 23%* 18% 27%* 24%* 21% North America 35% 30%* 0%* 0%* 34% North Asia 49% 29%* 43% 25%* 42% South America 28%* 21%* 22%* 50%* 24% Pacific 14%* 10%* 0%* 33%* 14% Other 26% 27% 25%* 20%* 26% Not answered 0%* 0%* 29%* 0%* 2%* Q32a How satisfied are you with each of the following aspects of living in Australia? (Tick only one box per row) *Cell size is less than 30 respondents – treat with caution and as indicative only.

International Student Survey 2006 Report of the Consolidated Results from the Four Education Sectors in Australia
[48]
Figure 9: Comparison between students’ satisfaction and dissatisfaction with the cost of living in Australia by country/region of permanent residence
Totals do not add to 100% as ‘Neither satisfied nor dissatisfied’ responses have been excluded.
26%
26%
42%
36%
29%
28%
27%
30%
21%
34%
24%
24%
14%
14%
15%
46%
49%
30%
37%
38%
38%
41%
41%
46%
47%
48%
50%
58%
61%
71%
0% 20% 40% 60% 80%
Total
Other
North Asia
Malaysia/Singapore
Indonesia
Korea
China/Hong Kong
Japan
Thailand
North America
South America
South-East Asia
Pacif ic
Europe
India
% Very dissatisfied/dissatisfied % Very satisfied/satisf ied

International Student Survey 2006 Report of the Consolidated Results from the Four Education Sectors in Australia
[49]
5.1.3 Cost of obtaining a visa
Across the HE, VET and ELICOS sectors, 41% of respondents were satisfied with the total cost of obtaining a visa, while 31% were dissatisfied.
Satisfaction was higher among students in the VET sector (50%) compared with the HE (36%) or ELICOS (34%) sectors.
Overall, satisfaction was higher among students from India (74%), South-East Asia (53%) and Indonesia (48%). It was lower among students from Japan (20%), North Asia (25%), Korea (28%), Pacific countries (32%), Europe and China/Hong Kong (each 35%), North America (36%) and South America (37%).
Table 21: Satisfaction with cost of obtaining visa by country/region of permanent home residence and sector
Very satisfied/satisfied with total cost of obtaining visa Country/region HE
n=1296 VET
n=1204 ELICOS n=188
TOTAL n=2688
Total 36% 50% 34%* 41% China/Hong Kong 30% 45% 31%* 35% Malaysia/Singapore 40% 53% 100%* 41% Europe 30% 38% 53% 35% India 62% 83% 100%* 74% Korea 9%* 32% 29%* 28% South-East Asia 44% 59% 67%* 53% Indonesia 47% 49% 100%* 48% Japan 18%* 19%* 23%* 20% Thailand 34% 49% 23%* 41% North America 37% 33%* 0%* 36% North Asia 16%* 43%* 30%* 25% South America 31%* 43% 36%* 37% Pacific 29%* 44%* 0%* 32% Other 40% 59% 56%* 50% Not answered 0%* 0%* 43%* 3%* Q17a How satisfied were you with the following aspects relating to your student visa? (Tick only one box per row) *Cell size is less than 30 respondents – treat with caution and as indicative only.
In the HE sector, students from India (62%), Indonesia (47%) and South-East Asia (44%) were more likely to be satisfied with the total cost of obtaining their visa, while those from Europe and China/Hong Kong (each 30%) were less satisfied.

International Student Survey 2006 Report of the Consolidated Results from the Four Education Sectors in Australia
[50]
The pattern was similar among VET students, where satisfaction with the total cost of obtaining the visa was higher among Indian (83%) and South East Asian (59%) students and lower among those from Korea (32%), Europe (38%), South America (43%) and China/Hong Kong (45%).
While reliable statistical analysis was not possible for students in the ELICOS sector, there was an indication that European respondents (53%) were more likely to be satisfied with the cost of obtaining their visa.
Across the HE, VET and ELICOS sectors, 31% of respondents expressed dissatisfaction with the cost of obtaining their visa. This was slightly more often a concern for HE (36%) and ELICOS (33%) respondents than respondents enrolled in VET (23%).
Table 22: Dissatisfaction with total cost of obtaining visa by country/region of permanent residence and sector
Very dissatisfied/dissatisfied with total cost of obtaining visa
Country/region HE n=1300
VET n=562
ELICOS n=185
TOTAL n=2047
Total 36% 23% 33% 31% China/Hong Kong 35% 23% 36%* 31% Malaysia/Singapore 32% 24%* 0%* 31% Europe 50% 32% 21%* 41% India 18% 6%* 0%* 12% Korea 57%* 33% 34% 36% South-East Asia 28% 19% 0%* 22% Indonesia 20% 19%* 0%* 20% Japan 56% 47% 33% 44% Thailand 36% 18% 39%* 26% North America 44% 37%* 0%* 43% North Asia 59% 38%* 38%* 49% South America 46% 41%* 46% 45% Pacific 18%* 6%* 0%* 15% Other 43% 23% 20%* 32% Not answered 0%* 0%* 43%* 4%* Q17a How satisfied were you with the following aspects relating to your student visa? (Tick only one box per row) *Cell size is less than 30 respondents – treat with caution and as indicative only.
International Student Survey 2006 Report of the Consolidated Results from the Four Education Sectors in Australia
[51]
Overall, students from North Asia (49%), South America (45%), Japan (44%), North America (43%), Europe (41%) and Korea (36%) were more likely to be dissatisfied with the cost of the visa.
Thirty six per cent of HE respondents were dissatisfied or very dissatisfied with the total cost of obtaining a visa. Dissatisfaction was highest among students from North Asia (59%), Japan (56%), Europe (50%), South America (46%) and North America (44%).
In the VET sector, 23% reported dissatisfaction with the total cost of obtaining a visa; this was higher among Japanese (47%), Korean (33%) and European (32%) students.
A third of ELICOS respondents (33%) were dissatisfied with the total cost of obtaining a visa. South Americans (46%), Koreans (34%) and Japanese (33%) students had a higher than average level of dissatisfaction with this aspect.
In summary, cost issues were a concern for a significant minority of all respondents in Australia. Perceptions of costs need to be kept under control to maximise Australia’s reputation in the international education market as a provider of value-for-money education, particularly in the minds of potential students from countries in the North Asian region such as Japan and Korea.

International Student Survey 2006 Report of the Consolidated Results from the Four Education Sectors in Australia
[52]
5.2 Access to employment and relevant work experience
5.2.1 Part-time or casual work As Table 15 has shown, 42% of respondents across all four sectors were satisfied with finding part-time or casual work. However, only 8% were very satisfied and 24% expressed a neutral opinion.
Eighteen per cent were dissatisfied with the opportunity to find part-time or casual work in Australia. Dissatisfaction was slightly more common among HE (20%) and VET respondents (18%) and lower among respondents in ELICOS (12%) and Schools (8%).
Table 23: Dissatisfaction with looking for part-time or casual work by country/region of permanent residence and sector
Very dissatisfied/dissatisfied with finding part-time or casual work
Country/region HE n=726
VET n=416
ELICOS n=64
Schools n=59
TOTAL n=1265
Total 20% 18% 12% 8% 18% China/Hong Kong 20% 14% 13%* 7% 16% Malaysia/Singapore 19% 14%* 0%* 4%* 18% Europe 11% 11%* 4%* 4%* 10% India 34% 20% 0%* 0%* 27% Korea 27%* 18% 14%* 14%* 17% South-East Asia 18% 20% 17%* 16%* 19% Indonesia 17% 12%* 0%* 6%* 15% Japan 21%* 24% 8%* 7%* 16% Thailand 13%* 14%* 20%* 0%* 13% North America 17% 2%* 0%* 0%* 14% North Asia 23%* 24%* 2%* 17%* 18% South America 20%* 13%* 24%* 25%* 19% Pacific 13%* 10%* 0%* 0%* 11% Other 30% 30% 9%* 0%* 29% Q32a How satisfied are you with each of the following aspects of living in Australia? (Tick only one box per row) *Cell size is less than 30 respondents – treat with caution and as indicative only.
Across all sectors there was little difference between the markets with Indian respondents (27%) reporting the highest level of dissatisfaction with the opportunity to find part-time or casual work. Respondents from Europe (10%) and the Pacific countries (11%) had the lowest levels of dissatisfaction. The dissatisfaction level varied from 13% to 19% among respondents from all the other countries.

International Student Survey 2006 Report of the Consolidated Results from the Four Education Sectors in Australia
[53]
In the HE sector, respondents from India (34%) and China/Hong Kong (20%) were more often dissatisfied with the opportunity to find part-time or casual employment in Australia.
In the VET sector, it was more often a concern for respondents from Japan (24%), India (20%) and South-East Asia (18%).
Sample sizes in the ELICOS and Schools sectors prevented reliable analysis on this issue at the country level.
5.2.2 Vacation work Similar to satisfaction levels with part-time or casual work, 37% of students across the HE and VET sectors were satisfied with finding holiday work, although only 7% were very satisfied and 27% had a neutral opinion (see Table 15).
Dissatisfaction with the opportunity to find vacation work was only measured within the HE and VET sectors. For HE respondents, dissatisfaction was 19% and for VET, it was 17%. Again, students from India (28%), Japan (21%) and Korea (20%) had a higher level of dissatisfaction. Students from Europe (9%), Pacific countries (11%), North America (12%) and Thailand (12%) and Indonesia (14%) reported the lowest level of dissatisfaction in this area (see Table 24).
Table 24: Dissatisfaction with looking for holiday work by country/region of permanent residence and sector
Very dissatisfied/dissatisfied with finding holiday work
Country/region HE n=685
VET n=405
TOTAL n=1090
Total 19% 17% 18% China/Hong Kong 18% 13% 17% Malaysia/Singapore 19% 15%* 19% Europe 9% 11%* 9% India 35% 23% 28% Korea 27%* 18% 20% South-East Asia 18% 20% 19% Indonesia 16% 12%* 14% Japan 27%* 19%* 21% Thailand 11%* 14%* 12% North America 15% 0%* 12% North Asia 17%* 20%* 18% South America 22%* 15%* 18% Pacific 13%* 5%* 11% Other 29% 28% 28% Q32a How satisfied are you with each of the following aspects of living in Australia? (Tick only one box per row) *Cell size is less than 30 respondents – treat with caution and as indicative only.

International Student Survey 2006 Report of the Consolidated Results from the Four Education Sectors in Australia
[54]
In the HE sector, the dissatisfaction with the opportunity to find vacation work was highest among Indian respondents (35%) and lowest among Europeans (9%), North Americans (15%) and Indonesians (16%).
In the VET sector, dissatisfaction was highest among students from India (23%) and South-East Asia (20%). It was lowest among respondents from China/Hong Kong (13%).
5.2.3 Work experience
Obtaining Australian work experience in their field of study was a concern for international respondents in the HE and VET sectors.
As shown in Table 15 at the beginning of this section, satisfaction with the opportunity for HE and VET students to obtain work experience in their field of study was relatively low with 25% satisfied, 9% very satisfied and 21% neutral.
As Table 25 shows 33% of international respondents in these two sectors were dissatisfied with this aspect. The concern was far greater for HE students (40%) than VET (22%).
By country/region, students from India (46%), South America (44%) and China/Hong Kong (38%) were more likely to be dissatisfied with the opportunity to gain work experience in their field of study. This is an important finding as Indian and Chinese respondents were also the most likely to apply for permanent residency in Australia.
In the HE sector, dissatisfaction with this aspect was highest among respondents from India (67%), China/Hong Kong (49%), South America (48%) and Thailand (41%). It was lowest among respondents from North America (19%) and Europe (22%).
In the VET sector, where dissatisfaction in this area was lower overall than in the HE sector, more Indian (28%) and European (24%) students were dissatisfied. The dissatisfaction level was lower among respondents from China/Hong Kong (14%).

International Student Survey 2006 Report of the Consolidated Results from the Four Education Sectors in Australia
[55]
Table 25: Dissatisfaction with getting work experience in field of study by country/region of permanent residence and sector
Very dissatisfied/dissatisfied with getting work experience in your field of study
Country/region HE n=1443
VET n=519
TOTAL n=1962
Total 40% 22% 33% China/Hong Kong 49% 14% 38% Malaysia/Singapore 33% 16%* 32% Europe 22% 24% 23% India 67% 28% 46% Korea 34%* 18% 21% South-East Asia 39% 22% 29% Indonesia 36% 16%* 29% Japan 33%* 18%* 23% Thailand 41% 16%* 26% North America 19% 5%* 16% North Asia 29% 30%* 29% South America 48% 40%* 44% Pacific 21%* 20%* 21% Other 52% 38% 45% Q32a How satisfied are you with each of the following aspects of living in Australia? (Tick only one box per row) *Cell size is less than 30 respondents – treat with caution and as indicative only.
5.3 Visas The majority of international students in the HE, VET and ELICOS sectors were satisfied with the conditions of their visa (see Table 15):
66% were satisfied with the ease of obtaining their visa, with 19% very satisfied, 16% neutral; 61% were satisfied with the time taken to get their visa, with 19% very satisfied, 15% neutral;
and 53% were satisfied with the length of time before their visa expired after course completion,
with 11% very satisfied and 21% neutral.
Twenty four per cent of international respondents were dissatisfied with the length of time before their visa expired following the completion of their course; 23% with the time it took to get their visa; and 16% with the ease of obtaining a visa. Each of these issues was a significantly higher concern for HE respondents, than for respondents in the VET or ELICOS sectors (see Tables 26, 27 and 28).
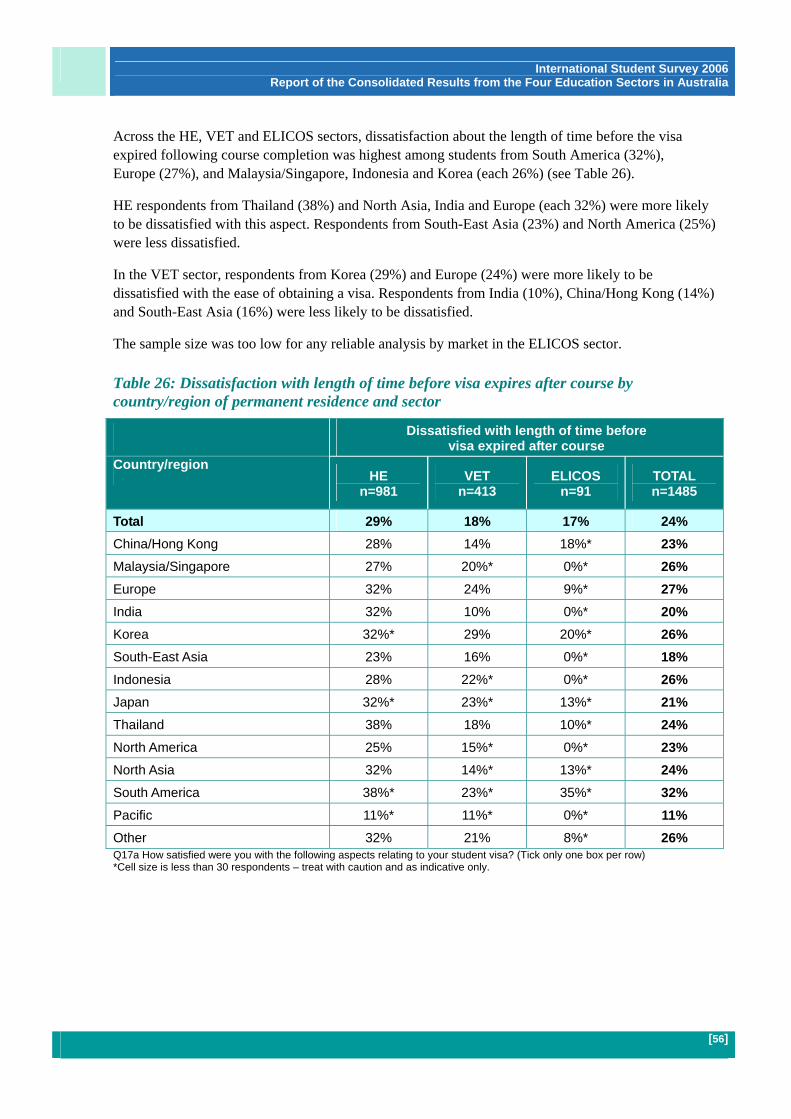
International Student Survey 2006 Report of the Consolidated Results from the Four Education Sectors in Australia
[56]
Across the HE, VET and ELICOS sectors, dissatisfaction about the length of time before the visa expired following course completion was highest among students from South America (32%), Europe (27%), and Malaysia/Singapore, Indonesia and Korea (each 26%) (see Table 26).
HE respondents from Thailand (38%) and North Asia, India and Europe (each 32%) were more likely to be dissatisfied with this aspect. Respondents from South-East Asia (23%) and North America (25%) were less dissatisfied.
In the VET sector, respondents from Korea (29%) and Europe (24%) were more likely to be dissatisfied with the ease of obtaining a visa. Respondents from India (10%), China/Hong Kong (14%) and South-East Asia (16%) were less likely to be dissatisfied.
The sample size was too low for any reliable analysis by market in the ELICOS sector.
Table 26: Dissatisfaction with length of time before visa expires after course by country/region of permanent residence and sector
Dissatisfied with length of time before visa expired after course
Country/region HE
n=981 VET
n=413 ELICOS
n=91 TOTAL n=1485
Total 29% 18% 17% 24% China/Hong Kong 28% 14% 18%* 23% Malaysia/Singapore 27% 20%* 0%* 26% Europe 32% 24% 9%* 27% India 32% 10% 0%* 20% Korea 32%* 29% 20%* 26% South-East Asia 23% 16% 0%* 18% Indonesia 28% 22%* 0%* 26% Japan 32%* 23%* 13%* 21% Thailand 38% 18% 10%* 24% North America 25% 15%* 0%* 23% North Asia 32% 14%* 13%* 24% South America 38%* 23%* 35%* 32% Pacific 11%* 11%* 0%* 11% Other 32% 21% 8%* 26% Q17a How satisfied were you with the following aspects relating to your student visa? (Tick only one box per row) *Cell size is less than 30 respondents – treat with caution and as indicative only.

International Student Survey 2006 Report of the Consolidated Results from the Four Education Sectors in Australia
[57]
In terms of the time taken to get an Australian visa, 23% of HE, VET and ELICOS respondents were dissatisfied. Overall, dissatisfaction was highest among respondents from China/Hong Kong (31%), Japan and South America (each 26%).
In the HE sector, where dissatisfaction was highest, respondents from China/Hong Kong (37%) and India (31%) were more concerned with the time taken to get their visa; while respondents from Malaysia/Singapore (15%), Indonesia (20%) and Europe (22%) expressed lower levels of concern.
In the VET sector, students from Japan (24%) and Korea (20%) were most dissatisfied with this aspect. Students from India (11%) and South-East Asia (14%) reported lower levels of dissatisfaction with the time taken to get the visa.
Sample sizes did not permit analysis by market for the ELICOS sector on this aspect.
Table 27: Dissatisfaction with time it took to obtain visa by country/region of permanent residence and sector
Dissatisfied with time it took to obtain a visa Country/region HE
n=981 VET
n=413 ELICOS
n=91 TOTAL n=1485
Total 27% 17% 16% 23% China/Hong Kong 37% 18% 15%* 31% Malaysia/Singapore 15% 14%* 0%* 15% Europe 22% 19% 8%* 19% India 31% 11% 0%* 20% Korea 48%* 20% 13%* 21% South-East Asia 25% 14% 17%* 19% Indonesia 20% 18%* 0%* 19% Japan 39%* 24% 20%* 26% Thailand 16%* 12%* 23%* 15% North America 10%* 9%* 0%* 10% North Asia 24%* 17%* 9%* 19% South America 40%* 29%* 19%* 26% Pacific 16%* 22%* 0%* 17% Other 43% 22% 42%* 32% Q17a How satisfied were you with the following aspects relating to your student visa? (Tick only one box per row) *Cell size is less than 30 respondents – treat with caution and as indicative only.

International Student Survey 2006 Report of the Consolidated Results from the Four Education Sectors in Australia
[58]
Table 28: Dissatisfaction with ease of obtaining visa by country/region of permanent residence and sector
Dissatisfied with ease of obtaining a visa Country/region HE
n=751 VET
n=240 ELICOS
n=56 TOTAL n=1047
Total 21% 10% 10% 16% China/Hong Kong 24% 10% 10%* 19% Malaysia/Singapore 11% 11%* 0%* 11% Europe 24% 13%* 10%* 19% India 22% 4%* 0%* 12% Korea 41%* 13%* 7%* 14% South-East Asia 23% 9%* 0%* 15% Indonesia 20% 14%* 0%* 18% Japan 26%* 12%* 12%* 15% Thailand 12%* 5%* 10%* 8% North America 15% 11%* 0%* 14% North Asia 14%* 12%* 4%* 11% South America 22%* 18%* 13%* 18% Pacific 9%* 0%* 0%* 7%* Other 36% 10% 23%* 23% Q17a How satisfied were you with the following aspects relating to your student visa? (Tick only one box per row) *Cell size is less than 30 respondents – treat with caution and as indicative only.
As seen in Table 28, the proportion of respondents who were dissatisfied with the ease of obtaining a visa was slightly lower overall (16%) than dissatisfaction with the length of time before the visa expired (24%) or the length of time taken to get the visa in the first place (23%).
Across the HE, VET and ELICOS sectors, there was little variation by country on the ease of obtaining the visa. A slightly higher level of dissatisfaction was reported by respondents from China/Hong Kong and Europe (each 19%), and Indonesia and South America (each 18%). A slightly lower level of dissatisfaction was reported by respondents from Thailand (8%), Malaysia/Singapore and North Asia (each 11%) and India (12%).
Respondents in the HE sector were more likely to be dissatisfied with the ease of obtaining a visa (21%) compared with respondents studying in the VET or ELICOS sectors (each 10%). HE respondents from China/Hong Kong and Europe (each 24%) and South-East Asia (23%) were more likely to be dissatisfied with this aspect, with dissatisfaction lowest among respondents from Malaysia/Singapore (11%) and North America (15%).
Analysis at the market level on this aspect was not possible for the VET and ELICOS sectors due to the relatively low level of dissatisfaction in these sectors on the ease of obtaining the visa.
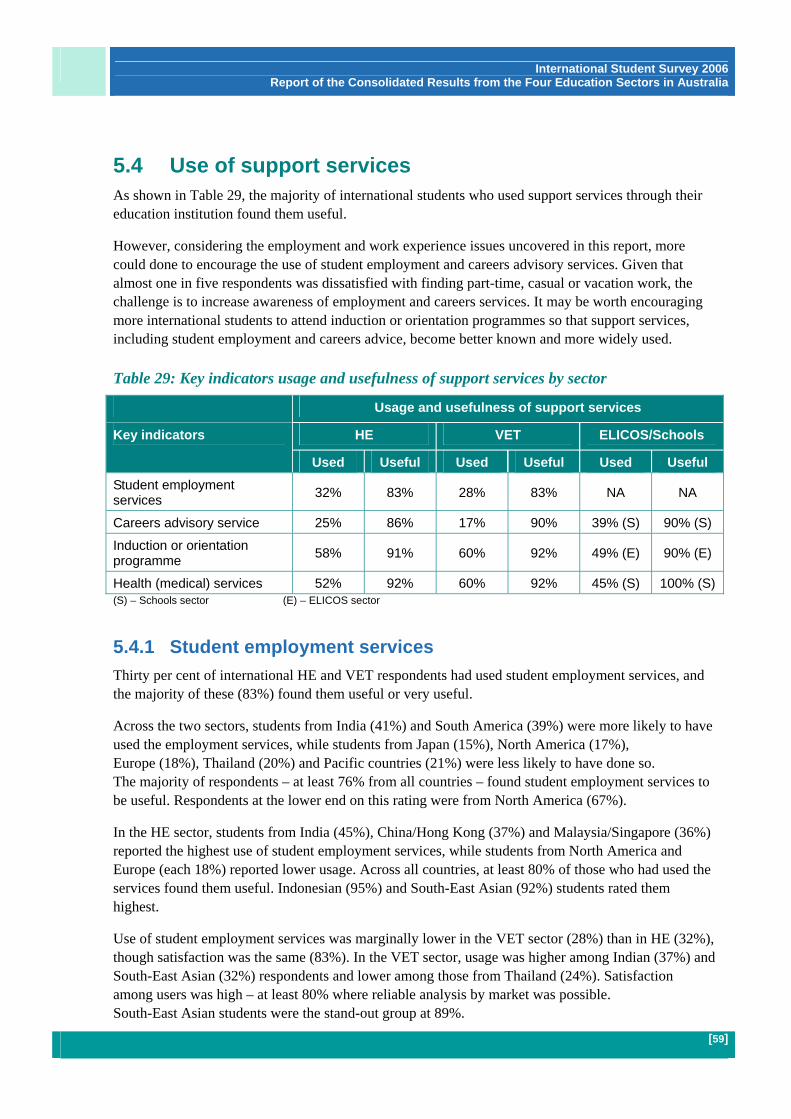
International Student Survey 2006 Report of the Consolidated Results from the Four Education Sectors in Australia
[59]
5.4 Use of support services As shown in Table 29, the majority of international students who used support services through their education institution found them useful.
However, considering the employment and work experience issues uncovered in this report, more could done to encourage the use of student employment and careers advisory services. Given that almost one in five respondents was dissatisfied with finding part-time, casual or vacation work, the challenge is to increase awareness of employment and careers services. It may be worth encouraging more international students to attend induction or orientation programmes so that support services, including student employment and careers advice, become better known and more widely used.
Table 29: Key indicators usage and usefulness of support services by sector
Usage and usefulness of support services
HE VET ELICOS/Schools Key indicators
Used Useful Used Useful Used Useful Student employment services 32% 83% 28% 83% NA NA
Careers advisory service 25% 86% 17% 90% 39% (S) 90% (S)
Induction or orientation programme 58% 91% 60% 92% 49% (E) 90% (E)
Health (medical) services 52% 92% 60% 92% 45% (S) 100% (S) (S) – Schools sector (E) – ELICOS sector
5.4.1 Student employment services Thirty per cent of international HE and VET respondents had used student employment services, and the majority of these (83%) found them useful or very useful.
Across the two sectors, students from India (41%) and South America (39%) were more likely to have used the employment services, while students from Japan (15%), North America (17%), Europe (18%), Thailand (20%) and Pacific countries (21%) were less likely to have done so. The majority of respondents – at least 76% from all countries – found student employment services to be useful. Respondents at the lower end on this rating were from North America (67%).
In the HE sector, students from India (45%), China/Hong Kong (37%) and Malaysia/Singapore (36%) reported the highest use of student employment services, while students from North America and Europe (each 18%) reported lower usage. Across all countries, at least 80% of those who had used the services found them useful. Indonesian (95%) and South-East Asian (92%) students rated them highest.
Use of student employment services was marginally lower in the VET sector (28%) than in HE (32%), though satisfaction was the same (83%). In the VET sector, usage was higher among Indian (37%) and South-East Asian (32%) respondents and lower among those from Thailand (24%). Satisfaction among users was high – at least 80% where reliable analysis by market was possible. South-East Asian students were the stand-out group at 89%.

International Student Survey 2006 Report of the Consolidated Results from the Four Education Sectors in Australia
[60]
Table 30: Use of student employment services and perceived usefulness by country/region of permanent residence and sector
Usage and usefulness of student employment services
HE VET TOTAL
n=1125 n=928 n=594 n=434 n=1719 n=1362
Country/region
Used Very useful/ useful
Used Very useful/ useful
Used Very useful/ useful
Total 32% 83% 28% 83% 30% 83% China/Hong Kong 37% 82% 29% 83% 34% 82% Malaysia/Singapore 36% 85% 21%* 90%* 34% 86% Europe 18% 84% 17%* 81%* 18% 83% India 45% 81% 37% 80% 41% 81% Korea 27%* 67%* 29% 83% 28% 79% South-East Asia 31% 92% 32% 89% 32% 91% Indonesia 30% 95% 29% 90%* 30% 94% Japan 9%* 83%* 19%* 83%* 15% 83% Thailand 15%* 81%* 24% 77%* 20% 79% North America 18% 67%* 8%* 75%* 17% 67% North Asia 23%* 96%* 25%* 88%* 24% 94% South America 42%* 81%* 36%* 68%* 39% 76% Pacific 22%* 92%* 19%* 100%* 21% 93% Other 38% 76% 29% 82% 34% 79% Q19a Please tick the support services you have used through your university in the first column below. Q19b How useful have you found each of the support services you have used? *Cell size is less than 30 respondents – treat with caution and as indicative only.
5.4.2 Careers advisory services
As Table 31 shows, careers advisory services were used by a quarter (25%) of all respondents surveyed. The service was used by 25% of HE respondents, 17% of VET respondents and 39% in Schools.
As discussed, the fact that 40% of HE respondents and 22% of VET respondents were dissatisfied with the opportunity to obtain work experience in their field of study suggests there could be opportunities for greater utilisation of these career advisory services.

International Student Survey 2006 Report of the Consolidated Results from the Four Education Sectors in Australia
[61]
Table 31: Use of careers advisory service and perceived usefulness by country/region of permanent residence and sector
Usage and usefulness of careers advisory services
HE VET Schools TOTAL
n=1853 n=1698 n=1287 n=1055 n=295 n=235 n=3435 n=2988
Country/region
Used Very useful/useful
Used Very useful/useful
Used Very useful/ useful
Used Very useful/useful
Total 25% 86% 17% 90% 39% 90% 25% 87%
China/Hong Kong 29% 83% 16% 89% 38% 90% 27% 86%
Malaysia/Singapore 25% 88% 11%* 83%* 62%* 83%* 28% 86%
Europe 17% 84% 6%* 100%* 23%* 60%* 15% 84%
India 39% 85% 24% 96% 0%* 0%* 29% 73%
Korea 27%* 83%* 18%* 82%* 43%* 88%* 28% 84%
South-East Asia 29% 91% 21% 87% 60%* 100%* 32% 92%
Indonesia 22% 98% 16%* 94%* 67%* 83%* 29% 94%
Japan 23%* 80%* 10%* 70%* 19%* 100%* 19% 81%*
Thailand 11%* 100%* 19%* 92%* 38%* 100%* 18% 98%
North America 12%* 71%* 14%* 100%* 0%* 0%* 10% 66%
North Asia 17%* 89%* 18%* 100%* 23%* 100%* 18%* 94%*
South America 34%* 95%* 13%* 86%* 25%* 100%* 27% 94%
Pacific 20%* 82%* 6%* 100%* 33%* 100%* 19%* 89%*
Other 26% 84% 21% 91% 60%* 100%* 30% 88% Q19a Please tick the support services you have used through your university in the first column below. Q19b How useful have you found each of the support services you have used? *Cell size is less than 30 respondents – treat with caution and as indicative only.
Across the HE, VET and Schools sectors, students from South-East Asia (32%), India and Indonesia (each 29%), Korea and Malaysia/Singapore (each 28%), and South America and China/Hong Kong (each 27%) were more likely to use careers advisory services. Respondents from North America (10%), Europe (15%), Thailand (18%) and Japan (19%) were least likely to do so.
Low sample sizes meant that not all markets could be analysed by sector. However, it was found that in the HE sector, Indian (39%), South-East Asian and Chinese/Hong Kong (each 29%) respondents were slightly more frequent users of careers advisory services, and that more than 80% of respondents who used the services found them useful. Students from Indonesia (98%) and South-East Asia (91%) were the groups that found them to be most useful.
In the VET sector, respondents from India (24%) and South-East Asia (21%) were also relatively frequent users of careers advisory services, with the vast majority (96% and 87% respectively) finding them useful.

International Student Survey 2006 Report of the Consolidated Results from the Four Education Sectors in Australia
[62]
5.4.3 On-campus health and medical services On-campus health and medical services were more widely used than the employment and careers advisory services. Across the three sectors in which this aspect was measured, HE (52%), VET (60%) and Schools (45%), usage of health and medical services was 55% overall. Almost all users (93%) found these health and medical services useful or very useful (see Table 32).
Little variation was reported across the three sectors at the country level. The most frequent users were respondents from Indonesia (60%) and South-East Asia (59%), with slightly lower levels reported by respondents from Japan (40%), North Asia, Europe and North America (each 46%), and South America (47%). At least 82% of users of health and medical services from all countries, except Japan (77%), found them to be useful or very useful.
Table 32: Use of health (medical) services and perceived usefulness by country/region of permanent residence and sector
Usage and usefulness of health services
HE VET Schools TOTAL
n=1853 n=1698 n=1287 n=1055 n=295 n=235 n=3435 n=2988
Country/region
Used Very useful/useful
Used Very useful/useful
Used Very useful/ useful
Used Very useful/useful
Total 52% 92% 60% 92% 45% 100% 55% 93%
China/Hong Kong 54% 92% 63% 90% 51% 100% 57% 92%
Malaysia/Singapore 51% 92% 56% 100%* 52%* 100%* 53% 96%
Europe 45% 95% 52% 94% 23%* 100%* 46% 95%
India 51% 93% 63% 96% 0%* 0%* 52% 86%
Korea 64%* 93%* 54% 87% 29%* 100%* 57% 91%
South-East Asia 59% 95% 63% 95% 40%* 100%* 59% 95%
Indonesia 57% 92% 67% 91% 44%* 100%* 60% 93%
Japan 42%* 71%* 42% 80%* 24%* 100%* 40% 77%
Thailand 45% 87% 66% 90% 38%* 100%* 52% 89%
North America 51% 93% 50%* 100%* 0%* 0%* 46% 88%
North Asia 42% 93% 58%* 89%* 15%* 100%* 46% 92%
South America 43%* 89%* 58% 91% 25%* 0%* 47% 82%
Pacific 54%* 93%* 56%* 100%* 33%* 100%* 53% 96%
Other 59% 95% 64% 95% 20%* 100%* 58% 95% Q19a Please tick the support services you have used through your university in the first column below. Q19b How useful have you found each of the support services you have used? *Cell size is less than 30 respondents – treat with caution and as indicative only.
All Schools respondents who used health and medical services found them to be useful, as did 92% of users in the HE and VET sectors. While limited statistical analysis was possible by market in the latter two sectors, it showed that in the HE sector usage of health and medical services was slightly higher among respondents from South-East Asia (59%), Indonesia (57%) and China/Hong Kong (54%), and slightly lower among respondents from North Asia (42%) and Europe and Thailand (each 45%).

International Student Survey 2006 Report of the Consolidated Results from the Four Education Sectors in Australia
[63]
At least 77% of all respondents from the countries who used these services rated them as useful. European and South-East Asian students gave the highest ratings at 95%.
In the VET sector, the more frequent users of health and medical services were respondents from Indonesia (67%), Thailand (66%) and India, China/Hong Kong and South-East Asia (each 63%). Lower use was reported by Japanese (42%), European (52%) and Korean (54%) respondents. At least 87% of all user groups again rated the health services as useful. Students from India (96%), South-East Asia (95%) and Europe (94%) gave the highest ratings.
5.4.4 Induction and orientation programmes A key to building greater awareness and usage of on-campus services, particularly student employment and careers advisory services, could be to encourage participation in induction and orientation programmes. As shown in Table 33, across the HE, VET and ELICOS sectors, 58% of respondents participated in an induction or orientation programme, and 91% found it useful or very useful.
Across the HE, VET and ELICOS sectors, participation in induction or orientation programmes was higher among respondents from South-East Asia (72%) and India (63%), with the majority of respondents from all countries participating, except Japan (49%). North Asian respondents (52%) were also slightly below average in participation.
Around 90% of all respondents who participated rated the programme as useful or very useful. Participation in induction or orientation programmes by sector was:
58% of HE respondents; 60% of VET respondents; and 49% of ELICOS respondents.
In the HE sector, participation programmes was quite even by market, with South-East Asia the highest at 67% followed by South America (65%). North American respondents (51%) were the lowest, followed by China/Hong Kong (55%) and India (56%). At least 82% of respondents from all the different countries found them useful or very useful. Respondents from Indonesia and the Pacific countries (each 97%), India (96%), South America (95%) and South-East Asia (94%) gave them the highest ratings.
Participation in these programmes was also relatively high in the VET sector (60%). The highest participation in induction and orientation programmes was by South-East Asian respondents (76%), followed by Indian (69%), North American (68%) and Indonesian respondents (64%). Again, at least 84% of all groups rated them as useful or very useful. Respondents from Malaysia/Singapore and North America (each 97%), South-East Asia (96%) and India and Thailand (each 95%) gave the highest ratings.

International Student Survey 2006 Report of the Consolidated Results from the Four Education Sectors in Australia
[64]
Table 33: Whether used induction or orientation programme by country/region of permanent residence and sector
Usage and usefulness of induction or orientation programme
HE VET Schools TOTAL
n=2072 n=1882 n=1280 n=1031 n=254 n=260 n=3606 n=3173 Country/region Used Very
useful/useful
Used Very useful/useful
Used Very useful/ useful
Used Very useful/useful
Total 58% 91% 60% 92% 49% 90% 58% 91%
China/Hong Kong 55% 92% 52% 88% 36%* 83%* 54% 90%
Malaysia/Singapore 61% 90% 57% 97% 100%* 100%* 61% 90%
Europe 60% 88% 50% 91% 32%* 87%* 54% 89%
India 56% 96% 69% 95% 100%* 0%* 63% 96%
Korea 48%* 86%* 58% 87% 68% 95% 61% 91%
South-East Asia 67% 94% 76% 96% 67%* 100%* 72% 95%
Indonesia 60% 97% 64% 89% 50%* 100%* 61% 94%
Japan 61% 88% 44% 84% 45% 88% 49% 87%
Thailand 58% 93% 49% 95% 63%* 88%* 54% 94%
North America 51% 82% 68% 97% 0%* 0%* 54% 85%
North Asia 62% 89% 48%* 88%* 34%* 85%* 52% 88%
South America 65% 95% 56% 85%* 45%* 94% 55% 92%
Pacific 57% 97% 75%* 100%* 0%* 0%* 61% 98%
Other 60% 95% 71% 95% 38%* 92%* 65% 95% Q19a Please tick the support services you have used through your university in the first column below. Q19b How useful have you found each of the support services you have used? *Cell size is less than 30 respondents – treat with caution and as indicative only.

International Student Survey 2006 Report of the Consolidated Results from the Four Education Sectors in Australia
[65]
5.5 Integration into Australian society
5.5.1 Treated with respect by Australian students Seventy per cent of HE, VET and Schools respondents felt they were treated with respect and courtesy by Australian students. The breakdown by sector was HE (76%), VET (65%) and Schools (61%).
Table 34: Key indicators of integration by sector
Had many/some friends; Yes, shown respect Key indicators HE VET ELICOS Schools TOTAL
Close friends with Australian students 68% 70% 57% 78% 69%
Respect by Australian students 76% 65% NA 61% 70%
As shown in Table 35, across the three sectors in which this aspect was measured, respondents from Europe and North America (each 90%), South America (86%) and the Pacific countries (80%) were more likely to feel they had been treated with respect by Australian students. Respondents from Korea (45%), Thailand (51%) and Japan (59%) were less likely to feel this followed by China/Hong Kong (65%) and North Asia (66%).
In the HE sector the pattern was similar, with respondents from Europe (95%), North America (90%) and South America (88%) feeling that they had been treated with respect. Respondents from Thailand (58%), Japan (61%), North Asia (69%), South-East Asia and China/Hong Kong (each 70%) were less likely to feel they were treated with respect by Australian students.
In the VET sector this pattern was again repeated, with respondents from North America (93%), South America (87%) and Europe (83%) feeling they were treated with respect, while fewer respondents from Korea (40%), Thailand (42%), Japan (57%), China/Hong Kong (61%) and Indonesia (62%) felt that way.
The sample size of Schools was too low for reliable analysis on respect shown by Australian students. A higher proportion of Schools respondents (78%) reported they had close friends among Australian students (including Koreans and Japanese) than respondents in the VET sector (70%), HE (68%) or ELICOS (57%).

International Student Survey 2006 Report of the Consolidated Results from the Four Education Sectors in Australia
[66]
Table 35: Treated with respect by Australian students by country/region of permanent residence and sector
Yes, treated with respect by Australian students Country/region HE
n=2726 VET
n=1519 Schools n=435
TOTAL n=4680
Total 76% 65% 61% 70% China/Hong Kong 70% 61% 59% 65%
Malaysia/Singapore 76% 63% 83%* 75%
Europe 95% 83% 74%* 90%
India 73% 70% 0%* 72%
Korea 57%* 40% 49%* 45%
South-East Asia 70% 67% 60%* 68%
Indonesia 73% 62% 78%* 70%
Japan 61% 57% 60%* 59%
Thailand 58% 42% 77%* 51%
North America 90% 93% 0%* 90%
North Asia 69% 61%* 64%* 66%
South America 88% 87% 25%* 86%
Pacific 77% 90%* 67%* 80%
Other 79% 74% 80%* 76%
Not answered 76% 65% 61% 70% Q30 Generally, have you been treated with respect and courtesy by each of the following groups of people during your stay in Australia? (Tick one box only for each group of people) *Cell size is less than 30 respondents – treat with caution and as indicative only.
5.5.2 Australian students as friends Across the four sectors, respondents from Pacific countries and North America (each 84%) and Europe (81%) were more likely to have close friends among Australian students. Respondents from Thailand (55%), North Asia (60%), China/Hong Kong (61%) and Korea (63%) were less likely to have such friendships.
This pattern was generally the same in the HE sector, with higher proportions of North American (84%), European (83%) and Pacific (80%) respondents, along with Koreans (80%), reporting that they had made close friends with Australian students. Lower proportions were found among respondents from Thailand (54%), China/Hong Kong (56%) and North Asia (61%).
The same conclusions could be drawn for the VET sector with more respondents from North America (85%) and Europe (80%) having made close friends with Australian students, but lower proportions from Thailand (54%), Korea (58%), and Japan and China/Hong Kong (each 63%).
Reliable analysis at the market level was not possible on this aspect in the ELICOS or Schools sector.

International Student Survey 2006 Report of the Consolidated Results from the Four Education Sectors in Australia
[67]
Table 36: Whether were close friends with Australian students by country/region of permanent residence and sector
Many or some close friendships with Australian students Country/region HE
n=2453 VET
n=1651 ELICOS n=308
Schools n=561
TOTAL n=4973
Total 68% 70% 57% 78% 69% China/Hong Kong 56% 63% 44%* 73% 61%
Malaysia/Singapore 72% 71% 50%* 90%* 73%
Europe 83% 80% 70% 83%* 81%
India 67% 76% 0%* 0%* 72%
Korea 80% 58% 51% 92% 63%
South-East Asia 69% 76% 60%* 80%* 73%
Indonesia 68% 75% 100%* 94%* 72%
Japan 71% 63% 64% 89% 68%
Thailand 54% 54% 33%* 96%* 55%
North America 84% 85% 0%* 0%* 84%
North Asia 61% 57%* 56%* 79%* 60%
South America 75% 74% 63% 50%* 71%
Pacific 80% 90%* 100%* 100%* 84%
Other 71% 75% 62%* 100%* 73%
Not answered 0%* 0%* 57%* 0%* 4%* Q27 How many close friends in Australia do you have from each of the following groups of people? *Cell size is less than 30 respondents – treat with caution and as indicative only.
International students were asked to give their level of agreement or disagreement with a series of statements about making friends with Australian students. Table 37 shows the proportion strongly agreeing or agreeing for each of the four education sectors surveyed. On the table, the percentages in brackets show the attitudes reported by Australian students in the HE and VET sectors as a comparison.

International Student Survey 2006 Report of the Consolidated Results from the Four Education Sectors in Australia
[68]
Table 37: Key indicators of integration by sector
Agree Key indicators of integration HE VET ELICOS Schools TOTAL I would like to have more Australian (students) as friends
81% (46%)
87% (53%)
91% (NA)
87% (NA)
84% (49%)
Australian (students) do not seem interested in having international students as friends
48% (22%)
44% (20%)
38% (NA)
45% (NA)
46% (21%)
Australian (students) are friendly towards international students
58% (60%)
58% (64%)
61% (NA)
54% (NA)
58% (62%)
My English ability stops me from making friends with Australian (students)
26% (NA)
31% (NA)
36% (NA)
46% (NA)
32% (NA)
I make an effort to have Australian (students) as friends
67% (37%)
65% (50%)
55% (NA)
62% (NA)
67% (38%)
Australian students should take the first steps to make friends with international students
44% (9%)
47% (12%)
NA (NA)
NA (NA)
45% (9%)
Australian students have shown an interest in my culture and country
NA (NA)
NA (NA)
NA (NA)
54% (NA)
54% (NA)
% in brackets is for Australian final year HE and VET students.
The following conclusions can be drawn from these results:
The vast majority of international respondents (84% in total) would like to have more Australian students as friends (or just Australians as friends for international ELICOS students). In comparison, only 49% of Australian students said they would have liked more international students as friends.
While 67% of international students felt they made an effort to have Australian students as friends (or just Australians as friends for international ELICOS students), only 38% of Australian students said they made an effort to have international students as friends.
Almost half of the international respondents in each sector felt that Australian students (or just Australians for ELICOS students) did not seem interested in having international students as friends. Conversely only 21% of Australian students reported that international students did not seem interested in having Australian students as friends.
Over half of the international respondents (58%) said that Australian students were friendly towards international students (or just Australians for international ELICOS students). A similar proportion of Australian students (62%) felt that international students were friendly towards Australian students.
International Student Survey 2006 Report of the Consolidated Results from the Four Education Sectors in Australia
[69]
Only a third of international students (32%) felt their English language ability stopped them from making friends with Australians. This was slightly higher for Schools (46%) and ELICOS (36%) respondents.
Forty five per cent of international students felt that Australian students (or just Australians for international ELICOS students) should take the first steps to make friends with international students. Only 9% of Australian students agreed that international students should take the first steps to friendship.
As discussed, there was a group of international students who reported having no close friends among Australian students. Many of these would have liked to have more Australian students as friends. The main barriers to achieving this appeared to be the perception that Australian students lacked interest in having international students as friends, compounded by the belief held by many of them that Australian students should take the first steps to make friends with international students. Their English language skills stopped some international students from making friends with Australians.

International Student Survey 2006 Report of the Consolidated Results from the Four Education Sectors in Australia
[70]
5.6 Summary of key points While the vast majority of international respondents would be advocates for Australian education, and for Australia in general, there were three key issues that generated significant levels of dissatisfaction:
1. cost; 2. gaining employment and relevant work experience; and 3. visas conditions.
Cost Cost was an issue for many international respondents in Australia – 35% were dissatisfied or
very dissatisfied with the cost of the course; 26% with the cost of living; and 31% with the total cost of obtaining a visa.
Across the four sectors, dissatisfaction with the cost of the course (35%) was highest among respondents from North Asia (48%), Japan (44%), Malaysia/Singapore (43%) and Europe (40%). The HE sector (41%) had the highest level of dissatisfaction with the cost of the course compared to VET (27%) and ELICOS (29%).
Across the HE, VET and Schools sectors, 31% of respondents expressed dissatisfaction with the cost of obtaining their visa. This was more of a concern for HE (36%) and ELICOS (33%) respondents than VET (23%). Overall, respondents from North Asia (49%), South America (45%), Japan (44%), North America (43%), Europe (41%) and Korea (36%) were more likely to be dissatisfied with the cost of the visa.
In summary, cost issues were a concern for a significant minority of all final year international respondents. These cost issues need to be kept under control to maximise Australia’s position in the international education market, particularly in the minds of potential students from countries such as Japan and Korea.
Gaining employment and relevant work experience While the majority of respondents in all sectors were satisfied with the opportunity to find
part-time or casual work in Australia, 18% were dissatisfied with this aspect. Dissatisfaction was more common among HE (20%) and VET respondents (18%), and lower among respondents in ELICOS (12%) and Schools (8%).
Dissatisfaction with the opportunity to find vacation work, only measured among respondents in the HE and VET sectors, was also 18%. Little difference was reported between HE (19%) and VET (17%) respondents on this aspect.
The greatest concern among HE and VET respondents in the employment area was the opportunity to gain Australian work experience in their field of study. A third of respondents in these two sectors (33%) were dissatisfied with this aspect, with HE students (40%) more concerned than VET (22%). Across the two sectors, students from India (46%), South America (44%) and China/Hong Kong (38%) were more likely to be dissatisfied. Of note is that respondents from India and China/Hong Kong were most likely to have applied, or were planning to apply, for permanent residency.

International Student Survey 2006 Report of the Consolidated Results from the Four Education Sectors in Australia
[71]
Visas A significant minority of respondents reported dissatisfaction with the length of time before
their visa expired following the completion of their course (24%); the time it took to get their visa (23%); and the ease of obtaining a visa (16%). Each of these issues was a significantly higher concern for HE respondents than those in the VET or ELICOS sectors.
Across the HE, VET and ELICOS sectors, dissatisfaction with the length of time before the visa expired following course completion was highest among students from South America (32%), Europe (27%), and Malaysia/Singapore, Indonesia and Korea (each 26%).
Across the HE, VET and ELICOS sectors, 23% of respondents were dissatisfied with the time it took to get the visa to Australia. Overall, dissatisfaction was highest among respondents from China/Hong Kong (31%), Japan and South America (each 26%).
Dissatisfaction with the ease of obtaining a visa was slightly lower overall (16%) than dissatisfaction with the length of time before the visa expired (24%) or the length of time taken to get the visa (23%). On ease of obtaining a visa, there was little variation by country across the HE, VET and ELICOS sectors but slightly higher dissatisfaction came from China/Hong Kong and Europe (each 19%), and Indonesia and South America (each 18%).
Support services The vast majority of respondents who used support services through their institution found
them useful, but given the employment and work experience issues discussed above, more could be done to encourage the use of student employment and careers advisory services.
Health and medical services were used by a relatively higher proportion of international respondents. It may be worth attracting more international students to induction or orientation programmes so that these support services become better known and used.
Integration into Australian society Seventy per cent of HE, VET and Schools respondents felt they were treated with respect
and courtesy by Australian students. This was more likely for HE respondents (76%) than VET (65%) or Schools (61%). Across the three sectors in which this was measured, students from Korea (45%), Thailand (51%) and Japan (59%) were less likely to feel they were treated with respect followed by China/Hong Kong (65%) and North Asia (66%).
Across the four sectors, respondents from Pacific countries and North America (each 84%) and Europe (81%) were more likely to report having close friends with Australian students. Respondents from Thailand (55%), North Asia (60%), China/Hong Kong (61%) and Korea (63%) were less likely to report such friendships.
A group of international respondents studying in Australia reported having no close friends among Australian students. Many of these respondents would like to have had more Australian students as friends. The main barriers to achieving this appeared to be the perceived lack of interest among Australian students in having international students as friends, compounded by the belief that Australian students should take the first steps to make friends with international students. Their English language skills stopped some international respondents from making friends with Australians.

International Student Survey 2006 Report of the Consolidated Results from the Four Education Sectors in Australia
[72]
6. Perceptions of the quality of education in Australia
International students were asked to rate a number of specific dimensions related to the delivery of the education that they received. Ten of these are presented in the Table 38 and Table 39.
Table 38: Summary key indicators of quality of education by level of satisfaction
Very satisfied
Satisfied Neither/ nor
Dissatisfied Very dissatisfied
Don't know
TOTAL
Satisfaction with quality of education (HE, VET + ELICOS)
20% 58% 13% 6% 2% 0% 100%
Satisfaction with course content (HE, VET + ELICOS)
15% 59% 18% 6% 1% 1% 100%
Satisfaction with commitment of staff (all sectors)
18% 52% 19% 7% 2% 2% 100%
Satisfaction with methods of teaching (HE, VET + Schools)
16% 55% 19% 7% 2% 1% 100%
Satisfaction with quality of lectures (HE + VET)
17% 54% 19% 8% 2% 0% 100%
Satisfaction with course assessment*
12% 57% 21% 7% 2% 1% 100%
Satisfaction with quality of small classes (HE, VET + Schools)
19% 50% 18% 7% 3% 4% 100%
Satisfaction with opportunities for one-on-one contact (all sectors)
21% 47% 20% 8% 3% 2% 100%
Satisfaction with range of subjects (HE, VET + Schools)
15% 51% 19% 10% 3% 2% 100%
Satisfaction with study workload (all sectors)
10% 55% 24% 8% 2% 2% 100%
Satisfaction with working on group projects (HE, VET + Schools)
14% 49% 23% 9% 3% 3% 100%
Base: All education sectors in which this question was asked.

International Student Survey 2006 Report of the Consolidated Results from the Four Education Sectors in Australia
[73]
It can be seen that satisfaction levels ranged between 63% and 74% on each of the specific quality indicators measured, though satisfaction with the overall quality of education was higher at 78%. Between 10% and 21% of international students were very satisfied with each indicator of quality. Between 7% and 13% of students were dissatisfied with each indicator of quality.
The most interesting conclusion from this analysis was that satisfaction with the quality of education overall was greater than the satisfaction level reported for all but one of the specific dimensions of delivery. The exception is that the same proportion of ELICOS respondents reported satisfaction with both the quality of lectures and the quality of education overall (83%).
These findings suggest that satisfaction with the quality of education was comprised by much more than what happened in the lecture theatre or classroom. Satisfaction with living in Australia (85%), the study experience (84%) and the course (82%) were all higher than satisfaction with the quality of education (78%).
With 87% saying they will recommend studying in Australia, respondents were clearly getting more out of their stay in Australia than what is delivered in the classroom.
Table 39: Key indicators of perceptions of the quality of education by sector
Very satisfied/satisfied Key indicators
HE VET ELICOS School Total
Quality of education 77% 80% 83% NA 78% Course content 73% 75% 69% NA 74%
Commitment of staff 71% 70% 75% NA 71%
Methods of teaching 69% 75% NA 68% 71%
Quality of lectures/lessons 66% 73% 83% 66% 71%
Course assessment 67% 71% 66% 66% 69%
Quality of small classes 72% 67% NA 66% 69%
Opportunities for one-on-one contact with academic staff
69% 67% 63% 64% 68%
Range of subjects to choose from
63% 70% NA 69% 67%
Study workload 64% 65% 62% 67% 65%
Working on group projects 58% 67% NA 67% 63%
Overall, satisfaction was higher with the course content, commitment of staff, methods of teaching and quality of lectures or lessons, and lower with the range of subjects to choose from, the study workload and working on group projects.

International Student Survey 2006 Report of the Consolidated Results from the Four Education Sectors in Australia
[74]
6.1 Satisfaction with course content Satisfaction with course content was rated higher in the VET (75%) and HE (73%) sectors than in ELICOS (69%).
In the HE sector, respondents from Thailand (80%), India, Indonesia and the Pacific countries (each 77%), Malaysia/Singapore (76%) and South-East Asia (75%) were slightly more satisfied with the course content. Respondents from China/Hong Kong, Japan and North America (each 70%) and North Asia (71%) were slightly less satisfied.
Table 40: Satisfaction with course content by country/region of permanent residence and sector
Very satisfied/satisfied with course content Country/region HE
n=2638 VET
n=1779 ELICOS n=388
TOTAL n=4805
Total 73% 75% 69% 74% China/Hong Kong 70% 67% 63%* 69% Malaysia/Singapore 76% 81% 50%* 76% Europe 72% 75% 78% 73% India 77% 87% 100%* 82% Korea 58%* 65% 66% 65% South-East Asia 75% 85% 100%* 81% Indonesia 77% 69% 100%* 74% Japan 70% 58% 65% 63% Thailand 80% 75% 55%* 75% North America 70% 96% 0%* 75% North Asia 71% 79% 77% 74% South America 74% 59% 75% 69% Pacific 77% 95%* 100%* 82% Other 77% 84% 74%* 80% Not answered 0%* 0%* 43%* 3%* Q20a (HE/VET) How satisfied are you with each of the following aspects of the university at which you are studying? Q27a (ELICOS) How satisfied are you with each of the following aspects of the college at which you are studying? *Cell size is less than 30 respondents – treat with caution and as indicative only.
In the VET sector, those most satisfied with the course content were from North America (96%), India (87%), South-East Asia (85%), Malaysia/Singapore (81%) and North Asia (79%). Respondents less satisfied were from Japan (58%), South America (59%), Korea (65%), China/Hong Kong (67%) and Indonesia (69%).
ELICOS sample sizes were low but indications were that students from Europe (78%), North Asia (77%) and South America (75%) were more satisfied than those from Japan (65%) and Korea (66%).

International Student Survey 2006 Report of the Consolidated Results from the Four Education Sectors in Australia
[75]
6.2 Satisfaction with the commitment of staff As shown in Table 41, the commitment of staff was rated higher in the ELICOS sector (75%) than in the HE (71%) and VET (70%) sectors.
Table 41: Satisfaction with commitment of staff by country/region of permanent residence and sector
Very satisfied/satisfied with commitment of staff Country/region HE
n=2554 VET
n=1656 ELICOS n=419
TOTAL n=4629
Total 71% 70% 75% 71% China/Hong Kong 64% 61% 76% 64% Malaysia/Singapore 71% 72% 100%* 71% Europe 80% 78% 93% 81% India 79% 82% 100%* 80% Korea 59%* 59% 68%* 63% South-East Asia 76% 81% 100%* 79% Indonesia 74% 60% 100%* 69% Japan 58% 50% 65% 57% Thailand 64% 55% 63%* 59% North America 74% 96% 0%* 78% North Asia 57% 71% 72%* 64% South America 71% 59% 88% 73% Pacific 82% 100%* 100%* 87% Other 76% 81% 79%* 79% Not answered 0%* 0%* 57%* 5%* Q20a (HE/VET) How satisfied are you with each of the following aspects of the university at which you are studying? Q27a (ELICOS) How satisfied are you with each of the following aspects of the college at which you are studying? *Cell size is less than 30 respondents – treat with caution and as indicative only.
In the HE sector, staff commitment was rated higher by respondents from Pacific countries (82%), Europe (80%), India (79%), South-East Asia (76%), Indonesia and North Asia (each 74%). It was rated lower by respondents from North Asia (57%), Japan (58%), Thailand and China/Hong Kong (each 64%).
In the VET sector, respondents from North America (96%), India (82%), South-East Asia (81%) and Europe (78%) were more satisfied with the commitment of staff, while respondents from Japan (50%), Thailand (55%), Korea and South America (each 59%), Indonesia (60%) and China/Hong Kong (61%) were less satisfied.
Indications from the ELICOS sector were that students from Europe (93%) and South America (88%) were more satisfied than those from Japan (65%), although as sample sizes were small, these conclusions should be treated with caution.
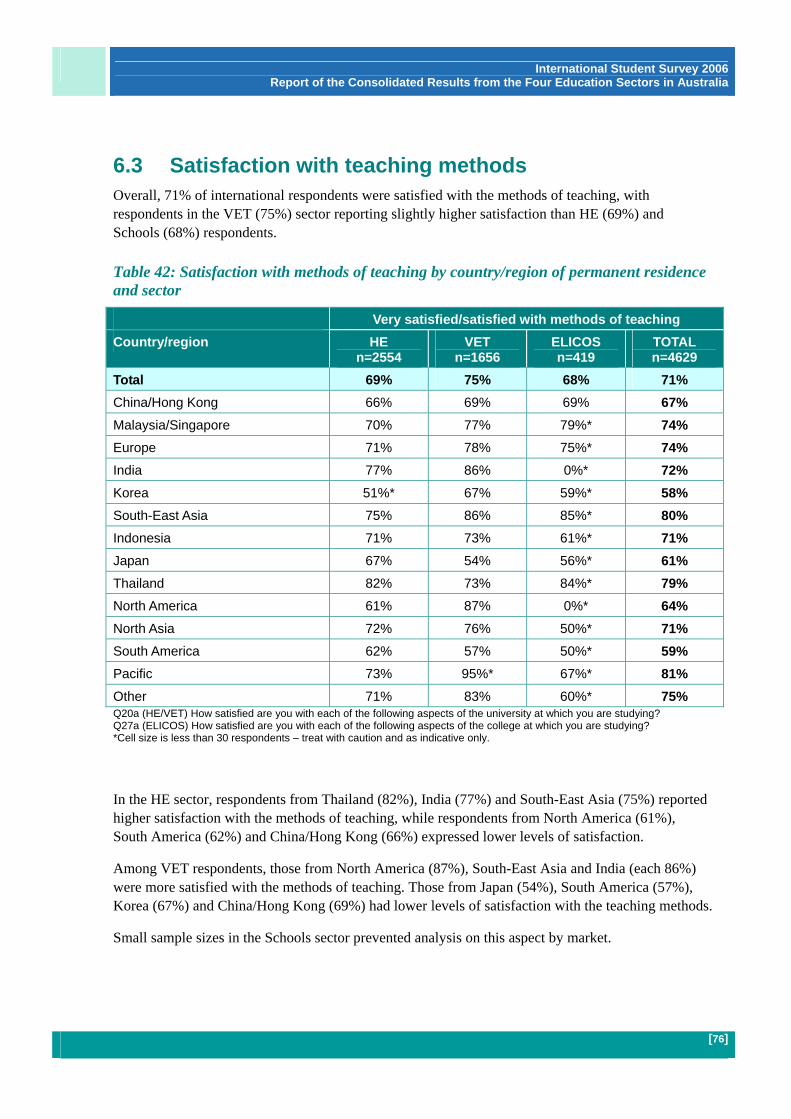
International Student Survey 2006 Report of the Consolidated Results from the Four Education Sectors in Australia
[76]
6.3 Satisfaction with teaching methods Overall, 71% of international respondents were satisfied with the methods of teaching, with respondents in the VET (75%) sector reporting slightly higher satisfaction than HE (69%) and Schools (68%) respondents.
Table 42: Satisfaction with methods of teaching by country/region of permanent residence and sector
Very satisfied/satisfied with methods of teaching Country/region HE
n=2554 VET
n=1656 ELICOS n=419
TOTAL n=4629
Total 69% 75% 68% 71% China/Hong Kong 66% 69% 69% 67% Malaysia/Singapore 70% 77% 79%* 74% Europe 71% 78% 75%* 74% India 77% 86% 0%* 72% Korea 51%* 67% 59%* 58% South-East Asia 75% 86% 85%* 80% Indonesia 71% 73% 61%* 71% Japan 67% 54% 56%* 61% Thailand 82% 73% 84%* 79% North America 61% 87% 0%* 64% North Asia 72% 76% 50%* 71% South America 62% 57% 50%* 59% Pacific 73% 95%* 67%* 81% Other 71% 83% 60%* 75% Q20a (HE/VET) How satisfied are you with each of the following aspects of the university at which you are studying? Q27a (ELICOS) How satisfied are you with each of the following aspects of the college at which you are studying? *Cell size is less than 30 respondents – treat with caution and as indicative only.
In the HE sector, respondents from Thailand (82%), India (77%) and South-East Asia (75%) reported higher satisfaction with the methods of teaching, while respondents from North America (61%), South America (62%) and China/Hong Kong (66%) expressed lower levels of satisfaction.
Among VET respondents, those from North America (87%), South-East Asia and India (each 86%) were more satisfied with the methods of teaching. Those from Japan (54%), South America (57%), Korea (67%) and China/Hong Kong (69%) had lower levels of satisfaction with the teaching methods.
Small sample sizes in the Schools sector prevented analysis on this aspect by market.

International Student Survey 2006 Report of the Consolidated Results from the Four Education Sectors in Australia
[77]
6.4 Satisfaction with the quality of lectures/teaching Overall, 71% of respondents were satisfied with the quality of the lectures or teaching they received. This was higher in the ELICOS sector (83%) than in VET (73%) and HE (66%).
In the HE sector, the quality of lectures was rated higher by respondents from Thailand (76%), and Malaysia/Singapore, South-East Asia and Indonesia (each 73%). It was rated lower by respondents from North America (52%), North Asia (60%), South America, Japan and Europe (each 62%), and China/Hong Kong and the Pacific countries (each 63%).
In the VET sector, satisfaction with the quality of lectures was rated higher by respondents from North America (94%), South-East Asia (86%), India (82%), Malaysia/Singapore and North Asia (each 80%). It was rated lower by respondents from South America (47%), Japan (53%), China/Hong Kong (63%) and Korea (65%).
While statistical analysis in the ELICOS sector was limited, indications were that satisfaction with the quality of lectures was higher for respondents from Europe (93%) and lower among respondents from China/Hong Kong (78%).
Table 43: Satisfaction with quality of lecture/teaching by country/region of permanent residence and sector
Very satisfied/satisfied with quality of lectures/teaching^ Country/region HE
n=2382 VET
n=1729 ELICOS^
n=467 TOTAL n=4578
Total 66% 73% 83% 71% China/Hong Kong 63% 63% 78% 66% Malaysia/Singapore 73% 80% 100%* 79% Europe 62% 75% 93% 71% India 70% 82% 100%* 79% Korea 51%* 65% 80% 60% South-East Asia 73% 86% 100%* 82% Indonesia 73% 71% 100%* 76% Japan 62% 53% 81% 61% Thailand 76% 72% 74%* 75% North America 52% 94% 0%* 64% North Asia 60% 80% 87% 72% South America 62% 47% 82% 59% Pacific 63% 90%* 100%* 78% Other 70% 81% 88%* 77% Not answered 0%* 0%* 57%* 6%* Q20a (HE/VET) How satisfied are you with each of the following aspects of the university at which you are studying? Q27a (ELICOS) How satisfied are you with each of the following aspects of the college at which you are studying? ^ Quality of teaching was measured in this sector. *Cell size is less than 30 respondents – treat with caution and as indicative only.

International Student Survey 2006 Report of the Consolidated Results from the Four Education Sectors in Australia
[78]
6.5 Satisfaction with the course assessment Across the four sectors, 69% of international respondents reported being satisfied with the course assessment. Satisfaction was slightly higher in the VET sector (71%) compared to HE (67%), and ELICOS and Schools (each 66%).
In the HE sector, satisfaction with course assessment was slightly higher among respondents from South America and Thailand (each 74%), India (72%), South-East Asia and the Pacific countries (each 71%). It was slightly lower among respondents from North America (61%) and China/Hong Kong (63%).
In the VET sector, satisfaction with the course assessment was slightly higher among respondents from North America (88%), South-East Asia (83%) and India (82%). It was lower among respondents from South America (56%), Japan (57%), China/Hong Kong (60%) and Korea (65%).
Small sample sizes permitted little reliable analysis for ELICOS and Schools but there were indications of slightly higher satisfaction among ELICOS respondents from China/Hong Kong (78%) and South America (76%) and lower satisfaction from Korean (56%) and Japanese (59%) respondents.
Table 44: Satisfaction with course assessment by country/region of permanent residence and sector
Very satisfied/satisfied with course assessment Country/region HE
n=2430 VET
n=1696 ELICOS n=368
Schools n=472
TOTAL n=4966
Total 67% 71% 66% 66% 69% China/Hong Kong 63% 60% 78% 68% 64%
Malaysia/Singapore 69% 72% 100%* 69%* 73%
Europe 66% 72% 71% 61%* 68%
India 72% 82% 100%* 0%* 71%
Korea 63%* 65% 56% 73% 64%
South-East Asia 71% 83% 100%* 70%* 77%
Indonesia 69% 70% 100%* 56%* 70%
Japan 68% 57% 59% 49%* 62%
Thailand 74% 70% 68%* 72%* 72%
North America 61% 88% 0%* 0%* 60%
North Asia 66% 74% 70% 50%* 67%
South America 74% 56% 76% 33%* 64%
Pacific 71% 85%* 100%* 33%* 75%
Other 73% 82% 75%* 60%* 75%
Not answered 0%* 0%* 43%* 0%* 3%* Q20a (HE/VET) How satisfied are you with each of the following aspects of the university at which you are studying? Q27a (ELICOS) How satisfied are you with each of the following aspects of the college at which you are studying? Q27 (SCHOOL) How satisfied are you with the following aspects of the School you are studying at? *Cell size is less than 30 respondents – treat with caution and as indicative only.
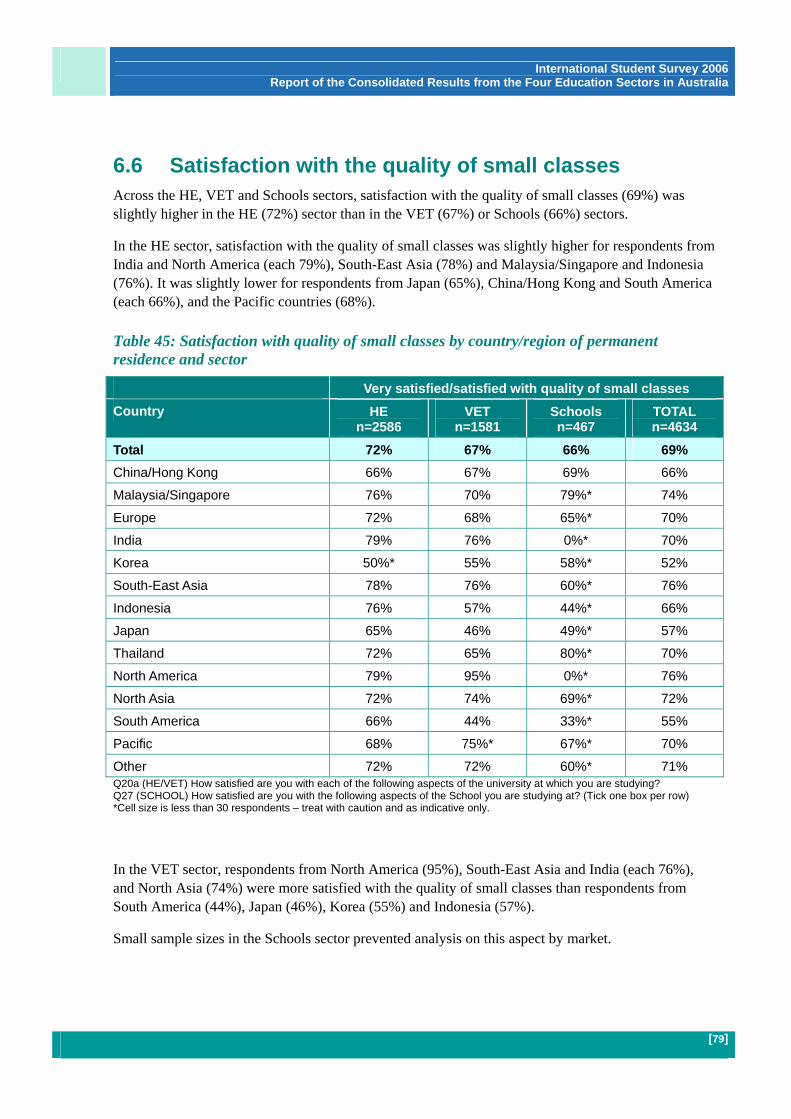
International Student Survey 2006 Report of the Consolidated Results from the Four Education Sectors in Australia
[79]
6.6 Satisfaction with the quality of small classes Across the HE, VET and Schools sectors, satisfaction with the quality of small classes (69%) was slightly higher in the HE (72%) sector than in the VET (67%) or Schools (66%) sectors.
In the HE sector, satisfaction with the quality of small classes was slightly higher for respondents from India and North America (each 79%), South-East Asia (78%) and Malaysia/Singapore and Indonesia (76%). It was slightly lower for respondents from Japan (65%), China/Hong Kong and South America (each 66%), and the Pacific countries (68%).
Table 45: Satisfaction with quality of small classes by country/region of permanent residence and sector
Very satisfied/satisfied with quality of small classes Country HE
n=2586 VET
n=1581 Schools n=467
TOTAL n=4634
Total 72% 67% 66% 69% China/Hong Kong 66% 67% 69% 66%
Malaysia/Singapore 76% 70% 79%* 74%
Europe 72% 68% 65%* 70%
India 79% 76% 0%* 70%
Korea 50%* 55% 58%* 52%
South-East Asia 78% 76% 60%* 76%
Indonesia 76% 57% 44%* 66%
Japan 65% 46% 49%* 57%
Thailand 72% 65% 80%* 70%
North America 79% 95% 0%* 76%
North Asia 72% 74% 69%* 72%
South America 66% 44% 33%* 55%
Pacific 68% 75%* 67%* 70%
Other 72% 72% 60%* 71% Q20a (HE/VET) How satisfied are you with each of the following aspects of the university at which you are studying? Q27 (SCHOOL) How satisfied are you with the following aspects of the School you are studying at? (Tick one box per row) *Cell size is less than 30 respondents – treat with caution and as indicative only.
In the VET sector, respondents from North America (95%), South-East Asia and India (each 76%), and North Asia (74%) were more satisfied with the quality of small classes than respondents from South America (44%), Japan (46%), Korea (55%) and Indonesia (57%).
Small sample sizes in the Schools sector prevented analysis on this aspect by market.

International Student Survey 2006 Report of the Consolidated Results from the Four Education Sectors in Australia
[80]
6.7 Satisfaction with opportunities for one-on-one contact with academic staff
Across the four sectors, 68% of international respondents reported being satisfied with the opportunities for one-on-one contact with academic staff. Satisfaction with this aspect was slightly higher in the HE (69%) and VET sectors (67%) than in Schools (64%) and ELICOS (63%).
Table 46: Satisfaction with opportunities for one-on-one contact by country/region of permanent home residence and sector
Very satisfied/satisfied with opportunities for one-on-one contact with academic staff
Country/region HE n=2506
VET n=1583
ELICOS n=354
Schools n=458
TOTAL n=4901
Total 69% 67% 63% 64% 68% China/Hong Kong 58% 57% 73% 64% 59% Malaysia/Singapore 72% 80% 100%* 76%* 74% Europe 81% 73% 82% 79%* 74% India 76% 77% 100%* 0%* 78% Korea 43%* 53% 50% 47%* 48% South-East Asia 75% 79% 100%* 80%* 79% Indonesia 79% 59% 100%* 56%* 73% Japan 56% 43% 49% 65%* 54% Thailand 78% 57% 71%* 88%* 71% North America 77% 95% 0%* 0%* 76% North Asia 64% 67%* 43%* 64%* 64% South America 68% 67% 88% 67%* 64% Pacific 70% 95%* 100%* 33%* 74% Other 74% 79% 83% 20%* 70% Not answered 0%* 0%* 43%* 0%* 3%* Q20a (HE/VET) How satisfied are you with each of the following aspects of the university at which you are studying? Q27a (ELICOS) How satisfied are you with each of the following aspects of the college at which you are studying? Q27 (SCHOOL) How satisfied are you with the following aspects of the School you are studying at? (Tick one box per row) *Cell size is less than 30 respondents – treat with caution and as indicative only.
In the HE sector, respondents from Europe (81%), Indonesia (79%), Thailand (78%), North America (77%), India (76%) and South-East Asia (75%) were more satisfied with the opportunities for one-on-one contact with academic staff. Respondents from Japan (56%), China/Hong Kong (58%) and North Asia (64%) were less satisfied.

International Student Survey 2006 Report of the Consolidated Results from the Four Education Sectors in Australia
[81]
The pattern was similar in the VET sector with higher satisfaction expressed by respondents from North America (95%), Malaysia/Singapore (80%), South-East Asia (79%), India (77%) and Europe (73%). Respondents from Japan (43%), Korea (53%), China/Kong and Thailand (each 57%), and Indonesia (59%) had lower levels of satisfaction with the opportunities for one-on-one contact with academic staff.
Reliable statistical analysis by market was mostly not possible for the ELICOS and Schools sectors. However, for ELICOS, indications were that satisfaction was higher among respondents from South America (88%), Europe (82%) and China/Hong Kong (73%), and lower for respondents from Japan (49%) and Korea (50%).
6.8 Satisfaction with the range of subjects on offer Sixty seven per cent of respondents across the HE, VET and Schools sectors were satisfied with the range of subjects to choose from. Satisfaction with this aspect of course delivery was slightly lower among HE respondents (63%) and slightly higher in the VET (70%) and Schools (69%) sectors.
In the HE sector, satisfaction with the range of subjects was very similar across all markets, although it was higher among respondents from Pacific countries (80%) and lower among North American (52%) respondents.
Table 47: Satisfaction with range of subjects to choose from by country of permanent residence and sector
Very satisfied/satisfied with range of subjects Country/region HE
n=2283 VET
n=1674 Schools n=487
TOTAL n=4444
Total 63% 70% 69% 67% China/Hong Kong 63% 66% 67% 64%
Malaysia/Singapore 65% 72% 76%* 69%
Europe 61% 65% 88%* 65%
India 66% 80% 0%* 64%
Korea 50%* 66% 68% 58%
South-East Asia 65% 84% 85%* 74%
Indonesia 67% 63% 56%* 64%
Japan 67% 52% 63%* 61%
Thailand 64% 67% 84%* 68%
North America 52% 91% 0%* 61%
North Asia 60% 55%* 71%* 59%
South America 63% 57% 50%* 59%
Pacific 80% 80%* 50%* 77%
Other 65% 80% 40%* 68% Q20a (HE/VET) How satisfied are you with each of the following aspects of the university at which you are studying? Q27 (SCHOOL) How satisfied are you with the following aspects of the School you are studying at? (Tick one box per row) *Cell size is less than 30 respondents – treat with caution and as indicative only.

International Student Survey 2006 Report of the Consolidated Results from the Four Education Sectors in Australia
[82]
In the VET sector, where satisfaction was a little higher overall, the reverse was found – respondents from North America (91%), along with those from South-East Asia (84%) and India (80%) were most satisfied with the range of subjects available. Respondents from Japan (52%), South America (57%), Indonesia (63%), Europe (65%), Korea and China/Hong Kong (66%), and Thailand (67%) had slightly lower satisfaction levels for this aspect.
Sample sizes were too low to permit reliable analysis of this aspect in the Schools sector by market.
6.9 Satisfaction with the study workload Across all education sectors, respondents reported the second lowest level of satisfaction on study workload (65%) of all the education quality indicators measured. Similar levels of satisfaction were reported for respondents from Schools, 67%, VET, 65%, HE, 64% and ELICOS, 62%.
Table 48: Satisfaction with study workload by country/region of permanent residence and sector
Country/region HE
n=2312 VET
n=1537 ELICOS n=342
Schools n=476
TOTAL n=4667
Total 64% 65% 62% 67% 65% China/Hong Kong 62% 58% 63%* 69% 62%
Malaysia/Singapore 62% 74% 50%* 79%* 67%
Europe 61% 68% 74% 71%* 65%
India 75% 76% 100%* 0%* 70%
Korea 58%* 58% 58% 69% 59%
South-East Asia 67% 80% 83%* 65%* 72%
Indonesia 64% 55% 50%* 56%* 59%
Japan 53% 40% 57% 44%* 48%
Thailand 58% 57% 61%* 68%* 59%
North America 71% 89% 0%* 0%* 64%
North Asia 57% 68%* 64% 64%* 62%
South America 72% 48% 64% 50%* 61%
Pacific 79% 90%* 100%* 67%* 83%
Other 66% 73% 58%* 60%* 67%
Not answered 0%* 0%* 43%* 0%* 3%* Q20a (HE/VET) How satisfied are you with each of the following aspects of the university at which you are studying? Q27a (ELICOS) How satisfied are you with each of the following aspects of the college at which you are studying? Q27 (SCHOOL) How satisfied are you with the following aspects of the School you are studying at? (Tick one box per row) *Cell size is less than 30 respondents – treat with caution and as indicative only.
In the HE sector, the satisfaction rating for the study workload was highest for respondents from Pacific countries (79%), India (75%), South America (72%) and North America (71%). It was lower among respondents from Japan (53%), North Asia (57%) and Thailand (58%).

International Student Survey 2006 Report of the Consolidated Results from the Four Education Sectors in Australia
[83]
In the VET sector, satisfaction on this aspect was higher for respondents from North America (89%), South-East Asia (80%), India (76%) and Malaysia/Singapore (74%). It was lower for respondents from Japan (40%), South America (48%), Indonesia (55%), Thailand (57%), and China/Hong Kong and Korea (each 58%).
While sample sizes did not permit reliable analysis in the ELICOS or Schools sector, indications were that satisfaction with the study workload was slightly higher among European ELICOS respondents (74%), and slightly lower among ELICOS respondents from Japan (57%) and Korea (58%).
6.10 Satisfaction with the opportunity to work on group projects
At 63%, satisfaction with working on group projects was the lowest of all 10 of the quality of education indicators explored. It was the lowest rating recorded in the HE sector (58%), lower than both the VET sector and Secondary Schools (each 67%).
Table 49: Satisfaction with opportunity to work on group projects by country/region of permanent home residence and sector
Very satisfied/satisfied with working on group projects Country/region HE
n=2106 VET
n=1598 Schools n=476
TOTAL n=4180
Total 58% 67% 67% 63% China/Hong Kong 58% 65% 69% 62%
Malaysia/Singapore 62% 81% 79%* 68%
Europe 48% 60% 71%* 54%
India 73% 80% 0%* 75%
Korea 51%* 55% 69% 52%
South-East Asia 65% 81% 65%* 69%
Indonesia 63% 60% 56%* 63%
Japan 39%* 38% 44%* 42%
Thailand 56% 66% 68%* 61%
North America 51% 85% 0%* 66%
North Asia 62% 74% 64%* 67%
South America 51% 50% 50%* 45%
Pacific 63% 80%* 67%* 62%
Other 60% 77% 60%* 59% Q20a (HE/VET) How satisfied are you with each of the following aspects of the university at which you are studying? Q27 (SCHOOL) How satisfied are you with the following aspects of the School you are studying at? (Tick one box per row) *Cell size is less than 30 respondents – treat with caution and as indicative only.

International Student Survey 2006 Report of the Consolidated Results from the Four Education Sectors in Australia
[84]
In the HE sector, satisfaction with the opportunity to work on group projects was higher for respondents from India (73%), South-East Asia (65%), Indonesia and Pacific countries (each 63%), and Malaysia/Singapore and North Asia (each 62%). It was lower for respondents from Europe (48%), and North and South America (each 51%).
In the VET sector, satisfaction with the opportunity to work on group projects was higher for respondents from North America (85%), Malaysia/Singapore and South-East Asia (each 81%), India (80%) and North Asia (74%). It was lower for respondents from Japan (38%), South America (50%), Korea (55%), and Indonesia and Europe (each 60%).
Statistical analysis was not possible by market in the Schools sector due to small sample sizes.
6.11 Summary of key points Satisfaction with the quality of education overall was greater than the satisfaction level
reported for all but one of the 10 specific dimensions related to the delivery (the exception being the quality of lectures which was rated the same as the quality of education (83%) by ELICOS respondents).
Satisfaction with the student’s study experience was determined by much more than what happened in the lecture theatre or classroom. The analysis covered in Section 3 showed that satisfaction with living in Australia (85%), the study experience (84%) and the course (82%) were all higher than reported satisfaction with the quality of education (78%).
Across all sectors, satisfaction with the course content, commitment of staff, methods of teaching and quality of lectures or lessons was relatively high. It was lower in the range of subjects to choose from, the study workload and the opportunity to work on group projects.
Generally, satisfaction with the dimensions of education delivery was lower for respondents from countries with greater cultural incongruence with Australia, notably Japan, Korea, China, North Asia and, to a lesser extent, South America. Partially, this could be related to inexperience with spoken English, but also appears to be related to differences in the Australian education system compared to their home country.
On key indicators of education delivery, such as the range of subjects, the quality of lectures, the methods of teaching and course assessment, North American respondents in Australia rated their experience lower than average.

International Student Survey 2006 Report of the Consolidated Results from the Four Education Sectors in Australia
[85]
7. Future career plans and aspirations
Across all sectors, a third of all international respondents (34%) indicated they would enrol in further studies immediately after the completion of their current course. Over three-quarters of Schools respondents indicated they intended to enrol for further studies, with 80% of those students planning to enrol in a higher education course.
The majority of School respondents (78%) said they would enrol in further studies immediately after their course, as did 43% in the VET sector, 36% in ELICOS and 19% of HE respondents.
Table 50: Key indicators of future career plans and aspiration by sector
Key indicators HE VET ELICOS Schools TOTAL
Planning to enrol in further studies 19% 43% 36% 78% 34%
Planning to find a job 56% 36% 18% 11% 43%
Other 25% 21% 46% 11% 23%
Table 51: Enrolling in further studies immediately following the completion of course by country/region of permanent residence and sector
Intending to enrol in further studies Country/region HE
n=694 VET
n=967 ELICOS n=194
Schools n=548
TOTAL n=2403
Total 19% 43% 36% 78% 34% China/Hong Kong 24% 44% 70%* 75% 41% Malaysia/Singapore 16% 32%* 100%* 90%* 21% Europe 19% 33% 12%* 73%* 24% India 18% 38% 100%* 0%* 28% Korea 23%* 35% 23% 80% 36% South-East Asia 18% 63% 100%* 89%* 46% Indonesia 20% 48% 50%* 89%* 33% Japan 18%* 33% 26%* 86% 34% Thailand 12%* 40% 81%* 85%* 38% North America 19% 17%* 0%* 0%* 18% North Asia 14%* 36%* 49%* 86%* 31% South America 12%* 22%* 31%* 75%* 23% Pacific 13%* 47%* 100%* 100%* 25% Other 23% 61% 71%* 80%* 44% Not answered 0%* 0%* 43%* 0%* 3%* Q36a Immediately after you complete your current course, what is the next thing you are most likely to do? (Tick one box only) *Cell size is less than 30 respondents – treat with caution and as indicative only.

International Student Survey 2006 Report of the Consolidated Results from the Four Education Sectors in Australia
[86]
Twenty three per cent of respondents were neither planning to seek a job nor planning to enrol in further studies on completion of their current course. They either had no plans, indicated they would travel or have extended time off.
Across all sectors, 43% of international respondents aimed to find a job immediately after completing their course. This applied to 56% of HE respondents, 36% of VET respondents, 18% of ELICOS respondents, and 11% of Schools respondents.
Table 52: Finding a job immediately following the completion of course by country/region of permanent residence and sector
Intending to find a job Country/region HE
n=2016 VET
n=816 ELICOS n=100
Schools n=76
TOTAL n=3008
Total 56% 36% 18% 11% 43% China/Hong Kong 61% 41% 16%* 14% 45% Malaysia/Singapore 62% 47% 0%* 7%* 58% Europe 49% 32% 16%* 0%* 39% India 63% 39% 0%* 0%* 51% Korea 66%* 48% 23% 5%* 35% South-East Asia 48% 32% 0%* 11%* 37% Indonesia 58% 39% 50%* 0%* 48% Japan 54% 43% 29% 5%* 36% Thailand 46% 28% 3%* 4%* 30% North America 46% 22%* 0%* 0%* 42% North Asia 51% 33%* 16%* 0%* 36% South America 65% 28%* 11%* 0%* 34% Pacific 52%* 35%* 0%* 0%* 45% Other 48% 26% 8%* 0%* 36% Not answered 0%* 0%* 14%* 0%* 0%* Q36a Immediately after you complete your current course, what is the next thing you are most likely to do? (Tick one box only) *Cell size is less than 30 respondents – treat with caution and as indicative only.
International Student Survey 2006 Report of the Consolidated Results from the Four Education Sectors in Australia
[87]
7.1 Summary of key points Across all sectors, a third of all international respondents (34%) intended to enrol in further
studies immediately after the completion of their current course. The majority of Schools respondents (78%) said they would immediately enrol in further
studies, as did 43% of VET respondents, 36% of ELICOS respondents and 19% of HE respondents.
Across all sectors, respondents from South-East Asia (46%), China/Hong Kong (41%), Thailand (38%) and Korea (36%) had a higher likelihood of enrolling in further studies.
For all sectors, 43% of international respondents aimed to find a job immediately after completing their current course. This was the aim of 56% of HE respondents, 36% of VET respondents, 18% of ELICOS respondents and 11% of Schools respondents.
Respondents from Malaysia/Singapore (58%), India (51%), Indonesia (48%) and the Pacific countries (45%) were among those who were more likely to be planning to find a job immediately after the completion of their course.

International Student Survey 2006 Report of the Consolidated Results from the Four Education Sectors in Australia
[88]
8. International Students Survey 2007 – Follow-up survey
In September 2007, a follow-up survey will be sent to over 2,000 international students who participated in the initial International Student Survey in 2006.
This follow-up survey will be limited to graduates in the HE and VET sectors. The purpose of the survey is to measure the employment and/or further education outcomes of international students following their graduation. Control groups of up to 500 Australian graduates from each of the two sectors will also be asked to participate in this follow-up survey.
In addition, 20 in-depth case studies with students, employers and parents from five different countries including Australia will be conducted in late 2007.