Embed Size (px)
Citation preview
• Valuation
• Investment Banking
• Advisory Services
JULY 2016
RISE OF SOLAR POWER IN INDIA
Pg. 2 of 27 Confidential – For internal circulation only
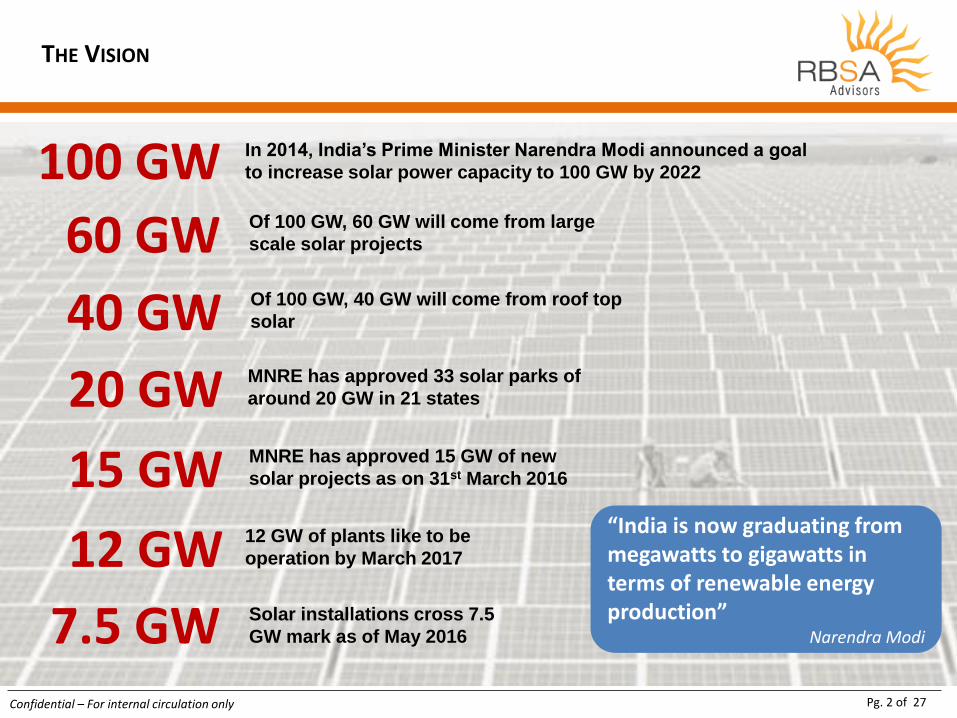
THE VISION
100 GW In 2014, India’s Prime Minister Narendra Modi announced a goal
to increase solar power capacity to 100 GW by 2022
15 GW MNRE has approved 15 GW of new
solar projects as on 31st March 2016
12 GW 12 GW of plants like to be
operation by March 2017
20 GW MNRE has approved 33 solar parks of
around 20 GW in 21 states
60 GW Of 100 GW, 60 GW will come from large
scale solar projects
40 GW Of 100 GW, 40 GW will come from roof top
solar
7.5 GW Solar installations cross 7.5
GW mark as of May 2016
“India is now graduating from megawatts to gigawatts in terms of renewable energy production”
Narendra Modi
Pg. 3 of 27 Confidential – For internal circulation only
43 39.7
34.4
25.6
18.9
8.6 6.6 5.6 5.1
2.5 1.1 0.9 0.3 0.2 0.1 0
10
20
30
40
50C
hin
a
Ger
man
y
Jap
an
USA
Ital
y
UK
Fran
ce
Ind
ia
Au
stra
lia
Can
ada
Sou
th A
fric
a
Ch
ile
Mex
ico
Ph
illip
ines
Thai
lan
d
Cap
city
(G
W)
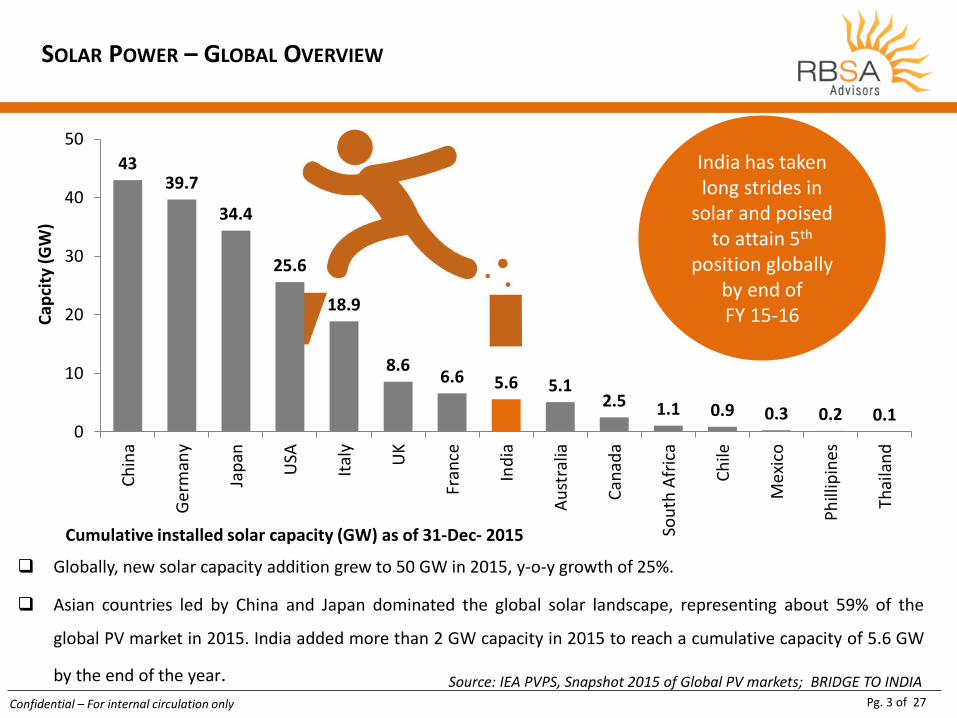
SOLAR POWER – GLOBAL OVERVIEW
Cumulative installed solar capacity (GW) as of 31-Dec- 2015
Source: IEA PVPS, Snapshot 2015 of Global PV markets; BRIDGE TO INDIA
Globally, new solar capacity addition grew to 50 GW in 2015, y-o-y growth of 25%.
Asian countries led by China and Japan dominated the global solar landscape, representing about 59% of the
global PV market in 2015. India added more than 2 GW capacity in 2015 to reach a cumulative capacity of 5.6 GW
by the end of the year.
India has taken long strides in
solar and poised to attain 5th
position globally by end of FY 15-16
Pg. 4 of 27 Confidential – For internal circulation only
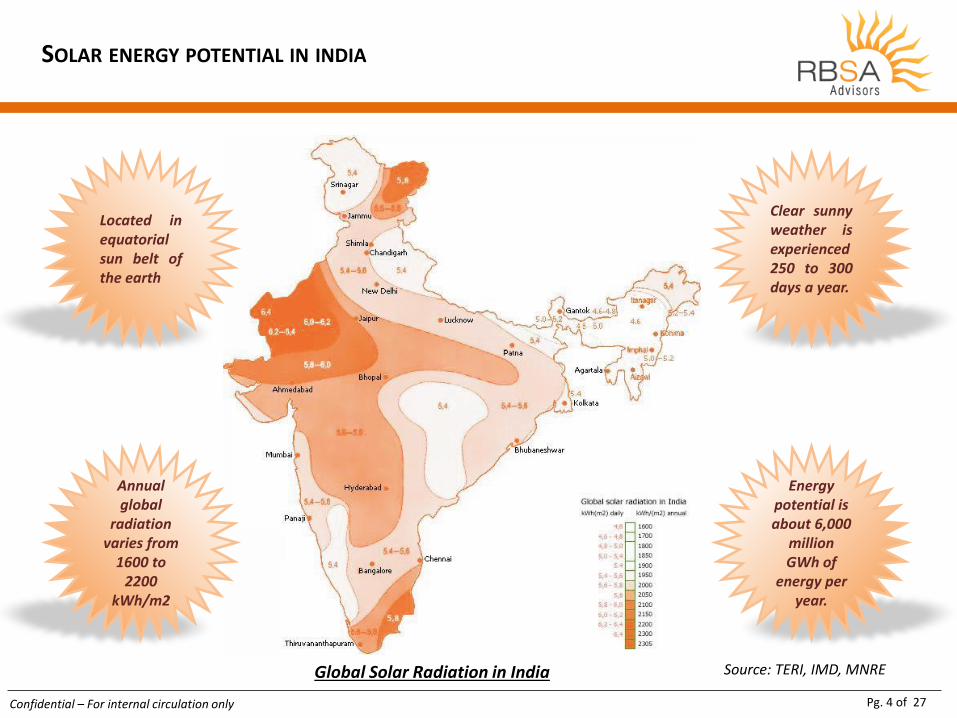
SOLAR ENERGY POTENTIAL IN INDIA
Global Solar Radiation in India Source: TERI, IMD, MNRE
Located in equatorial sun belt of the earth
Annual global
radiation varies from
1600 to 2200
kWh/m2
Energy potential is about 6,000
million GWh of
energy per year.
Clear sunny weather is experienced 250 to 300 days a year.
Pg. 5 of 27 Confidential – For internal circulation only
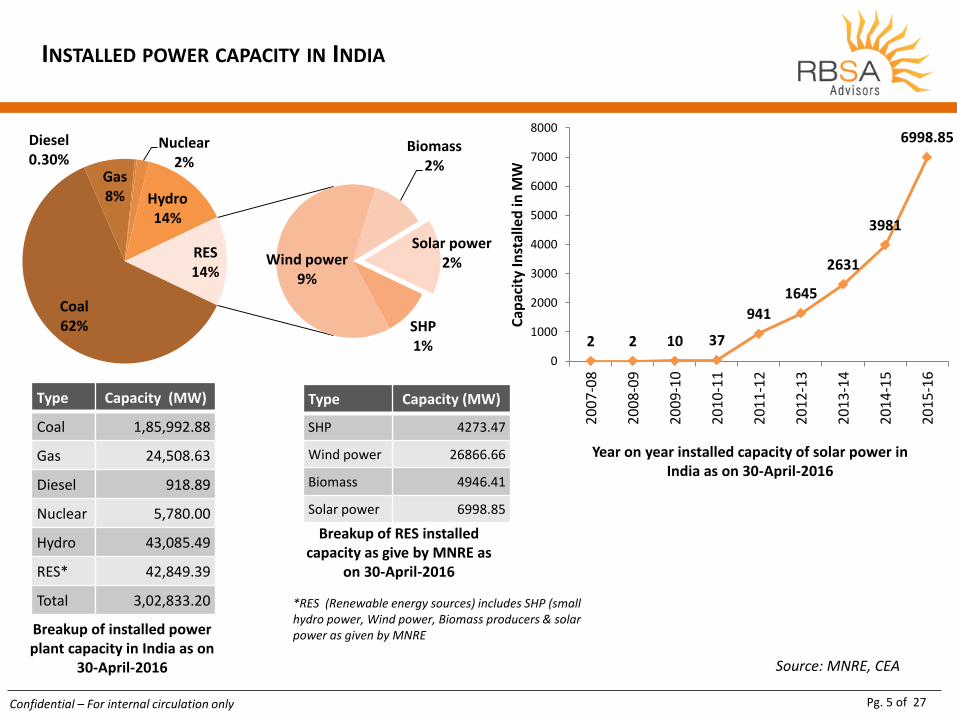
INSTALLED POWER CAPACITY IN INDIA
Coal 62%
Gas 8%
Diesel 0.30%
Nuclear 2%
Hydro 14%
SHP 1%
Wind power 9%
Biomass 2%
Solar power 2%
RES 14%
Type Capacity (MW)
Coal 1,85,992.88
Gas 24,508.63
Diesel 918.89
Nuclear 5,780.00
Hydro 43,085.49
RES* 42,849.39
Total 3,02,833.20
Type Capacity (MW)
SHP 4273.47
Wind power 26866.66
Biomass 4946.41
Solar power 6998.85
*RES (Renewable energy sources) includes SHP (small hydro power, Wind power, Biomass producers & solar power as given by MNRE Breakup of installed power
plant capacity in India as on 30-April-2016
Breakup of RES installed capacity as give by MNRE as
on 30-April-2016
Year on year installed capacity of solar power in India as on 30-April-2016
Source: MNRE, CEA
2 2 10 37
941
1645
2631
3981
6998.85
0
1000
2000
3000
4000
5000
6000
7000
8000
20
07
-08
20
08
-09
20
09
-10
20
10
-11
20
11
-12
20
12
-13
20
13
-14
20
14
-15
20
15
-16
Cap
acit
y In
stal
led
in M
W
Pg. 6 of 27 Confidential – For internal circulation only
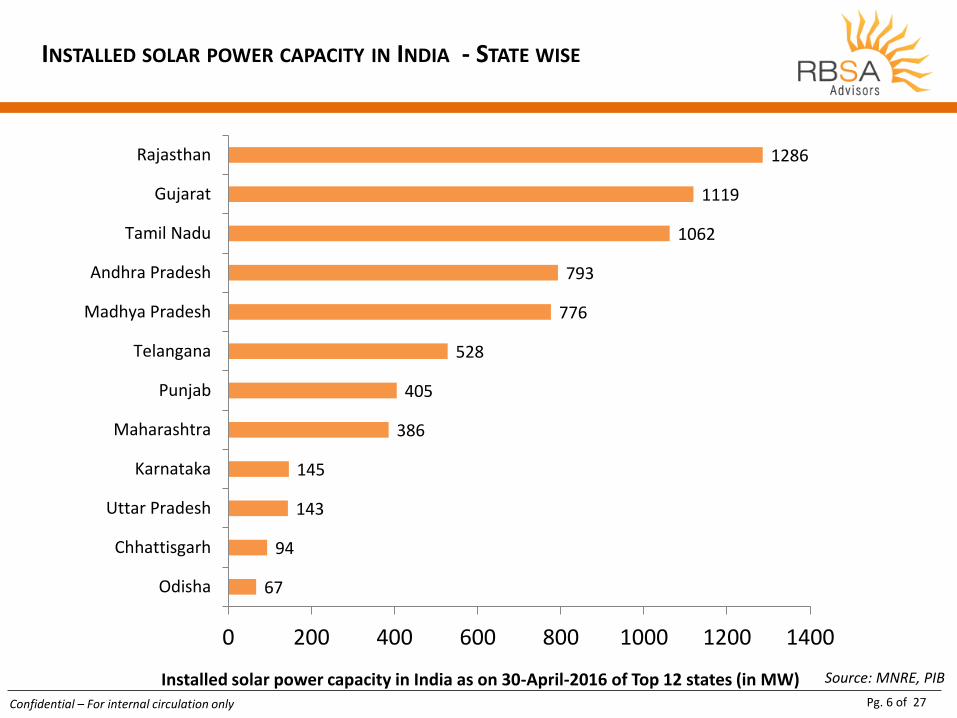
67
94
143
145
386
405
528
776
793
1062
1119
1286
0 200 400 600 800 1000 1200 1400
Odisha
Chhattisgarh
Uttar Pradesh
Karnataka
Maharashtra
Punjab
Telangana
Madhya Pradesh
Andhra Pradesh
Tamil Nadu
Gujarat
Rajasthan
INSTALLED SOLAR POWER CAPACITY IN INDIA - STATE WISE
Installed solar power capacity in India as on 30-April-2016 of Top 12 states (in MW) Source: MNRE, PIB
Pg. 7 of 27 Confidential – For internal circulation only
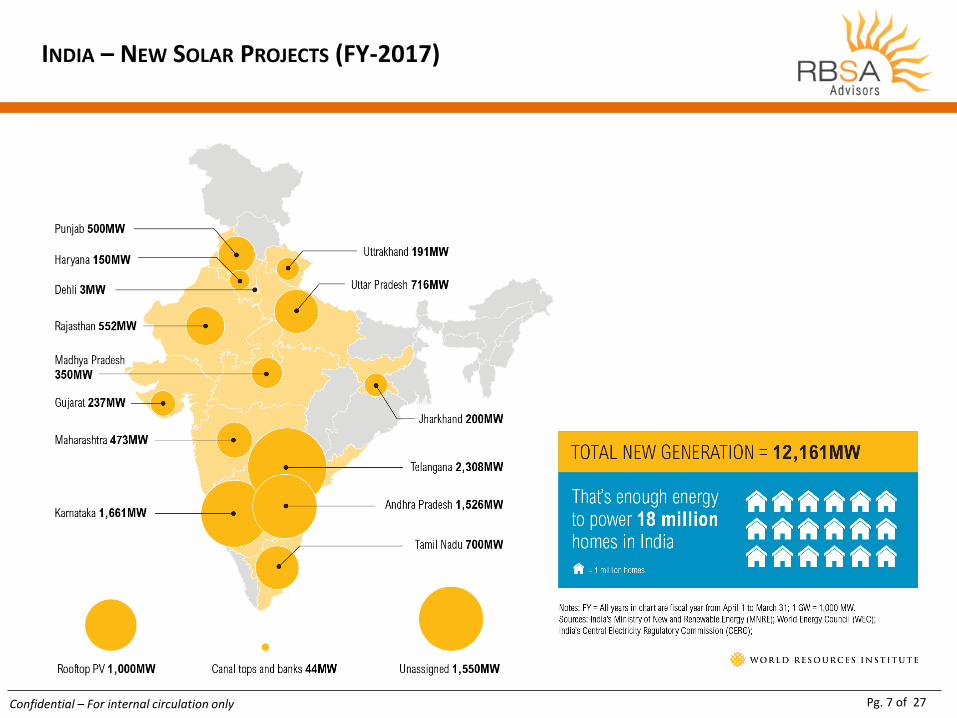
INDIA – NEW SOLAR PROJECTS (FY-2017)
Pg. 8 of 27 Confidential – For internal circulation only
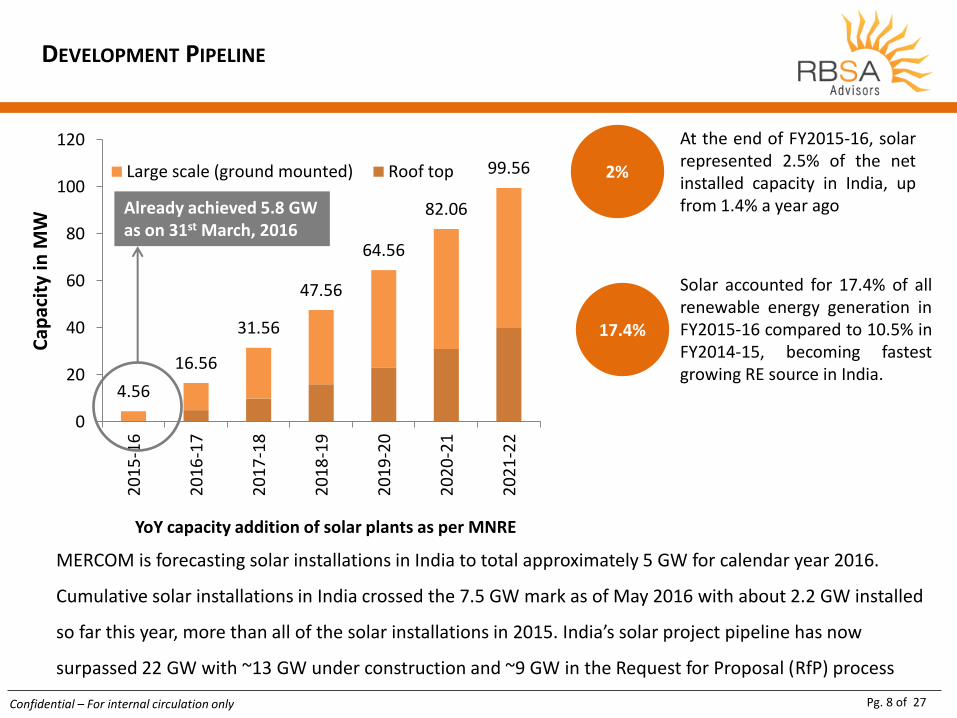
DEVELOPMENT PIPELINE
4.56
16.56
31.56
47.56
64.56
82.06
99.56
0
20
40
60
80
100
1202
01
5-1
6
20
16
-17
20
17
-18
20
18
-19
20
19
-20
20
20
-21
20
21
-22
Cap
acit
y in
MW
Large scale (ground mounted) Roof top
Already achieved 5.8 GW as on 31st March, 2016
YoY capacity addition of solar plants as per MNRE
MERCOM is forecasting solar installations in India to total approximately 5 GW for calendar year 2016.
Cumulative solar installations in India crossed the 7.5 GW mark as of May 2016 with about 2.2 GW installed
so far this year, more than all of the solar installations in 2015. India’s solar project pipeline has now
surpassed 22 GW with ~13 GW under construction and ~9 GW in the Request for Proposal (RfP) process
At the end of FY2015-16, solar represented 2.5% of the net installed capacity in India, up from 1.4% a year ago
2%
17.4%
Solar accounted for 17.4% of all renewable energy generation in FY2015-16 compared to 10.5% in FY2014-15, becoming fastest growing RE source in India.
Pg. 9 of 27 Confidential – For internal circulation only
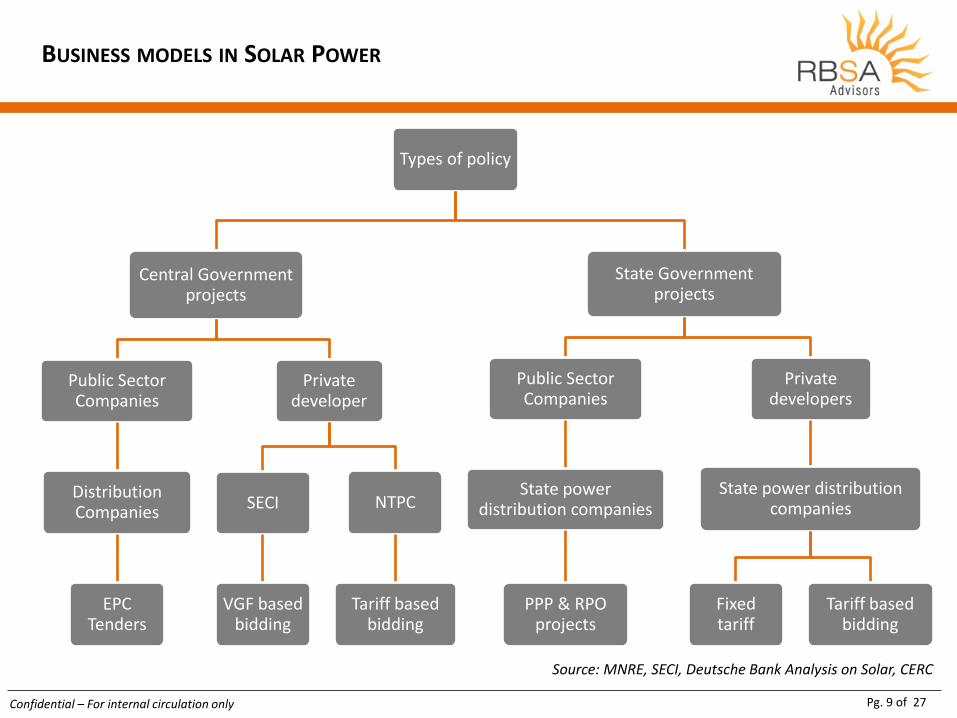
BUSINESS MODELS IN SOLAR POWER
Types of policy
Central Government projects
Public Sector Companies
Distribution Companies
EPC Tenders
Private developer
SECI
VGF based bidding
NTPC
Tariff based bidding
State Government projects
Public Sector Companies
State power distribution companies
PPP & RPO projects
Private developers
State power distribution companies
Fixed tariff
Tariff based bidding
Source: MNRE, SECI, Deutsche Bank Analysis on Solar, CERC
Pg. 10 of 27 Confidential – For internal circulation only
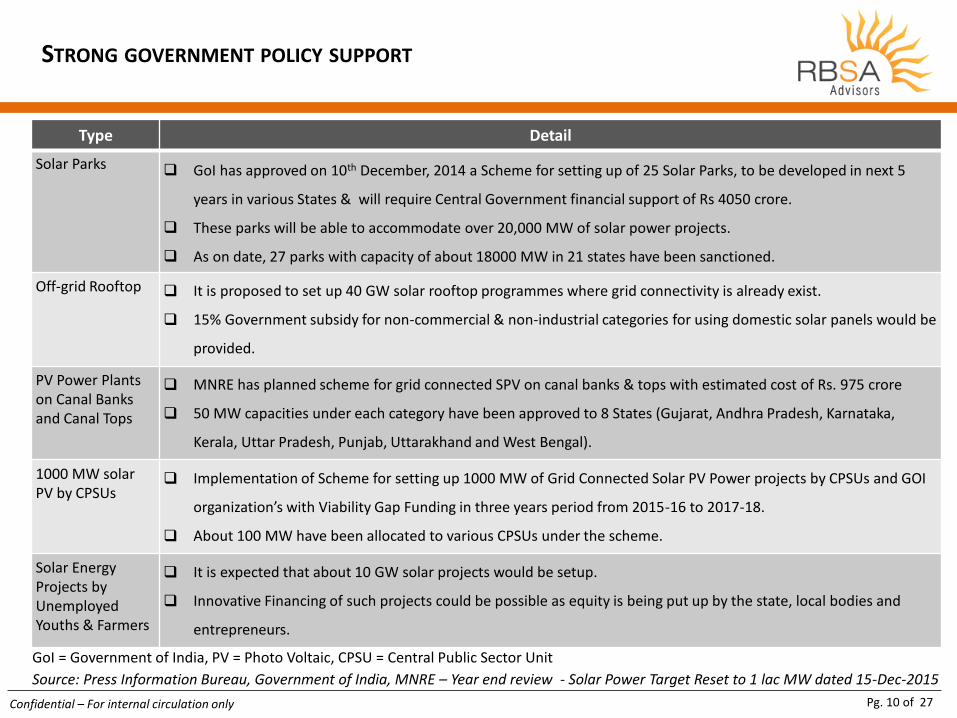
STRONG GOVERNMENT POLICY SUPPORT
Type Detail
Solar Parks GoI has approved on 10th December, 2014 a Scheme for setting up of 25 Solar Parks, to be developed in next 5
years in various States & will require Central Government financial support of Rs 4050 crore.
These parks will be able to accommodate over 20,000 MW of solar power projects.
As on date, 27 parks with capacity of about 18000 MW in 21 states have been sanctioned.
Off-grid Rooftop It is proposed to set up 40 GW solar rooftop programmes where grid connectivity is already exist.
15% Government subsidy for non-commercial & non-industrial categories for using domestic solar panels would be
provided.
PV Power Plants on Canal Banks and Canal Tops
MNRE has planned scheme for grid connected SPV on canal banks & tops with estimated cost of Rs. 975 crore
50 MW capacities under each category have been approved to 8 States (Gujarat, Andhra Pradesh, Karnataka,
Kerala, Uttar Pradesh, Punjab, Uttarakhand and West Bengal).
1000 MW solar PV by CPSUs
Implementation of Scheme for setting up 1000 MW of Grid Connected Solar PV Power projects by CPSUs and GOI
organization’s with Viability Gap Funding in three years period from 2015-16 to 2017-18.
About 100 MW have been allocated to various CPSUs under the scheme.
Solar Energy Projects by Unemployed Youths & Farmers
It is expected that about 10 GW solar projects would be setup.
Innovative Financing of such projects could be possible as equity is being put up by the state, local bodies and
entrepreneurs.
Source: Press Information Bureau, Government of India, MNRE – Year end review - Solar Power Target Reset to 1 lac MW dated 15-Dec-2015
GoI = Government of India, PV = Photo Voltaic, CPSU = Central Public Sector Unit
Pg. 11 of 27 Confidential – For internal circulation only
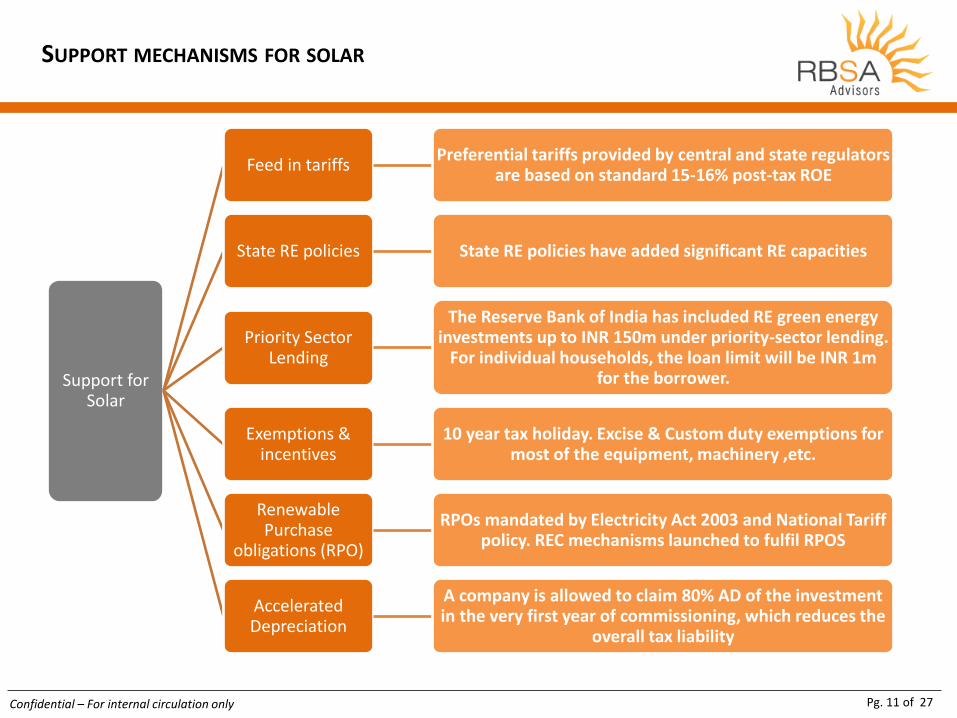
SUPPORT MECHANISMS FOR SOLAR
Support for Solar
Feed in tariffs Preferential tariffs provided by central and state regulators
are based on standard 15-16% post-tax ROE
State RE policies State RE policies have added significant RE capacities
Priority Sector Lending
The Reserve Bank of India has included RE green energy investments up to INR 150m under priority-sector lending.
For individual households, the loan limit will be INR 1m for the borrower.
Exemptions & incentives
10 year tax holiday. Excise & Custom duty exemptions for most of the equipment, machinery ,etc.
Renewable Purchase
obligations (RPO)
RPOs mandated by Electricity Act 2003 and National Tariff policy. REC mechanisms launched to fulfil RPOS
Accelerated Depreciation
A company is allowed to claim 80% AD of the investment in the very first year of commissioning, which reduces the
overall tax liability
Pg. 12 of 27 Confidential – For internal circulation only
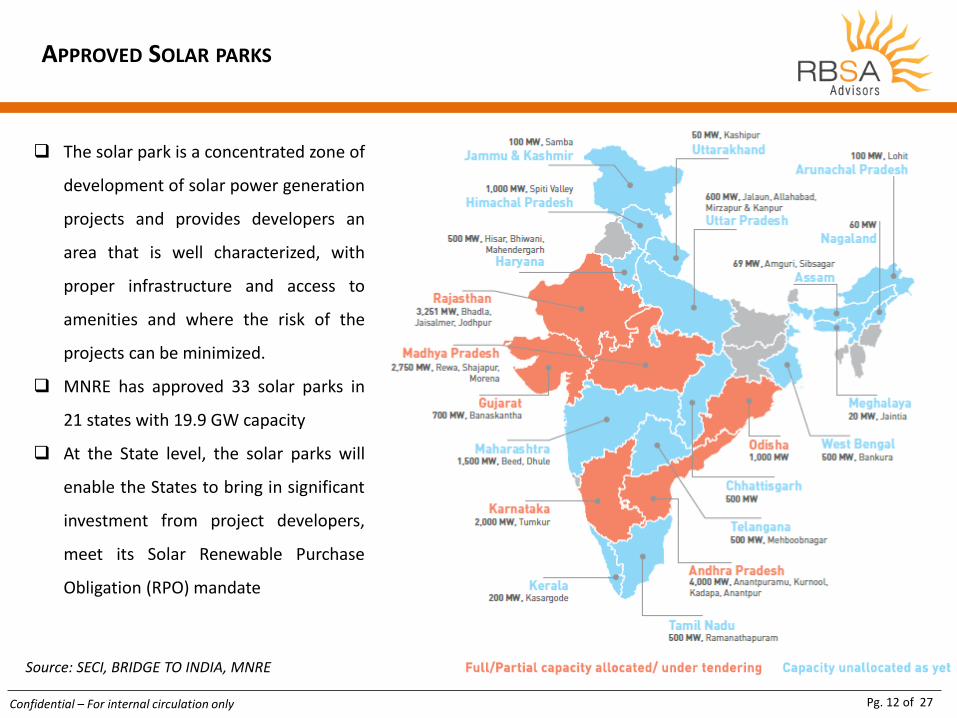
APPROVED SOLAR PARKS
The solar park is a concentrated zone of
development of solar power generation
projects and provides developers an
area that is well characterized, with
proper infrastructure and access to
amenities and where the risk of the
projects can be minimized.
MNRE has approved 33 solar parks in
21 states with 19.9 GW capacity
At the State level, the solar parks will
enable the States to bring in significant
investment from project developers,
meet its Solar Renewable Purchase
Obligation (RPO) mandate
Source: SECI, BRIDGE TO INDIA, MNRE
Pg. 13 of 27 Confidential – For internal circulation only
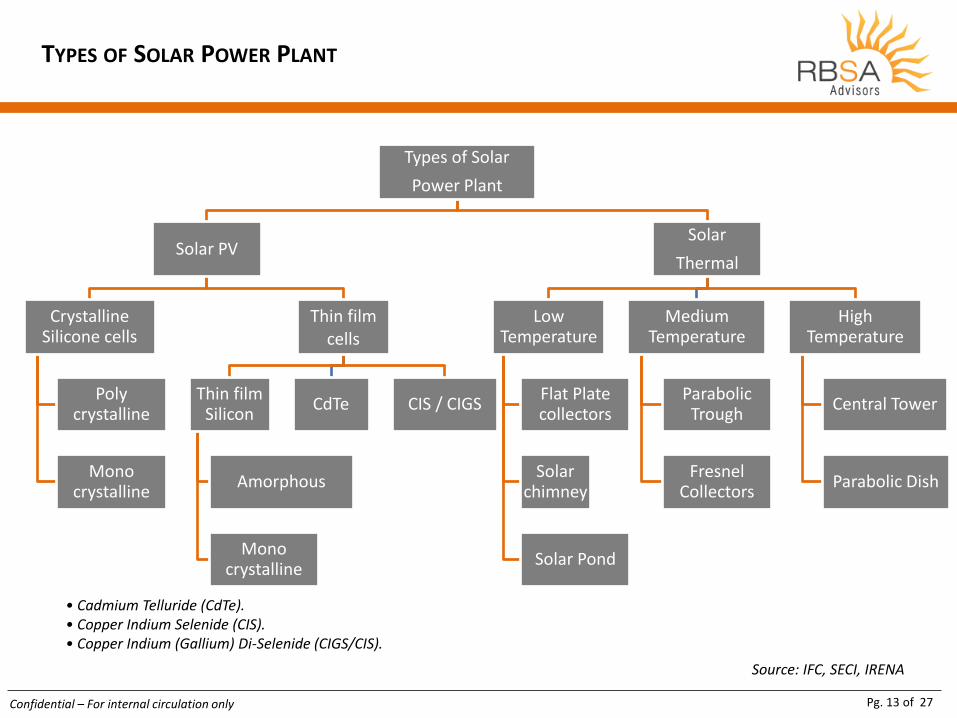
TYPES OF SOLAR POWER PLANT
Types of Solar
Power Plant
Solar PV
Crystalline Silicone cells
Poly crystalline
Mono crystalline
Thin film cells
Thin film Silicon
Amorphous
Mono crystalline
CdTe CIS / CIGS
Solar
Thermal
Low Temperature
Flat Plate collectors
Solar chimney
Solar Pond
Medium Temperature
Parabolic Trough
Fresnel Collectors
High Temperature
Central Tower
Parabolic Dish
Source: IFC, SECI, IRENA
• Cadmium Telluride (CdTe). • Copper Indium Selenide (CIS). • Copper Indium (Gallium) Di-Selenide (CIGS/CIS).
Pg. 14 of 27 Confidential – For internal circulation only
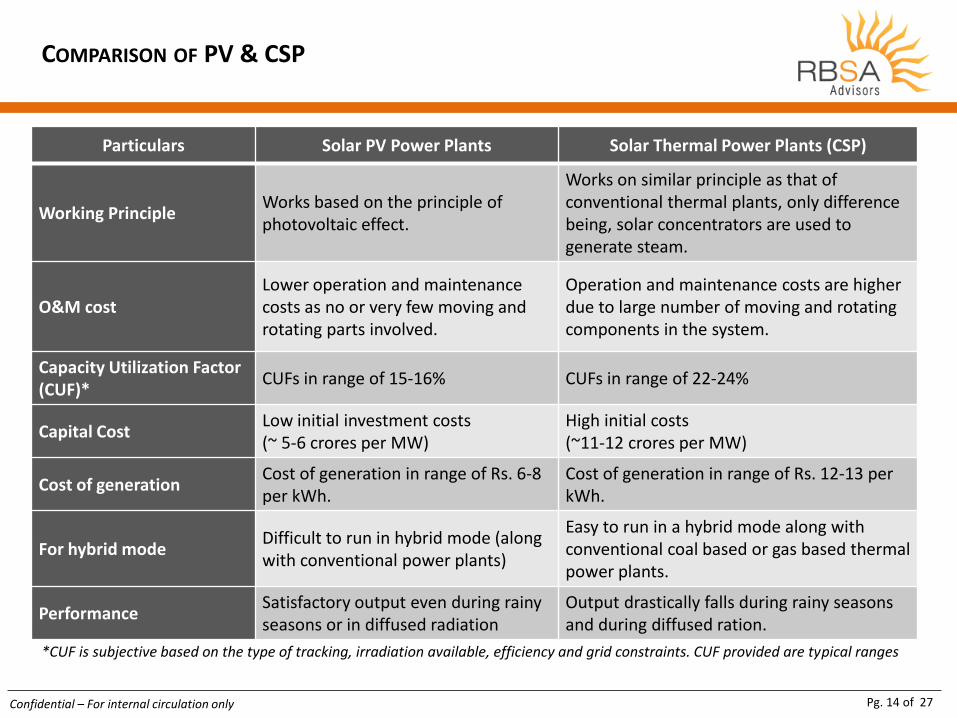
COMPARISON OF PV & CSP
Particulars Solar PV Power Plants Solar Thermal Power Plants (CSP)
Working Principle Works based on the principle of photovoltaic effect.
Works on similar principle as that of conventional thermal plants, only difference being, solar concentrators are used to generate steam.
O&M cost Lower operation and maintenance costs as no or very few moving and rotating parts involved.
Operation and maintenance costs are higher due to large number of moving and rotating components in the system.
Capacity Utilization Factor (CUF)*
CUFs in range of 15-16% CUFs in range of 22-24%
Capital Cost Low initial investment costs (~ 5-6 crores per MW)
High initial costs (~11-12 crores per MW)
Cost of generation Cost of generation in range of Rs. 6-8 per kWh.
Cost of generation in range of Rs. 12-13 per kWh.
For hybrid mode Difficult to run in hybrid mode (along with conventional power plants)
Easy to run in a hybrid mode along with conventional coal based or gas based thermal power plants.
Performance Satisfactory output even during rainy seasons or in diffused radiation
Output drastically falls during rainy seasons and during diffused ration.
*CUF is subjective based on the type of tracking, irradiation available, efficiency and grid constraints. CUF provided are typical ranges
Pg. 15 of 27 Confidential – For internal circulation only
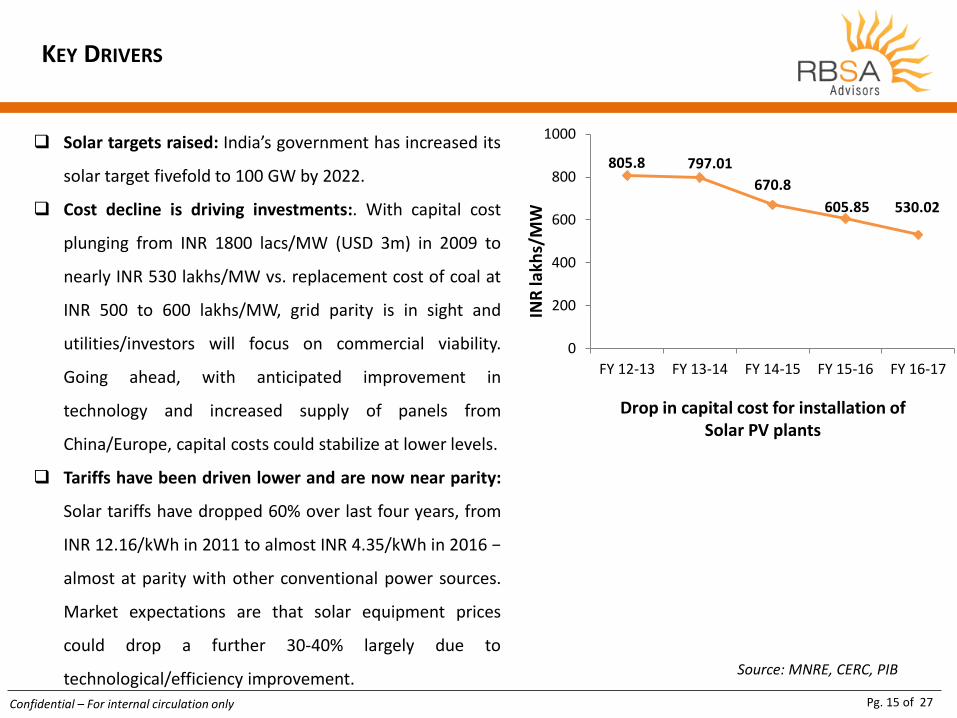
KEY DRIVERS
Solar targets raised: India’s government has increased its
solar target fivefold to 100 GW by 2022.
Cost decline is driving investments:. With capital cost
plunging from INR 1800 lacs/MW (USD 3m) in 2009 to
nearly INR 530 lakhs/MW vs. replacement cost of coal at
INR 500 to 600 lakhs/MW, grid parity is in sight and
utilities/investors will focus on commercial viability.
Going ahead, with anticipated improvement in
technology and increased supply of panels from
China/Europe, capital costs could stabilize at lower levels.
Tariffs have been driven lower and are now near parity:
Solar tariffs have dropped 60% over last four years, from
INR 12.16/kWh in 2011 to almost INR 4.35/kWh in 2016 −
almost at parity with other conventional power sources.
Market expectations are that solar equipment prices
could drop a further 30-40% largely due to
technological/efficiency improvement. Source: MNRE, CERC, PIB
805.8 797.01
670.8
605.85 530.02
0
200
400
600
800
1000
FY 12-13 FY 13-14 FY 14-15 FY 15-16 FY 16-17
INR
lakh
s/M
W
Drop in capital cost for installation of Solar PV plants
Pg. 16 of 27 Confidential – For internal circulation only
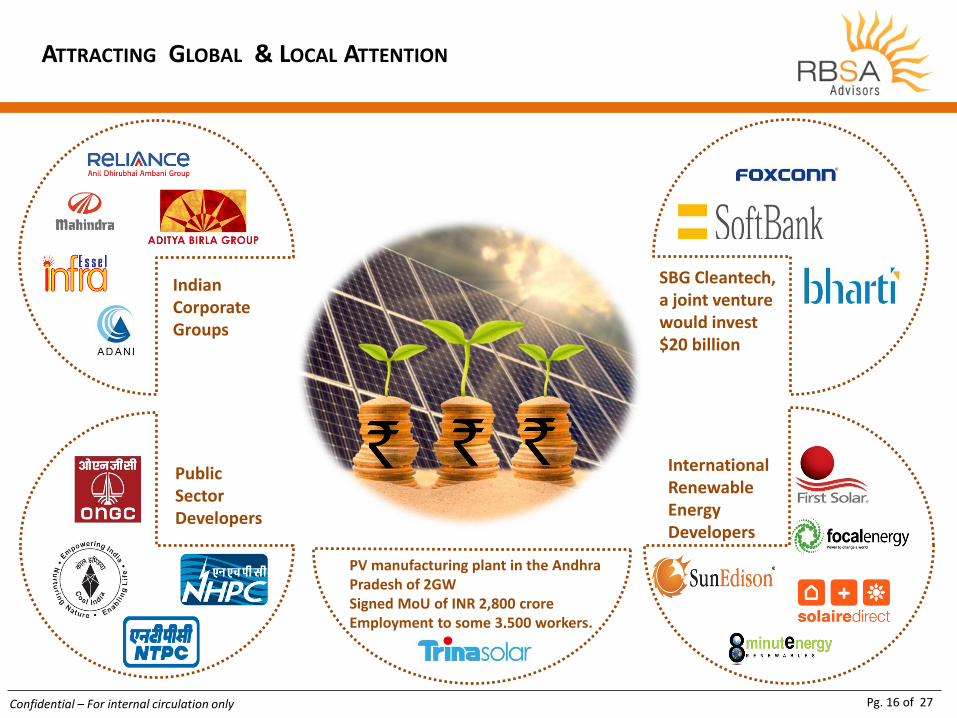
ATTRACTING GLOBAL & LOCAL ATTENTION
Public Sector Developers
International Renewable Energy Developers
Indian Corporate Groups
SBG Cleantech, a joint venture would invest $20 billion
PV manufacturing plant in the Andhra Pradesh of 2GW Signed MoU of INR 2,800 crore Employment to some 3,500 workers.
Pg. 17 of 27 Confidential – For internal circulation only
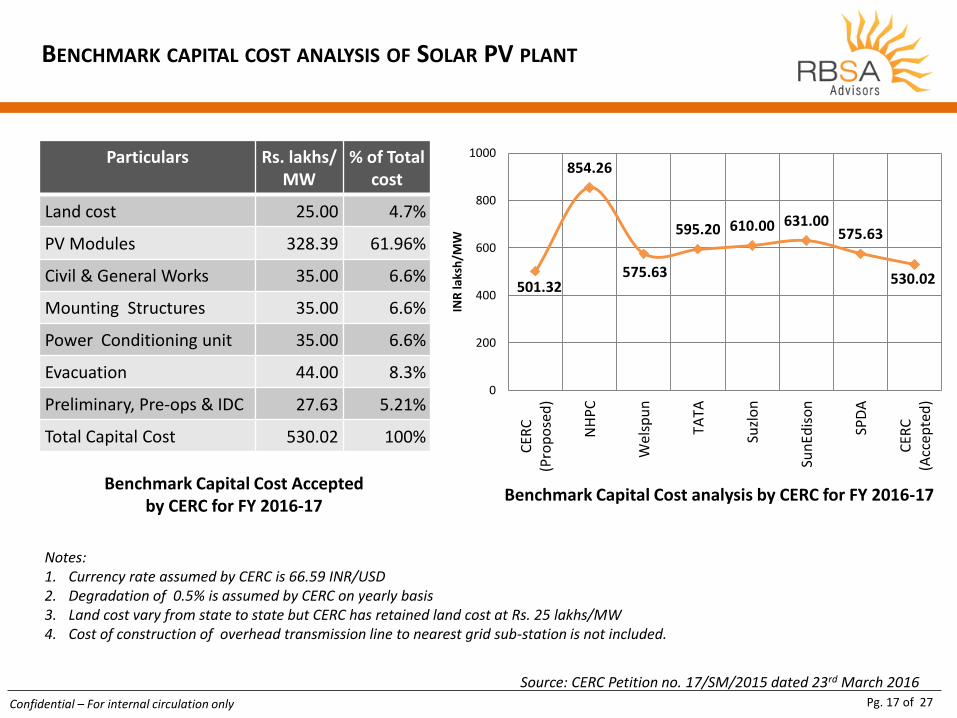
BENCHMARK CAPITAL COST ANALYSIS OF SOLAR PV PLANT
Source: CERC Petition no. 17/SM/2015 dated 23rd March 2016
501.32
854.26
575.63
595.20 610.00 631.00 575.63
530.02
0
200
400
600
800
1000
CER
C(P
rop
ose
d)
NH
PC
Wel
spu
n
TATA
Suzl
on
Sun
Edis
on
SPD
A
CER
C(A
ccep
ted
)
INR
laks
h/M
W
Notes: 1. Currency rate assumed by CERC is 66.59 INR/USD 2. Degradation of 0.5% is assumed by CERC on yearly basis 3. Land cost vary from state to state but CERC has retained land cost at Rs. 25 lakhs/MW 4. Cost of construction of overhead transmission line to nearest grid sub-station is not included.
Benchmark Capital Cost Accepted by CERC for FY 2016-17
Benchmark Capital Cost analysis by CERC for FY 2016-17
Particulars Rs. lakhs/ MW
% of Total cost
Land cost 25.00 4.7%
PV Modules 328.39 61.96%
Civil & General Works 35.00 6.6%
Mounting Structures 35.00 6.6%
Power Conditioning unit 35.00 6.6%
Evacuation 44.00 8.3%
Preliminary, Pre-ops & IDC 27.63 5.21%
Total Capital Cost 530.02 100%
Pg. 18 of 27 Confidential – For internal circulation only
SOLAR POWER AUCTION DATA ACROSS INDIA
4
5
6
7
8
Ch
atti
sgar
h10
0 M
W A
pri
l 14
Kar
nat
aka
50
0 M
W, A
ug
14
Tela
nga
na
500
MW
,Sep
14
An
dh
ra P
rad
esh
500
MW
,Oct
14
Mad
hya
Pra
des
h30
0 M
W, J
uly
15
Tela
nga
na
20
0 M
W, A
ug
15
Pu
nja
b50
0 M
W, S
ep 1
5
Utt
arak
han
d17
0 M
W, O
ct 1
5
An
dh
ra P
rad
esh
50
0 M
W,N
ov
15
An
dh
ra P
rad
esh
350
MW
,De
c 1
5
An
dh
ra P
rad
esh
150
MW
DC
R,D
ec
15
Har
yan
a1
50
MW
De
c 1
5
Raj
asth
an42
0 M
W, J
an 1
6
Mah
aras
htr
a45
0 M
W, J
an 1
6
Utt
ar P
rad
esh
100
MW
, Jan
16
Kar
nat
aka
86
0 M
W ,
Mar
16
Jhar
khan
d12
0 M
W, M
ar 1
6
Kar
nat
aka
500
MW
, Ap
r 1
6
2014 2015 2016
Win
nin
g T
ari
ff R
an
ge
(IN
R/k
Wh
)
2.5x 2.8x 3.7x
2.6x 2.3x 2.4x 3.3x 2.8x
10.8x 6x 5.7x
4.3x
9.8x
0.5x
3.5x 2.9x 2.1x
4.5x
Source : Bridge to India
NSM Projects State Policy Projects
NSM= National Solar Mission
Pg. 19 of 27 Confidential – For internal circulation only
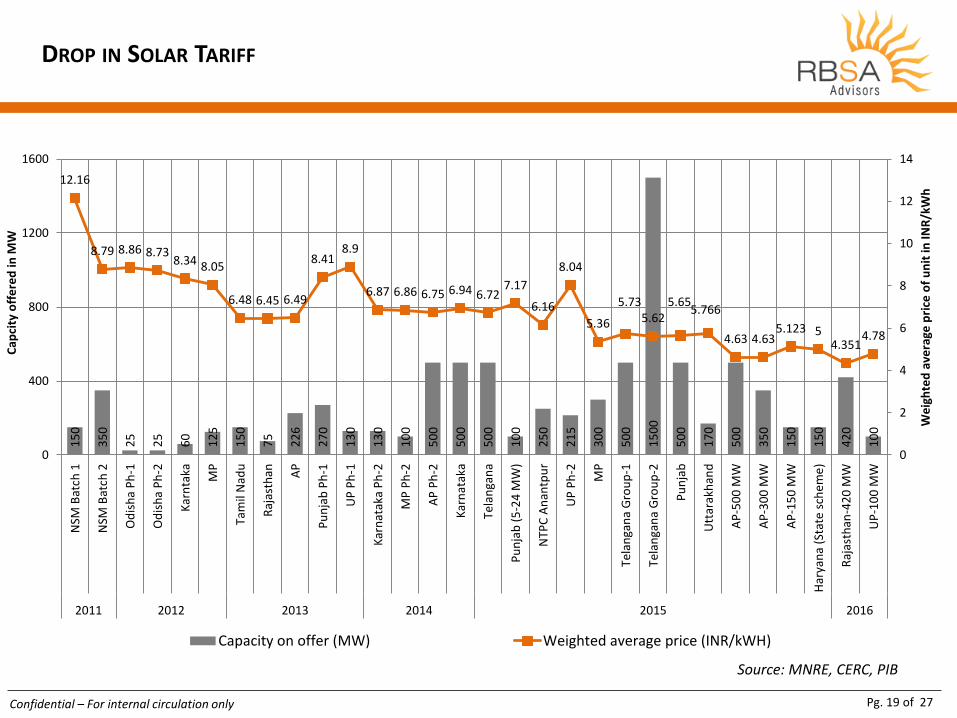
DROP IN SOLAR TARIFF 1
50
35
0
25
25
60
12
5
15
0
75
22
6
27
0
13
0
13
0
10
0
50
0
50
0
50
0
10
0
25
0
21
5
30
0
50
0
15
00
50
0
17
0
50
0
35
0
15
0
15
0
42
0
10
0
12.16
8.79 8.86 8.73 8.34 8.05
6.48 6.45 6.49
8.41 8.9
6.87 6.86 6.75 6.94 6.72 7.17
6.16
8.04
5.36
5.73 5.62
5.65 5.766
4.63 4.63 5.123 5
4.351 4.78
0
2
4
6
8
10
12
14
0
400
800
1200
1600
NSM
Bat
ch 1
NSM
Bat
ch 2
Od
ish
a P
h-1
Od
ish
a P
h-2
Kar
nta
ka MP
Tam
il N
adu
Raj
asth
an AP
Pu
nja
b P
h-1
UP
Ph
-1
Kar
nat
aka
Ph
-2
MP
Ph
-2
AP
Ph
-2
Kar
nat
aka
Tela
nga
na
Pu
nja
b (
5-2
4 M
W)
NTP
C A
nan
tpu
r
UP
Ph
-2
MP
Tela
nga
na
Gro
up
-1
Tela
nga
na
Gro
up
-2
Pu
nja
b
Utt
arak
han
d
AP
-50
0 M
W
AP
-30
0 M
W
AP
-15
0 M
W
Har
yan
a (S
tate
sch
em
e)
Raj
asth
an-4
20
MW
UP
-10
0 M
W
2011 2012 2013 2014 2015 2016
We
igh
ted
ave
rage
pri
ce o
f u
nit
in IN
R/k
Wh
Cap
city
off
ere
d in
MW
Capacity on offer (MW) Weighted average price (INR/kWH)
Source: MNRE, CERC, PIB
Pg. 20 of 27 Confidential – For internal circulation only
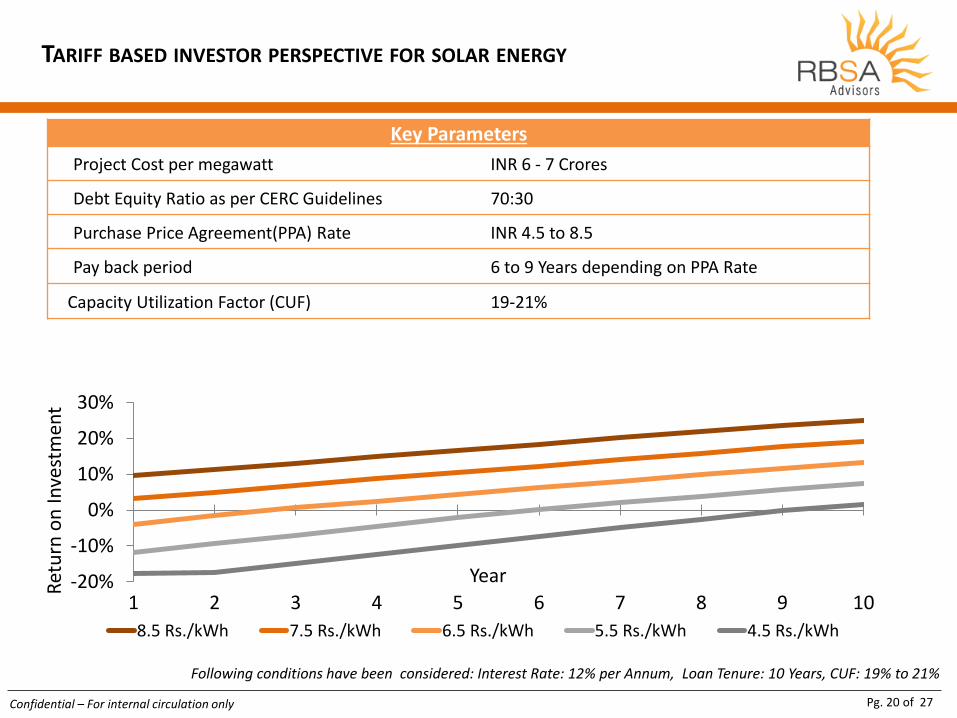
TARIFF BASED INVESTOR PERSPECTIVE FOR SOLAR ENERGY
Key Parameters
Project Cost per megawatt INR 6 - 7 Crores
Debt Equity Ratio as per CERC Guidelines 70:30
Purchase Price Agreement(PPA) Rate INR 4.5 to 8.5
Pay back period 6 to 9 Years depending on PPA Rate
Capacity Utilization Factor (CUF) 19-21%
-20%
-10%
0%
10%
20%
30%
1 2 3 4 5 6 7 8 9 10
Ret
urn
on
Inve
stm
ent
Year
8.5 Rs./kWh 7.5 Rs./kWh 6.5 Rs./kWh 5.5 Rs./kWh 4.5 Rs./kWh
Following conditions have been considered: Interest Rate: 12% per Annum, Loan Tenure: 10 Years, CUF: 19% to 21%
Pg. 21 of 27 Confidential – For internal circulation only
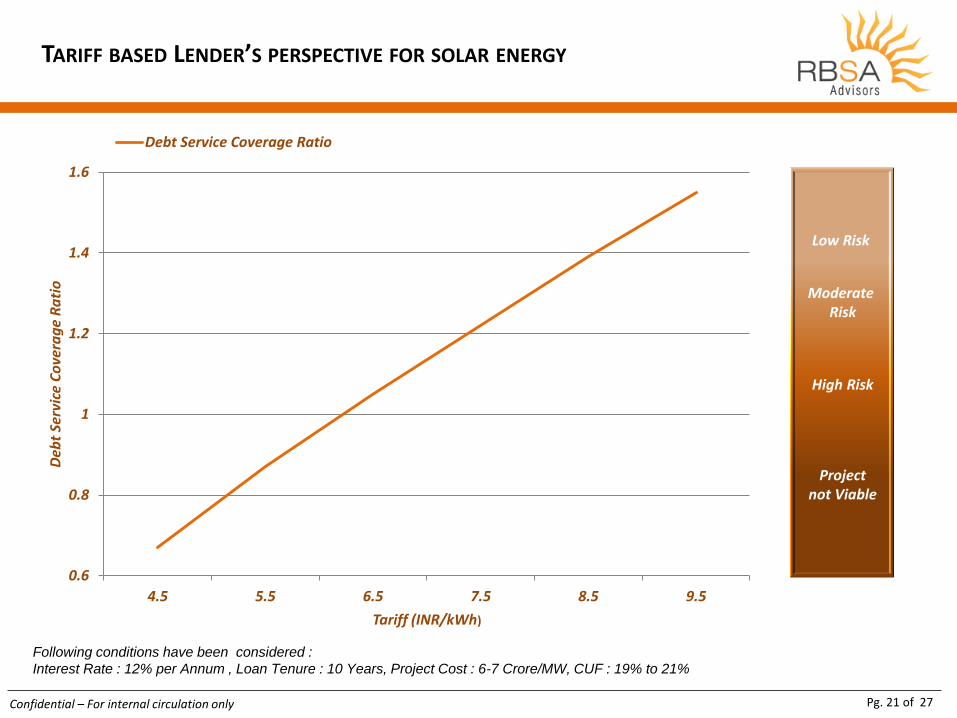
TARIFF BASED LENDER’S PERSPECTIVE FOR SOLAR ENERGY
Following conditions have been considered :
Interest Rate : 12% per Annum , Loan Tenure : 10 Years, Project Cost : 6-7 Crore/MW, CUF : 19% to 21%
0.6
0.8
1
1.2
1.4
1.6
4.5 5.5 6.5 7.5 8.5 9.5
Deb
t Se
rvic
e C
ove
rag
e R
ati
o
Tariff (INR/kWh)
Debt Service Coverage Ratio
Low Risk
Project not Viable
High Risk
Moderate Risk
Pg. 22 of 27 Confidential – For internal circulation only
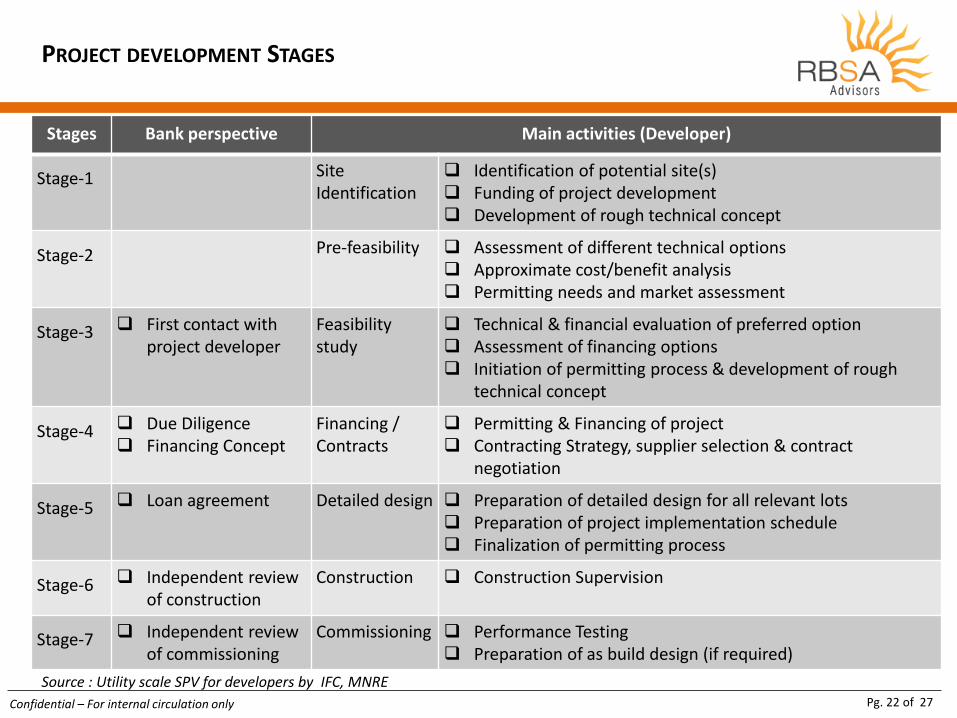
PROJECT DEVELOPMENT STAGES
Stages Bank perspective Main activities (Developer)
Stage-1 Site Identification
Identification of potential site(s) Funding of project development Development of rough technical concept
Stage-2 Pre-feasibility Assessment of different technical options Approximate cost/benefit analysis Permitting needs and market assessment
Stage-3 First contact with project developer
Feasibility study
Technical & financial evaluation of preferred option Assessment of financing options Initiation of permitting process & development of rough
technical concept
Stage-4 Due Diligence Financing Concept
Financing / Contracts
Permitting & Financing of project Contracting Strategy, supplier selection & contract
negotiation
Stage-5 Loan agreement Detailed design Preparation of detailed design for all relevant lots Preparation of project implementation schedule Finalization of permitting process
Stage-6 Independent review of construction
Construction Construction Supervision
Stage-7 Independent review of commissioning
Commissioning Performance Testing Preparation of as build design (if required)
Source : Utility scale SPV for developers by IFC, MNRE
Pg. 23 of 27 Confidential – For internal circulation only
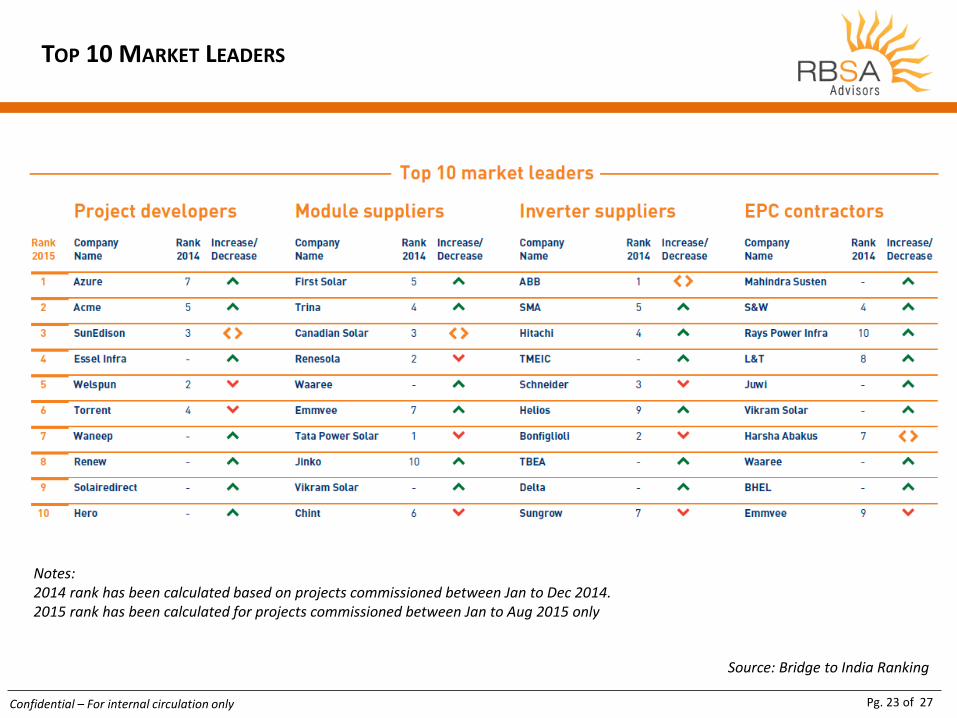
TOP 10 MARKET LEADERS
Source: Bridge to India Ranking
Notes: 2014 rank has been calculated based on projects commissioned between Jan to Dec 2014. 2015 rank has been calculated for projects commissioned between Jan to Aug 2015 only
Pg. 24 of 27 Confidential – For internal circulation only
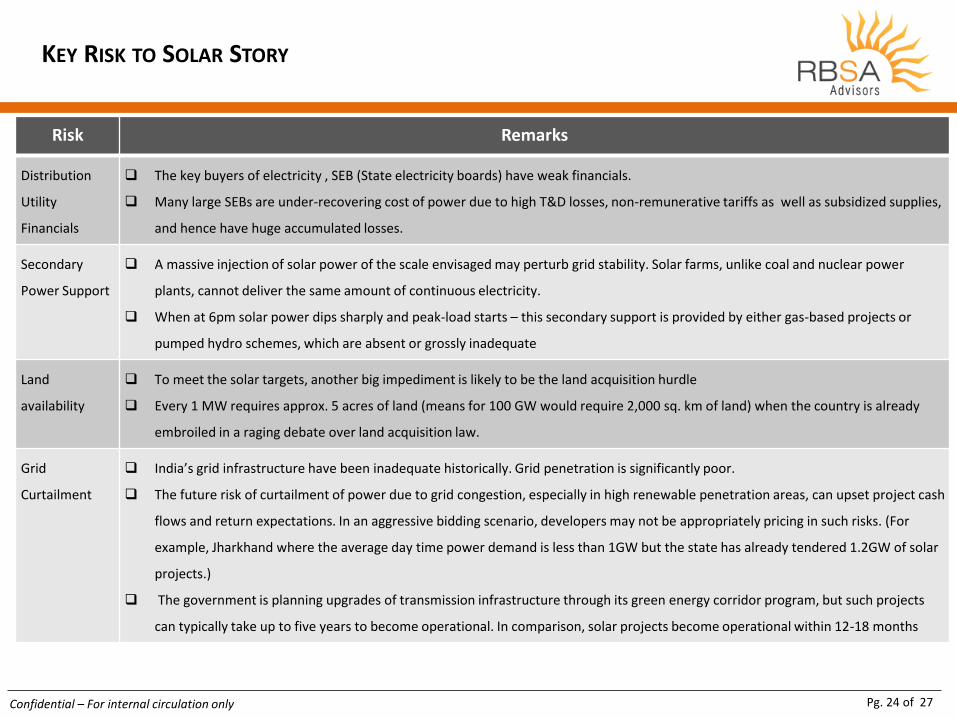
KEY RISK TO SOLAR STORY
Risk Remarks
Distribution
Utility
Financials
The key buyers of electricity , SEB (State electricity boards) have weak financials.
Many large SEBs are under-recovering cost of power due to high T&D losses, non-remunerative tariffs as well as subsidized supplies,
and hence have huge accumulated losses.
Secondary
Power Support
A massive injection of solar power of the scale envisaged may perturb grid stability. Solar farms, unlike coal and nuclear power
plants, cannot deliver the same amount of continuous electricity.
When at 6pm solar power dips sharply and peak-load starts – this secondary support is provided by either gas-based projects or
pumped hydro schemes, which are absent or grossly inadequate
Land
availability
To meet the solar targets, another big impediment is likely to be the land acquisition hurdle
Every 1 MW requires approx. 5 acres of land (means for 100 GW would require 2,000 sq. km of land) when the country is already
embroiled in a raging debate over land acquisition law.
Grid
Curtailment
India’s grid infrastructure have been inadequate historically. Grid penetration is significantly poor.
The future risk of curtailment of power due to grid congestion, especially in high renewable penetration areas, can upset project cash
flows and return expectations. In an aggressive bidding scenario, developers may not be appropriately pricing in such risks. (For
example, Jharkhand where the average day time power demand is less than 1GW but the state has already tendered 1.2GW of solar
projects.)
The government is planning upgrades of transmission infrastructure through its green energy corridor program, but such projects
can typically take up to five years to become operational. In comparison, solar projects become operational within 12-18 months
Pg. 25 of 27 Confidential – For internal circulation only
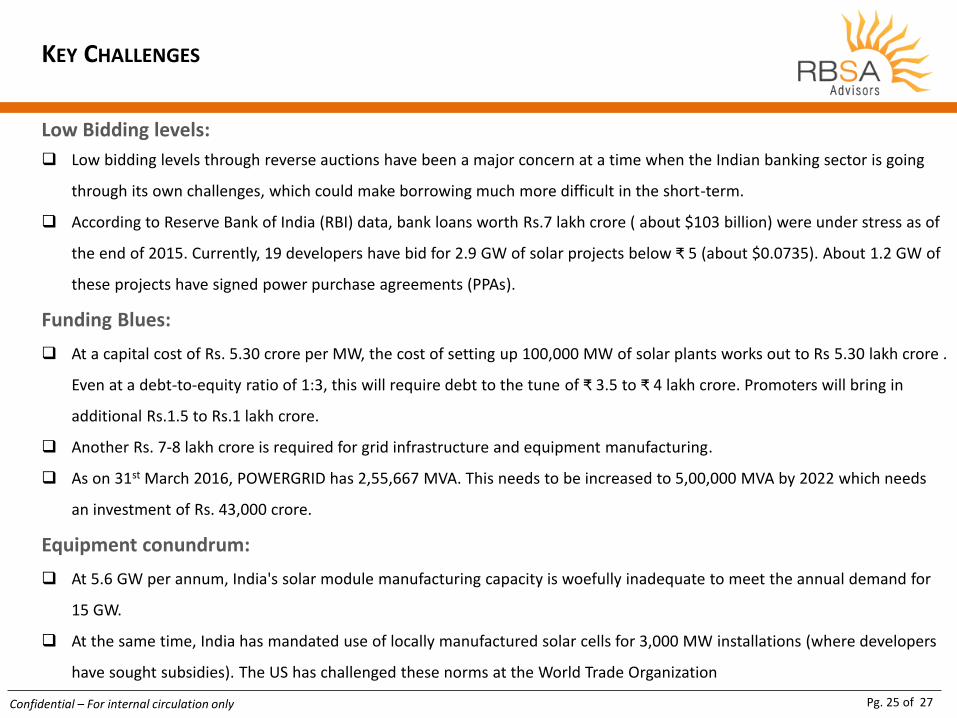
KEY CHALLENGES
Low Bidding levels:
Low bidding levels through reverse auctions have been a major concern at a time when the Indian banking sector is going
through its own challenges, which could make borrowing much more difficult in the short-term.
According to Reserve Bank of India (RBI) data, bank loans worth Rs.7 lakh crore ( about $103 billion) were under stress as of
the end of 2015. Currently, 19 developers have bid for 2.9 GW of solar projects below ₹ 5 (about $0.0735). About 1.2 GW of
these projects have signed power purchase agreements (PPAs).
Funding Blues:
At a capital cost of Rs. 5.30 crore per MW, the cost of setting up 100,000 MW of solar plants works out to Rs 5.30 lakh crore .
Even at a debt-to-equity ratio of 1:3, this will require debt to the tune of ₹ 3.5 to ₹ 4 lakh crore. Promoters will bring in
additional Rs.1.5 to Rs.1 lakh crore.
Another Rs. 7-8 lakh crore is required for grid infrastructure and equipment manufacturing.
As on 31st March 2016, POWERGRID has 2,55,667 MVA. This needs to be increased to 5,00,000 MVA by 2022 which needs
an investment of Rs. 43,000 crore.
Equipment conundrum:
At 5.6 GW per annum, India's solar module manufacturing capacity is woefully inadequate to meet the annual demand for
15 GW.
At the same time, India has mandated use of locally manufactured solar cells for 3,000 MW installations (where developers
have sought subsidies). The US has challenged these norms at the World Trade Organization
Pg. 26 of 27 Confidential – For internal circulation only
DISCLAIMER
The purpose of this Document is to provide interested parties with information that may be useful to them in understanding the content related to this document. This Document includes statements which may reflect various assumptions and assessments arrived at by the RBSA Analysts. Such assumptions, assessments and statements do not purport to contain all the information that each interested party may require. This Document may not be appropriate for all Persons, and it is not possible for the RBSA, its employees or advisors to consider the investment objectives, financial situation and particular needs of each party who reads or uses this Document. The assumptions, assessments, statements and information contained in the Document may not be complete, accurate, adequate or correct. Each interested party should, therefore, conduct its own investigations and analysis and should check the accuracy, adequacy, correctness, reliability and completeness of the assumptions, assessments, statements and information contained in this Document and obtain independent advice from appropriate sources. Information provided in this Document has been collated from several sources some of which may depend upon interpretation of Applicable Law. The information given is not intended to be an exhaustive account of statutory requirements and should not be regarded as complete. RBSA accepts no responsibility for the accuracy or otherwise for any statement contained in this document. RBSA, its employees and advisors make no representation or warranty and shall have no liability to any Person under any law, statute, rules or regulations or tort, principles of restitution or unjust enrichment or otherwise for any loss, damages, cost or expense which may arise from or be incurred or suffered on account of anything contained in this Document or otherwise, including the accuracy, adequacy, correctness, completeness or reliability of the Document and any assessment, assumption, statement or information contained therein or deemed to form part of this Document. RBSA also accepts no liability of any nature whether resulting from negligence or otherwise howsoever caused arising from
reliance of any person upon the statements contained in this Document.
Pg. 27 of 27 Confidential – For internal circulation only
CONTACT US
India Offices:
Mumbai Office:
21-23, T.V. Industrial Estate,
248-A, S.K. Ahire Marg,,
Off. Dr. A. B. Road, Worli,
Mumbai - 400 030
Tel : +91 22 6130 6000
Delhi Office :
9 C, Hansalaya Building,
15, Barakhambha Road,
Connaught place,
New Delhi -110 001
Tel : +91 11 2335 0635/37
Bangalore Office:
Unit No. 104, 1st Floor,
Sufiya Elite, #18, Cunningham Road,
Near Sigma Mall,
Bangalore - 560052
Tel : +91 80 4112 8593
Ahmedabad Office:
912, Venus Atlantis Corporate Park,
Anand Nagar Rd, Prahaladnagar,
Ahmedabad - 380 015
Tel : +91 79 4050 6000
Surat Office:
37, 3rd Floor, Meher Park,
‘A’, Athwa Gate, Ring Road,
Surat - 395 001
Tel : +91 97243 20636
Jaipur Office:
Karmayog, A-8, Metal Colony,
Sikar Road,
Jaipur - 302 023
Tel : +91 141 233 5892
Global Offices:
New York Office:
212 Eastgate Dr.
Monmouth Junction
NJ 08852 , USA
Tel: +1 813 751 6474
Email: [email protected]
Dubai Office :
ABCN, P. O. Box 183125
4th Floor, Block-B, Business Village, Deira
Dubai U.A.E.
Tel : +971 4 230 6084 / 85
Mob : +971 55 478 6464 / +971 52 617 3699
Email: [email protected]
Singapore Office:
17,Phillip Street ,
#05-01,Grand Building,
Singapore-048 695
Email: [email protected]
Management:
Rajeev R. Shah | Managing Director & CEO Manish Kaneria | Director Gautam Mirchandani | Director
+91 79 4050 6070 +91 79 4050 6090 +91 22 6130 6000
[email protected] [email protected] [email protected]
Research Analyst:
Nirav Rami Binu Nair Darshan Dave
+91 79 4050 6046 +91 79 4050 6044 +91 79 4050 6054