Embed Size (px)
Citation preview
Analysis, Modelling and Synthesis of
British, Australian and American Accents
Content
1- Introduction to Phonetics and Acoustics of Accents
2- Research Issues in Modelling Acoustics of Accents of English
3- Current Research Problems
4- Accent Analysis and Models
5- Accent Morphing
6- Audio Demo
1.1 Background
• Accents are acoustic manifestations of differences in pronunciation and
intonations by a community of people from a national, regional or a socio-
economic grouping.
• Accents are dynamic processes in that they evolve over time influenced by large-
scale immigration, socio-economic changes and cultural trends.
• Applications of accent models include:
- speech recognition,
- text to speech synthesis,
- voice editing,
- accent morphing in broadcasting and films,
- toys and computer games,
- accent coaching, education.
1. Introduction to Phonetics and Acoustics of Accents
• The importance of an accent feature depends on its distance from that of the‘standard’ or ‘received’ pronunciation and the frequency with which thatfeature occurs in the acoustics of speech.
1.2 Basic Structure of Accents
• Generally the structural differences between accents can be divided into two
broad parts:
(a) Differences in phonetic transcriptions.
(b) Differences in acoustics correlates and intonations of accents.
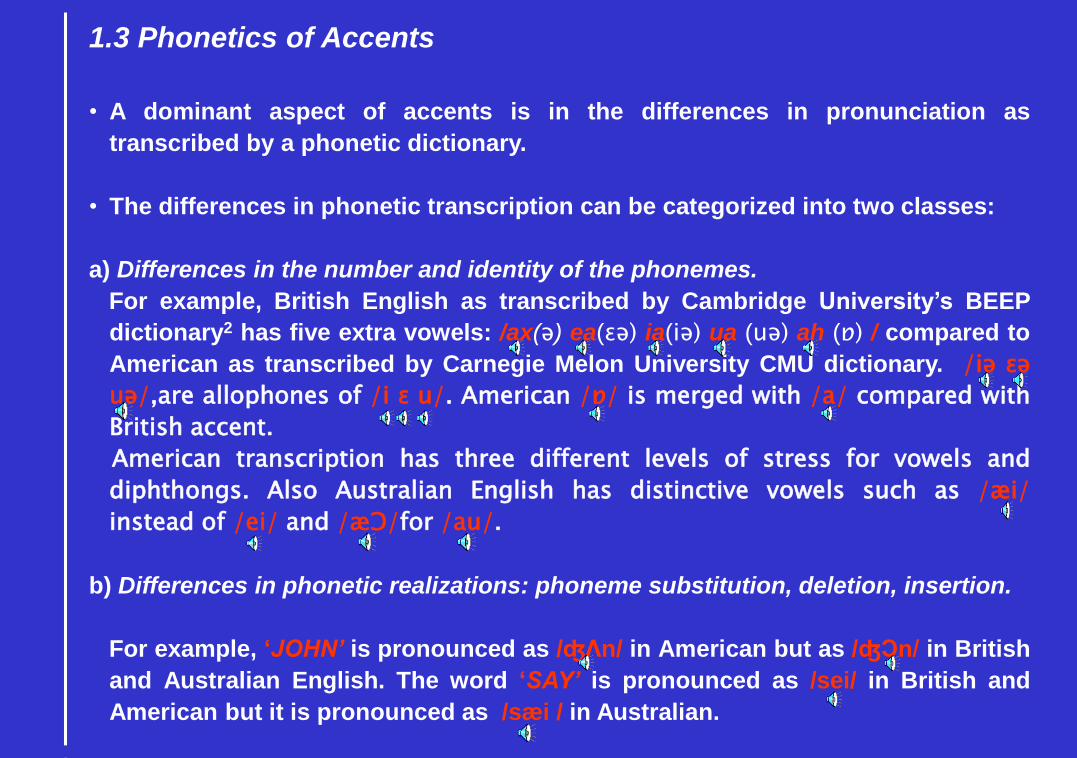
1.3 Phonetics of Accents
• A dominant aspect of accents is in the differences in pronunciation as
transcribed by a phonetic dictionary.
• The differences in phonetic transcription can be categorized into two classes:
a) Differences in the number and identity of the phonemes.
For example, British English as transcribed by Cambridge University’s BEEP
dictionary2 has five extra vowels: /ax(ə) ea(ɛə) ia(iə) ua (uə) ah (ɒ) / compared to
American as transcribed by Carnegie Melon University CMU dictionary. /iə ɛə
uə/,are allophones of /i ɛ u/. American /ɒ/ is merged with /a/ compared with
British accent.
American transcription has three different levels of stress for vowels and
diphthongs. Also Australian English has distinctive vowels such as /æi/
instead of /ei/ and /æƆ/for /au/.
b) Differences in phonetic realizations: phoneme substitution, deletion, insertion.
For example, ‘JOHN’ is pronounced as /ʤΛn/ in American but as /ʤƆn/ in British
and Australian English. The word ‘SAY’ is pronounced as /sei/ in British and
American but it is pronounced as /sæi / in Australian.
1.4 Acoustics of Accents
• Perceived acoustics differences of accents are due to the differences, during the
production of sound, in the configurations, positioning, tension and movement
of laryngeal and supra-laryngeal articulatory parameters, namely vocal folds,
vocal tract, tongue and lips
• Four aspects of acoustic correlates of accents are considered essential for
accent models and accent synthesis. These are:
(a) Formants (i.e. frequency of vocal tract resonance) correlates of accents,
including:
(i) Formant trajectories Fkj(t), k is the formant index and j is phoneme index.
(ii) Timing and magnitude of the formant target point(s) in formant space for
each phonetic unit.
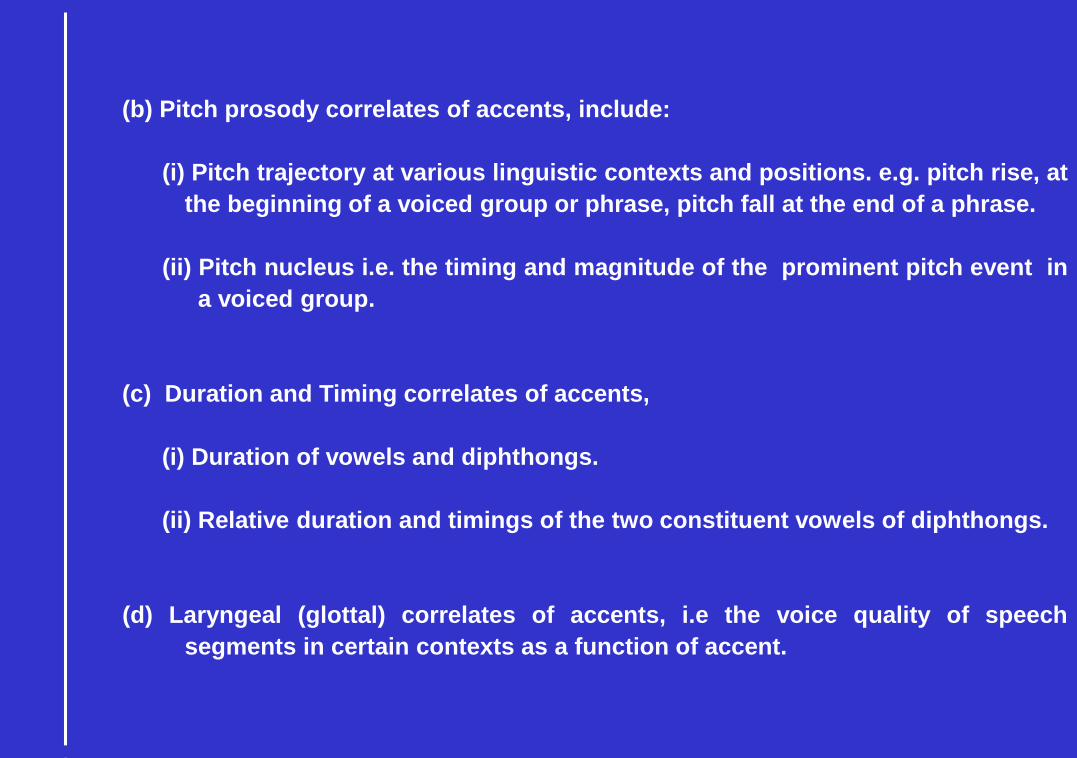
(b) Pitch prosody correlates of accents, include:
(i) Pitch trajectory at various linguistic contexts and positions. e.g. pitch rise, at
the beginning of a voiced group or phrase, pitch fall at the end of a phrase.
(ii) Pitch nucleus i.e. the timing and magnitude of the prominent pitch event in
a voiced group.
(c) Duration and Timing correlates of accents,
(i) Duration of vowels and diphthongs.
(ii) Relative duration and timings of the two constituent vowels of diphthongs.
(d) Laryngeal (glottal) correlates of accents, i.e the voice quality of speech
segments in certain contexts as a function of accent.
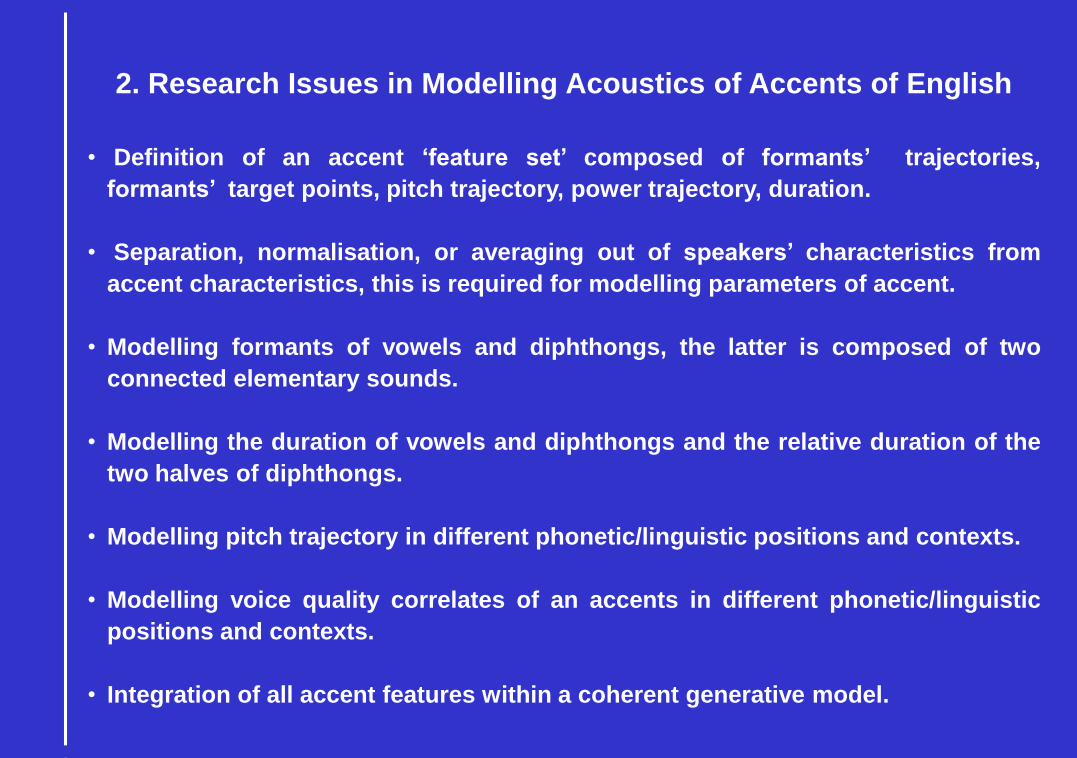
2. Research Issues in Modelling Acoustics of Accents of English
• Definition of an accent ‘feature set’ composed of formants’ trajectories,
formants’ target points, pitch trajectory, power trajectory, duration.
• Separation, normalisation, or averaging out of speakers’ characteristics from
accent characteristics, this is required for modelling parameters of accent.
• Modelling formants of vowels and diphthongs, the latter is composed of two
connected elementary sounds.
• Modelling the duration of vowels and diphthongs and the relative duration of the
two halves of diphthongs.
• Modelling pitch trajectory in different phonetic/linguistic positions and contexts.
• Modelling voice quality correlates of an accents in different phonetic/linguistic
positions and contexts.
• Integration of all accent features within a coherent generative model.
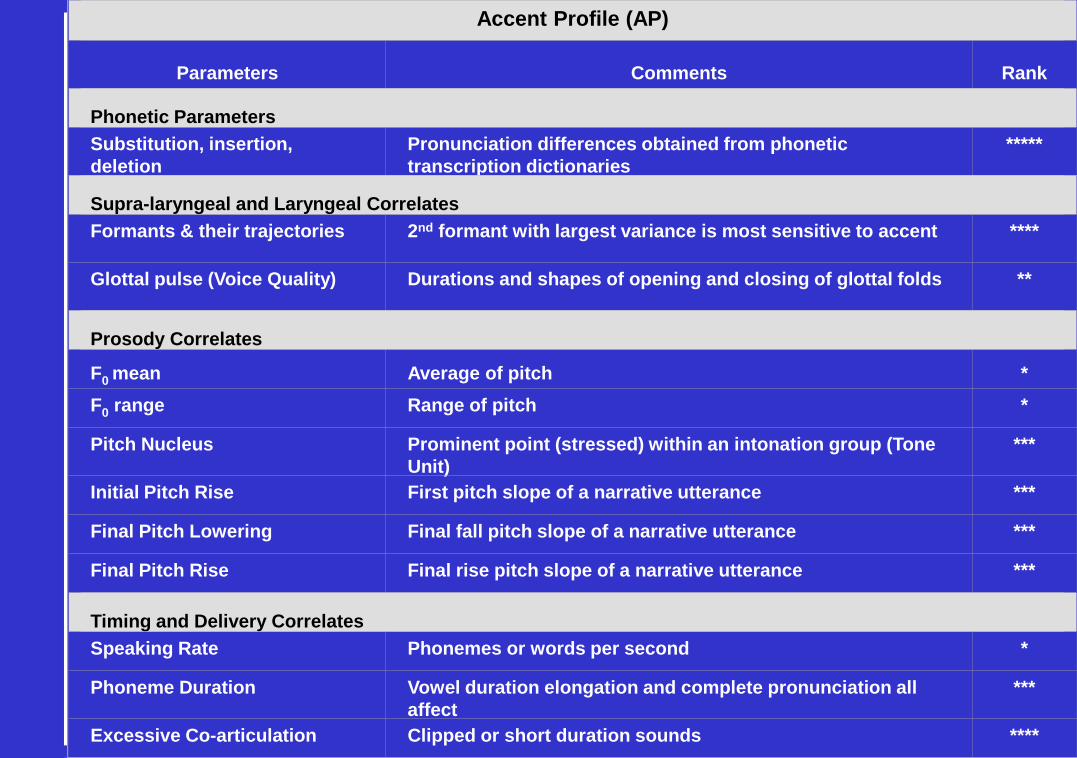
Accent Profile (AP)
Parameters Comments Rank
Phonetic Parameters
Substitution, insertion,
deletion
Pronunciation differences obtained from phonetic
transcription dictionaries
*****
Supra-laryngeal and Laryngeal Correlates
Formants & their trajectories 2nd formant with largest variance is most sensitive to accent ****
Glottal pulse (Voice Quality) Durations and shapes of opening and closing of glottal folds **
Prosody Correlates
F0 mean Average of pitch *
F0 range Range of pitch *
Pitch Nucleus Prominent point (stressed) within an intonation group (Tone
Unit)
***
Initial Pitch Rise First pitch slope of a narrative utterance ***
Final Pitch Lowering Final fall pitch slope of a narrative utterance ***
Final Pitch Rise Final rise pitch slope of a narrative utterance ***
Timing and Delivery Correlates
Speaking Rate Phonemes or words per second *
Phoneme Duration Vowel duration elongation and complete pronunciation all
affect
***
Excessive Co-articulation Clipped or short duration sounds ****
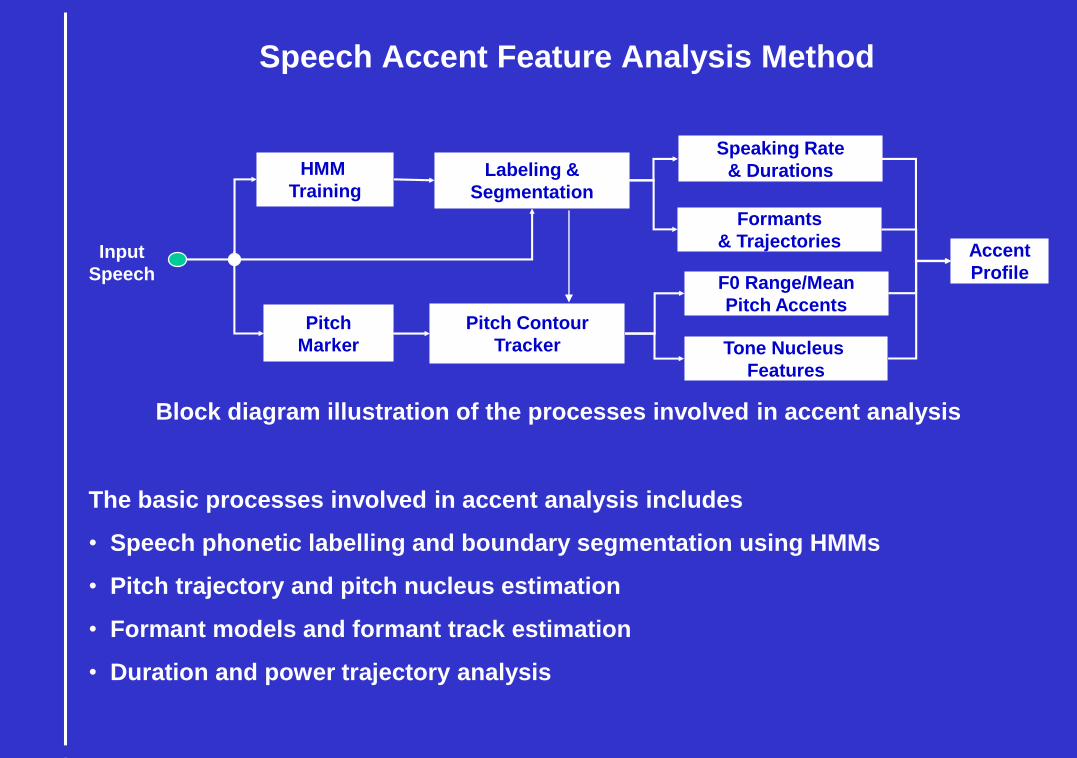
Speech Accent Feature Analysis Method
The basic processes involved in accent analysis includes
• Speech phonetic labelling and boundary segmentation using HMMs
• Pitch trajectory and pitch nucleus estimation
• Formant models and formant track estimation
• Duration and power trajectory analysis
HMM
TrainingLabeling &
Segmentation
Formants
& Trajectories
Pitch Contour
Tracker
Pitch
Marker Tone Nucleus
Features
F0 Range/Mean
Pitch Accents
Accent
Profile
Speaking Rate
& Durations
Input
Speech
Block diagram illustration of the processes involved in accent analysis
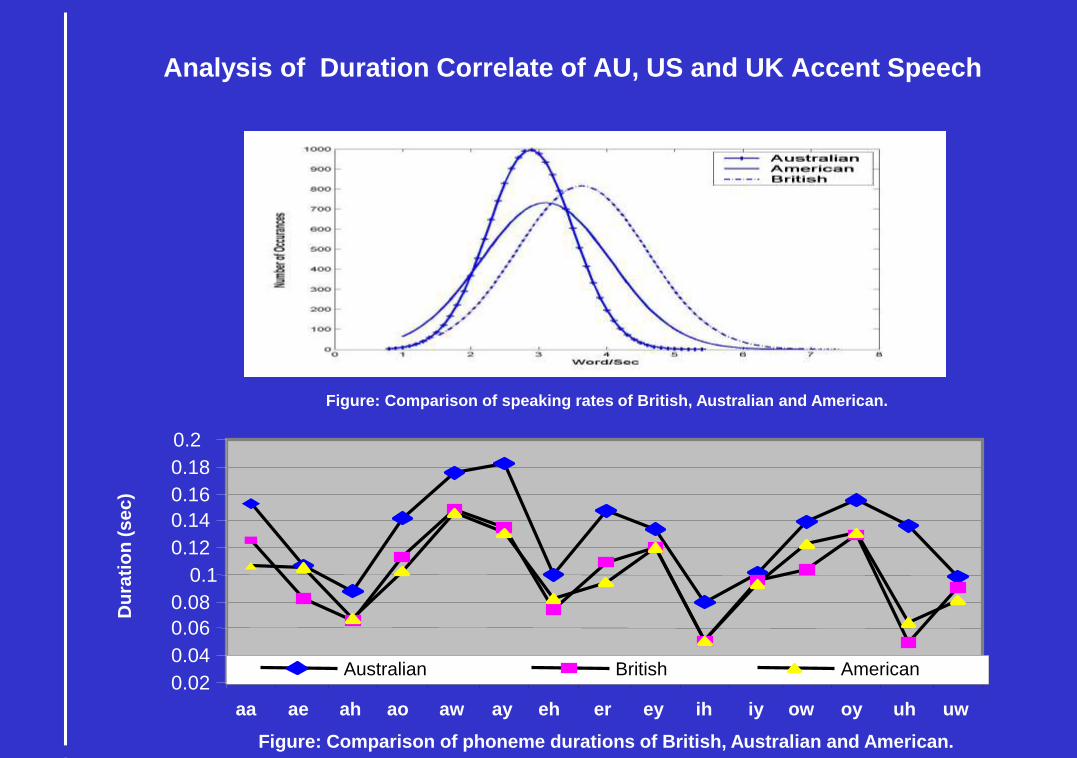
Analysis of Duration Correlate of AU, US and UK Accent Speech
Figure: Comparison of speaking rates of British, Australian and American.
Figure: Comparison of phoneme durations of British, Australian and American.
0.02
0.04
0.06
0.08
0.1
0.12
0.14
0.16
0.18
0.2
aa ae ah ao aw ay eh er ey ih iy ow oy uh uw
Australian British American
Du
rati
on
(s
ec
)
Model
Input
British
Model
American
Model
Australian
Model
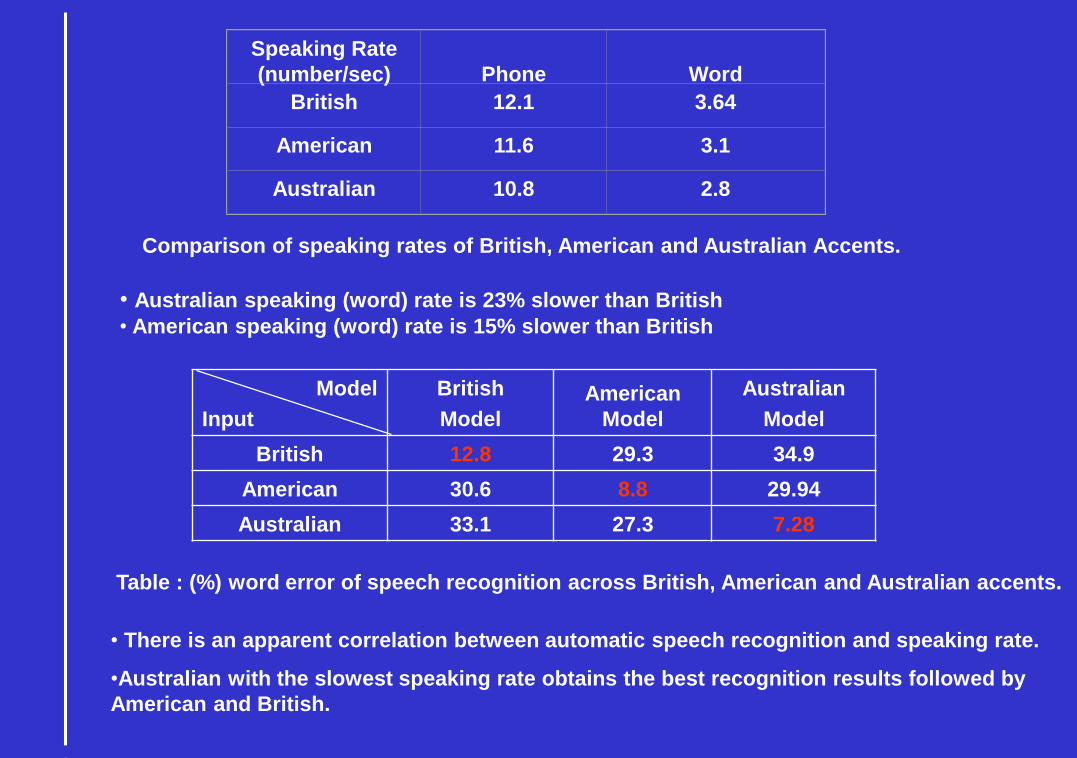
British 12.8 29.3 34.9
American 30.6 8.8 29.94
Australian 33.1 27.3 7.28
Table : (%) word error of speech recognition across British, American and Australian accents.
• Australian speaking (word) rate is 23% slower than British
• American speaking (word) rate is 15% slower than British
Comparison of speaking rates of British, American and Australian Accents.
Speaking Rate
(number/sec) Phone Word
British 12.1 3.64
American 11.6 3.1
Australian 10.8 2.8
• There is an apparent correlation between automatic speech recognition and speaking rate.
•Australian with the slowest speaking rate obtains the best recognition results followed by
American and British.
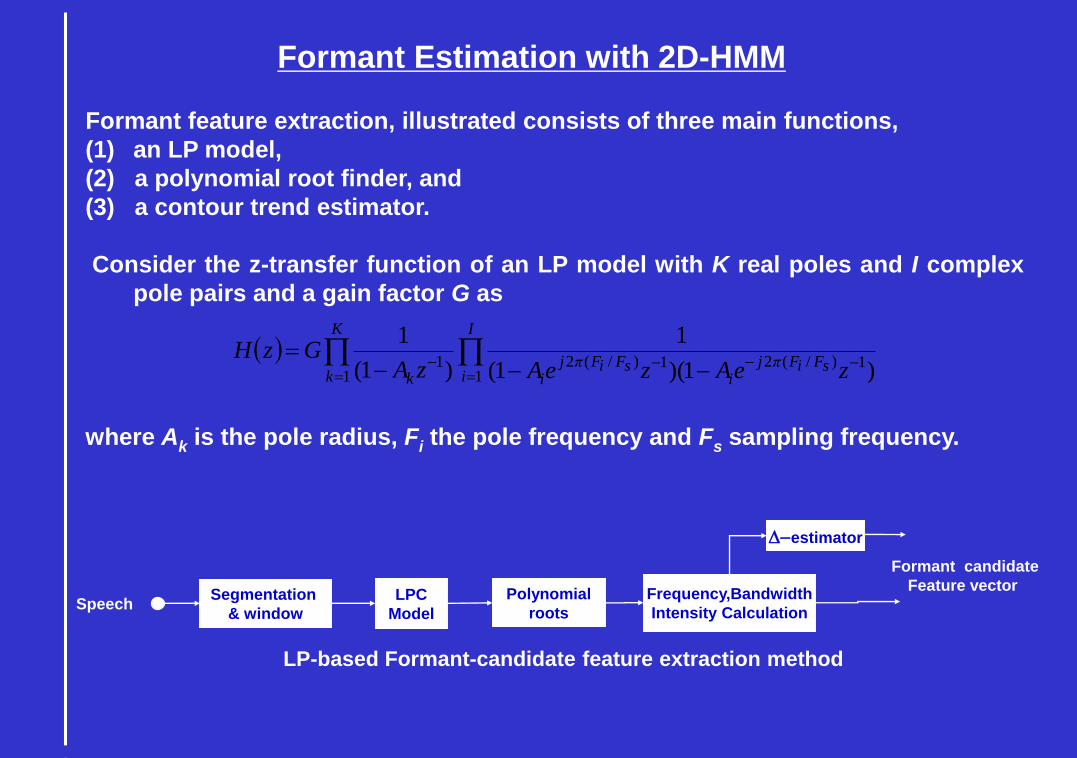
Formant Estimation with 2D-HMM
Segmentation
& window
LPC
Model
Polynomial
roots
LP-based Formant-candidate feature extraction method
Formant candidate
Feature vector Speech
Frequency,Bandwidth
Intensity Calculation
Formant feature extraction, illustrated consists of three main functions,
(1) an LP model,
(2) a polynomial root finder, and
(3) a contour trend estimator.
Consider the z-transfer function of an LP model with K real poles and I complex
pole pairs and a gain factor G as
where Ak is the pole radius, Fi the pole frequency and Fs sampling frequency.
I
isFiFπj
isFiFπj
i
K
k k zeAzeAzAGzH
11)/(21)/(2
11
)1)(1(
1
)1(
1
Destimator
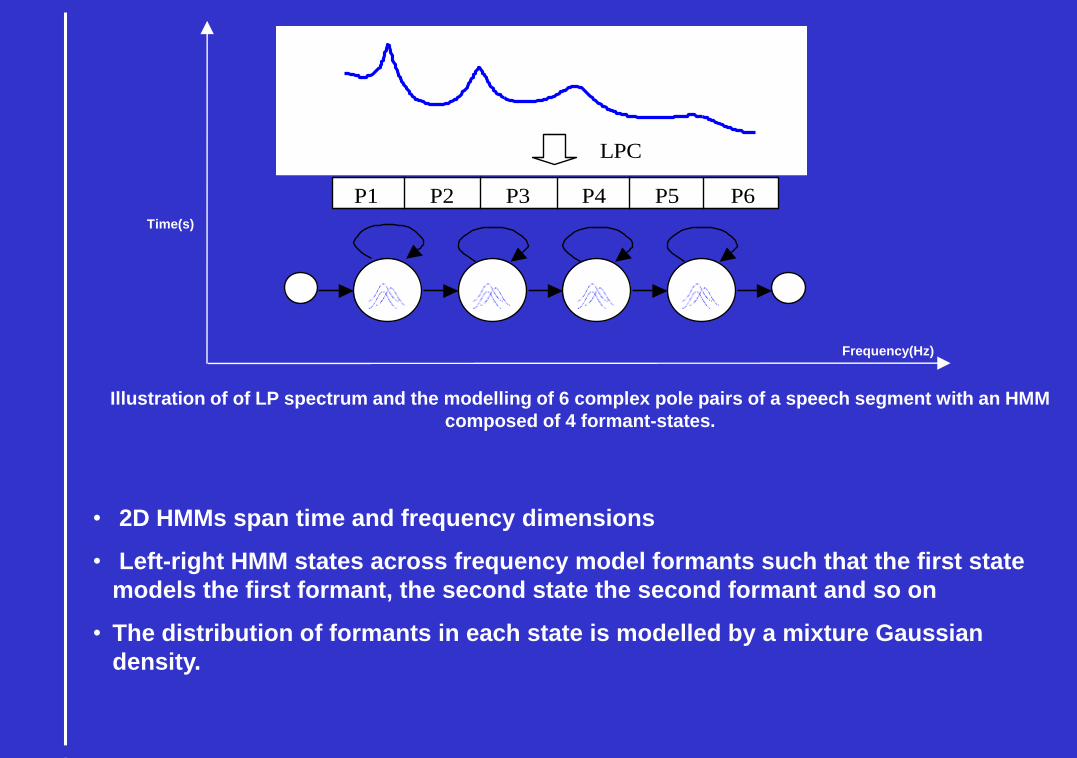
LPC
P1 P2 P3 P4 P5 P6
Frequency(Hz)
Time(s)
Illustration of of LP spectrum and the modelling of 6 complex pole pairs of a speech segment with an HMM
composed of 4 formant-states.
• 2D HMMs span time and frequency dimensions
• Left-right HMM states across frequency model formants such that the first state
models the first formant, the second state the second formant and so on
• The distribution of formants in each state is modelled by a mixture Gaussian
density.
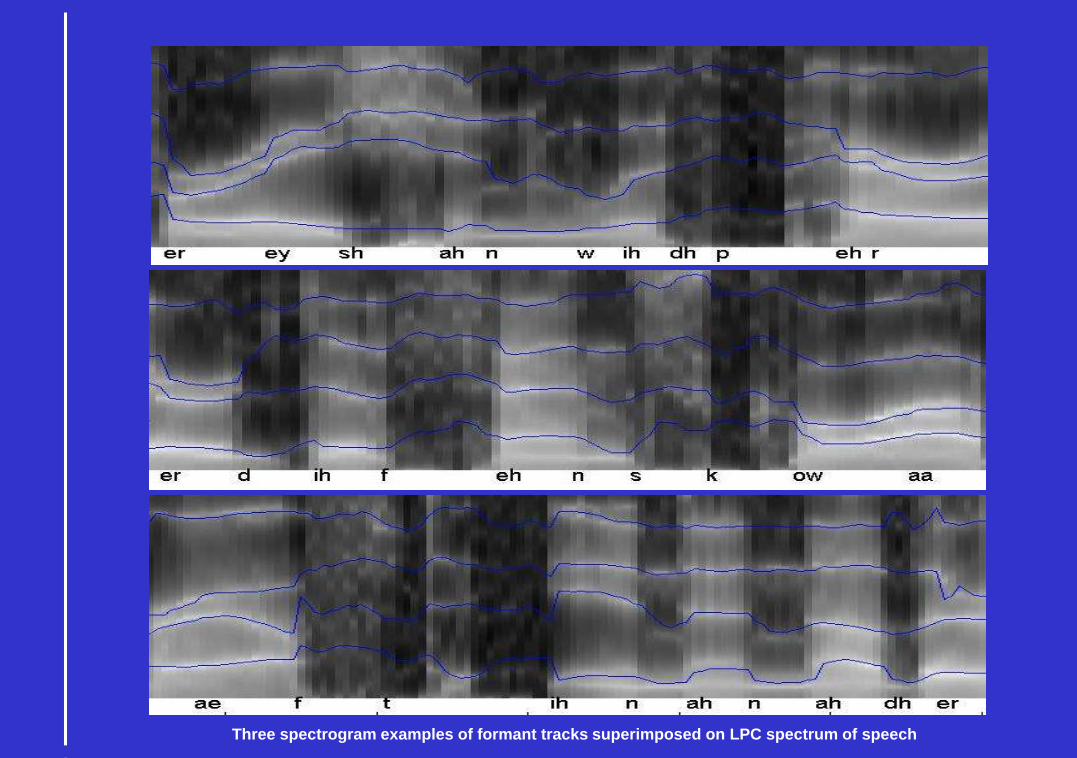
Three spectrogram examples of formant tracks superimposed on LPC spectrum of speech
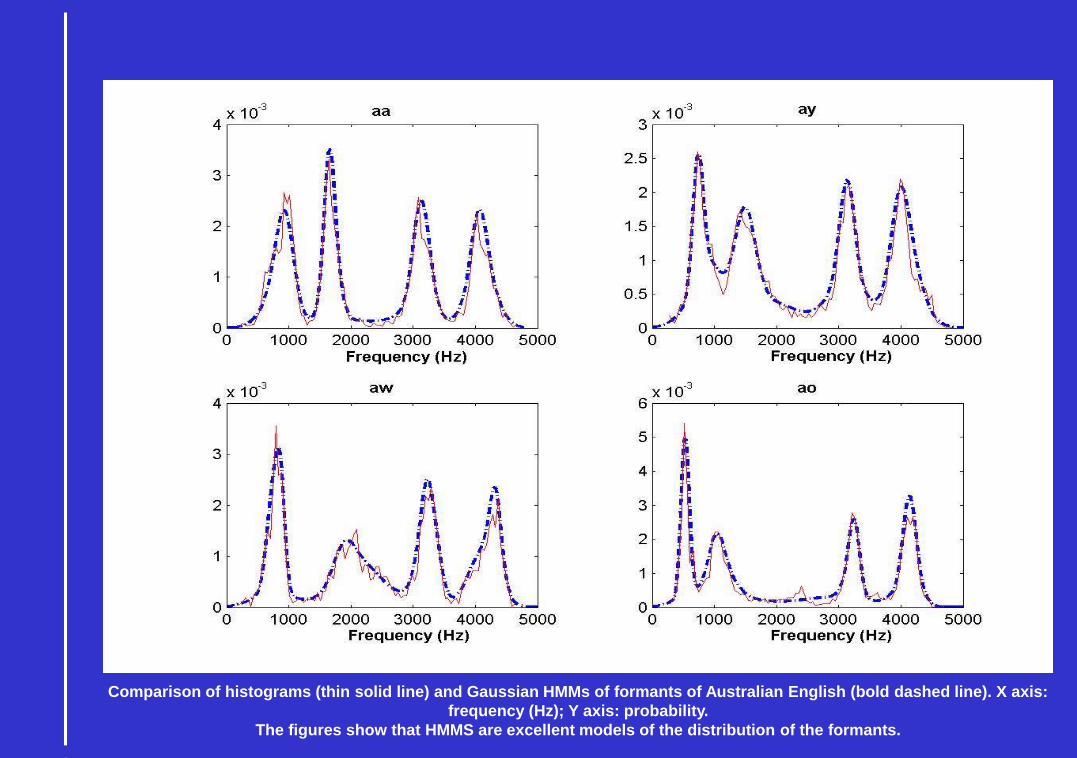
Comparison of histograms (thin solid line) and Gaussian HMMs of formants of Australian English (bold dashed line). X axis:
frequency (Hz); Y axis: probability.
The figures show that HMMS are excellent models of the distribution of the formants.
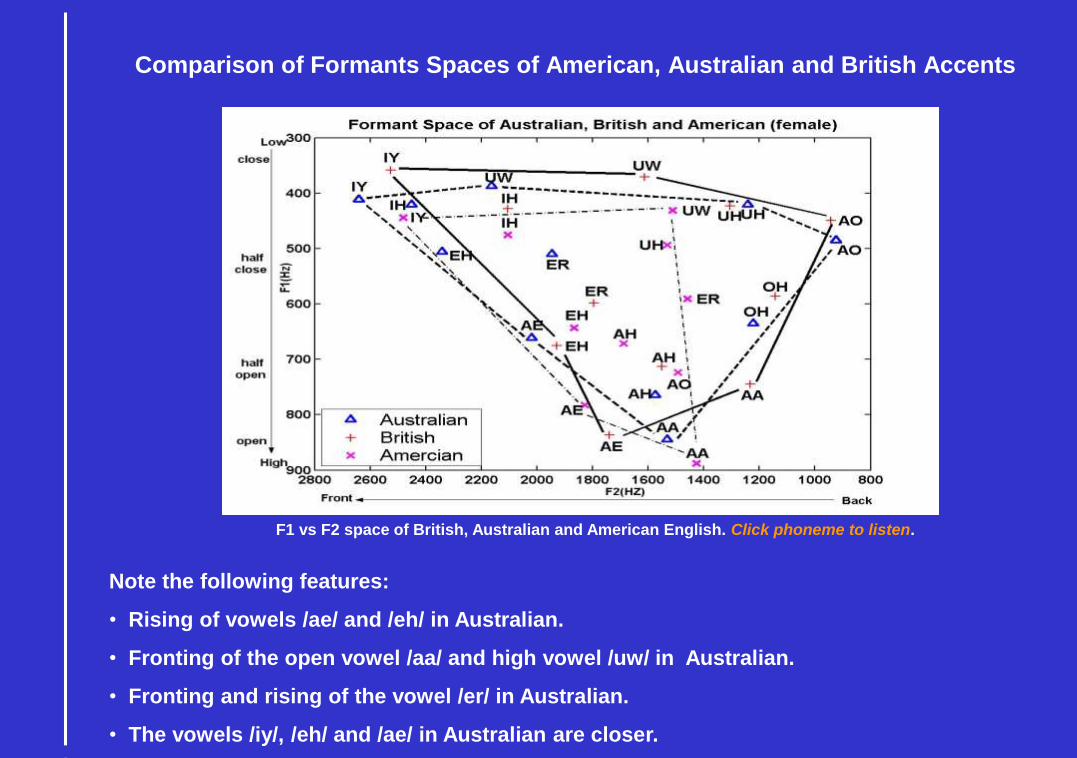
Comparison of Formants Spaces of American, Australian and British Accents
Note the following features:
• Rising of vowels /ae/ and /eh/ in Australian.
• Fronting of the open vowel /aa/ and high vowel /uw/ in Australian.
• Fronting and rising of the vowel /er/ in Australian.
• The vowels /iy/, /eh/ and /ae/ in Australian are closer.
F1 vs F2 space of British, Australian and American English. Click phoneme to listen.
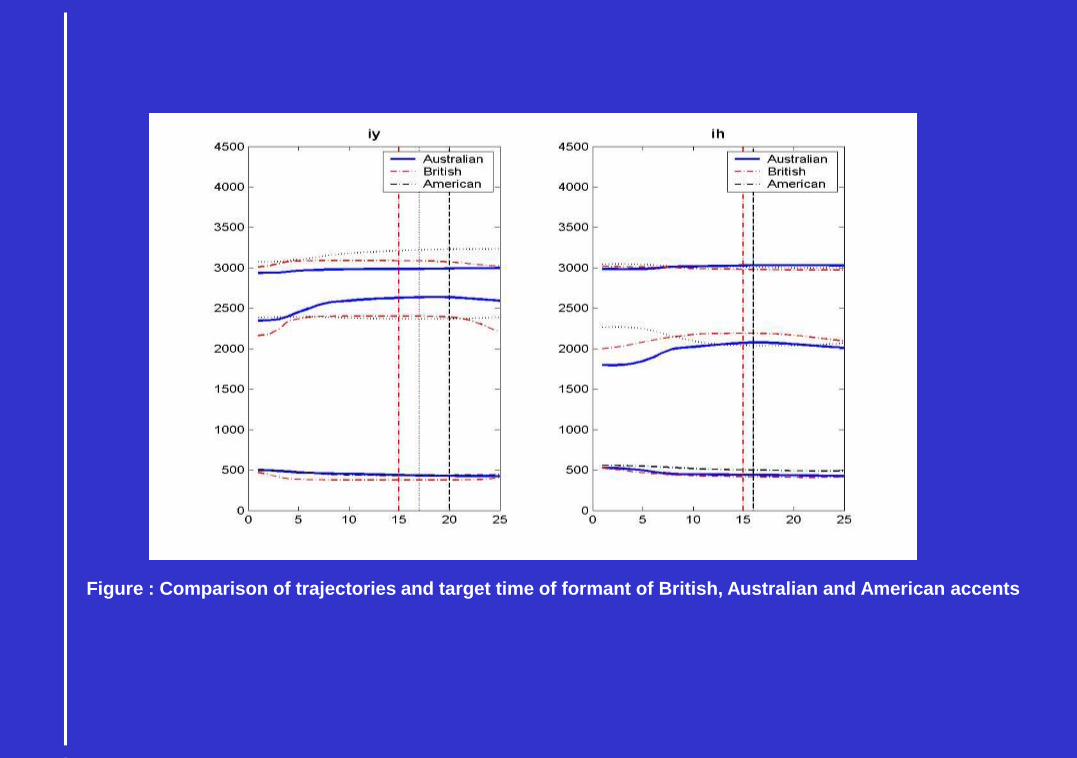
Figure : Comparison of trajectories and target time of formant of British, Australian and American accents
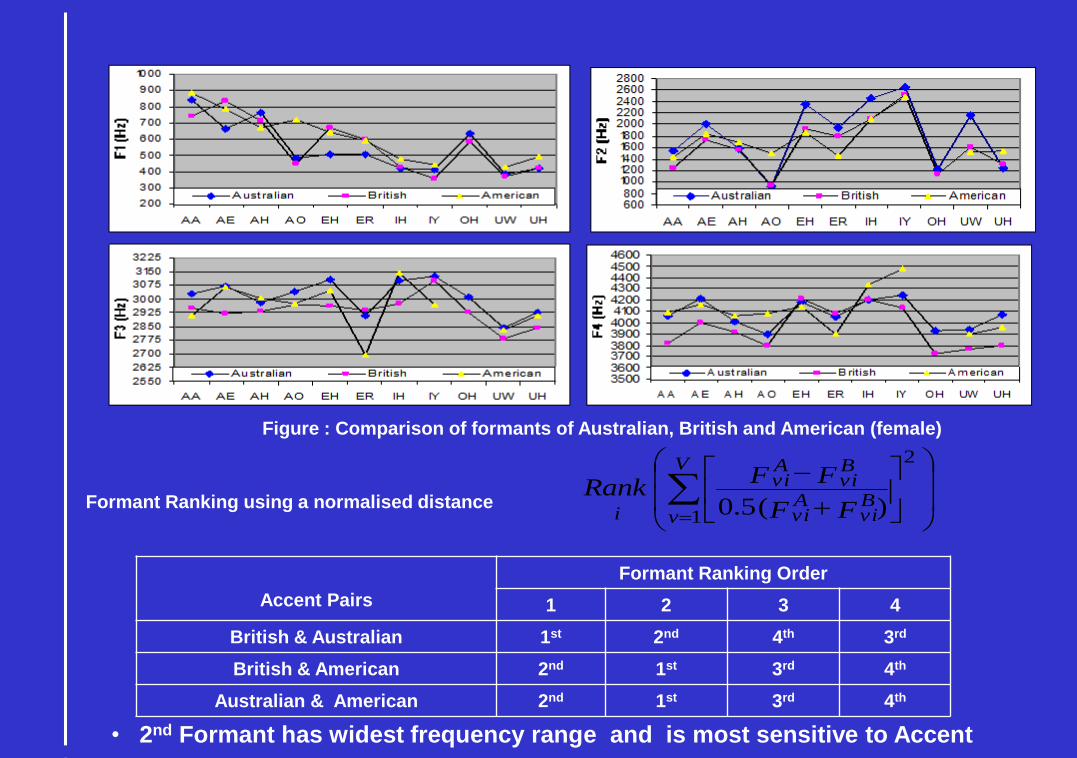
Accent Pairs
Formant Ranking Order
1 2 3 4
British & Australian 1st 2nd 4th 3rd
British & American 2nd 1st 3rd 4th
Australian & American 2nd 1st 3rd 4th
2
1 )(5.0
V
vBvi
Avi
Bvi
Avi
i FF
FFRank
• 2nd Formant has widest frequency range and is most sensitive to Accent
Formant Ranking using a normalised distance
Figure : Comparison of formants of Australian, British and American (female)
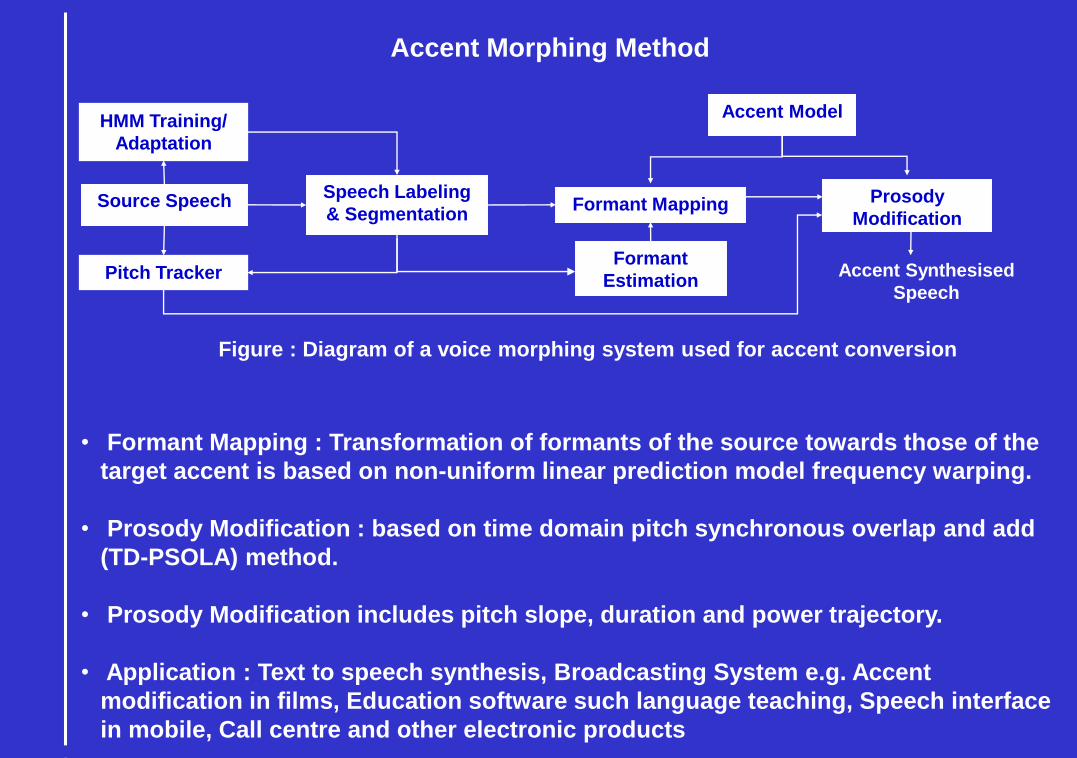
Accent Morphing Method
Figure : Diagram of a voice morphing system used for accent conversion
Source SpeechSpeech Labeling
& SegmentationFormant Mapping
Formant
Estimation
Prosody
Modification
Accent ModelHMM Training/
Adaptation
Accent Synthesised
Speech
• Formant Mapping : Transformation of formants of the source towards those of the
target accent is based on non-uniform linear prediction model frequency warping.
• Prosody Modification : based on time domain pitch synchronous overlap and add
(TD-PSOLA) method.
• Prosody Modification includes pitch slope, duration and power trajectory.
• Application : Text to speech synthesis, Broadcasting System e.g. Accent
modification in films, Education software such language teaching, Speech interface
in mobile, Call centre and other electronic products
Pitch Tracker
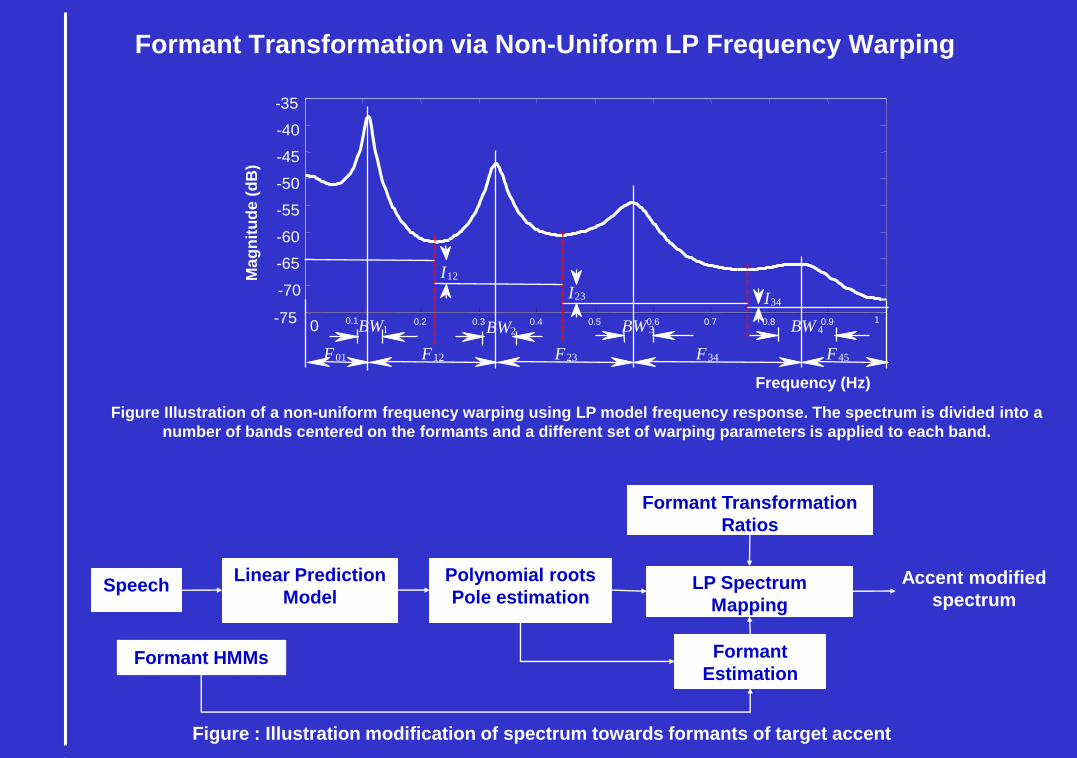
Formant Transformation via Non-Uniform LP Frequency Warping
Figure Illustration of a non-uniform frequency warping using LP model frequency response. The spectrum is divided into a
number of bands centered on the formants and a different set of warping parameters is applied to each band.
F01
0 0.1 0.2 0.3 0.4 0.5 0.6 0.7 0.8 0.9 1-75
-70
-65
-60
-55
-50
-45
-40
-35
F12 F23 F34 F45
BW1 BW2 BW 3 BW 4
I12
I23 I34
Ma
gn
itu
de
(d
B)
Frequency (Hz)
Figure : Illustration modification of spectrum towards formants of target accent
SpeechLinear Prediction
ModelLP Spectrum
Mapping
Formant
Estimation
Formant Transformation
Ratios
Accent modified
spectrum
Formant HMMs
Polynomial roots
Pole estimation
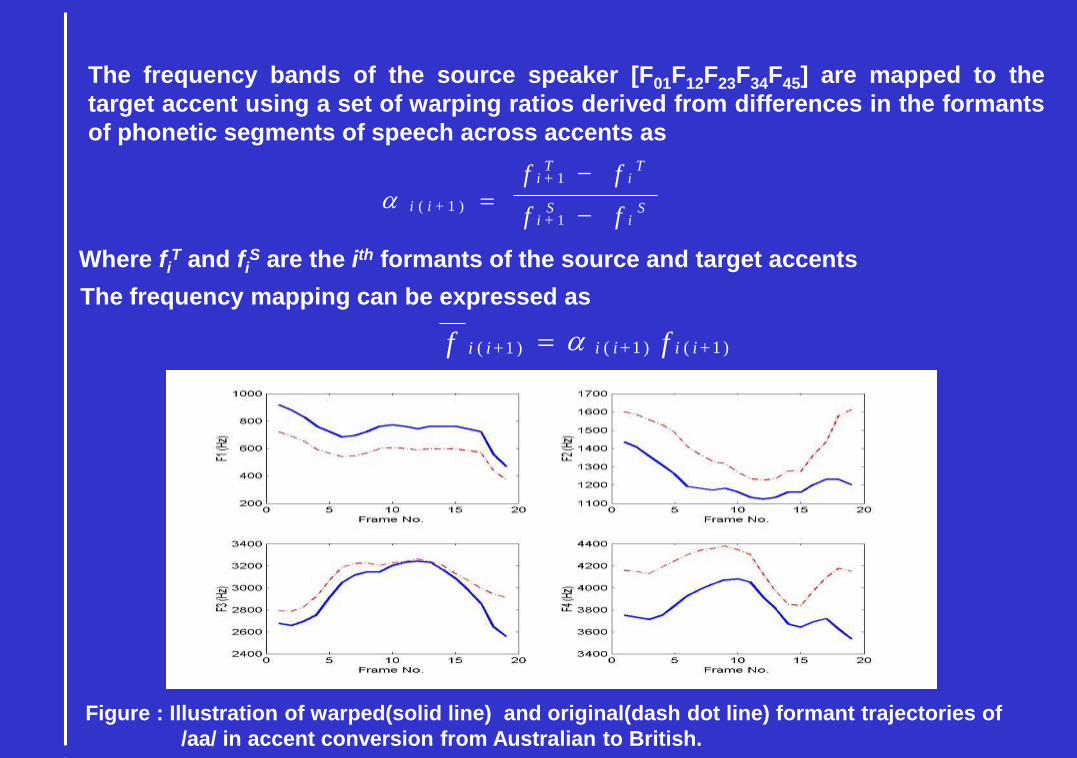
The frequency bands of the source speaker [F01F12F23F34F45] are mapped to the
target accent using a set of warping ratios derived from differences in the formants
of phonetic segments of speech across accents as
)1()1()1( iiiiii ff a
Si
Si
Ti
Ti
iiff
ff
1
1
)1(a
Where fiT and fi
S are the ith formants of the source and target accents
The frequency mapping can be expressed as
Figure : Illustration of warped(solid line) and original(dash dot line) formant trajectories of
/aa/ in accent conversion from Australian to British.
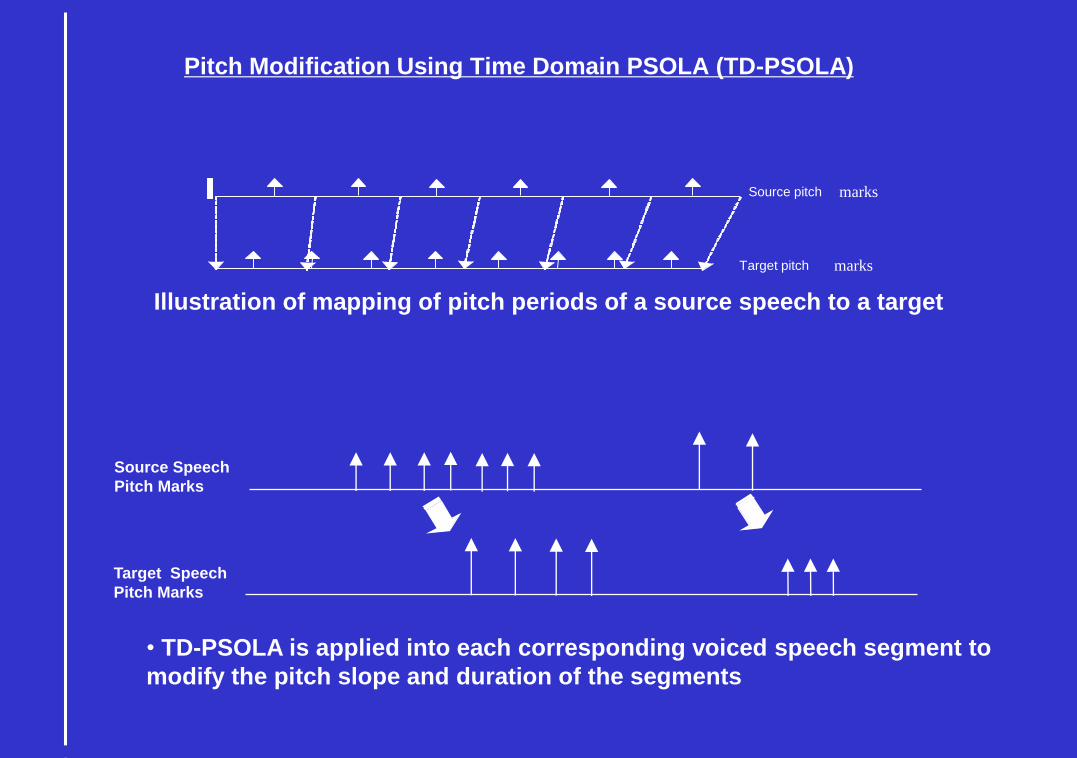
Pitch Modification Using Time Domain PSOLA (TD-PSOLA)
Source pitch marks
Target pitch marks
• TD-PSOLA is applied into each corresponding voiced speech segment to
modify the pitch slope and duration of the segments
Source Speech
Pitch Marks
Target Speech
Pitch Marks
Illustration of mapping of pitch periods of a source speech to a target
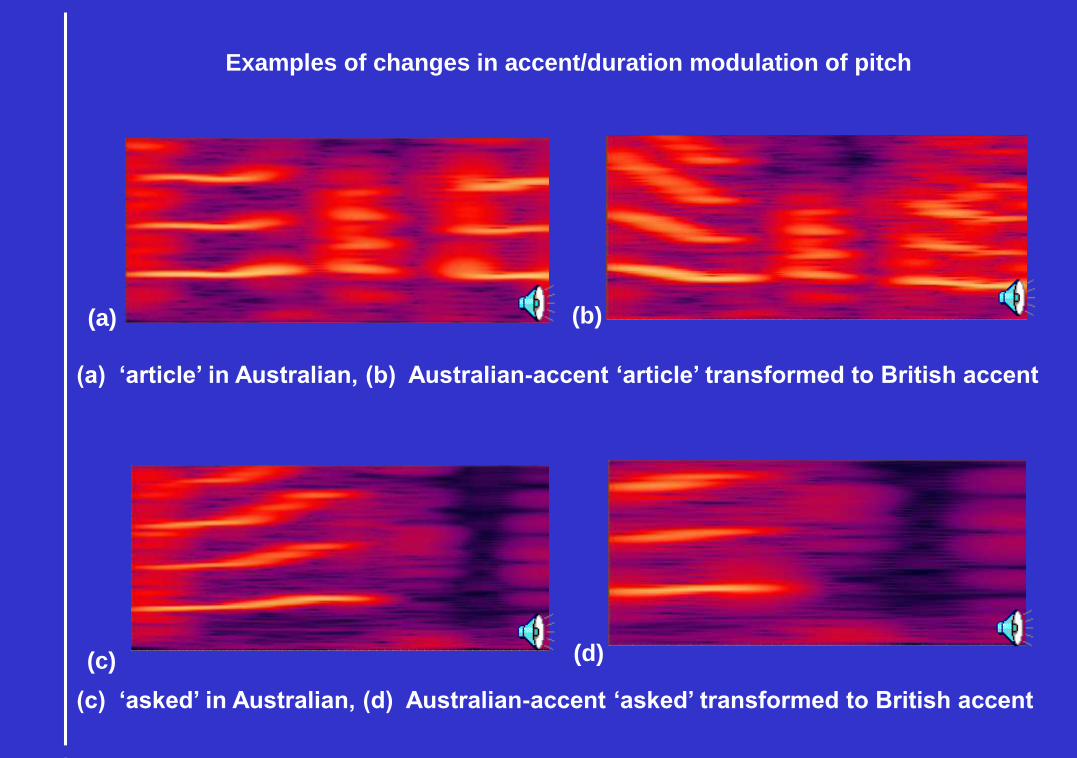
Examples of changes in accent/duration modulation of pitch
(a) ‘article’ in Australian, (b) Australian-accent ‘article’ transformed to British accent
(c) ‘asked’ in Australian, (d) Australian-accent ‘asked’ transformed to British accent
(a) (b)
(c) (d)
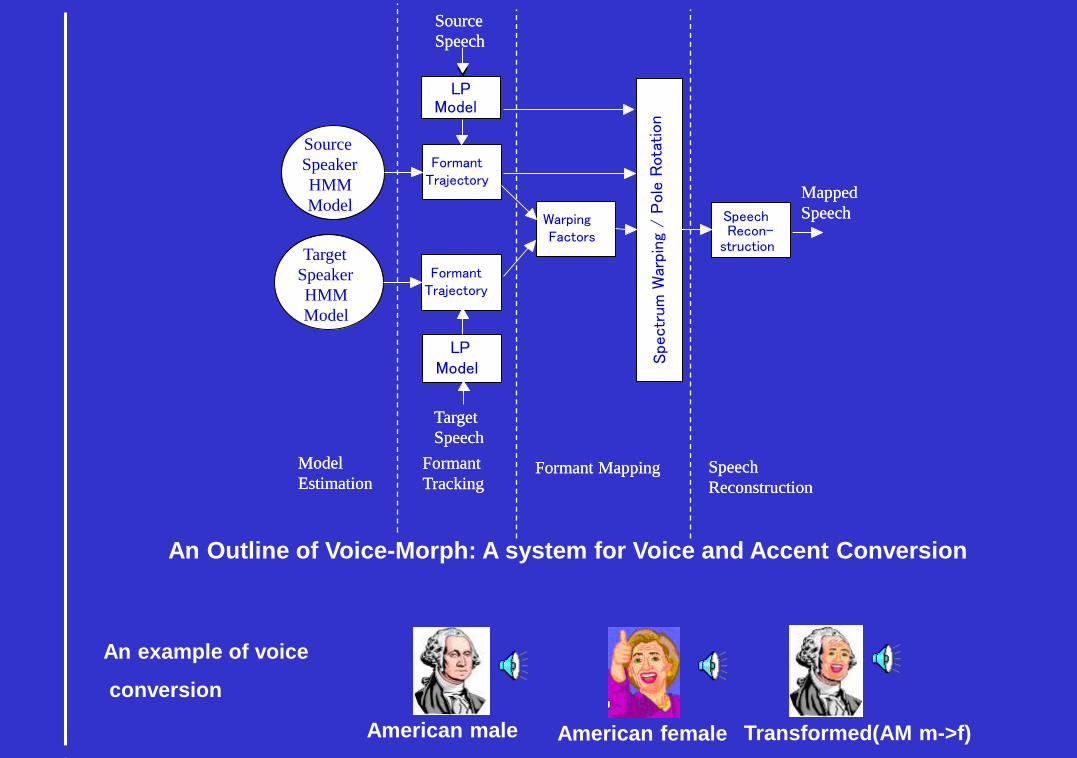
Model
Estimation
LPModel
FormantTrajectory
Source
Speech
Target
Speech
LPModel
FormantTrajectory
Mapped
SpeechWarping Factors
Target
Speaker
HMM
Model
Source
Speaker
HMM
Model
Formant
TrackingFormant Mapping
SpeechRecon
struction
Speech
Reconstruction
Model
Estimation
LPModel
FormantTrajectory
Source
Speech
Target
Speech
LPModel
FormantTrajectory
Mapped
SpeechWarping Factors
Target
Speaker
HMM
Model
Source
Speaker
HMM
Model
Formant
TrackingFormant Mapping
SpeechRecon-
struction
Speech
Reconstruction
Transformed(AM m->f)American male American female
An Outline of Voice-Morph: A system for Voice and Accent Conversion
An example of voice
conversion
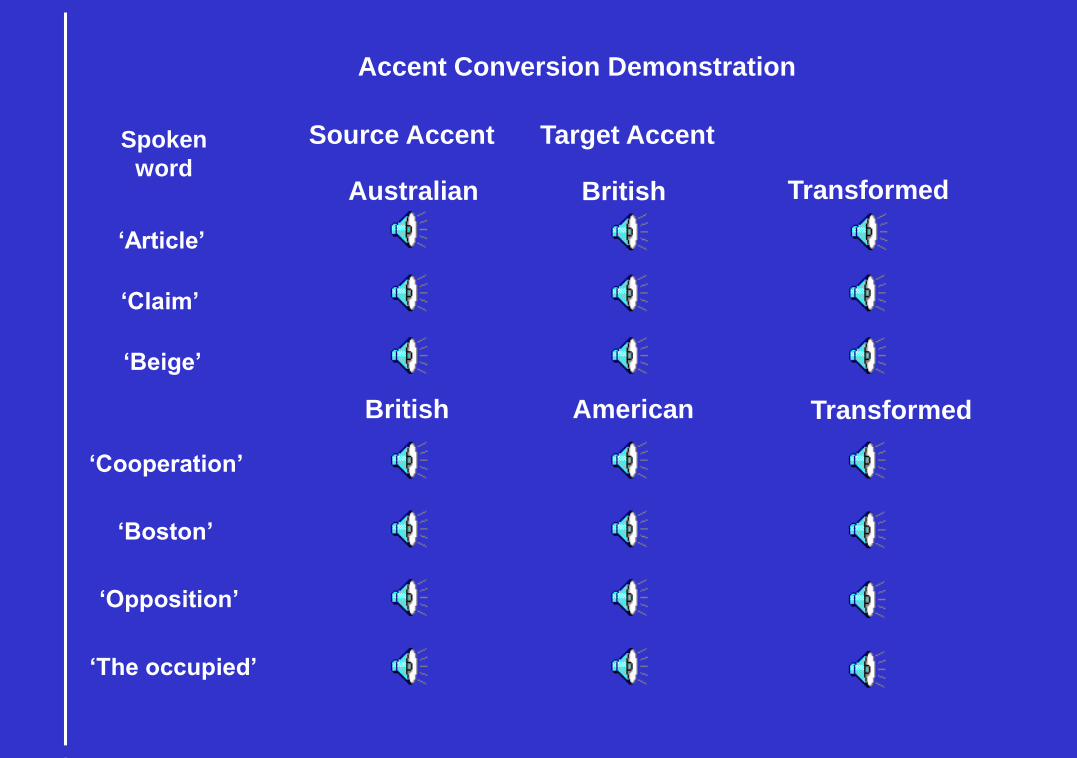
Accent Conversion Demonstration
Australian British Transformed
British American Transformed
‘Article’
‘Claim’
‘Cooperation’
‘Beige’
Source Accent Target AccentSpoken
word
‘Boston’
‘Opposition’
‘The occupied’

The End