Embed Size (px)
Citation preview

Survey on Mobile Phones and
their defects
JAI AWATRAMANI & ALIASGAR NAVAGHARWALA
MBA(Tech.), Telecom, Class of 2004-09
NMIMS University
The study result is intended to give understanding of the Indian Mobile Phone Market in terms of the defects that
occur in Mobile Phones, Customer Satisfaction to complaint handling and Customer Loyalty.

Executive SummaryIndia and the Indian Telecommunications Market
•The Second fastest growing economy.•The fastest growing telecom sector of the world. Teledensity of more than 28%. •300 million mobile connections
Mobile phone production growth estimation in India
•CAGR of 28.3 per cent from 2006 to 2011,
totalling 107 million handsets by 2010.
•Revenues CAGR of 26.6 per cent from 2006
to 2011, touching US$ 13.6 billionThe Stretch of Mobile Phone
• Teenager to 75 year old
• Urban to Rural
• Multimedia Rich to Plain vanilla
• Rs.1500 to Rs.50,000
• More than 10 brands for options
• More than 150 options
• Available Everywhere
• Highly Marketed
• Prices Declining by the day
• Niche Players also starting to gain increasing market share

Executive Summary
The Survey
• Need for the Research
• In the Month of October-November a spate of incidents among friends with regard to defects occurring with their Mobile Phones prompted us to discuss the issue
• A deeper observation revealed that there are many defects and there is a decreasing level customer care by service centers to defects complaints, leading to frustrations among the user
• The two researchers being from the field of telecom further generated huge curiosity to do a sample survey study and see the actual statistics prevalent.
Survey Details
• Sample Size – 309
• Duration – Nov’07 – February’08
• Total Cost of phones measured –30 lakhs
What did we measure?
• The Mobile Phone Manufacturer
• The Price of Mobile Phone
• The Type of Defect
• Rectification of Defect?
• Days required for Rectification
• Location of Rectification
• Customer Satisfaction to Complaint handling
• Satisfaction to Current working of Phone
• Changeover Chance

The Results28% of Phones sold in market have
manufacturing defect
Proportion of Defective Phones Due to Internal Problem
occuring within 1 year from the date of Purchase from the total
sample
87, 28%
222, 72%
Yes
No
Average time To get phone repaired – 16 days
Average time To get phone replaced –>30 days
38% of the people who visited authorized service center were not satisfied with the way their complaint was
23, 38%
38, 62%222, 72%complaint was handled
20% are of total respondents are not satisfied with current
working of their Phone
61, 20%
248, 80%
108, 35%
35, 11%
166, 54%
Maybe
No
Yes
Would you like to purchase the phone from the same company again
����

Mobile Phones and their Defects
Research problem• A study of defects in Mobile Phones, the rectification process and its effect on Customer Loyalty.
OBJECTIVEOBJECTIVE• To study the percentage of defective phones in the market
• To study the time taken for rectification.• To study customer satisfaction towards rectification process and Customer loyalty towards the handset manufactures.

VARIABLE CLASSIFICATION
• Dependent Variable: Defects
• Intermediate Variable: Rectification Process
• Independent Variable: Customer Satisfaction & Customer Loyalty
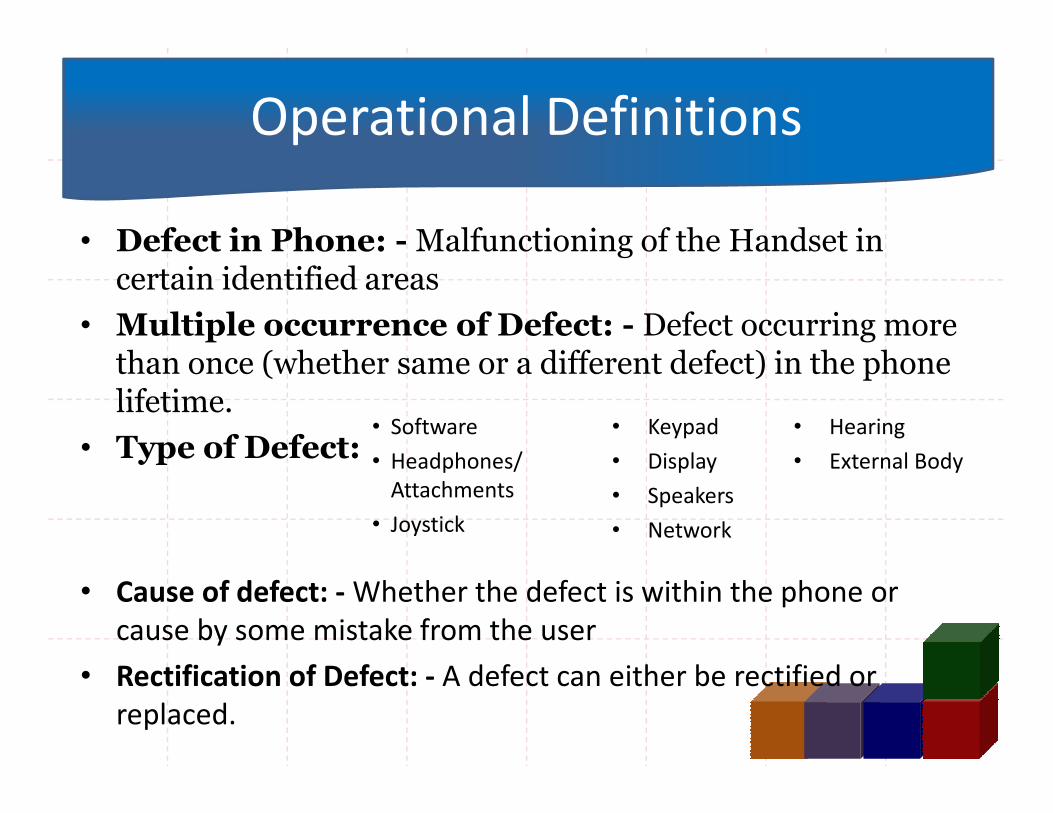
Operational Definitions
• Defect in Phone: -Malfunctioning of the Handset in certain identified areas
• Multiple occurrence of Defect: - Defect occurring more than once (whether same or a different defect) in the phone lifetime.lifetime.
• Type of Defect:
• Cause of defect: - Whether the defect is within the phone or
cause by some mistake from the user
• Rectification of Defect: - A defect can either be rectified or
replaced.
• Software
• Headphones/
Attachments
• Joystick
• Keypad
• Display
• Speakers
• Network
• Hearing
• External Body

Operational Definitions
• Place of Rectification: - Defective phones are rectified at any Provate Shop or Authorized Service Center
• Time required for rectification: - No. of Days
• Satisfaction for complaint handling: - Are the customer satisfied or unsatisfied with the way their customer satisfied or unsatisfied with the way their complaints are handled
• Customer Satisfaction for current working of Phone: - Regardless of defect or no defects
• Customer Loyalty occurring from various factors: - How many users would like to purchase from the same manufacturer again.

HYPOTHESIS
Hypothesis framed based on possible manufacturing standards and service levels timing given to solving customer complaints
HypothesisHypothesis
1. 99% phones do not have manufacturing defect
2. 90% is the service level of complaints. 90% of all phones need repairing should be repaired within 2 days.
3. 99% of the people will always be loyal to manufacturer of the current handset they are using

Scope of the Research
• Majorly College going students
• Convenience method of random sampling was adopted

Research Tools
• Checklist with 4 parts• Part 1: Customer Demographics
• Part2:Defect occurrence in Mobile & Defect detailing
• Part3:Customer Satisfaction to the way the Complaint • Part3:Customer Satisfaction to the way the Complaint
was handled
• Part4: Satisfaction towards the current working
conditions of phone and loyalty towards company.

Sampling Design – How was the
sampling done
The population consists of every college student owning a Mobile Phone. Colleges are chosen because in Mumbai, colleges have students coming from every part of Mumbai. The population estimation of this sample covers all age groups as fundamentally the different mobile phones used in al age groups remains the same.groups remains the same.

Information Flow Chart

Objective 1To find out the percentage of defective mobile phones circulating in the
market, the type of defect, cause of defect and occurrence of defect.
•• Hypothesis 1: Hypothesis 1: -- 99% phones do not have manufacturing defect
•• Question 1: Question 1: How many mobile
handsets in the market are
defective? No Yes
•• Question 2: Question 2: Cause of defect?
User Mistake or Internal
Problem? – Total defect - 129
180, 58%
129, 42%
26, 20%
103, 80%
Your Mistake
Internal Problem of the Phone

Objective 1To find out the percentage of defective mobile phones circulating in the
market, the type of defect, cause of defect and occurrence of defect.
•• Question 3: Question 3: When did the
defect occur from the date of
purchase?
84
100100
120
•• Question 4Question 4: : Out of the total sample how many were defective due to internal problem of the phone within the first year from the date of purchase of the phone?
Proportion of Defective Phones Due to Internal Problem
occuring within 1 year from the date of Purchase from the total
sample
22
47
71
84
0
20
40
60
80
1) Within 1
months
2) Within 3
months
3) Within 6
months
4) Within 12
months
5) More
than 1 yr
Percentage
Cumulative Percentage
sample
87, 28%
222, 72%
Yes
No

FINDINGS OF OBJECTIVE 1
• 42% phones sampled are defective
• 28% are visibly due to internal problem of the phone as the defect has occurred within 1 year from the date of purchase within 1 year from the date of purchase and it is due to internal problem.
• 71% of the defects take place with 6 months of purchase

TESTING OF HYPOTHESIS 1
• Null Hypothesis: - 99% phones do not have
manufacturing defect
• The data shows that 28% of the Mobile
Phones have inherent manufacturing defect Phones have inherent manufacturing defect
when they are sold
• Hence
• Null Hypothesis is “Rejected”

Objective 2: To find out where did the customer rectify his handset and in how many days
•• Hypothesis 2Hypothesis 2: : -- 90% is the service level of complaints. 90% of all phones need repairing should be repaired within 2 days.
•• Question 6: Question 6: What was the number of phones that were repaired replaced or were not rectified by the user?
•• Question 7: Question 7: Of the phones which were repaired/replaced where the user did got it repaired from i.e. Authorized Service Centre or Private Shop?
12, 9%Authorized Service Centre
18, 14%
99, 77%
12, 9%Not Rectified
Repaired
Replacement
61, 55%
50, 45%
Private Shop

Objective 2: To find out where did the customer rectify his handset and in how many days
•• Question 8: Question 8: Of the total number of the phones which were
repaired/replaced where did the user got it repaired from i.e. Authorized
Service Centre or Private Shop?
3, 25%
Replacement Authorized Service Centre Replacement Private Shop
52, 53%
47, 47%
Repaired Authorized Service Centre Repaired Private Shop
9, 75%

Objective 2: To find out where did the customer rectify his handset and in how many days
•• Question 9: Question 9: How many days it took for the Authorized Service Centre and
the Private Shop to get the defect rectified?
Replacement (days)
N 12
Average 55
Upper Limit 76
Lower Limit 33
Repaired (days)
N 99
Average 16
Upper Limit 21Lower Limit 33
Lower Limit 10
Repaired
Authorized Private Shop
N 52 47
Average 15 17
Median 6.5 5
Mode 1 2
Upper Limit 22 25
Lower Limit 7 8
Replacement
Authorized Private Shop
N 9 3
Average 63 30
Upper Limit 88 103
Lower Limit 38 -42

FINDINGS OF OBJECTIVE 2
• Defects were rectified in the following manner – 45% in Private shop, 55% in ASC
• Average time to get phone repaired • Average time to get phone repaired from either an authorized service centre or private shop is 16 days and time taken to get replaced is 55 days.

• Null Hypothesis: - 90% is the service level of complaints. 90% of all phones need repairing should be repaired within 2 days.
• The data shows that population average time taken for repairing a phone takes 7days to 22 days whereas for replacement takes 38 days to 88 days this leads us to reject
TESTING OF HYPOTHESIS 2
repairing a phone takes 7days to 22 days whereas for replacement takes 38 days to 88 days this leads us to reject the null hypothesis. This shows us the significant amount of time taken to get a defective handset sold by the manufacturer to repair or replace it.
• Null Hypothesis is “Rejected”

Objective 3To study customer satisfaction towards rectification process and current
working of phone and Customer loyalty towards the handset manufactures.
•• Hypothesis 3: Hypothesis 3: -- 99% of the people will always be loyal to manufacturer of the current handset they are using
•• Question 10: Question 10: What was the satisfaction level of the people who visited the Authorized Service Centre/ Private Shop to get their phone rectified (replaced/repaired)?
No
YesPrivate Shop
23, 38%
38, 62%
No
Yes
23, 44%
29, 56%
Authorized Service
Center (ASC)

Objective 3To study customer satisfaction towards rectification process and current
working of phone and Customer loyalty towards the handset manufactures.
•• Question 11: Question 11: How many respondents of the total sample are currently satisfied with the working of their phone?
•• Question 12Question 12: : What is the
Brand Loyalty of the users?
61, 20%
Would you like to purchase the phone from the same company
again?
248, 80%
No
Yes
108, 35%
35, 11%
166, 54%
Maybe
No
Yes

Objective 3To study customer satisfaction towards rectification process and current
working of phone and Customer loyalty towards the handset manufactures.
•• Question 13: Question 13: What is the relationship between the performance of the phone and loyalty towards company?
100
120
140
160 Are You Satisifed with working of Your Phone = Yes,
Would You Purchase from the Same company Again? - YES/NO/MayBe
85, 34%
Maybe
232414
85
11
152
0
20
40
60
80
100
MaybeNoYesMaybeNoYes
NoYes
Are you Satisfied with Working of Phone and
Would You Purchase from the same company Again
Count
11, 4%
152, 62%
Maybe
No
Yes
Are you satisfied with the working of your Phone now = No,
Would you Purchase from the same company Again? - YES/NO/MayBe
24, 39%
14, 23% 23, 38%
Maybe
No
Yes
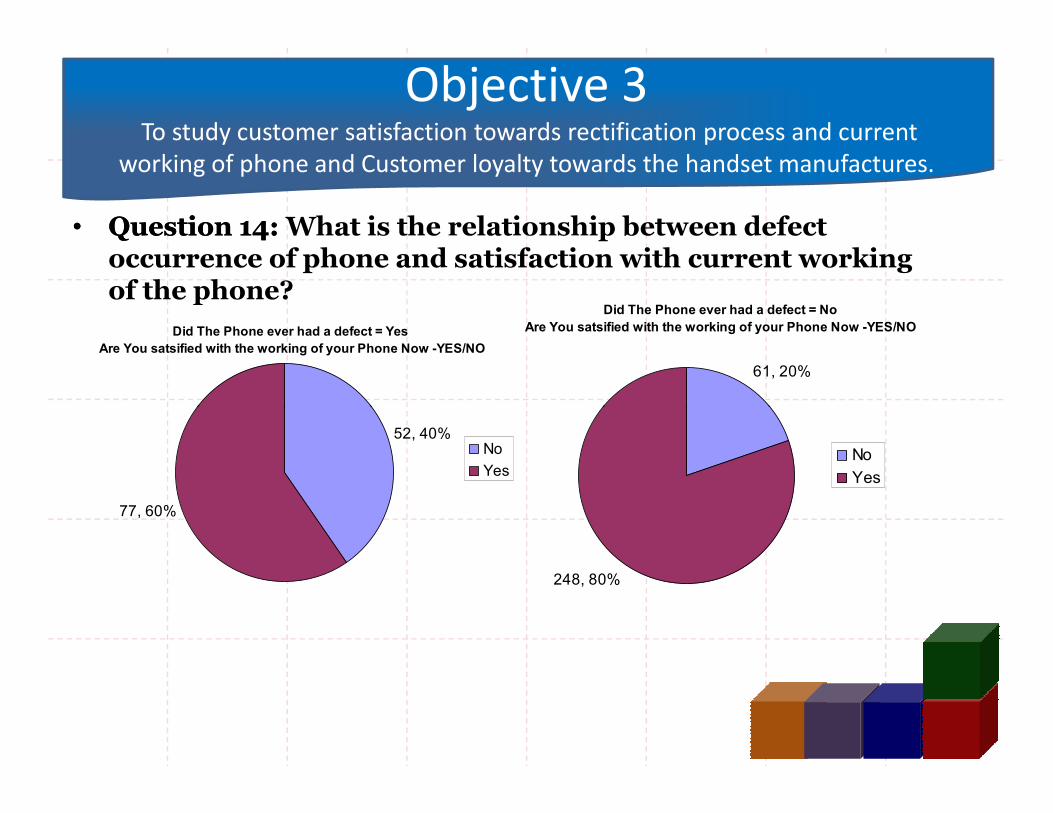
Objective 3To study customer satisfaction towards rectification process and current
working of phone and Customer loyalty towards the handset manufactures.
•• Question 14: Question 14: What is the relationship between defect occurrence of phone and satisfaction with current working of the phone?
Did The Phone ever had a defect = Yes
Are You satsified with the working of your Phone Now -YES/NO
Did The Phone ever had a defect = No
Are You satsified with the working of your Phone Now -YES/NO
61, 20%
52, 40%
77, 60%
No
Yes
248, 80%
No
Yes

Objective 3To study customer satisfaction towards rectification process and current
working of phone and Customer loyalty towards the handset manufactures.
•• Question 14: Question 14: What is the percentage of respondents who have faced a defect within 1 year from the date of purchase and the loyalty towards the company to buy from the same manufacturer?
Defect occured within the warranty period, and loyalty towards
brand
46, 42%
45, 41%
18, 17%
Maybe
No
Yes

Objective 3To study customer satisfaction towards rectification process and current
working of phone and Customer loyalty towards the handset manufactures.
•• Question 14: Question 14: To find the relationship between a defective piece
and its effect on customer loyalty

FINDINGS OF OBJECTIVE 3
• Of the entire sample, 54% would like to buy the phone from the same company again, while 11% would not and 35% are unsure.
•When a phone does not has a defect 62% would like to buy the phone from the same company again, while when the phone has a defect only 43% would like to buy the phone from the same
Loyalty
Defect YES NO MAYBE
Defective Phone 43 16 41
No defects 62 8 30
defect only 43% would like to buy the phone from the same company again.
• Customers having a defective handset: - 38% were unsatisfied with complaint handling.
• Phone Rectified to a Private Shop Centre, “44%” were not satisfied with the way their complaint was Handled.

• Null Hypothesis: - 99% of the people will always be loyal to manufacturer of the current handset they are using
• The above data shows us 11% of the population would not like to buy the phone from the same company again, whereas 35% is unsure. This leads us to reject the null hypothesis. Our analysis also shows us the relationship between defective
TESTING OF HYPOTHESIS 3
35% is unsure. This leads us to reject the null hypothesis. Our analysis also shows us the relationship between defective handsets and loyalty. If defects were to be zeroed customer loyalty would increase to 62% directly affecting the cost of marketing. gives us a clear results whether to accept or reject the null hypothesis, while point 2 gives us ways to improve loyalty by having defect free handsets.
• Null Hypothesis is “Rejected”

Recommendations
• Lower Defects increase loyalty
• Lower customer dissatisfaction towards complaints handling increase loyalty
• Regulator should set quality benchmarks• Regulator should set quality benchmarks
• The Price paid should be worth the service.

Following was the share of various
phones surveyed
• Nokia – 213• Sony Ericsson – 47• Motorola – 24• Samsung – 11• LG – 7• LG – 7• O2 – 3• Others- 4
• Total - 309 samples.
• Based on purely random sampling