Embed Size (px)
Citation preview

NIKE
INTRODUCTION:
Nike is engaged in the design, development and worldwide marketing of footwear, apparel,
equipment and accessory products. It sells its products to around 18000 retail accounts in the
United States and through a mix of independent distributors, licenses and subsidiaries in
nearly 200 countries. Nike is the largest seller of athletic footwear and athletic apparel in the
world.
The company creates designs for men, women and children. The top selling product category
includes running, basketball, children’s, cross-training and women’s shoes. It also designs
shoes for outdoor activities like tennis, golf, soccer, baseball, football, hiking and other
athletic and recreational uses.
VISION:
“Bring inspiration and innovation to every athlete in the world.”
MISSION:
As the largest seller of athletic footwear and athletic apparel in the world (2, 3), we create
products for consumers and athletics (1) who enjoy having quality products that are high
performance and reliable such as shoes, apparel, and technologically advanced equipment)
(4). Our dedicated employees (9) continuously work on developing new products, price, and
product identity through marketing and promotion (7). The company aims to lead in
corporate citizenship (8) through proactive programs that reflect caring for the world family
of Nike (6) and by ensuring continuous growth and profitability to our investors and
stakeholders (5).
1. Customer
2. Products or services
3. Markets
4. Technology
5. Concern for survival, profitability, growth
6. Philosophy
7. Self-concept
8. Concern for public image
9. Concern for employees
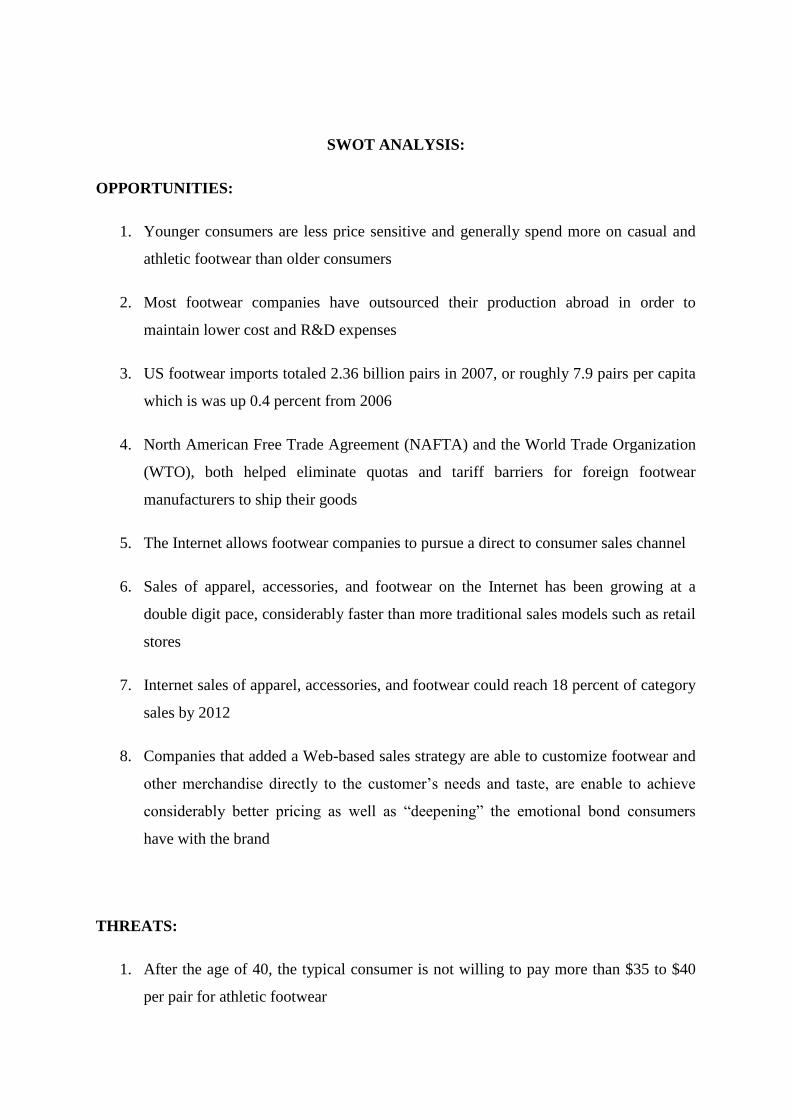
SWOT ANALYSIS:
OPPORTUNITIES:
1. Younger consumers are less price sensitive and generally spend more on casual and
athletic footwear than older consumers
2. Most footwear companies have outsourced their production abroad in order to
maintain lower cost and R&D expenses
3. US footwear imports totaled 2.36 billion pairs in 2007, or roughly 7.9 pairs per capita
which is was up 0.4 percent from 2006
4. North American Free Trade Agreement (NAFTA) and the World Trade Organization
(WTO), both helped eliminate quotas and tariff barriers for foreign footwear
manufacturers to ship their goods
5. The Internet allows footwear companies to pursue a direct to consumer sales channel
6. Sales of apparel, accessories, and footwear on the Internet has been growing at a
double digit pace, considerably faster than more traditional sales models such as retail
stores
7. Internet sales of apparel, accessories, and footwear could reach 18 percent of category
sales by 2012
8. Companies that added a Web-based sales strategy are able to customize footwear and
other merchandise directly to the customer’s needs and taste, are enable to achieve
considerably better pricing as well as “deepening” the emotional bond consumers
have with the brand
THREATS:
1. After the age of 40, the typical consumer is not willing to pay more than $35 to $40
per pair for athletic footwear
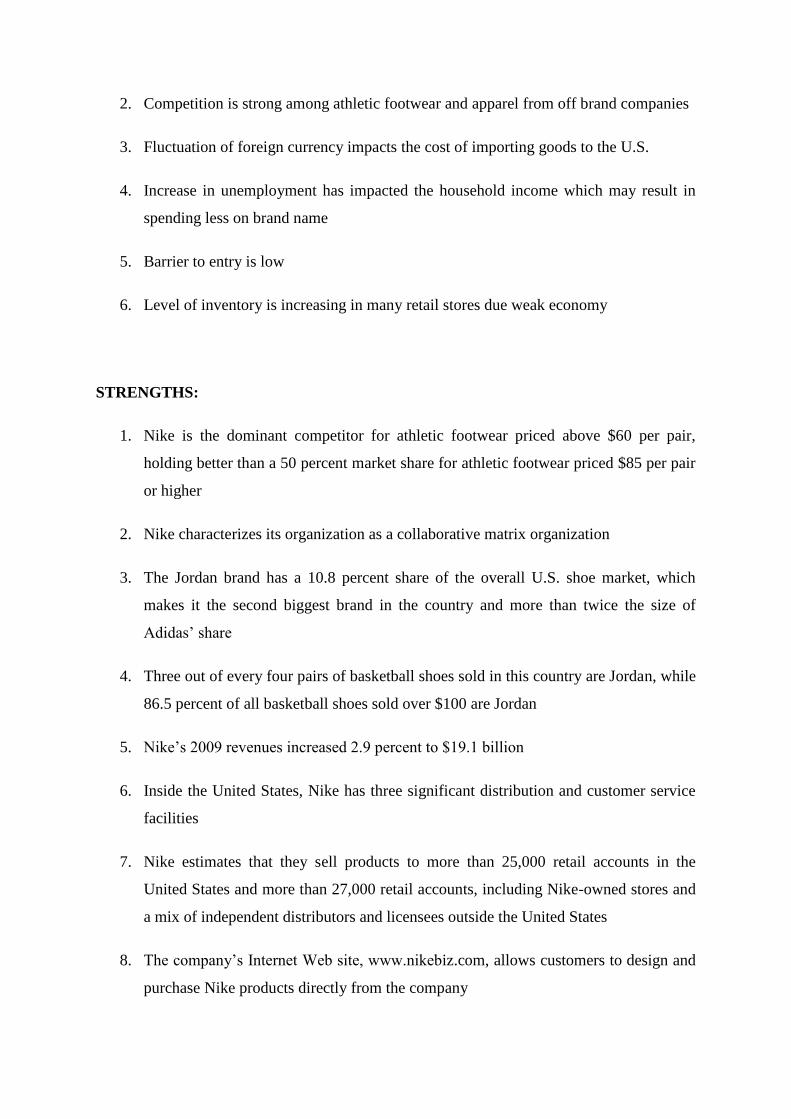
2. Competition is strong among athletic footwear and apparel from off brand companies
3. Fluctuation of foreign currency impacts the cost of importing goods to the U.S.
4. Increase in unemployment has impacted the household income which may result in
spending less on brand name
5. Barrier to entry is low
6. Level of inventory is increasing in many retail stores due weak economy
STRENGTHS:
1. Nike is the dominant competitor for athletic footwear priced above $60 per pair,
holding better than a 50 percent market share for athletic footwear priced $85 per pair
or higher
2. Nike characterizes its organization as a collaborative matrix organization
3. The Jordan brand has a 10.8 percent share of the overall U.S. shoe market, which
makes it the second biggest brand in the country and more than twice the size of
Adidas’ share
4. Three out of every four pairs of basketball shoes sold in this country are Jordan, while
86.5 percent of all basketball shoes sold over $100 are Jordan
5. Nike’s 2009 revenues increased 2.9 percent to $19.1 billion
6. Inside the United States, Nike has three significant distribution and customer service
facilities
7. Nike estimates that they sell products to more than 25,000 retail accounts in the
United States and more than 27,000 retail accounts, including Nike-owned stores and
a mix of independent distributors and licensees outside the United States
8. The company’s Internet Web site, www.nikebiz.com, allows customers to design and
purchase Nike products directly from the company

9. Nike has five wholly owned subsidiaries: Cole Haan, Converse, Hurley International,
NIKE Golf, and Umbro Ltd
WEAKNESS:
1. Nike’s 2009 net income decreased 21 percent to $1.48 billion
2. Almost all of Nike’s footwear is manufactured outside the United States by
independent contractors
3. In fiscal 2008, contract manufacturers in China, Vietnam, Indonesia, and Thailand
manufactured 99 percent of Nike’s footwear worldwide
4. Because Nike competes primarily in athletic footwear, apparel and related sporting
equipment, its sales are heavily concentrated in the youth and young adult market
5. Accounts payable has increased by almost $1.0 billion in 2009
6. Negative publicity and boycotting of the Nike products due to outsourcing jobs
overseas and the use of child labor in such factories

STAGE I: THE INPUT STAGE
EXTERNAL FACTOR MATRIX (EFE) MATRIX:
EFE (External Factor Evaluation) matrix is the strategic tool used to evaluate
external environment or macro environment of the firm include economic, social,
technological, government, political, legal and competitive information.
The organization we selected is a leading Footwear brand “Nike”. Matrix is as follows
Key External Factors Weight Rating Weighted
Score
Opportunities
1. Younger consumers are less price sensitive and generally
spend more on casual and athletic footwear than older
consumers
0.08 3 0.24
2. Most footwear companies have outsourced their production
abroad in order to maintain lower cost and R&D expenses
0.07 4 0.28
3. US footwear imports totaled 2.36 billion pairs in 2007, or
roughly 7.9 pairs per capita which is was up 0.4 percent
from 2006
0.07 3 0.21
4. North American Free Trade Agreement (NAFTA) and the
World Trade Organization (WTO), both helped eliminate
quotas and tariff barriers for foreign footwear
manufacturers to ship their goods
0.06 4 0.24
5. The Internet allows footwear companies to pursue a direct
to consumer sales channel
0.07 4 0.28
6. Sales of apparel, accessories, and footwear on the Internet
has been growing at a double digit pace, considerably faster
than more traditional sales models such as retail stores
0.08 3 0.24
7. Internet sales of apparel, accessories, and footwear could
reach 18 percent of category sales by 2012
0.07 4 0.28
8. Companies that added a Web-based sales strategy are able
to customize footwear and other merchandise directly to the
customer's needs and taste, are enable to achieve
considerably better pricing as well as "deepening" the
emotional bond consumers have with the brand
0.06 3 0.18
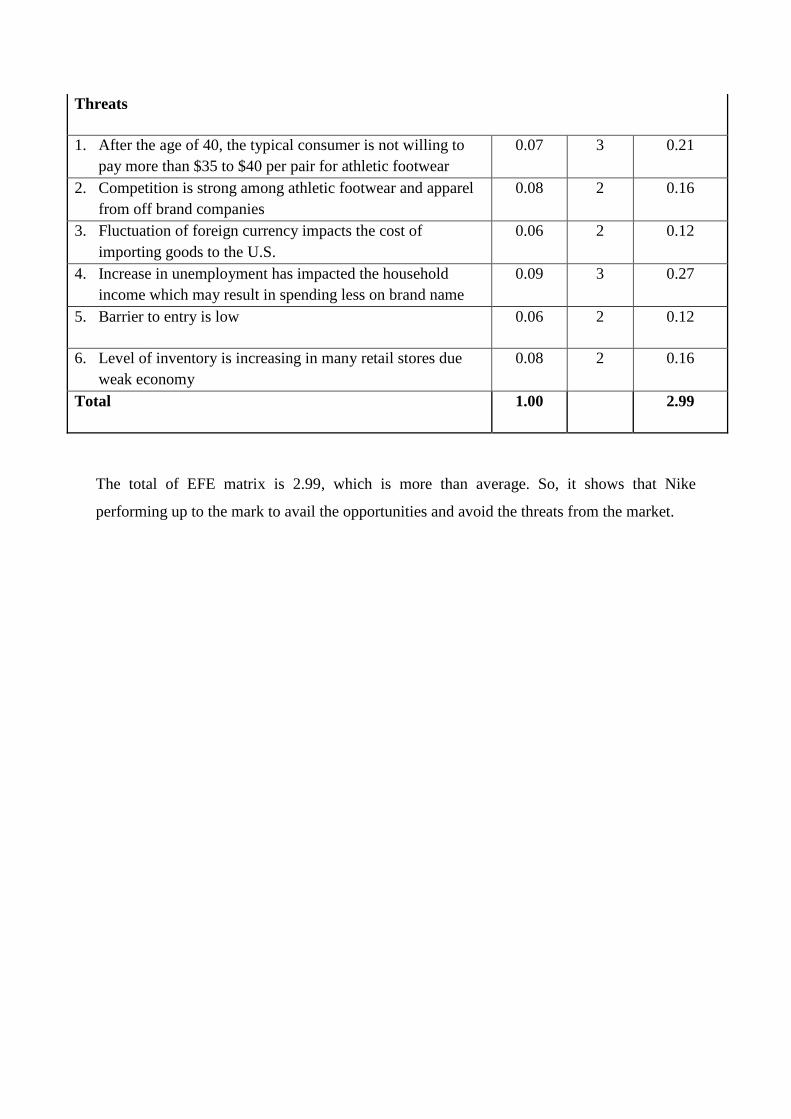
Threats
1. After the age of 40, the typical consumer is not willing to
pay more than $35 to $40 per pair for athletic footwear
0.07 3 0.21
2. Competition is strong among athletic footwear and apparel
from off brand companies
0.08 2 0.16
3. Fluctuation of foreign currency impacts the cost of
importing goods to the U.S.
0.06 2 0.12
4. Increase in unemployment has impacted the household
income which may result in spending less on brand name
0.09 3 0.27
5. Barrier to entry is low 0.06 2 0.12
6. Level of inventory is increasing in many retail stores due
weak economy
0.08 2 0.16
Total 1.00 2.99
The total of EFE matrix is 2.99, which is more than average. So, it shows that Nike
performing up to the mark to avail the opportunities and avoid the threats from the market.
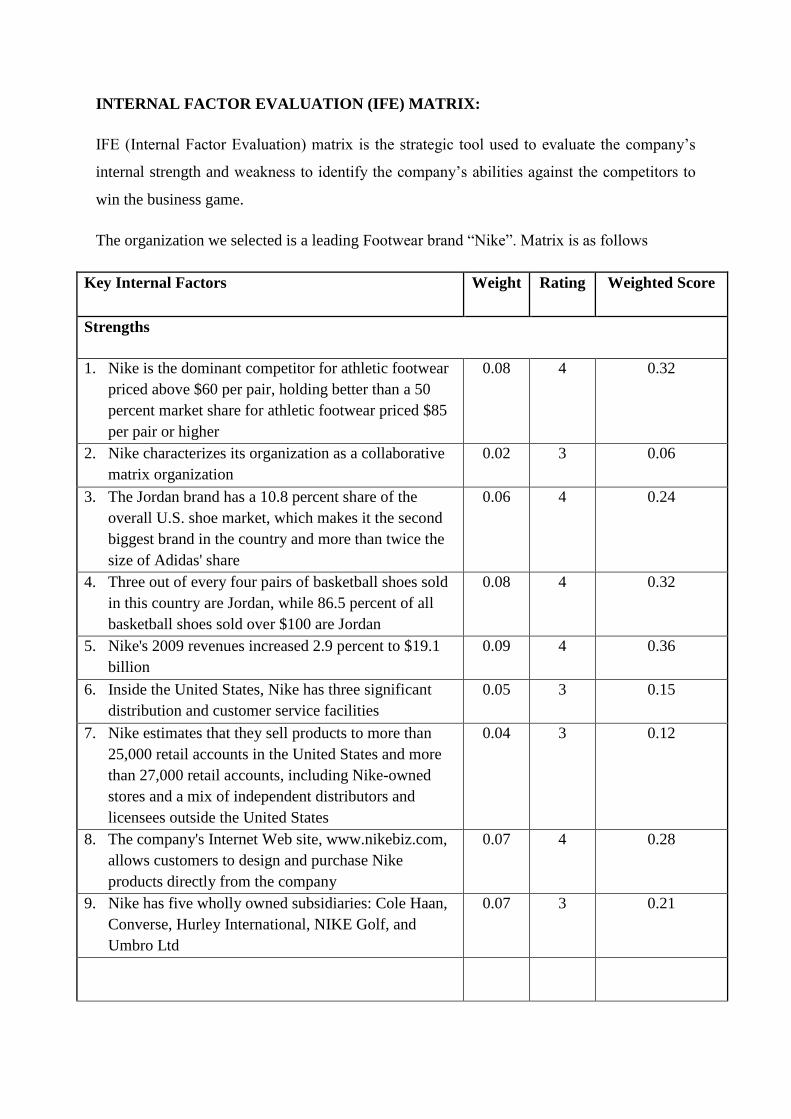
INTERNAL FACTOR EVALUATION (IFE) MATRIX:
IFE (Internal Factor Evaluation) matrix is the strategic tool used to evaluate the company’s
internal strength and weakness to identify the company’s abilities against the competitors to
win the business game.
The organization we selected is a leading Footwear brand “Nike”. Matrix is as follows
Key Internal Factors Weight Rating Weighted Score
Strengths
1. Nike is the dominant competitor for athletic footwear
priced above $60 per pair, holding better than a 50
percent market share for athletic footwear priced $85
per pair or higher
0.08 4 0.32
2. Nike characterizes its organization as a collaborative
matrix organization
0.02 3 0.06
3. The Jordan brand has a 10.8 percent share of the
overall U.S. shoe market, which makes it the second
biggest brand in the country and more than twice the
size of Adidas' share
0.06 4 0.24
4. Three out of every four pairs of basketball shoes sold
in this country are Jordan, while 86.5 percent of all
basketball shoes sold over $100 are Jordan
0.08 4 0.32
5. Nike's 2009 revenues increased 2.9 percent to $19.1
billion
0.09 4 0.36
6. Inside the United States, Nike has three significant
distribution and customer service facilities
0.05 3 0.15
7. Nike estimates that they sell products to more than
25,000 retail accounts in the United States and more
than 27,000 retail accounts, including Nike-owned
stores and a mix of independent distributors and
licensees outside the United States
0.04 3 0.12
8. The company's Internet Web site, www.nikebiz.com,
allows customers to design and purchase Nike
products directly from the company
0.07 4 0.28
9. Nike has five wholly owned subsidiaries: Cole Haan,
Converse, Hurley International, NIKE Golf, and
Umbro Ltd
0.07 3 0.21
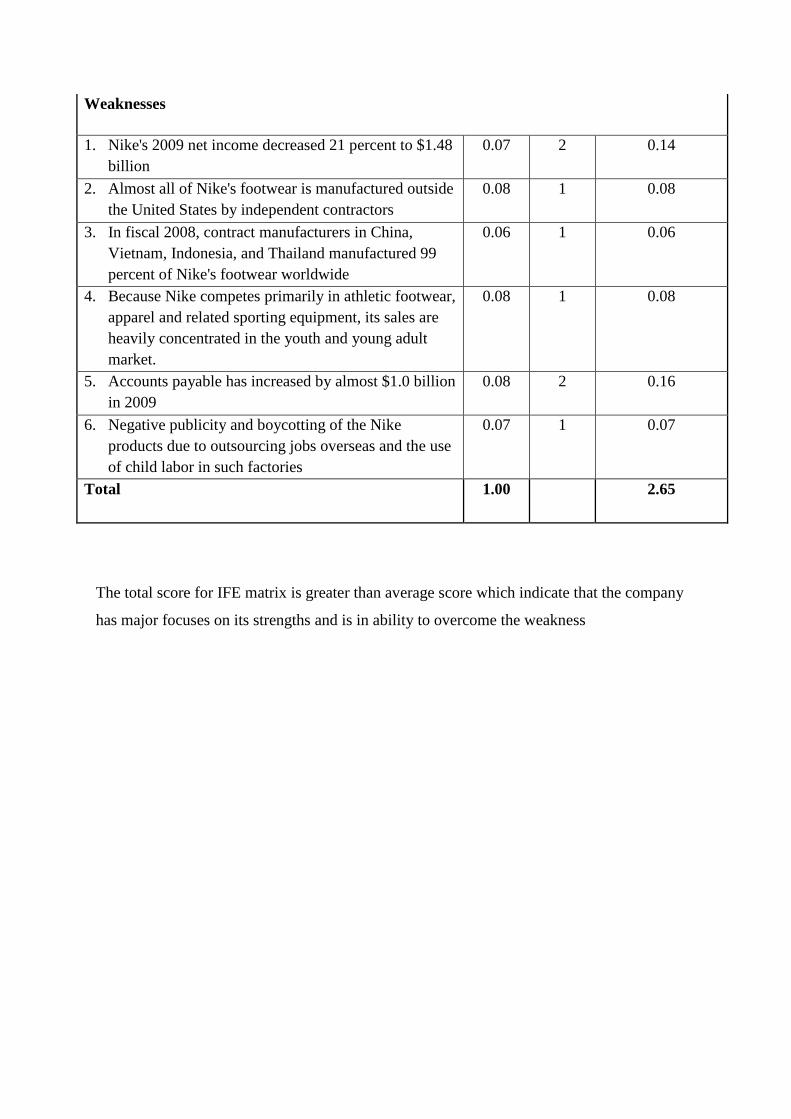
Weaknesses
1. Nike's 2009 net income decreased 21 percent to $1.48
billion
0.07 2 0.14
2. Almost all of Nike's footwear is manufactured outside
the United States by independent contractors
0.08 1 0.08
3. In fiscal 2008, contract manufacturers in China,
Vietnam, Indonesia, and Thailand manufactured 99
percent of Nike's footwear worldwide
0.06 1 0.06
4. Because Nike competes primarily in athletic footwear,
apparel and related sporting equipment, its sales are
heavily concentrated in the youth and young adult
market.
0.08 1 0.08
5. Accounts payable has increased by almost $1.0 billion
in 2009
0.08 2 0.16
6. Negative publicity and boycotting of the Nike
products due to outsourcing jobs overseas and the use
of child labor in such factories
0.07 1 0.07
Total 1.00 2.65
The total score for IFE matrix is greater than average score which indicate that the company
has major focuses on its strengths and is in ability to overcome the weakness
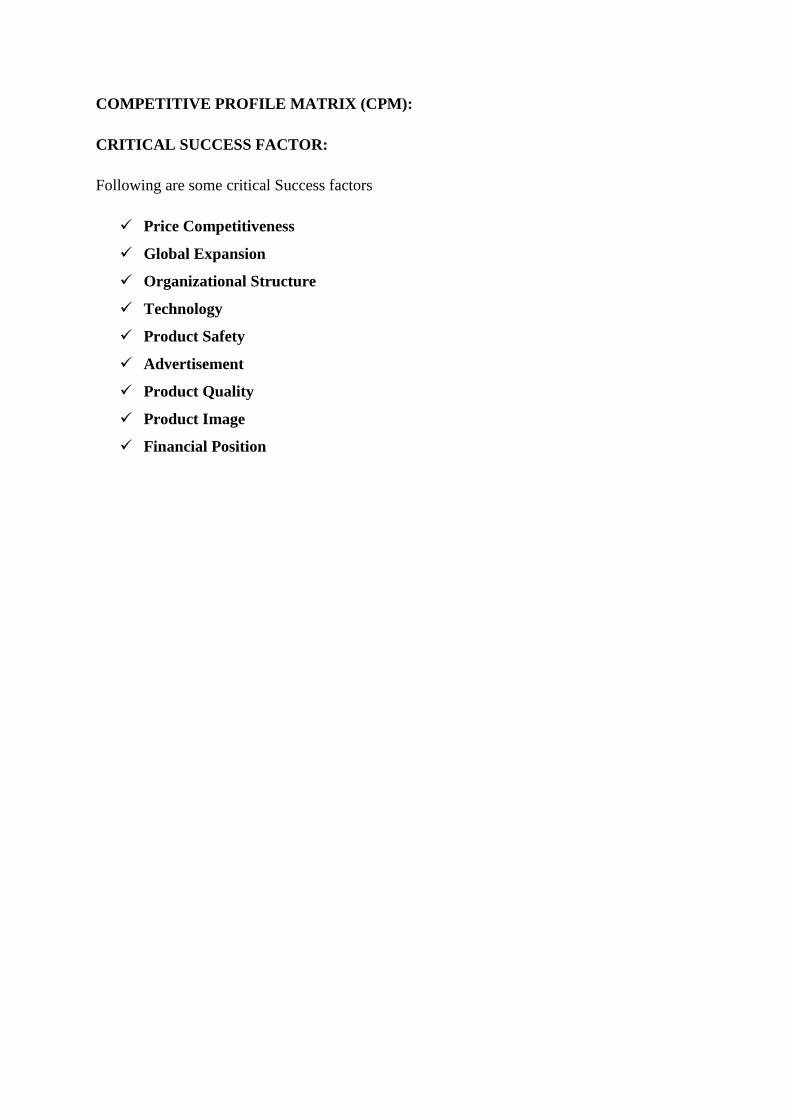
COMPETITIVE PROFILE MATRIX (CPM):
CRITICAL SUCCESS FACTOR:
Following are some critical Success factors
Price Competitiveness
Global Expansion
Organizational Structure
Technology
Product Safety
Advertisement
Product Quality
Product Image
Financial Position

Nike Adidas Puma
Critical Success Factors Weight Rating
Weighted
Score Rating
Weighted
Score Rating
Weighted
Score
Price competitiveness 0.10 3 0.30 2 0.20 1 0.10
Global Expansion 0.07 4 0.28 3 0.21 2 0.14
Organizational Structure 0.04 3 0.12 1 0.04 1 0.04
Technology 0.09 3 0.27 1 0.09 2 0.18
Product Safety 0.15 2 0.30 3 0.45 4 0.60
Customer Loyalty 0.09 4 0.36 3 0.27 2 0.18
Market Share 0.09 4 0.36 3 0.27 2 0.18
Advertising 0.12 4 0.48 3 0.36 2 0.24
Product Quality 0.12 3 0.36 2 0.24 1 0.12
Product Image 0.07 4 0.28 3 0.21 2 0.14
Financial Position 0.06 4 0.24 3 0.18 2 0.12
Total 1.00 3.35 2.52 2.04

STAGE II: THE MATCHING STAGE
SWOT Matrix:
Strengths Weaknesses
1. Nike is the dominant
competitor for athletic
footwear priced above $60
per pair, holding better
than a 50 percent market
share for athletic footwear
priced $85 per pair or
higher
2. Nike characterizes its
organization as a
collaborative matrix
organization
3. The Jordan brand has a
10.8 percent share of the
overall U.S. shoe market,
which makes it the second
biggest brand in the
country and more than
twice the size of Adidas’
share
4. Three out of every four
pairs of basketball shoes
sold in this country are
Jordan, while 86.5 percent
of all basketball shoes sold
over $100 are Jordan
5. Nike’s 2009 revenues
increased 2.9 percent to
$19.1 billion
6. Inside the United States,
Nike has three significant
distribution and customer
service facilities
7. Nike estimates that they
sell products to more than
25,000 retail accounts in
the United States and more
than 27,000 retail
accounts, including Nike-
owned stores and a mix of
independent distributors
1. Nike’s 2009 net income
decreased 21 percent to
$1.48 billion
2. Almost all of Nike’s
footwear is manufactured
outside the United States
by independent contractors
3. In fiscal 2008, contract
manufacturers in China,
Vietnam, Indonesia, and
Thailand manufactured 99
percent of Nike’s footwear
worldwide
4. Because Nike competes
primarily in athletic
footwear, apparel and
related sporting
equipment, its sales are
heavily concentrated in the
youth and young adult
market
5. Accounts payable has
increased by almost $1.0
billion in 2009
6. Negative publicity and
boycotting of the Nike
products due to
outsourcing jobs overseas
and the use of child labor
in such factories

and licensees outside the
United States
8. The company’s Internet
Web site,
www.nikebiz.com, allows
customers to design and
purchase Nike products
directly from the company
9. Nike has five wholly
owned subsidiaries: Cole
Haan, Converse, Hurley
International, NIKE Golf,
and Umbro Ltd
Opportunities S-O Strategies
W-O Strategies
1. Younger consumers are
less price sensitive and
generally spend more on
casual and athletic
footwear than older
consumers
2. Most footwear companies
have outsourced their
production abroad in order
to maintain lower cost and
R&D expenses
3. US footwear imports
totaled 2.36 billion pairs in
2007, or roughly 7.9 pairs
per capita which is was up
0.4 percent from 2006
4. North American Free
Trade Agreement
(NAFTA) and the World
Trade Organization
(WTO), both helped
eliminate quotas and tariff
barriers for foreign
footwear manufacturers to
ship their goods
5. The Internet allows
footwear companies to
pursue a direct to
consumer sales channel
6. Sales of apparel,
accessories, and footwear
on the Internet has been
1. Expand into international
market more where the
economy is stronger (S1,
S3, S4, S7, O1)
2. Increase advertising and
promotion through social
networking such as
Twitter and Facebook (S8,
O1, O5, O7)
1. Develop new products for
small kids based on
cartoon characters (W4,
O1, O3)
2. Sponsor more athletics
programs, mostly for
young generation (W1,
W4, W6, O1, O2, O3)

growing at a double digit
pace, considerably faster
than more traditional sales
models such as retail
stores
7. Internet sales of apparel,
accessories, and footwear
could reach 18 percent of
category sales by 2012
8. Companies that added a
Web-based sales strategy
are able to customize
footwear and other
merchandise directly to the
customer’s needs and
taste, are enable to achieve
considerably better pricing
as well as “deepening” the
emotional bond consumers
have with the brand
Threats S-T Strategies
W-T Strategies
1. After the age of 40, the
typical consumer is not
willing to pay more than
$35 to $40 per pair for
athletic footwear
2. Competition is strong
among athletic footwear
and apparel from off brand
companies
3. Fluctuation of foreign
currency impacts the cost
of importing goods to the
U.S.
4. Increase in unemployment
has impacted the
household income which
may result in spending less
on brand name
5. Barrier to entry is low
6. Level of inventory is
increasing in many retail
stores due weak economy
1. Develop a new moderately
priced product line (S1,
S2, S3, S4, T2, T4, T6)
2. Expand distribution by
selling to stores other than
their own retailers (S7, T2)
1. Make low priced footwear
made in the US and
promote it as “Made in
America” (W2, W6, T2,
T3, T4, T6)
2. Acquire a less expensive
brand of accessories and
sportswear and promote
them as an off brand of
Nike (W4, W6, T1, T4,
T6)
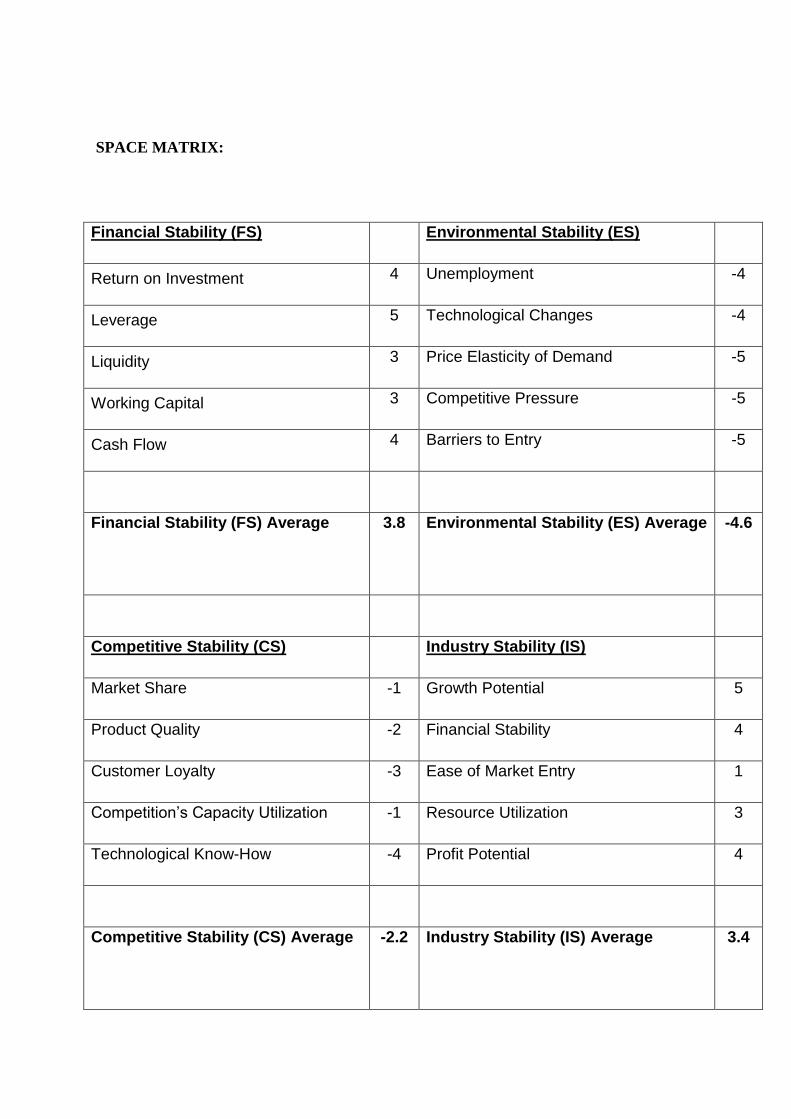
SPACE MATRIX:
Financial Stability (FS) Environmental Stability (ES)
Return on Investment 4 Unemployment -4
Leverage 5 Technological Changes -4
Liquidity 3 Price Elasticity of Demand -5
Working Capital 3 Competitive Pressure -5
Cash Flow 4 Barriers to Entry -5
Financial Stability (FS) Average
3.8 Environmental Stability (ES) Average -4.6
Competitive Stability (CS) Industry Stability (IS)
Market Share -1 Growth Potential 5
Product Quality -2 Financial Stability 4
Customer Loyalty -3 Ease of Market Entry 1
Competition’s Capacity Utilization -1 Resource Utilization 3
Technological Know-How -4 Profit Potential 4
Competitive Stability (CS) Average
-2.2 Industry Stability (IS) Average
3.4

X-axis; IS+CA= (3.4) + (-2.2) = 1.4
Y-axis: FS + ES= (3.8) + (-4.6) = -0.8
FS
CS
ES
IS 6 5 4 3 2 1
Conservative Aggressive
Competitive Defensive
1
2
3
4
5
6
7 -2 -3 -4 -5 -7 -1 -6
7
-7
-6
-5
-4
-3
-2
-1

BCG MATRIX:
1. Market development
2. Market penetration
3. Product development
4. Forward integration
5. Backward integration
6. Horizontal integration
NIKE

INTERNAL EXTERNAL MATRIX:
Strong
3.0 to 4.0
Average
2.0 to 2.99
Weak
1.0 to 1.99
High
3.0 to 3.99
I
II
III
Medium
2.0 to 2.99
IV
IV
Nike, Inc
VI
Low
1.0 to 1.99
VII VIII IX
The EFE
Total
Weighted
Score
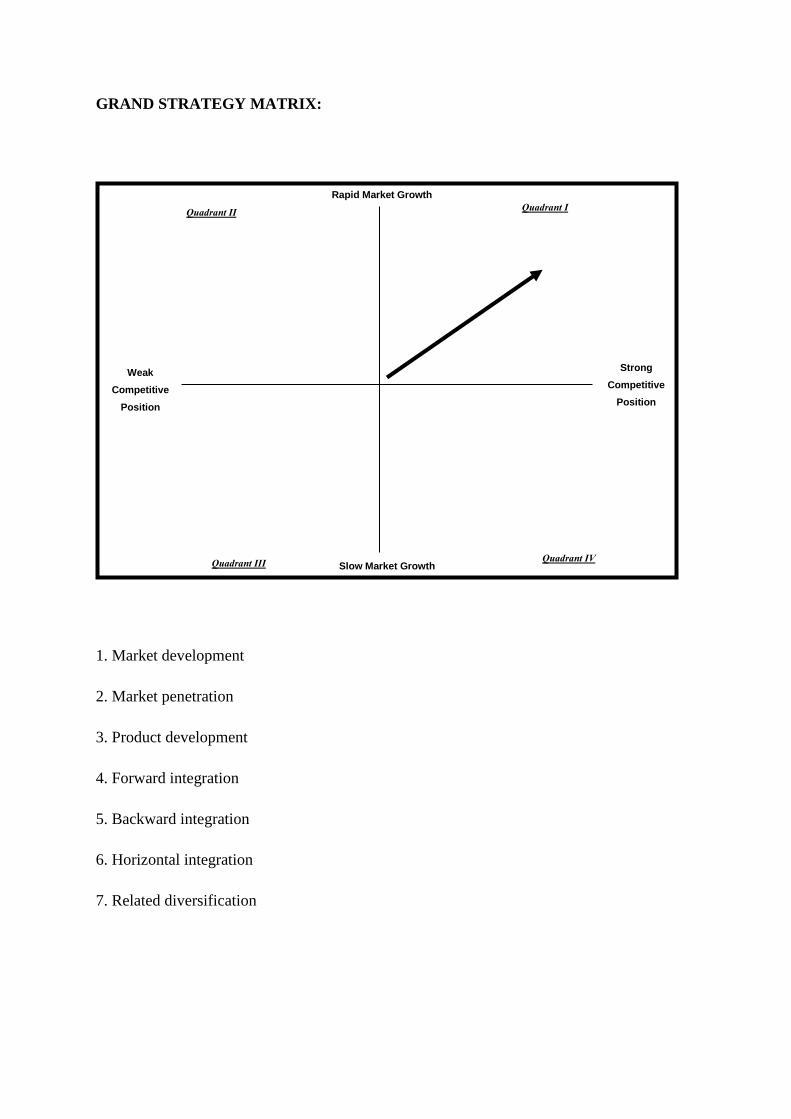
GRAND STRATEGY MATRIX:
1. Market development
2. Market penetration
3. Product development
4. Forward integration
5. Backward integration
6. Horizontal integration
7. Related diversification
Weak
Competitive
Position
Quadrant II Quadrant I
Quadrant IV Quadrant III
Strong
Competitive
Position
Rapid Market Growth
Slow Market Growth

STAGE III: DECISION STAGE
QSPM:
Key Factors Weight AS TAS AS TAS
Opportunities
1. Younger consumers are less price sensitive
and generally spend more on casual and
athletic footwear than older consumers
0.08 1 0.08 4 0.32
2. Most footwear companies have outsourced
their production abroad in order to maintain
lower cost and R&D expenses
0.07 --- --- --- ---
3. US footwear imports totaled 2.36 billion
pairs in 2007, or roughly 7.9 pairs per capita
which is was up 0.4 percent from 2006
0.07 --- --- --- ---
4. North American Free Trade Agreement
(NAFTA) and the World Trade
Organization (WTO), both helped eliminate
quotas and tariff barriers for foreign
footwear manufacturers to ship their goods
0.06 2 0.12 3 0.18
5. The Internet allows footwear companies to
pursue a direct to consumer sales channel
0.07 --- --- --- ---
6. Sales of apparel, accessories, and footwear
on the Internet has been growing at a double
digit pace, considerably faster than more
traditional sales models such as retail stores
0.08 2 0.16 4 0.32
7. Internet sales of apparel, accessories, and
footwear could reach 18 percent of category
sales by 2012
0.07 4 0.28 1 0.07
8. Companies that added a Web-based sales
strategy are able to customize footwear and
other merchandise directly to the customer's
needs and taste, are enable to achieve
considerably better pricing as well as
"deepening" the emotional bond consumers
have with the brand
0.06 4 0.24 1 0.06
Threats
1. After the age of 40, the typical consumer is
not willing to pay more than $35 to $40 per
pair for athletic footwear
0.07 1 0.07 4 0.28
2. Competition is strong among athletic
footwear and apparel from off brand
companies
0.08 --- --- --- ---
3. Fluctuation of foreign currency impacts the
cost of importing goods to the U.S.
0.06 --- --- --- ---

4. Increase in unemployment has impacted the
household income which may result in
spending less on brand name
0.09 1 0.09 3 0.27
5. Barrier to entry is low 0.06 --- --- --- ---
6. Level of inventory is increasing in many
retail stores due weak economy
0.08 4 0.32 2 0.16
TOTAL 1.00 1.36 1.66
Strengths
1. Nike is the dominant competitor for athletic
footwear priced above $60 per pair, holding
better than a 50 percent market share for
athletic footwear priced $85 per pair or
higher
0.08 --- --- --- ---
2. Nike characterizes its organization as a
collaborative matrix organization
0.02 --- --- --- ---
3. The Jordan brand has a 10.8 percent share
of the overall U.S. shoe market, which
makes it the second biggest brand in the
country and more than twice the size of
Adidas' share
0.06 3 0.18 1 0.06
4. Three out of every four pairs of basketball
shoes sold in this country are Jordan, while
86.5 percent of all basketball shoes sold
over $100 are Jordan
0.08 3 0.24 1 0.08
5. Nike's 2009 revenues increased 2.9 percent
to $19.1 billion
0.09 --- --- --- ---
6. Inside the United States, Nike has three
significant distribution and customer service
facilities
0.05 --- --- --- ---
7. Nike estimates that they sell products to
more than 25,000 retail accounts in the
United States and more than 27,000 retail
accounts, including Nike-owned stores and
a mix of independent distributors and
licensees outside the United States
0.04 3 0.12 4 0.16
8. The company's Internet Web site,
www.nikebiz.com, allows customers to
design and purchase Nike products directly
from the company
0.07 4 0.28 1 0.07
9. Nike has five wholly owned subsidiaries:
Cole Haan, Converse, Hurley International,
NIKE Golf, and Umbro Ltd
0.07 1 0.07 3 0.21
Weaknesses

1. Nike's 2009 net income decreased 21
percent to $1.48 billion
0.07 1 0.07 3 0.21
2. Almost all of Nike's footwear is
manufactured outside the United States by
independent contractors
0.08 --- --- --- ---
3. In fiscal 2008, contract manufacturers in
China, Vietnam, Indonesia, and Thailand
manufactured 99 percent of Nike's footwear
worldwide
0.06 --- --- --- ---
4. Because Nike competes primarily in athletic
footwear, apparel and related sporting
equipment, its sales are heavily concentrated
in the youth and young adult market
0.08 1 0.08 3 0.24
5. Accounts payable has increased by almost
$1.0 billion in 2009
0.08 --- --- --- ---
6. Negative publicity and boycotting of the
Nike products due to outsourcing jobs
overseas and the use of child labor in such
factories
0.07 --- --- --- ---
SUBTOTAL 1.00 1.04 1.03
SUM TOTAL ATTRACTIVENESS SCORE 2.4 2.69
Recommendations
Acquire a company who manufactures and sells less expensive products than Nike. The
company should have established distribution and retail shelf space with non-competing
product lines. It would be ideal if the company is a U.S. based corporation with domestic
manufacturing facilities.