Embed Size (px)
Citation preview

Investment Patterns in the Healthcare Industry - An Analysis
Janani Sankaran, Industry Analyst
Business and Financial Services, Healthcare
October 13, 2009
N68F-F1 2
Detailed Table of Contents
Significant Developments in the Healthcare Industry Significant Developments in the Healthcare Industry
Significant Developments in the Healthcare Industry
Equity Markets- An OverviewEquity Markets- An Overview
Stock Markets- An Overview
Analysis of Equity Investments by Time Period
Analysis of Equity Investments by Type of Equity
Analysis of Equity Investments by Deal Volume
Investment Analysis- IntroductionInvestment Analysis- Introduction
Number of Deals Analyzed
Analysis of Various Investments by Time
Analysis of Various Investments by Proceeds
Analysis of Various Investments by Type of Funding

N68F-F1 3
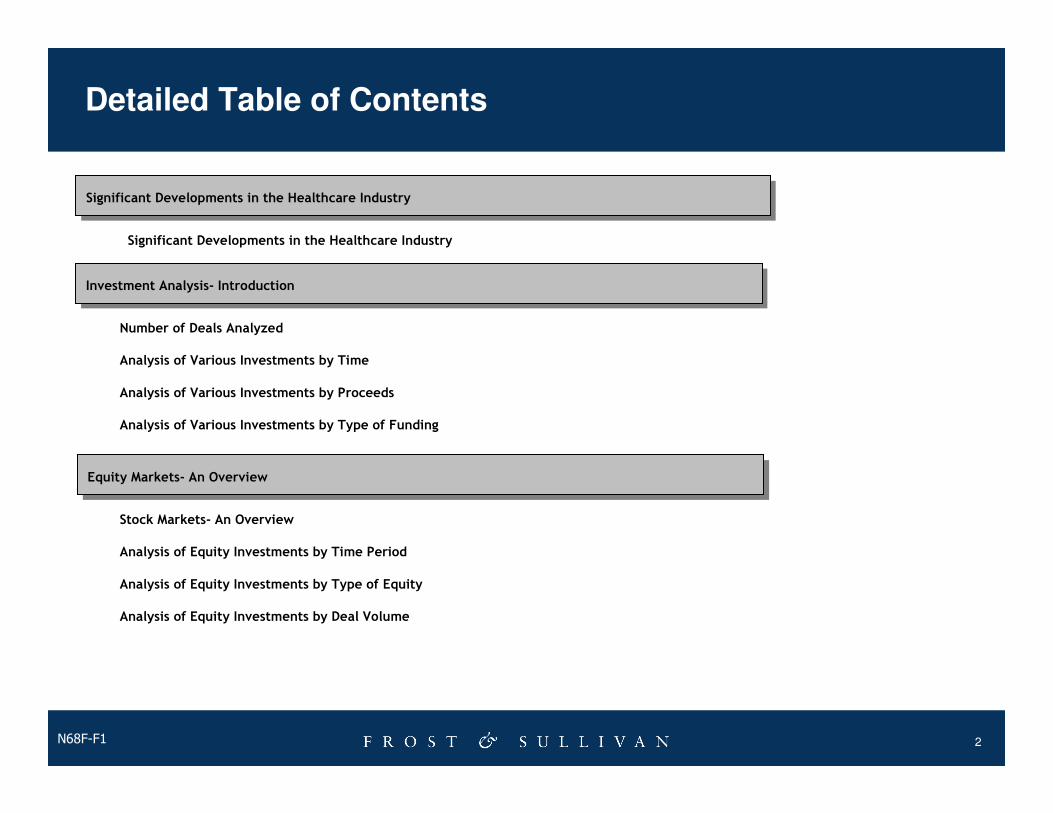
Loan Markets- An OverviewLoan Markets- An Overview
Contact Information and About Frost & SullivanContact Information and About Frost & Sullivan
Analysis of Loans by Time
Analysis of Loans by Pricing
Analysis of Loans by Proceeds
Analysis of Loans by extent of Leverage
Concluding ThoughtsConcluding Thoughts
Debt Markets- An OverviewDebt Markets- An Overview
Analysis of Debt Investments by Time
Analysis of Debt Investments by Geographies
Analysis of Debt Investments by Volume and Proceeds
Detailed Table of Contents
N68F-F1 4
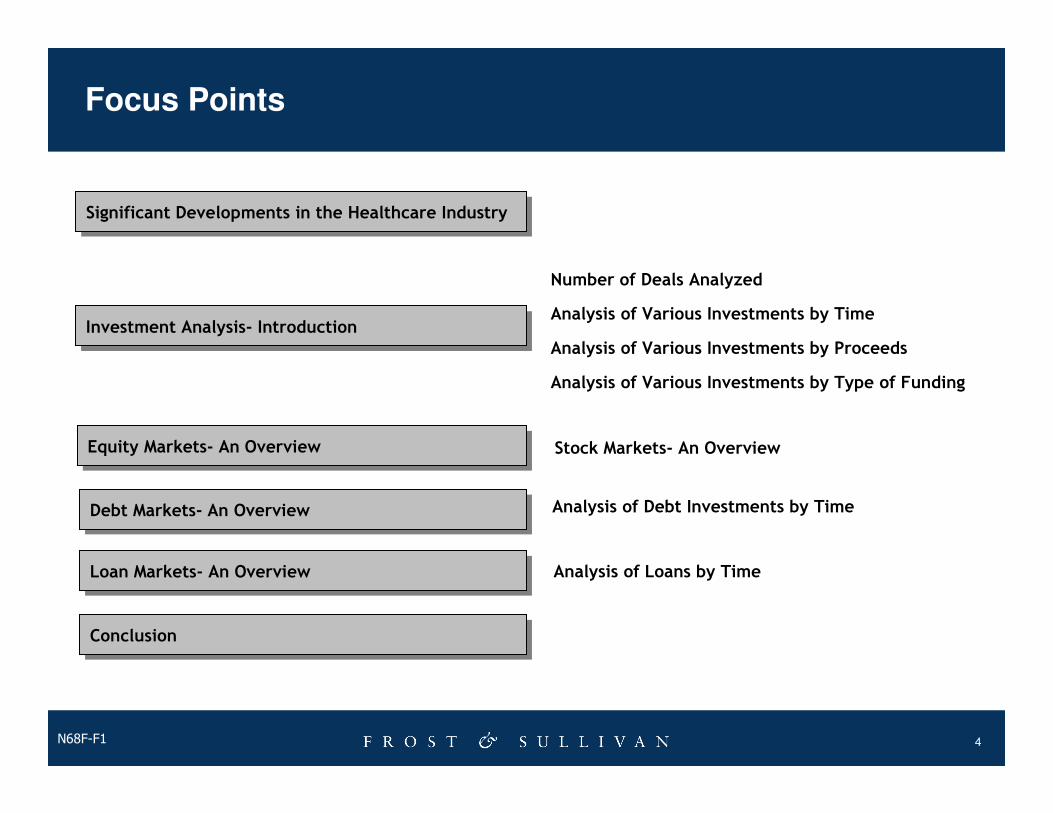
Focus Points
Significant Developments in the Healthcare Industry Significant Developments in the Healthcare Industry
Equity Markets- An OverviewEquity Markets- An Overview
Investment Analysis- IntroductionInvestment Analysis- Introduction
Number of Deals Analyzed
Analysis of Various Investments by Time
Analysis of Various Investments by Proceeds
Analysis of Various Investments by Type of Funding
Stock Markets- An Overview
Debt Markets- An OverviewDebt Markets- An Overview Analysis of Debt Investments by Time
Loan Markets- An OverviewLoan Markets- An Overview Analysis of Loans by Time
Conclusion Conclusion
N68F-F1 5
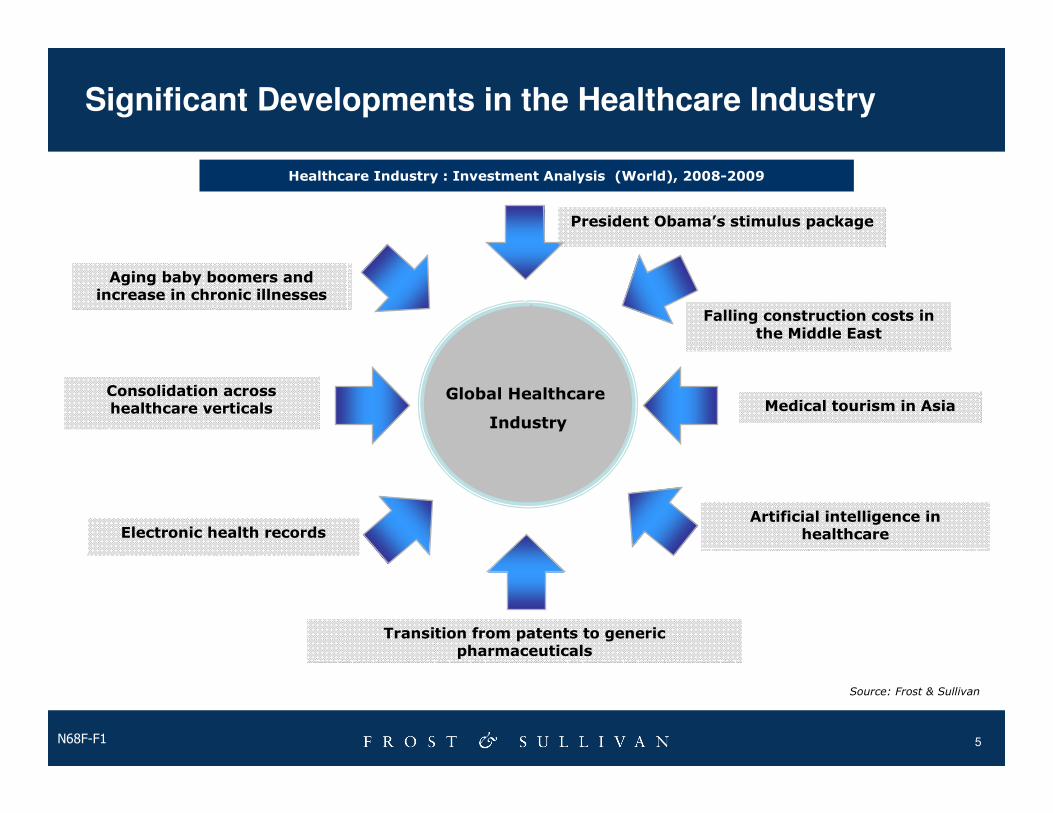
Significant Developments in the Healthcare Industry
Healthcare Industry : Investment Analysis (World), 2008-2009
Global Healthcare
Industry
Aging baby boomers and increase in chronic illnesses
President Obama’s stimulus package
Falling construction costs in the Middle East
Medical tourism in Asia
Transition from patents to generic pharmaceuticals
Artificial intelligence in healthcareElectronic health records
Consolidation across healthcare verticals
Source: Frost & Sullivan
N68F-F1 6
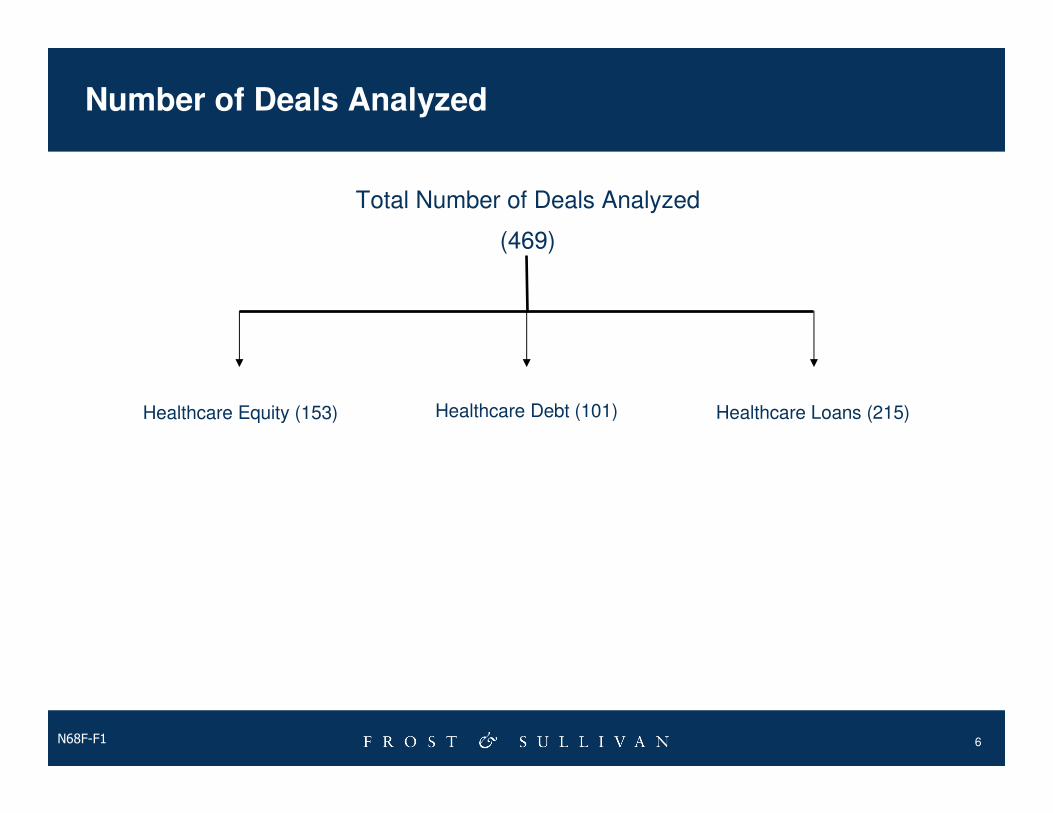
Number of Deals Analyzed
Total Number of Deals Analyzed
(469)
Healthcare Equity (153) Healthcare Loans (215)Healthcare Debt (101)

N68F-F1 7Note: All figures are rounded; the base year is 2008.
Source: Frost & Sullivan
Healthcare Investments - Analysis by Time (World) 2008-2009
Healthcare Industry : Investment Analysis by time and by Volume (World), 2008-2009
Q2 2008 Q3 2008 Q4 2008 Q1 2009 Q2 2009Biotechnology 14 10 1 12 8Healthcare equipment 22 34 10 25 17Other Healthcare Providers 12 24 21 16 8Hospitals 17 18 17 8 7Pharmaceuticals 30 37 19 46 36Total Deals 95 123 68 107 76
SegmentNumber of Deals over quarters (x)
8.1 11.2
27.6
14.7
23.4
19.5
30.9
15.0
14.625.0
7.5
30.1 27.943.0
1.5
10.514.7
22.423.2
10.512.6
9.2
17.9
47.4
31.6
0.0
10.0
20.0
30.0
40.0
50.0
60.0
70.0
80.0
90.0
100.0
Q2 2008 Q3 2008 Q4 2008 Q1 2009 Q2 2009
Quarter
Dea
l V
olu
me
(%
)
Biotechnology Healthcare Equipment Other Healthcare Providers Hospitals Pharmaceuticals
N68F-F1 8
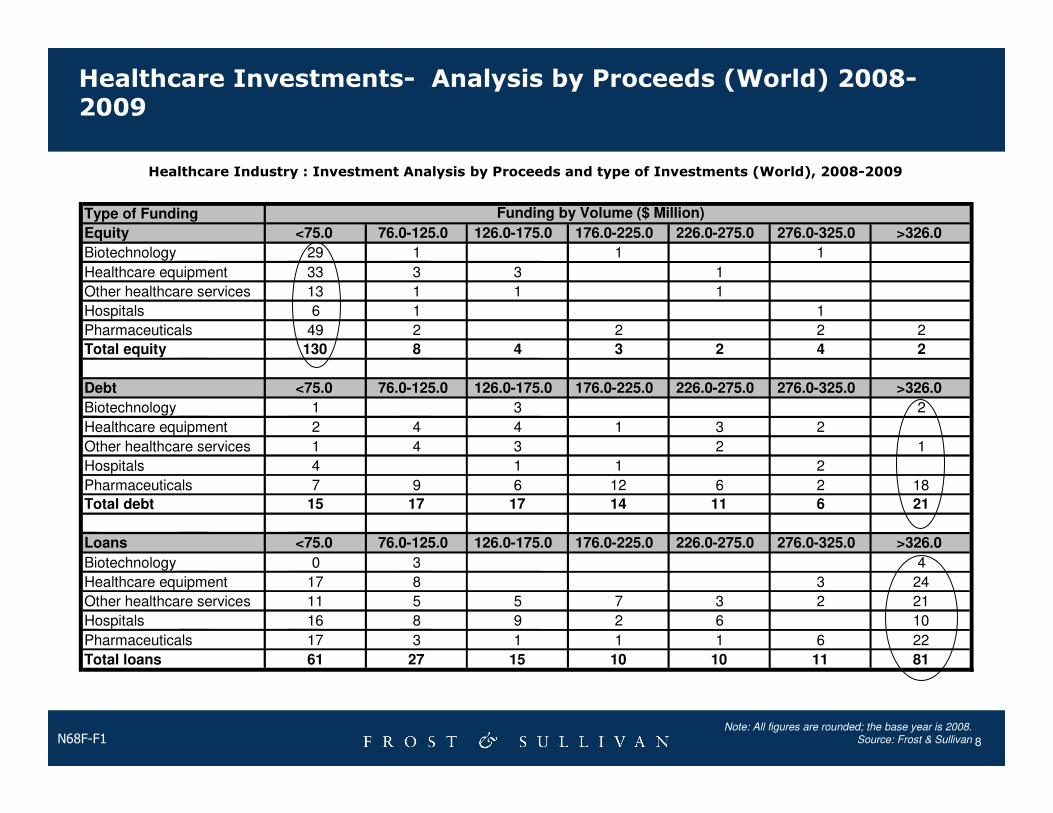
Healthcare Investments- Analysis by Proceeds (World) 2008-2009
Type of Funding
Equity <75.0 76.0-125.0 126.0-175.0 176.0-225.0 226.0-275.0 276.0-325.0 >326.0
Biotechnology 29 1 1 1
Healthcare equipment 33 3 3 1
Other healthcare services 13 1 1 1
Hospitals 6 1 1
Pharmaceuticals 49 2 2 2 2
Total equity 130 8 4 3 2 4 2
Debt <75.0 76.0-125.0 126.0-175.0 176.0-225.0 226.0-275.0 276.0-325.0 >326.0
Biotechnology 1 3 2
Healthcare equipment 2 4 4 1 3 2
Other healthcare services 1 4 3 2 1
Hospitals 4 1 1 2
Pharmaceuticals 7 9 6 12 6 2 18
Total debt 15 17 17 14 11 6 21
Loans <75.0 76.0-125.0 126.0-175.0 176.0-225.0 226.0-275.0 276.0-325.0 >326.0
Biotechnology 0 3 4
Healthcare equipment 17 8 3 24
Other healthcare services 11 5 5 7 3 2 21
Hospitals 16 8 9 2 6 10
Pharmaceuticals 17 3 1 1 1 6 22
Total loans 61 27 15 10 10 11 81
Funding by Volume ($ Million)
Note: All figures are rounded; the base year is 2008. Source: Frost & Sullivan
Healthcare Industry : Investment Analysis by Proceeds and type of Investments (World), 2008-2009
N68F-F1 9
0
10
20
30
40
50
60
70
Biotechnology Healthcare
equipment
Other healthcare
services
Hospitals Pharmaceuticals
Segments
Vo
lum
e (
x)
0.0
10,000.0
20,000.0
30,000.0
40,000.0
50,000.0
60,000.0
Valu
e (
$ M
illio
n)
Equity volume Debt volume Loans volumeEquity amount Debt amount Loans amount
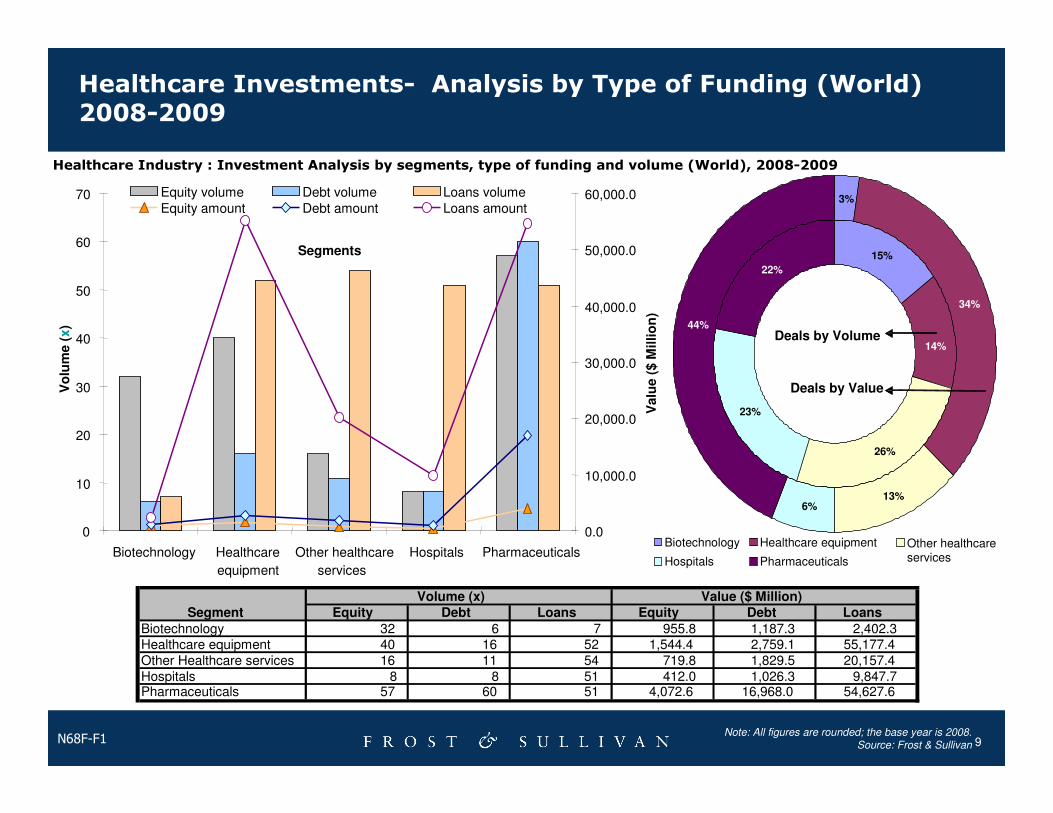
15%
26%
23%
3%
13%6%
14%
22%
44%
34%
Biotechnology Healthcare equipment Other healthcare servicesHospitals Pharmaceuticals
Deals by Volume
Deals by Value
Healthcare Investments- Analysis by Type of Funding (World) 2008-2009
Equity Debt Loans Equity Debt Loans
Biotechnology 32 6 7 955.8 1,187.3 2,402.3Healthcare equipment 40 16 52 1,544.4 2,759.1 55,177.4Other Healthcare services 16 11 54 719.8 1,829.5 20,157.4Hospitals 8 8 51 412.0 1,026.3 9,847.7Pharmaceuticals 57 60 51 4,072.6 16,968.0 54,627.6
Volume (x)Segment
Value ($ Million)
Note: All figures are rounded; the base year is 2008. Source: Frost & Sullivan
Healthcare Industry : Investment Analysis by segments, type of funding and volume (World), 2008-2009

N68F-F1 10
Equity Deals

N68F-F1 11
Stock Markets - An Overview
60.0
70.0
80.0
90.0
100.0
110.0
120.0
130.0
140.0
Jan 0
5
Mar
05
Ma
y 05
Jul 05
Sep 0
5
No
v 05
Jan 0
6
Mar
06
Ma
y 06
Jul 06
Sep 0
6
No
v 06
Jan 0
7
Mar
07
Ma
y 07
Jul 07
Sep 0
7
No
v 07
Jan 0
8
Mar
08
Ma
y 08
Jul 08
Sep 0
8
No
v 08
Jan 0
9
Mar
09
Ma
y 09
Jul 09
Months
Ind
exed
to
100
NASDAQ Biotechnology Index
S&P Healthcare Index
Amex Pharmaceutical Index
Dow Jones Industrial Average
S&P 500
Especially in the recessionary times,
the healthcare index is outperforming
the benchmark S&P 500 and the Dow
Jones Industrial Average handsomely.
NASDAQ Biotech S&P HC Amex Pharma DJ Industrial Average S&P 5001 year 0.1 (0.3) (0.5) (0.1) (0.1)2 year 0.1 (0.4) (0.7) (0.1) (0.0)3 year 0.1 (0.4) (1.0) 0.0 0.04 year 0.1 (0.5) (1.1) (0.0) 0.05 year 0.0 (0.8) (1.7) (0.2) (0.2)6 year 0.2 (2.5) (3.8) (1.5) (1.4)
Investment Horizon
Sharpe's Ratio (%) for Various Indices from August 2002
NASDAQ Biotech S&P HC Amex Pharma DJ Industrial Average S&P 5001 year (0.2) (0.5) (0.7) (0.3) (0.4)2 year (0.4) (0.6) (1.0) (0.4) (0.5)3 year (0.6) (1.6) (2.6) (0.9) (1.1)4 year (2.8) (5.7) (5.2) (4.3) (5.0)
Investment Horizon
Sharpe's Ratio for Various Indices from Jan 2005
Biotech the standout industry
performer in terms of Sharpe's Ratio
Note: All figures are rounded; the base year is 2008. Source: Frost & Sullivan
Healthcare Industry : Stock Markets- An Overview (World), 2005-2009

N68F-F1 12
Debt Deals
N68F-F1 13
3
1
3
3
12
2 5
2417
2 68
1
6
0
5
10
15
20
25
30
35
40
2Q 2008 3Q 2008 4Q 2008 1Q 2009 2Q 2009
Quarters
Deals
(x)
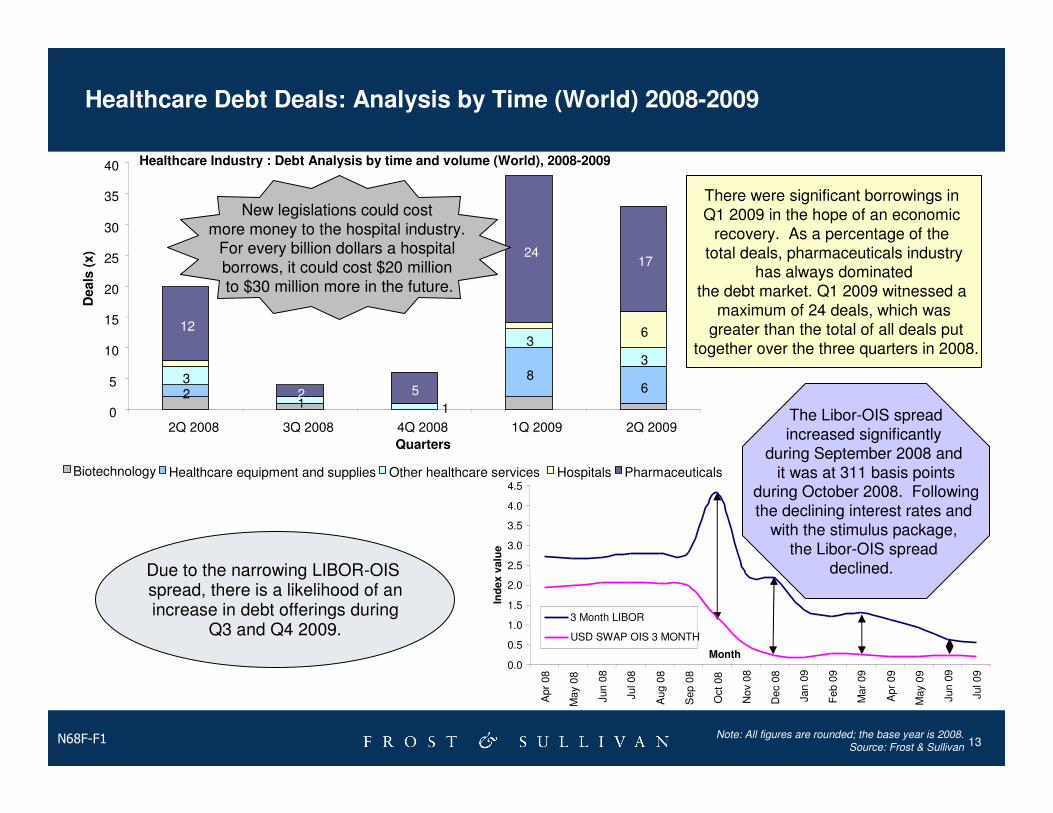
Biotechnology Healthcare equipment and supplies Other healthcare services Hospitals Pharmaceuticals
There were significant borrowings in Q1 2009 in the hope of an economic
recovery. As a percentage of the total deals, pharmaceuticals industry
has always dominated the debt market. Q1 2009 witnessed a
maximum of 24 deals, which wasgreater than the total of all deals put
together over the three quarters in 2008.
New legislations could cost more money to the hospital industry.
For every billion dollars a hospital borrows, it could cost $20 million to $30 million more in the future.
The Libor-OIS spreadincreased significantly
during September 2008 and it was at 311 basis points
during October 2008. Following the declining interest rates and
with the stimulus package, the Libor-OIS spread
declined. Due to the narrowing LIBOR-OIS spread, there is a likelihood of anincrease in debt offerings during
Q3 and Q4 2009.
Healthcare Debt Deals: Analysis by Time (World) 2008-2009
0.0
0.5
1.0
1.5
2.0
2.5
3.0
3.5
4.0
4.5
Apr
08
May
08
Jun 0
8
Jul 08
Aug 0
8
Sep 0
8
Oct
08
Nov
08
Dec 0
8
Jan 0
9
Feb 0
9
Mar
09
Apr
09
May
09
Jun 0
9
Jul 09
Month
Ind
ex v
alu
e
3 Month LIBOR
USD SWAP OIS 3 MONTH
Note: All figures are rounded; the base year is 2008. Source: Frost & Sullivan
Healthcare Industry : Debt Analysis by time and volume (World), 2008-2009

N68F-F1 14
Loan Deals
N68F-F1 15
4
23
9
5
8
8
8
12
3
7
17
13
1
6
2
1
14
2
1
28
16
7
11
7
2
0 10 20 30 40 50 60
<50
50-200
200-500
500-1000
>1000
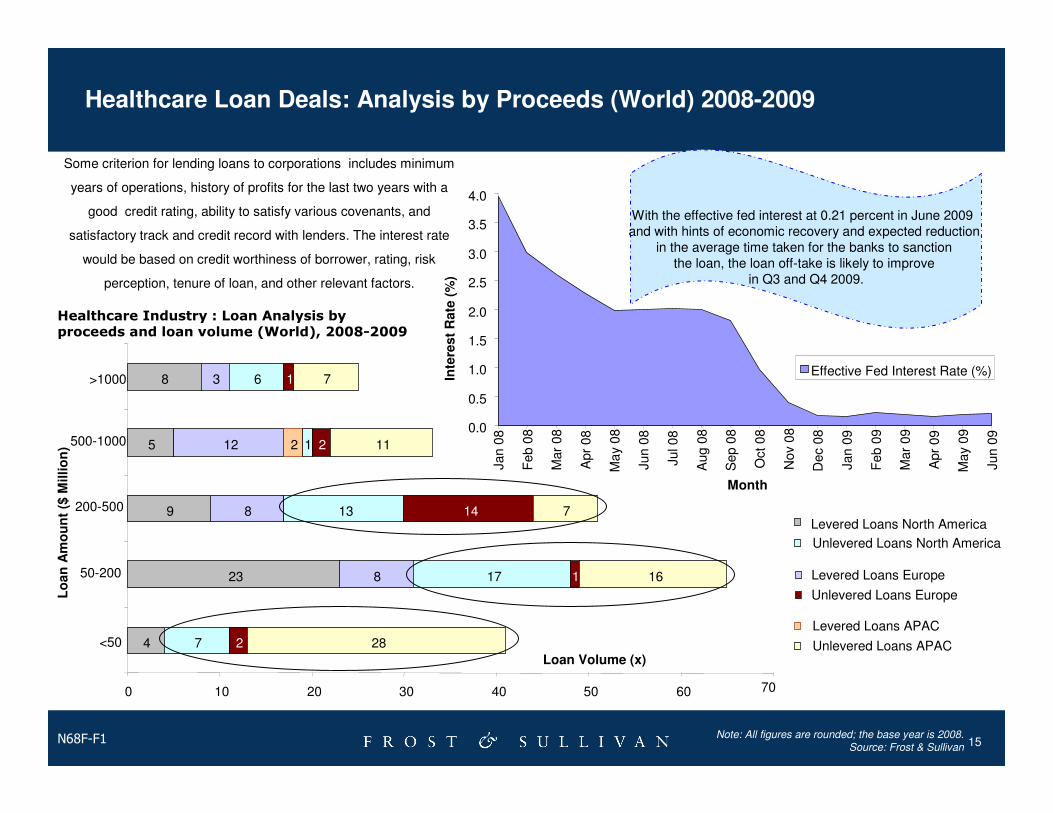
Levered Loans North America
Levered Loans Europe
Levered Loans APAC
Unlevered Loans North America
Unlevered Loans Europe
Unlevered Loans APAC
Some criterion for lending loans to corporations includes minimum
years of operations, history of profits for the last two years with a
good credit rating, ability to satisfy various covenants, and
satisfactory track and credit record with lenders. The interest rate
would be based on credit worthiness of borrower, rating, risk
perception, tenure of loan, and other relevant factors.
With the effective fed interest at 0.21 percent in June 2009 and with hints of economic recovery and expected reduction
in the average time taken for the banks to sanction the loan, the loan off-take is likely to improve
in Q3 and Q4 2009.
0.0
0.5
1.0
1.5
2.0
2.5
3.0
3.5
4.0
Jan 0
8
Feb 0
8
Mar
08
Apr
08
Ma
y 08
Jun 0
8
Jul 0
8
Aug 0
8
Sep 0
8
Oct 08
Nov
08
Dec 0
8
Jan 0
9
Feb 0
9
Mar
09
Apr
09
Ma
y 09
Jun 0
9
Month
Inte
rest
Rate
(%
)
Effective Fed Interest Rate (%)
70
Lo
an
Am
ou
nt
($ M
illio
n)
Loan Volume (x)
Healthcare Loan Deals: Analysis by Proceeds (World) 2008-2009
Note: All figures are rounded; the base year is 2008. Source: Frost & Sullivan
Healthcare Industry : Loan Analysis by proceeds and loan volume (World), 2008-2009

N68F-F1 16
Concluding Thoughts

N68F-F1 17
Some Interesting Facts
• A recent study by Harvard University researchers found that the average out-of-pocket medical debt for those who filed
for bankruptcy was $12,000. The study noted that 68 percent of those who filed for bankruptcy had health insurance. In
addition, the study found that 50 percent of all bankruptcy filings were partly the result of medical expenses. In every 30
seconds in the U.S. someone files for bankruptcy in the aftermath of a serious health problem.
• A new survey shows that more than 25 percent of Americans said that housing problems resulted from medical debt,
including the inability to make rent or mortgage payments and the development of bad credit ratings.
• About 1.5 million American families lose their homes to foreclosure every year due to unaffordable medical costs.
Concluding Thoughts
• Pharmaceutical, drug development, medical technologies, and other life sciences are considered to be attractive sectors
for investment from 2010 to 2015. Historical high growth rates due to increases in health expenditure, growth in the
ageing population coupled with greater incidence in chronic illness, and developments in technology are considered to
be the driving factors behind the attractive investment options.
• Niche areas such as percutaneous valve replacement, bioprosthetics with stem cell seeding on a matrix, and robotics
are expected to be the future in the medical devices industry.
• Policies toward Medicare and Medicaid are expected to have a significant impact on the general ‘health’ of the
healthcare industry.
Conclusion

N68F-F1 18
Next Steps
� Register for the next Chairman’s Series on Growth:
The Growth Excellence Model: Competitive Benchmarking & Growth
Investing (November 3, 2009) (http://www.frost.com/growth)
� Register for Frost & Sullivan’s Growth Opportunity Newsletter and
keep abreast of innovative growth opportunities
(www.frost.com/news)
N68F-F1 19
Your Feedback is Important to Us
Growth Forecasts?
Competitive Structure?
Emerging Trends?
Strategic Recommendations?
Other?
Please inform us by taking our survey.
What would you like to see from Frost & Sullivan?

N68F-F1 20
For Additional Information
Johanna Haynes
Corporate Communications
(210) 247-3870
Lori Salazar-Malone
Sales Manager
Business & Financial Services
(210) 247-2448
Jennifer O’Grady
Research Manager
Business & Financial Services
(214) 887-1818