Embed Size (px)
Citation preview
www.ibef.org
AU TO C O M P O N E N T SDecember 2008
www.ibef.org�
AUTO COMPONENTSDecember 2008
Contents
• Profile of Indian auto component industry
• Growth potential of Indian auto component industry
• India as a manufacturing hub
�
www.ibef.org
PROFILE OF INDIAN AUTO COMPONENTS INDUSTRY
www.ibef.org�
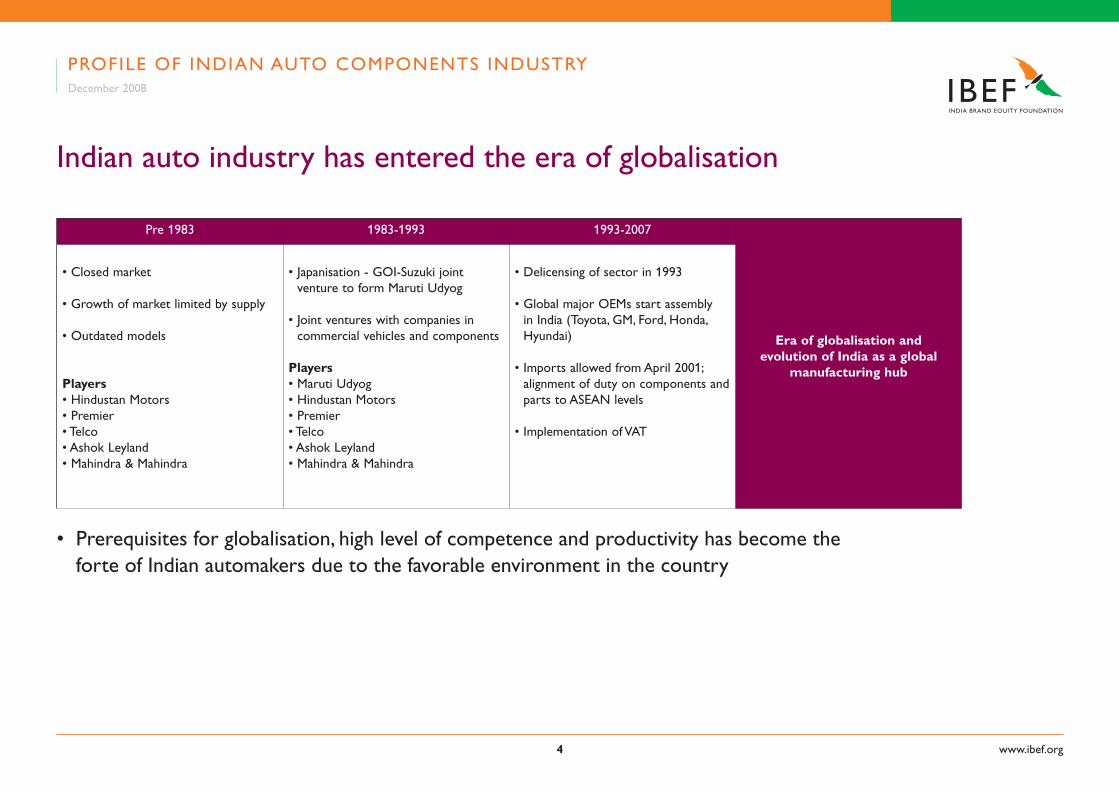
Indian auto industry has entered the era of globalisation
PROFILE OF INDIAN AUTO COMPONENTS INDUSTRYDecember 2008
Pre 1983 1983-1993 1993-2007
Era of globalisation and evolution of India as a global
manufacturing hub
• Closed market
• Growth of market limited by supply
• Outdated models
Players• Hindustan Motors• Premier• Telco• Ashok Leyland• Mahindra & Mahindra
• Japanisation - GOI-Suzuki joint venture to form Maruti Udyog
• Joint ventures with companies in commercial vehicles and components
Players• Maruti Udyog• Hindustan Motors• Premier• Telco• Ashok Leyland• Mahindra & Mahindra
• Delicensing of sector in 1993
• Global major OEMs start assembly in India (Toyota, GM, Ford, Honda, Hyundai)
• Imports allowed from April 2001; alignment of duty on components and parts to ASEAN levels
• Implementation of VAT
• Prerequisites for globalisation, high level of competence and productivity has become the forte of Indian automakers due to the favorable environment in the country
www.ibef.org�
Indian automobile industry crossed a historic landmark: 10 million vehicles in 2006-07
• The Indian auto industry has the potential to emerge as one of the largest in the world. Presently, India is
• Second largest two wheeler market in the world
• Fourth largest commercial vehicle market in the world
• 11th largest passenger car in the world and is expected to be the seventh largest market by 2016
Automotive Production Million units
2007-08
2006-07
2005-06
2004-05
2003-04
2002-03
10.83
11.09
9.74
8.47
7.24
6.28
11.5%CAGR
PROFILE OF INDIAN AUTO COMPONENTS INDUSTRYDecember 2008
0 2 4 6 8 10 12
Segment Share in total CAGR
Two wheelers 74.1% 9.6%
Passenger vehicles 16.3% 19.5%
Three wheelers 4.6% 12.6%
Commercial vehicles 5.0% 21.8%
Source: SIAM, IMaCS analysis
www.ibef.org�
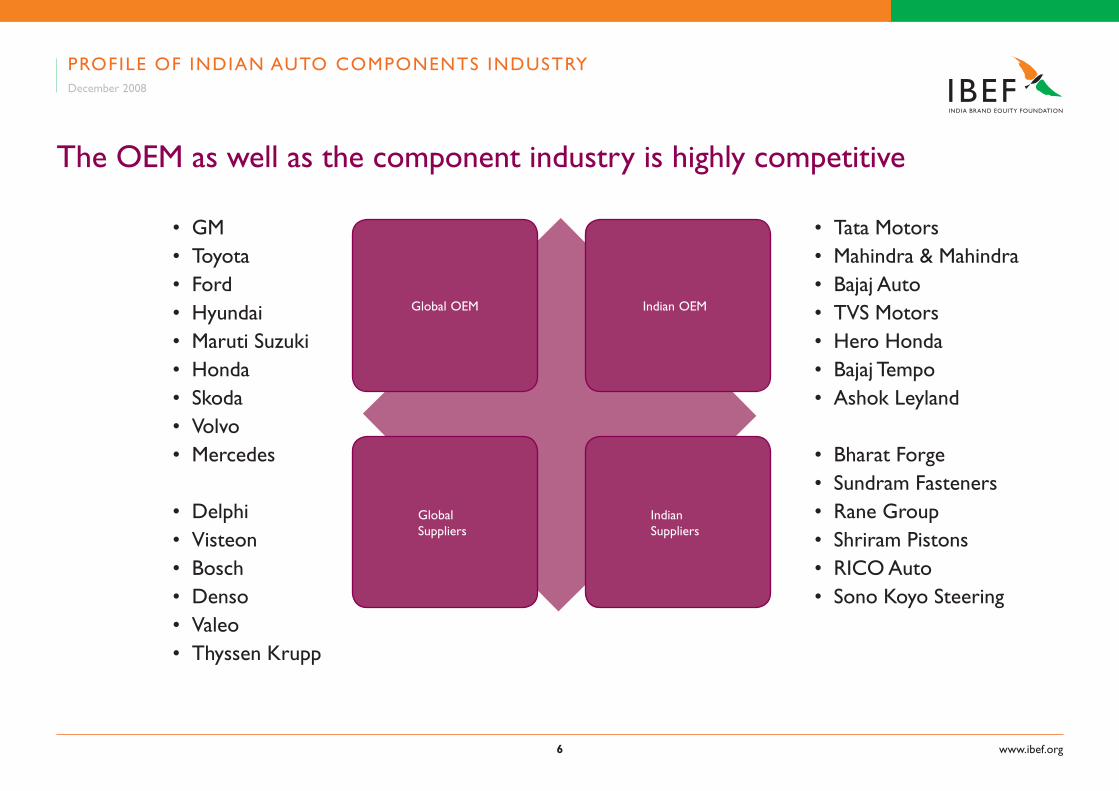
The OEM as well as the component industry is highly competitive
• Tata Motors• Mahindra & Mahindra• Bajaj Auto• TVS Motors• Hero Honda• Bajaj Tempo• Ashok Leyland
• Bharat Forge• Sundram Fasteners• Rane Group• Shriram Pistons• RICO Auto• Sono Koyo Steering
Global OEM Indian OEM
Global Suppliers
Indian Suppliers
• GM • Toyota • Ford • Hyundai • Maruti Suzuki • Honda • Skoda• Volvo• Mercedes
• Delphi• Visteon• Bosch• Denso• Valeo• Thyssen Krupp
PROFILE OF INDIAN AUTO COMPONENTS INDUSTRYDecember 2008
www.ibef.org�
The OEM as well as the component industry is highly competitive
• The Indian auto industry is highly competitive with a number of global and Indian auto companies present
• The supplier industry is equally competitive with a mix of global and Indian players
PROFILE OF INDIAN AUTO COMPONENTS INDUSTRYDecember 2008
www.ibef.org�
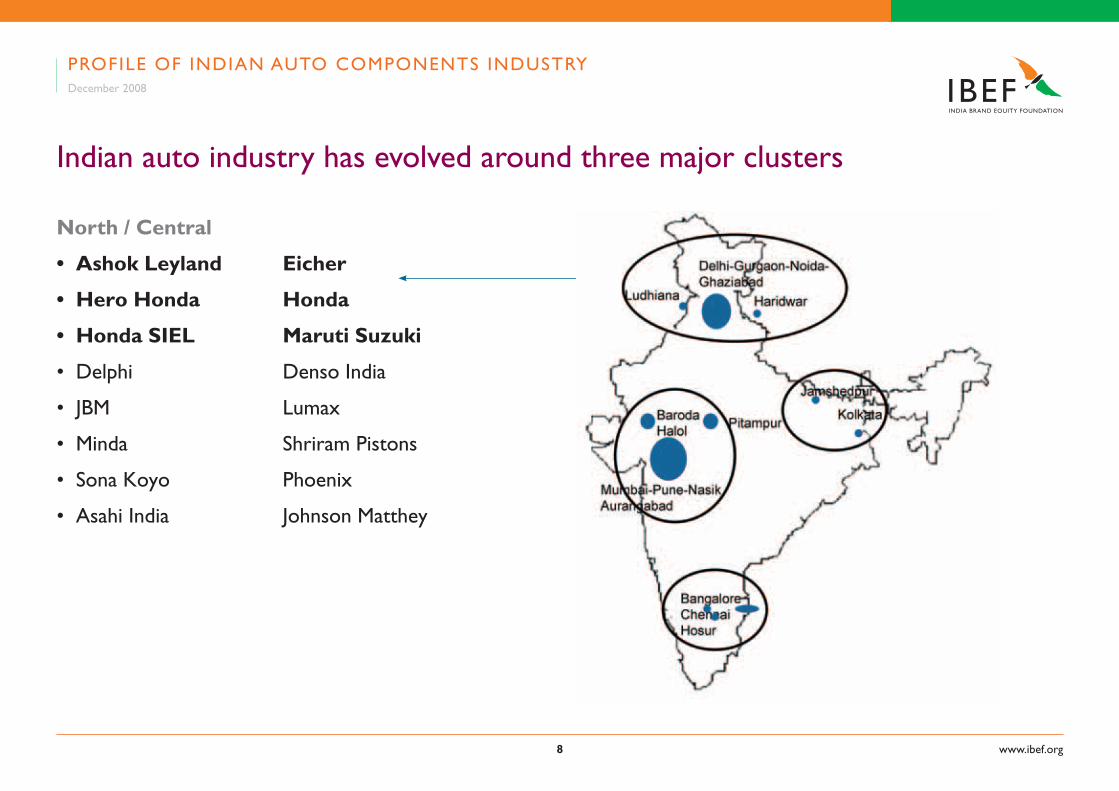
Indian auto industry has evolved around three major clusters
North / Central
• Ashok Leyland Eicher
• Hero Honda Honda
• Honda SIEL Maruti Suzuki
• Delphi Denso India
• JBM Lumax
• Minda Shriram Pistons
• Sona Koyo Phoenix
• Asahi India Johnson Matthey
PROFILE OF INDIAN AUTO COMPONENTS INDUSTRYDecember 2008
www.ibef.org�
Indian auto industry has evolved around three major clusters
West
• Ashok Leyland • Bajaj Auto
• Daimler Chrysler • FIAT
• GM • M & M
• Skoda • Tata Motors
• Bharat Forge • Bright Brothers
• DGP Hinoday • Endurance Systems
• Kirloskar Brothers • Kalyani Brakes
• SKF Bearings • Tata Johnson
• Supreme Ind • NRB
PROFILE OF INDIAN AUTO COMPONENTS INDUSTRYDecember 2008
www.ibef.org10
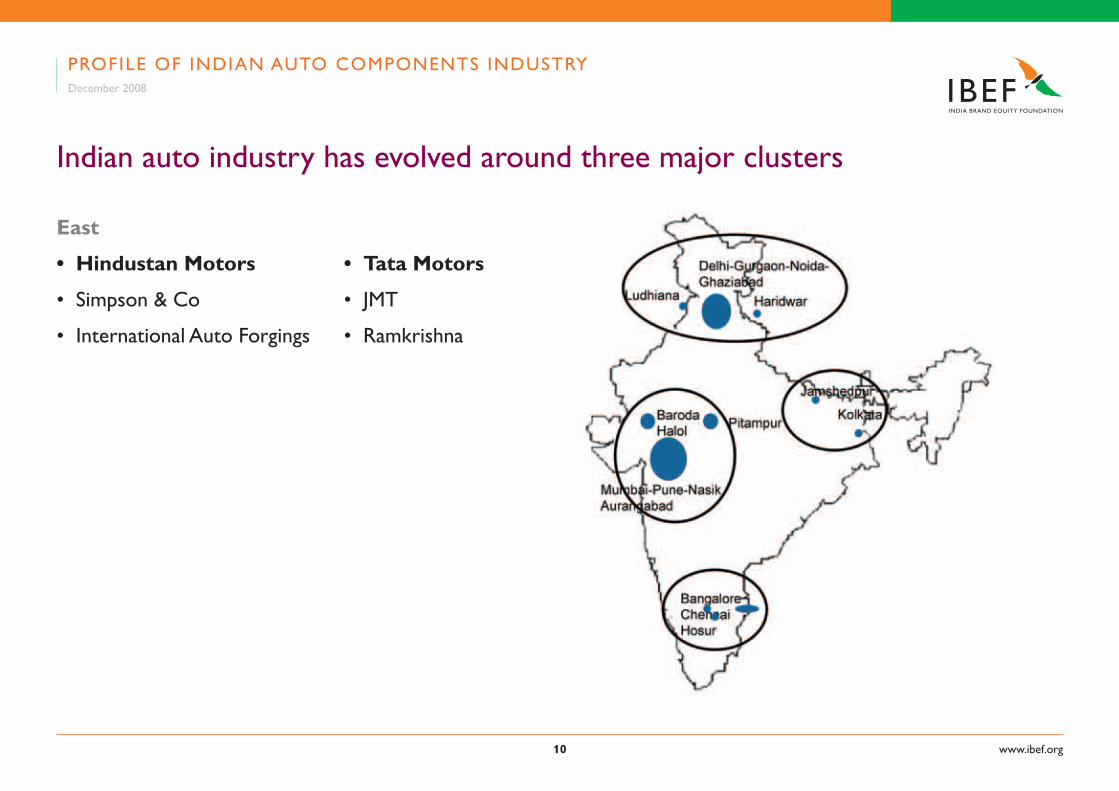
Indian auto industry has evolved around three major clusters
East
• Hindustan Motors • Tata Motors
• Simpson & Co • JMT
• International Auto Forgings • Ramkrishna
PROFILE OF INDIAN AUTO COMPONENTS INDUSTRYDecember 2008
www.ibef.org11
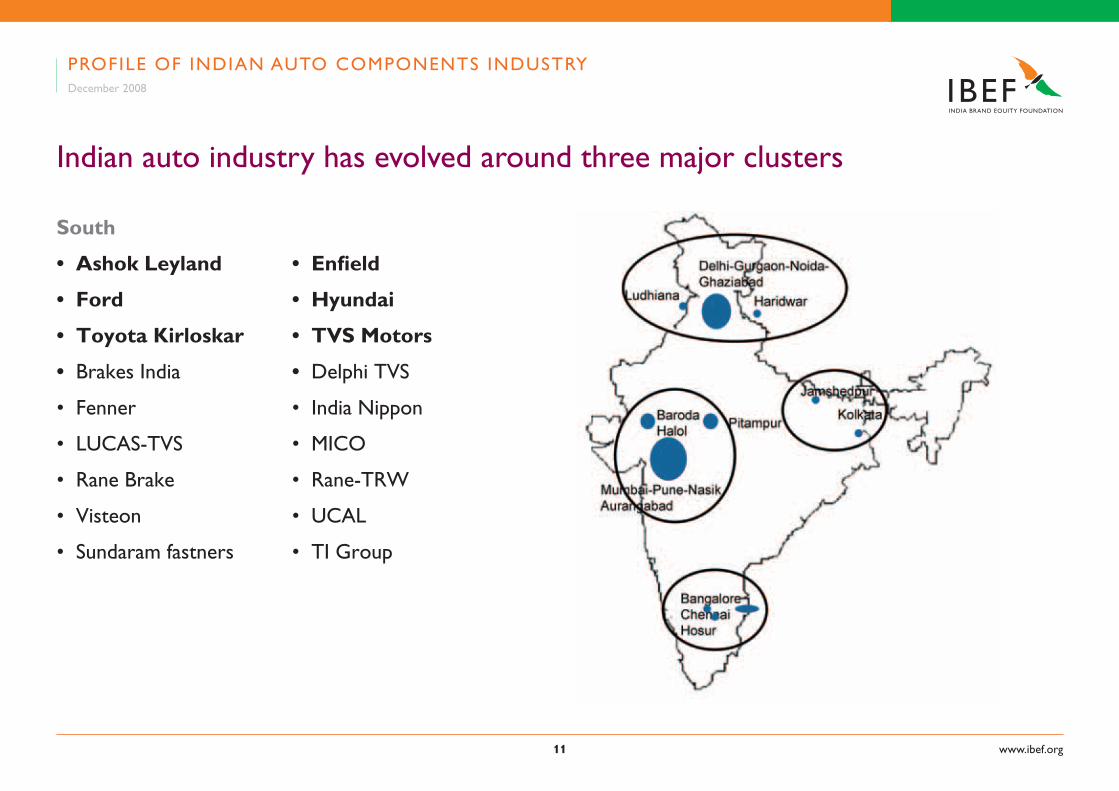
Indian auto industry has evolved around three major clusters
South
• Ashok Leyland • Enfield
• Ford • Hyundai
• Toyota Kirloskar • TVS Motors
• Brakes India • Delphi TVS
• Fenner • India Nippon
• LUCAS-TVS • MICO
• Rane Brake • Rane-TRW
• Visteon • UCAL
• Sundaram fastners • TI Group
PROFILE OF INDIAN AUTO COMPONENTS INDUSTRYDecember 2008
www.ibef.org1�
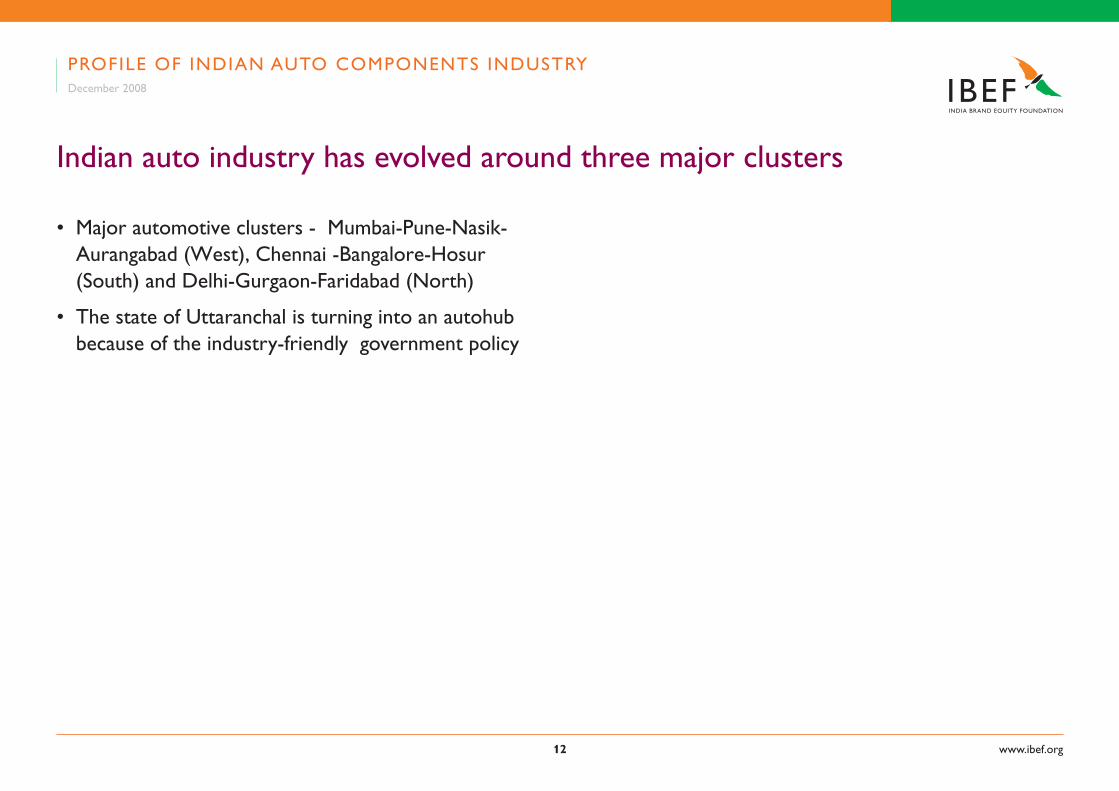
Indian auto industry has evolved around three major clusters
• Major automotive clusters - Mumbai-Pune-Nasik-Aurangabad (West), Chennai -Bangalore-Hosur (South) and Delhi-Gurgaon-Faridabad (North)
• The state of Uttaranchal is turning into an autohub because of the industry-friendly government policy
PROFILE OF INDIAN AUTO COMPONENTS INDUSTRYDecember 2008
www.ibef.org1�
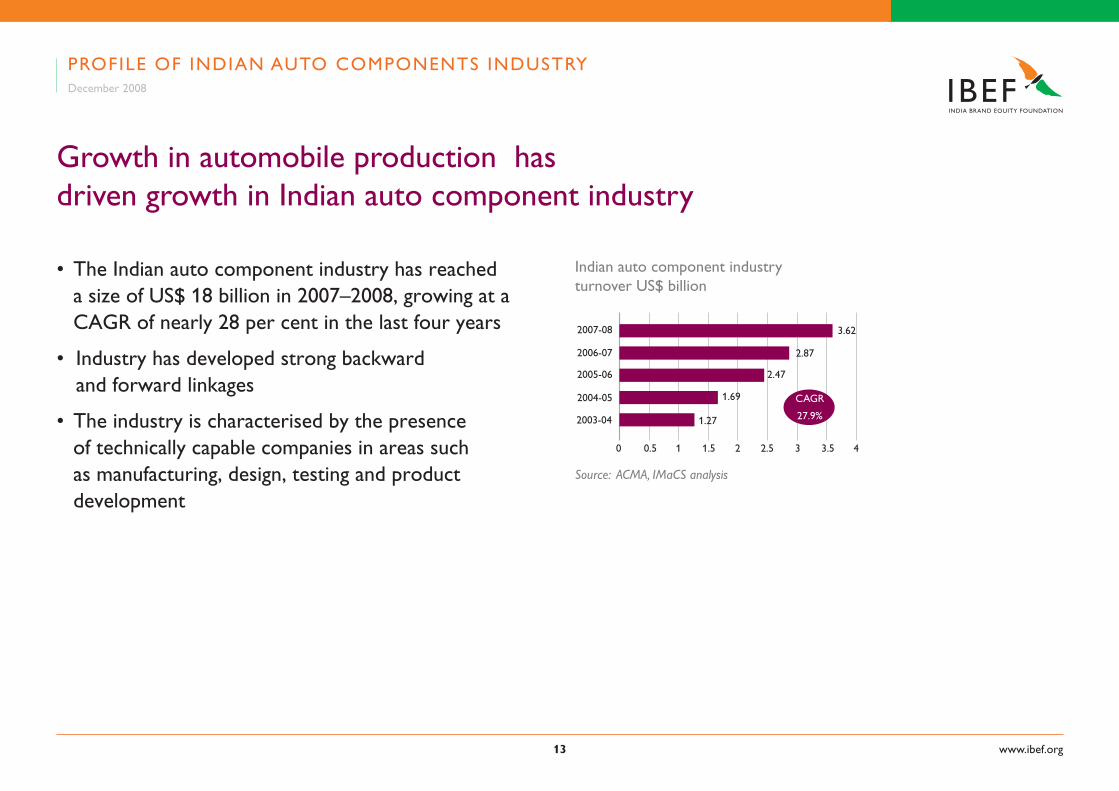
Growth in automobile production has driven growth in Indian auto component industry
• The Indian auto component industry has reached a size of US$ 18 billion in 2007–2008, growing at a CAGR of nearly 28 per cent in the last four years
• Industry has developed strong backward and forward linkages
• The industry is characterised by the presence of technically capable companies in areas such as manufacturing, design, testing and product development
Indian auto component industry turnover US$ billion
Source: ACMA, IMaCS analysis
2004-05
2003-04
3.62
2.87
2.47
1.69
1.27
CAGR
27.9%
2005-06
2006-07
2007-08
PROFILE OF INDIAN AUTO COMPONENTS INDUSTRYDecember 2008
0 0.5 1 1.5 2 2.5 3 3.5 4
www.ibef.org1�
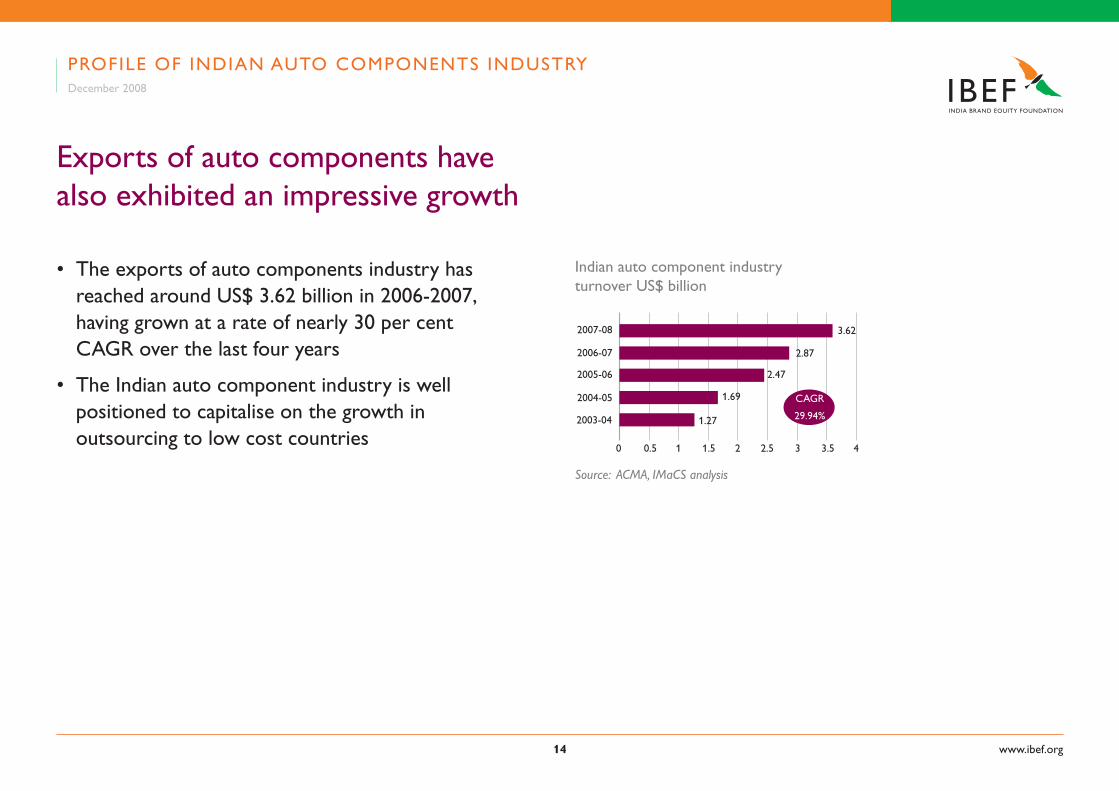
Exports of auto components have also exhibited an impressive growth
• The exports of auto components industry has reached around US$ 3.62 billion in 2006-2007, having grown at a rate of nearly 30 per cent CAGR over the last four years
• The Indian auto component industry is well positioned to capitalise on the growth in outsourcing to low cost countries
PROFILE OF INDIAN AUTO COMPONENTS INDUSTRYDecember 2008
Indian auto component industry turnover US$ billion
Source: ACMA, IMaCS analysis
2004-05
2003-04
3.62
2.87
2.47
1.69
1.27
CAGR
29.94%
2005-06
2006-07
2007-08
0 0.5 1 1.5 2 2.5 3 3.5 4
www.ibef.org1�
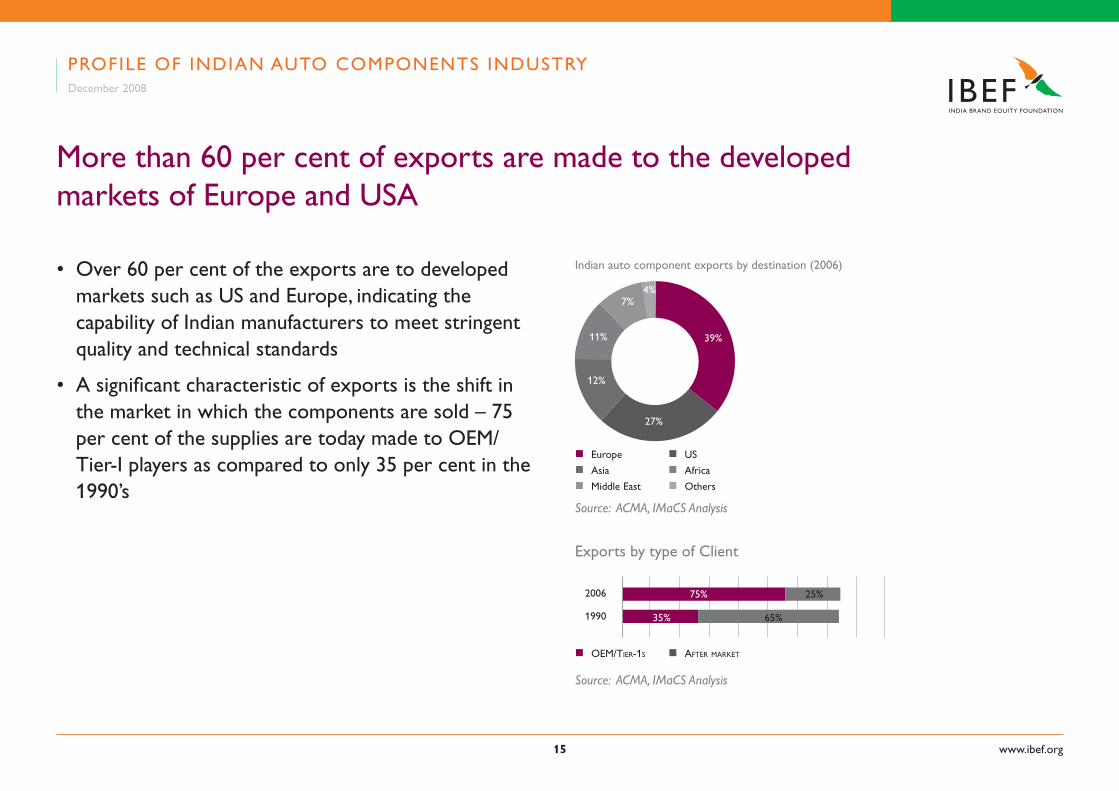
More than 60 per cent of exports are made to the developed markets of Europe and USA
• Over 60 per cent of the exports are to developed markets such as US and Europe, indicating the capability of Indian manufacturers to meet stringent quality and technical standards
• A significant characteristic of exports is the shift in the market in which the components are sold – 75 per cent of the supplies are today made to OEM/Tier-I players as compared to only 35 per cent in the 1990’s
Indian auto component exports by destination (2006)
Source: ACMA, IMaCS Analysis
n Europe n US n Asia n Africa
n Middle East n Others
39%
27%
12%
7%4%
11%
Exports by type of Client
Source: ACMA, IMaCS Analysis
1990
2006 25%75%
65%35%
n OEM/TiEr-1s n AfTEr MArkET
PROFILE OF INDIAN AUTO COMPONENTS INDUSTRYDecember 2008
www.ibef.org1�
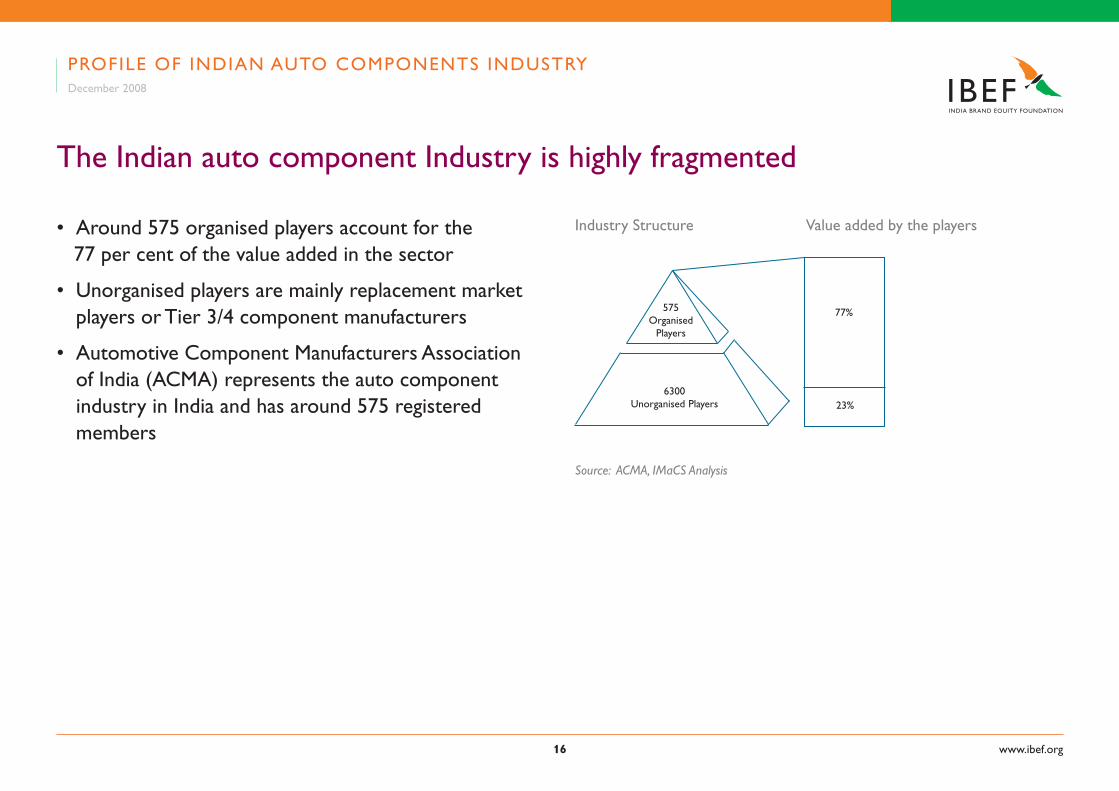
The Indian auto component Industry is highly fragmented
• Around 575 organised players account for the 77 per cent of the value added in the sector
• Unorganised players are mainly replacement market players or Tier 3/4 component manufacturers
• Automotive Component Manufacturers Association of India (ACMA) represents the auto component industry in India and has around 575 registered members
575Organised
Players
6300Unorganised Players
77%
23%
Industry Structure Value added by the players
Source: ACMA, IMaCS Analysis
PROFILE OF INDIAN AUTO COMPONENTS INDUSTRYDecember 2008
www.ibef.org1�
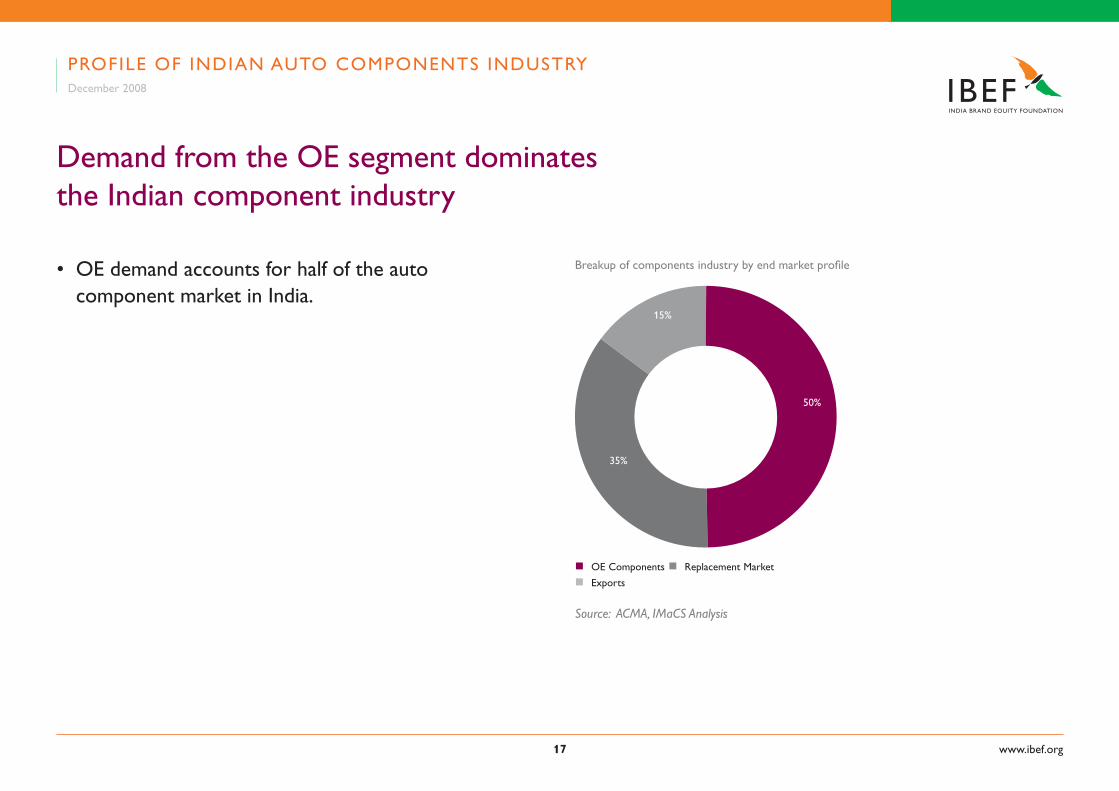
Demand from the OE segment dominates the Indian component industry
• OE demand accounts for half of the auto component market in India.
Breakup of components industry by end market profile
Source: ACMA, IMaCS Analysis
n OE Components n Replacement Market
n Exports
50%
35%
15%
PROFILE OF INDIAN AUTO COMPONENTS INDUSTRYDecember 2008
www.ibef.org1�
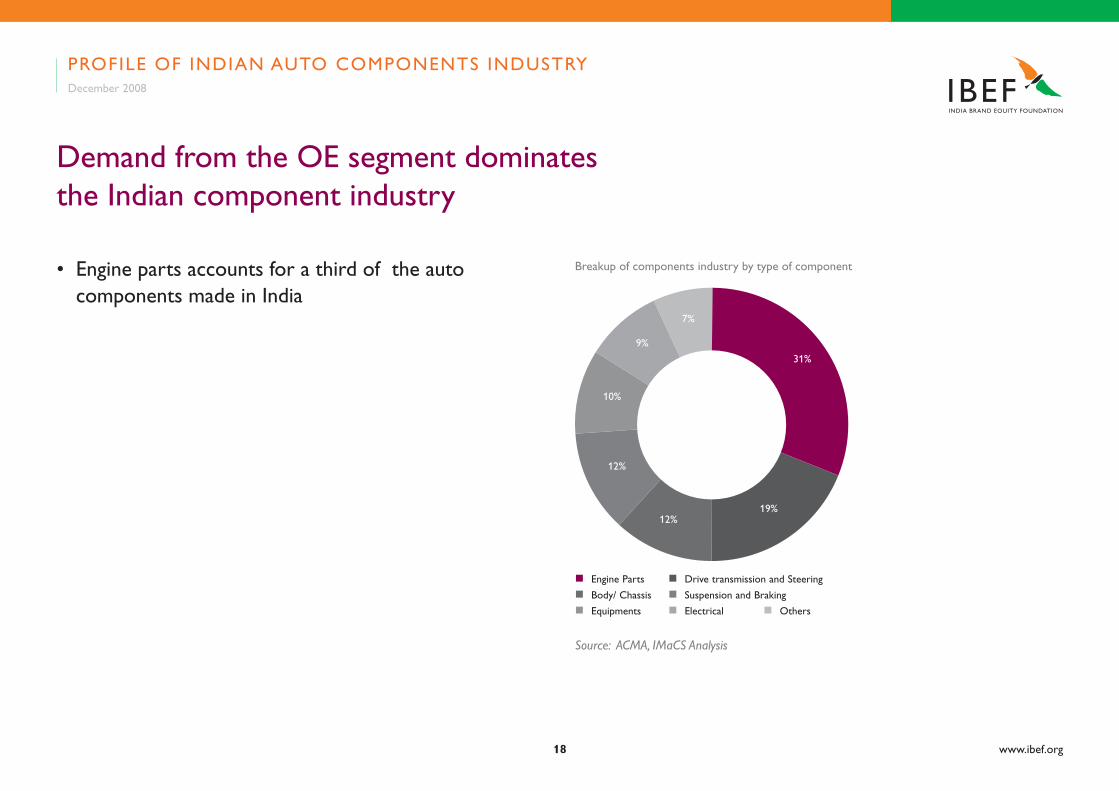
Breakup of components industry by type of component
Source: ACMA, IMaCS Analysis
n Engine Parts n Drive transmission and Steering n Body/ Chassis n Suspension and Braking
n Equipments n Electrical n Others
31%
19%12%
12%
10%
9%
7%
Demand from the OE segment dominates the Indian component industry
• Engine parts accounts for a third of the auto components made in India
PROFILE OF INDIAN AUTO COMPONENTS INDUSTRYDecember 2008
www.ibef.org1�
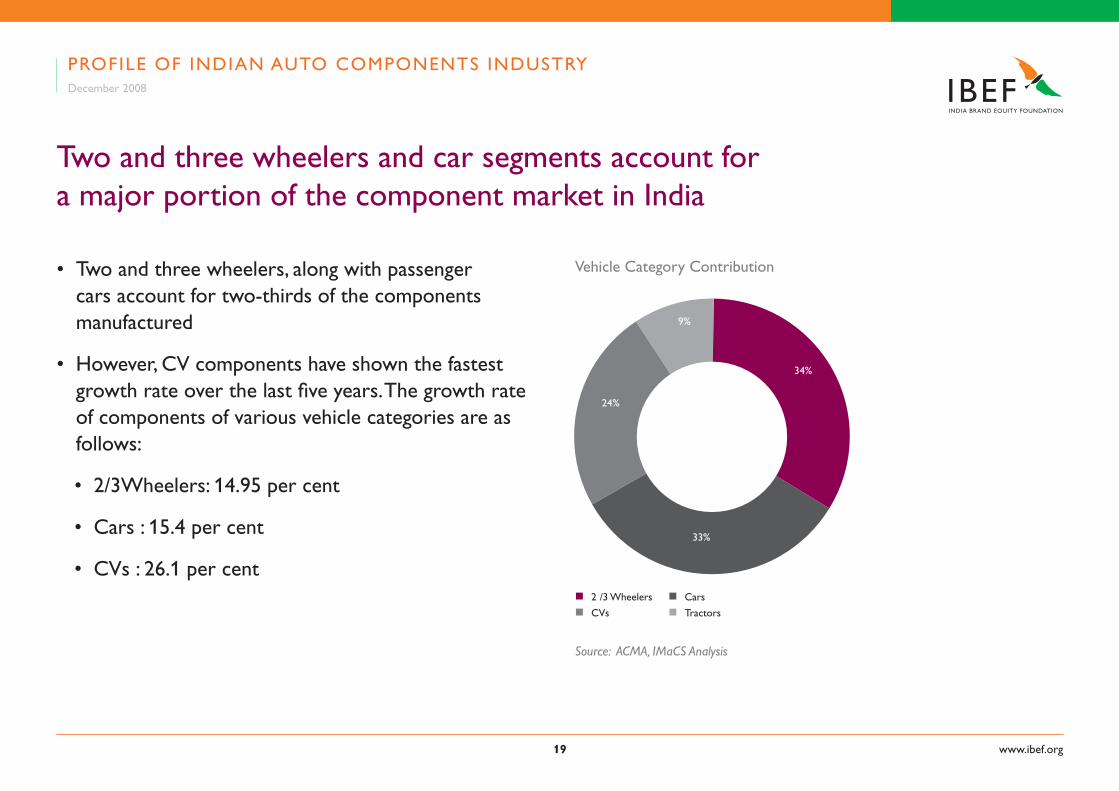
Two and three wheelers and car segments account for a major portion of the component market in India
• Two and three wheelers, along with passenger cars account for two-thirds of the components manufactured
• However, CV components have shown the fastest growth rate over the last five years. The growth rate of components of various vehicle categories are as follows:
• 2/3Wheelers: 14.95 per cent
• Cars : 15.4 per cent
• CVs : 26.1 per cent
Vehicle Category Contribution
Source: ACMA, IMaCS Analysis
n 2 /3 Wheelers n Cars n CVs n Tractors
34%
33%
24%
9%
PROFILE OF INDIAN AUTO COMPONENTS INDUSTRYDecember 2008
www.ibef.org�0
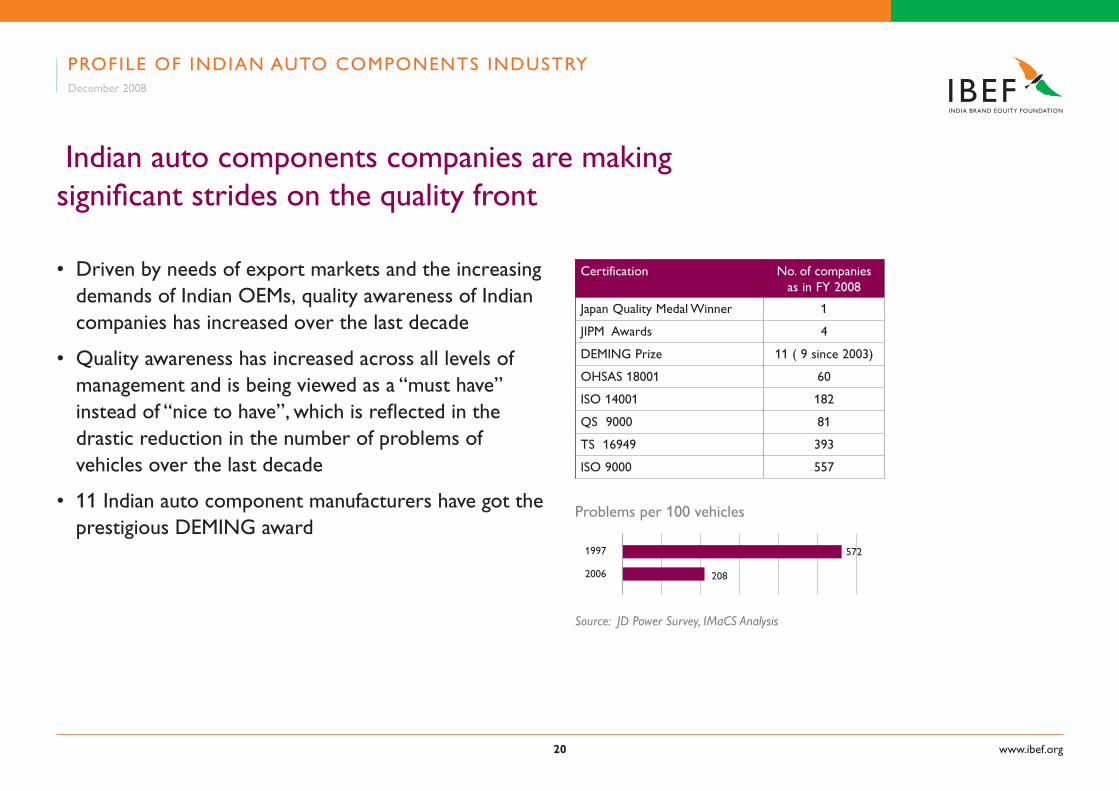
Indian auto components companies are making significant strides on the quality front
• Driven by needs of export markets and the increasing demands of Indian OEMs, quality awareness of Indian companies has increased over the last decade
• Quality awareness has increased across all levels of management and is being viewed as a “must have” instead of “nice to have”, which is reflected in the drastic reduction in the number of problems of vehicles over the last decade
• 11 Indian auto component manufacturers have got the prestigious DEMING award
Certification No. of companies as in FY 2008
Japan Quality Medal Winner 1
JIPM Awards 4
DEMING Prize 11 ( 9 since 2003)
OHSAS 18001 60
ISO 14001 182
QS 9000 81
TS 16949 393
ISO 9000 557
Problems per 100 vehicles
Source: JD Power Survey, IMaCS Analysis
2006
1997 572
208
PROFILE OF INDIAN AUTO COMPONENTS INDUSTRYDecember 2008
www.ibef.org�1
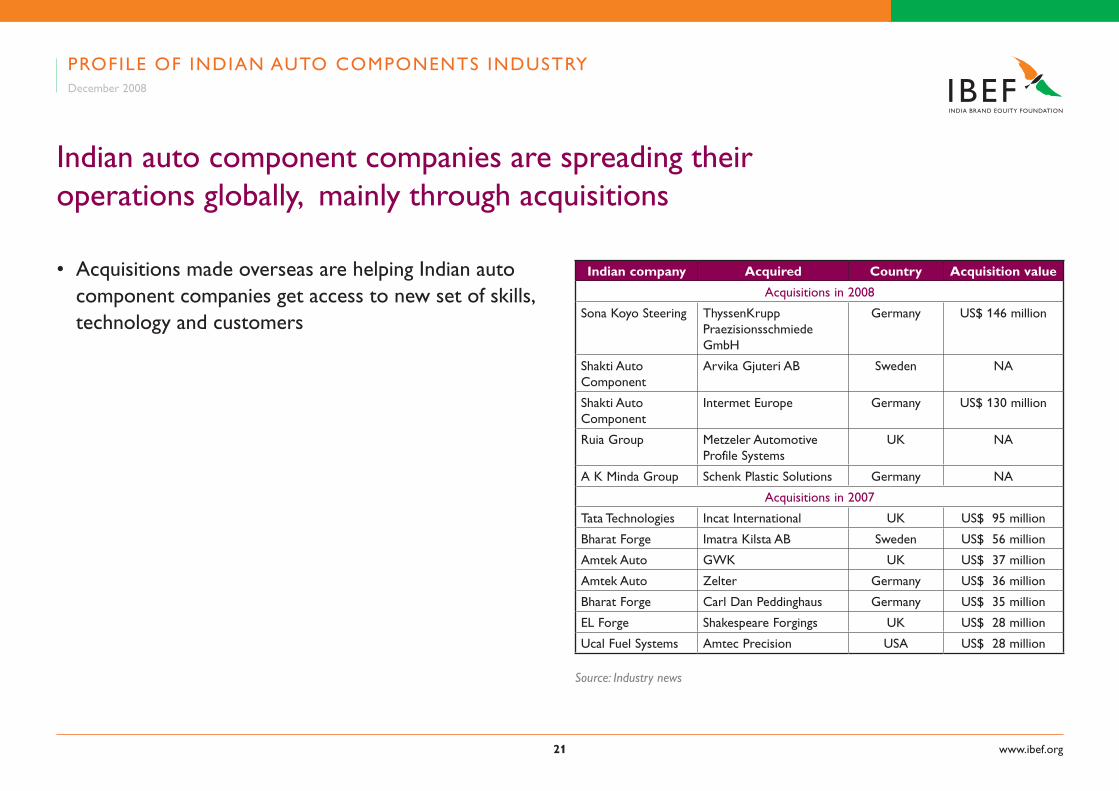
Indian auto component companies are spreading their operations globally, mainly through acquisitions
• Acquisitions made overseas are helping Indian auto component companies get access to new set of skills, technology and customers
Indian company Acquired Country Acquisition value
Acquisitions in 2008
Sona Koyo Steering ThyssenKrupp Praezisionsschmiede GmbH
Germany US$ 146 million
Shakti Auto Component
Arvika Gjuteri AB Sweden NA
Shakti Auto Component
Intermet Europe Germany US$ 130 million
Ruia Group Metzeler Automotive Profile Systems
UK NA
A K Minda Group Schenk Plastic Solutions Germany NA
Acquisitions in 2007
Tata Technologies Incat International UK US$ 95 million
Bharat Forge Imatra Kilsta AB Sweden US$ 56 million
Amtek Auto GWK UK US$ 37 million
Amtek Auto Zelter Germany US$ 36 million
Bharat Forge Carl Dan Peddinghaus Germany US$ 35 million
EL Forge Shakespeare Forgings UK US$ 28 million
Ucal Fuel Systems Amtec Precision USA US$ 28 million
Source: Industry news
PROFILE OF INDIAN AUTO COMPONENTS INDUSTRYDecember 2008
www.ibef.org��
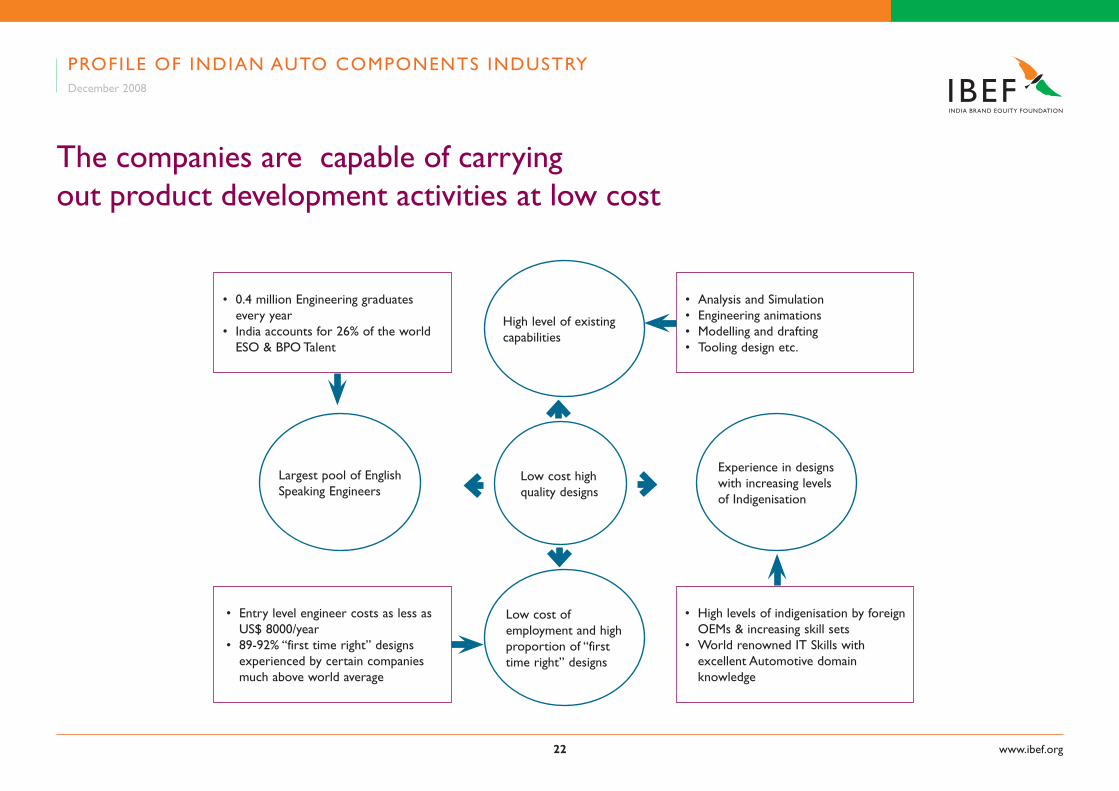
The companies are capable of carrying out product development activities at low cost
High level of existing capabilities
Low cost high quality designs
Low cost of employment and high proportion of “first time right” designs
Experience in designs with increasing levels of Indigenisation
Largest pool of English Speaking Engineers
• 0.4 million Engineering graduates every year
• India accounts for 26% of the world ESO & BPO Talent
• Analysis and Simulation• Engineering animations• Modelling and drafting• Tooling design etc.
• Entry level engineer costs as less as US$ 8000/year
• 89-92% “first time right” designs experienced by certain companies much above world average
• High levels of indigenisation by foreign OEMs & increasing skill sets
• World renowned IT Skills with excellent Automotive domain knowledge
PROFILE OF INDIAN AUTO COMPONENTS INDUSTRYDecember 2008
www.ibef.org��
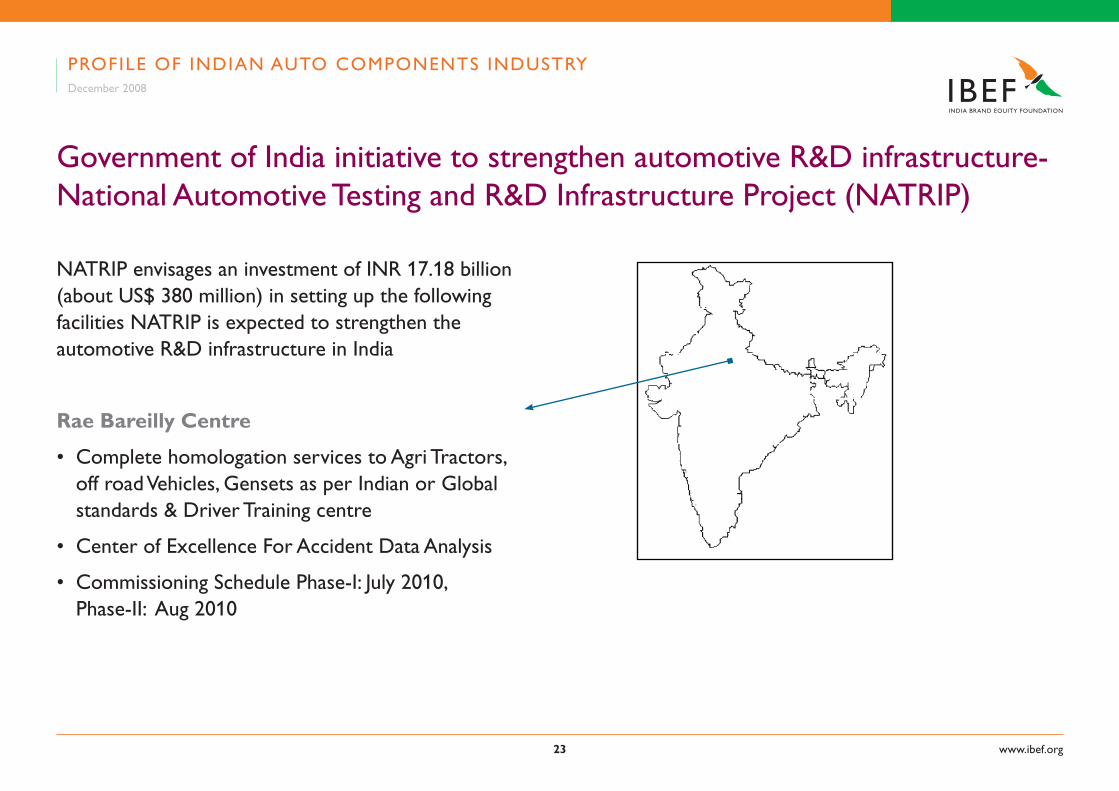
Government of India initiative to strengthen automotive R&D infrastructure- National Automotive Testing and R&D Infrastructure Project (NATRIP)
NATRIP envisages an investment of INR 17.18 billion (about US$ 380 million) in setting up the following facilities NATRIP is expected to strengthen the automotive R&D infrastructure in India
Rae Bareilly Centre
• Complete homologation services to Agri Tractors, off road Vehicles, Gensets as per Indian or Global standards & Driver Training centre
• Center of Excellence For Accident Data Analysis
• Commissioning Schedule Phase-I: July 2010, Phase-II: Aug 2010
PROFILE OF INDIAN AUTO COMPONENTS INDUSTRYDecember 2008
www.ibef.org��
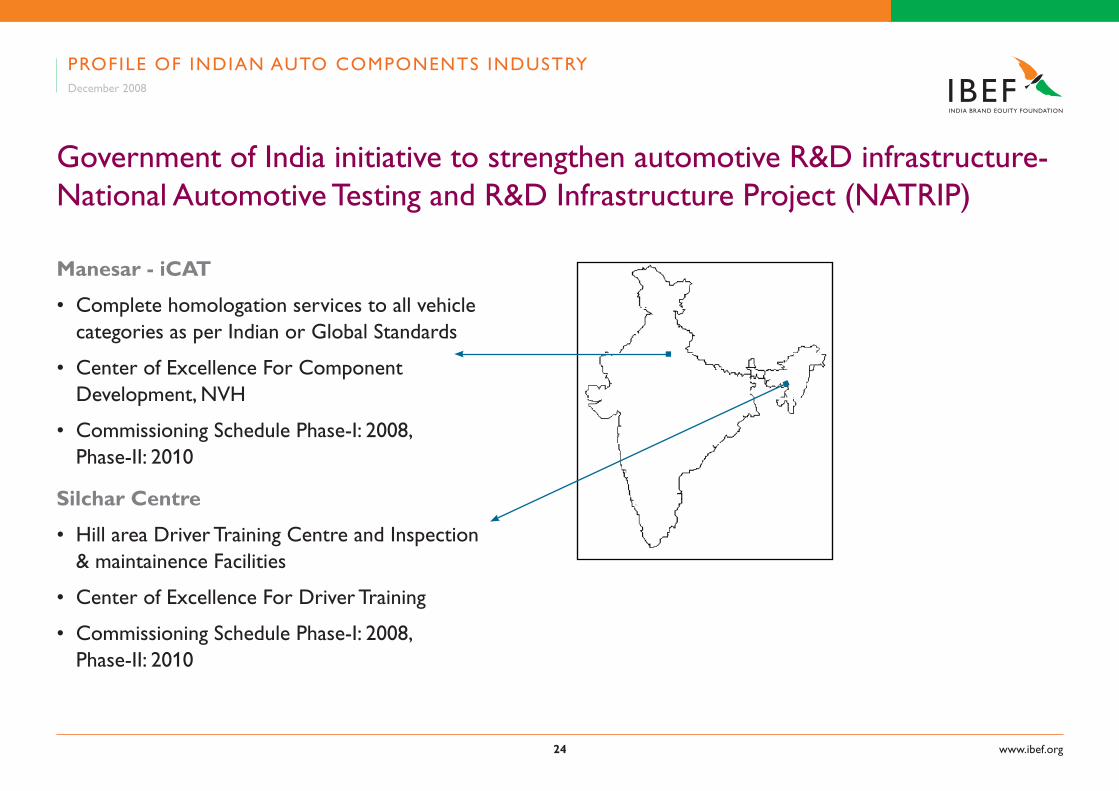
Government of India initiative to strengthen automotive R&D infrastructure- National Automotive Testing and R&D Infrastructure Project (NATRIP)
Manesar - iCAT
• Complete homologation services to all vehicle categories as per Indian or Global Standards
• Center of Excellence For Component Development, NVH
• Commissioning Schedule Phase-I: 2008, Phase-II: 2010
Silchar Centre
• Hill area Driver Training Centre and Inspection & maintainence Facilities
• Center of Excellence For Driver Training
• Commissioning Schedule Phase-I: 2008, Phase-II: 2010
PROFILE OF INDIAN AUTO COMPONENTS INDUSTRYDecember 2008
www.ibef.org��
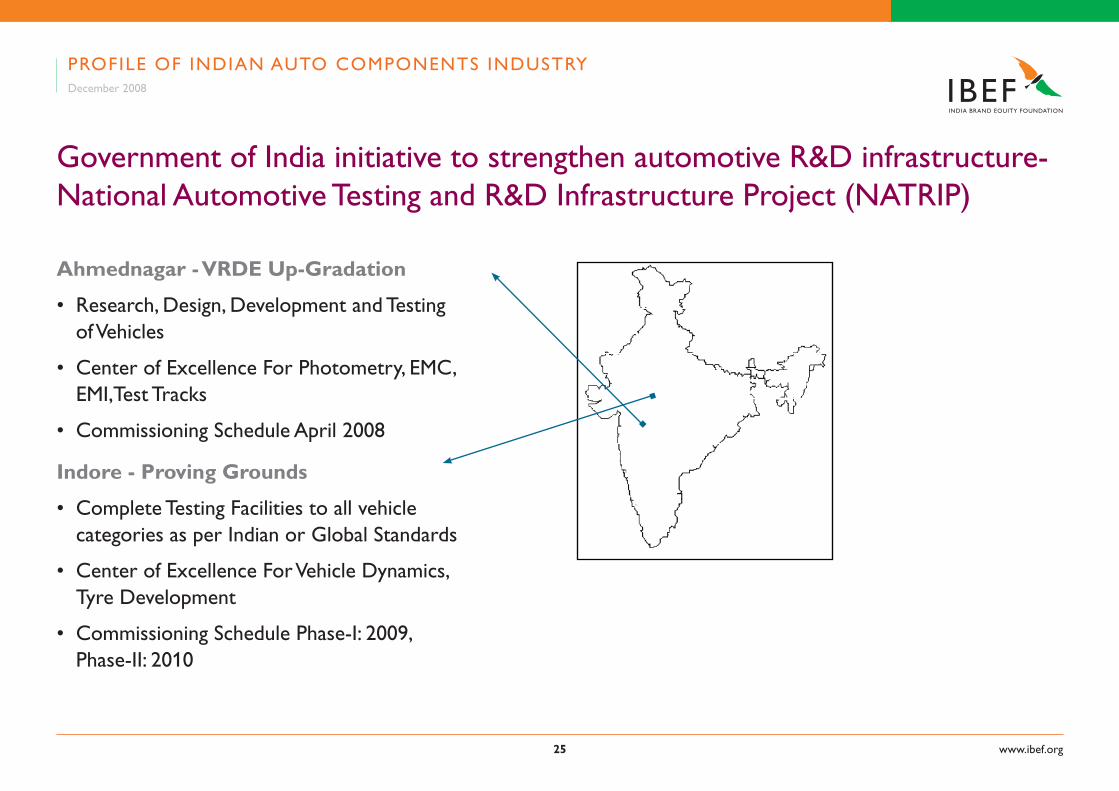
Government of India initiative to strengthen automotive R&D infrastructure- National Automotive Testing and R&D Infrastructure Project (NATRIP)
Ahmednagar - VRDE Up-Gradation
• Research, Design, Development and Testing of Vehicles
• Center of Excellence For Photometry, EMC, EMI,Test Tracks
• Commissioning Schedule April 2008
Indore - Proving Grounds
• Complete Testing Facilities to all vehicle categories as per Indian or Global Standards
• Center of Excellence For Vehicle Dynamics, Tyre Development
• Commissioning Schedule Phase-I: 2009, Phase-II: 2010
PROFILE OF INDIAN AUTO COMPONENTS INDUSTRYDecember 2008
www.ibef.org��
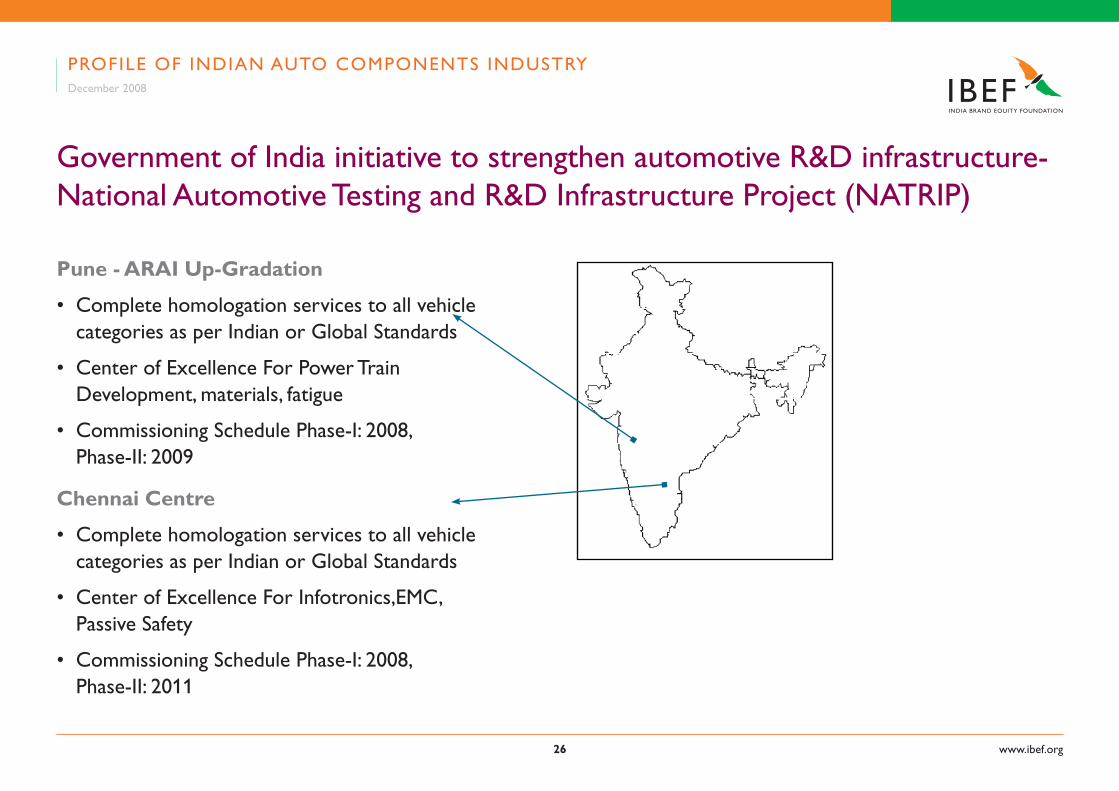
Government of India initiative to strengthen automotive R&D infrastructure- National Automotive Testing and R&D Infrastructure Project (NATRIP)
Pune - ARAI Up-Gradation
• Complete homologation services to all vehicle categories as per Indian or Global Standards
• Center of Excellence For Power Train Development, materials, fatigue
• Commissioning Schedule Phase-I: 2008, Phase-II: 2009
Chennai Centre
• Complete homologation services to all vehicle categories as per Indian or Global Standards
• Center of Excellence For Infotronics,EMC, Passive Safety
• Commissioning Schedule Phase-I: 2008, Phase-II: 2011
PROFILE OF INDIAN AUTO COMPONENTS INDUSTRYDecember 2008
www.ibef.org��
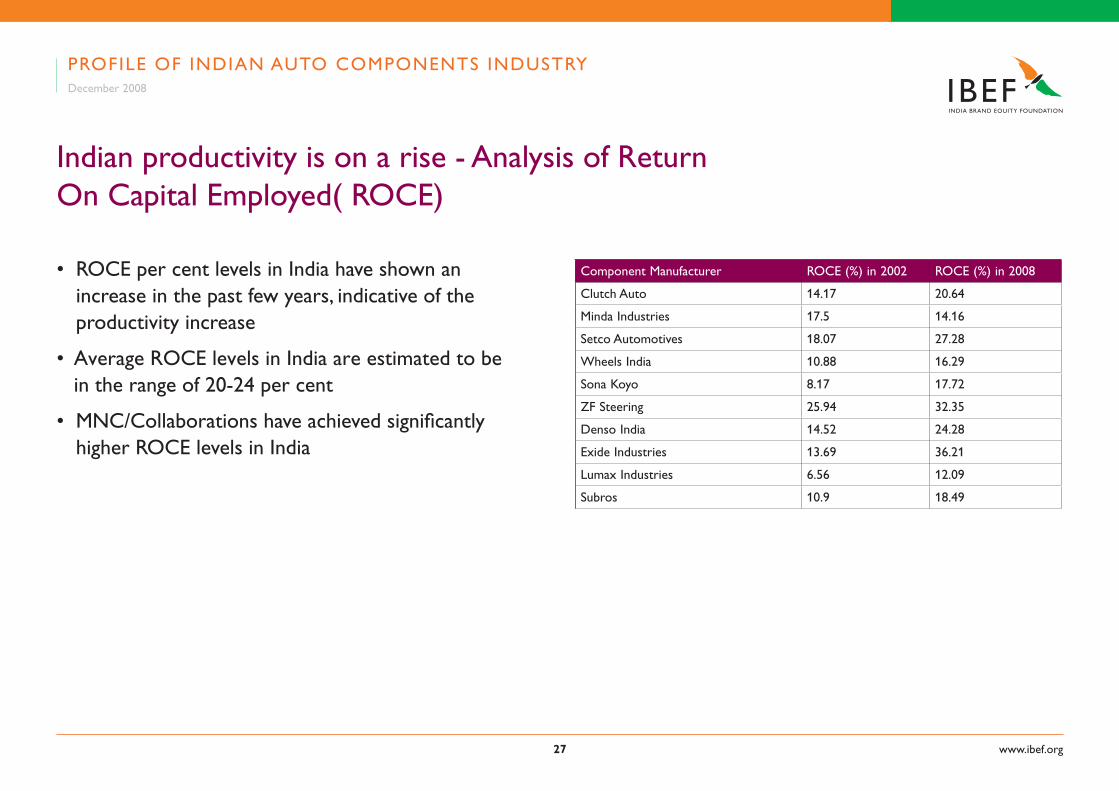
Indian productivity is on a rise - Analysis of Return On Capital Employed( ROCE)
• ROCE per cent levels in India have shown an increase in the past few years, indicative of the productivity increase
• Average ROCE levels in India are estimated to be in the range of 20-24 per cent
• MNC/Collaborations have achieved significantly higher ROCE levels in India
Component Manufacturer ROCE (%) in 2002 ROCE (%) in 2008
Clutch Auto 14.17 20.64
Minda Industries 17.5 14.16
Setco Automotives 18.07 27.28
Wheels India 10.88 16.29
Sona Koyo 8.17 17.72
ZF Steering 25.94 32.35
Denso India 14.52 24.28
Exide Industries 13.69 36.21
Lumax Industries 6.56 12.09
Subros 10.9 18.49
PROFILE OF INDIAN AUTO COMPONENTS INDUSTRYDecember 2008
www.ibef.org��
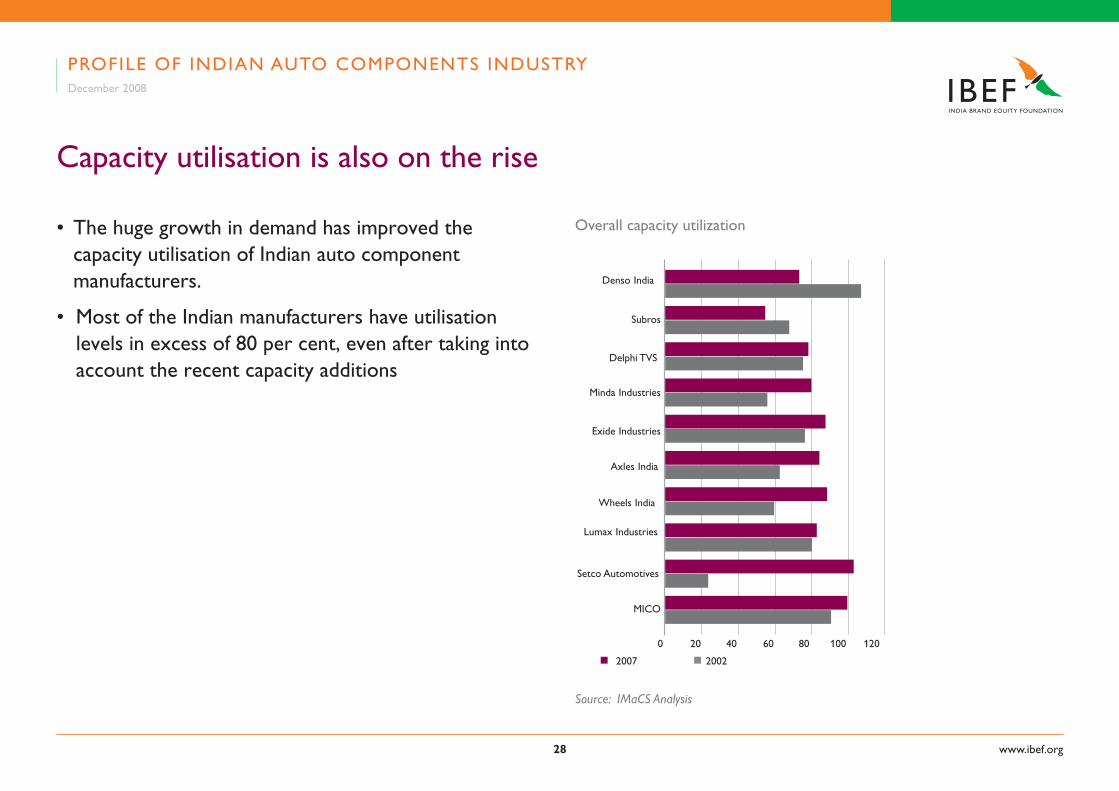
Capacity utilisation is also on the rise
• The huge growth in demand has improved the capacity utilisation of Indian auto component manufacturers.
• Most of the Indian manufacturers have utilisation levels in excess of 80 per cent, even after taking into account the recent capacity additions
Overall capacity utilization
n 2007 n 2002
Source: IMaCS Analysis
Denso India
Subros
Delphi TVS
Minda Industries
Axles India
Wheels India
Lumax Industries
Exide Industries
Setco Automotives
MICO
0 20 40 60 80 100 120
PROFILE OF INDIAN AUTO COMPONENTS INDUSTRYDecember 2008
��
www.ibef.org
GROWTH POTENTIAL OF INDIAN AUTO COMPONENT INDUSTRY
www.ibef.org�0
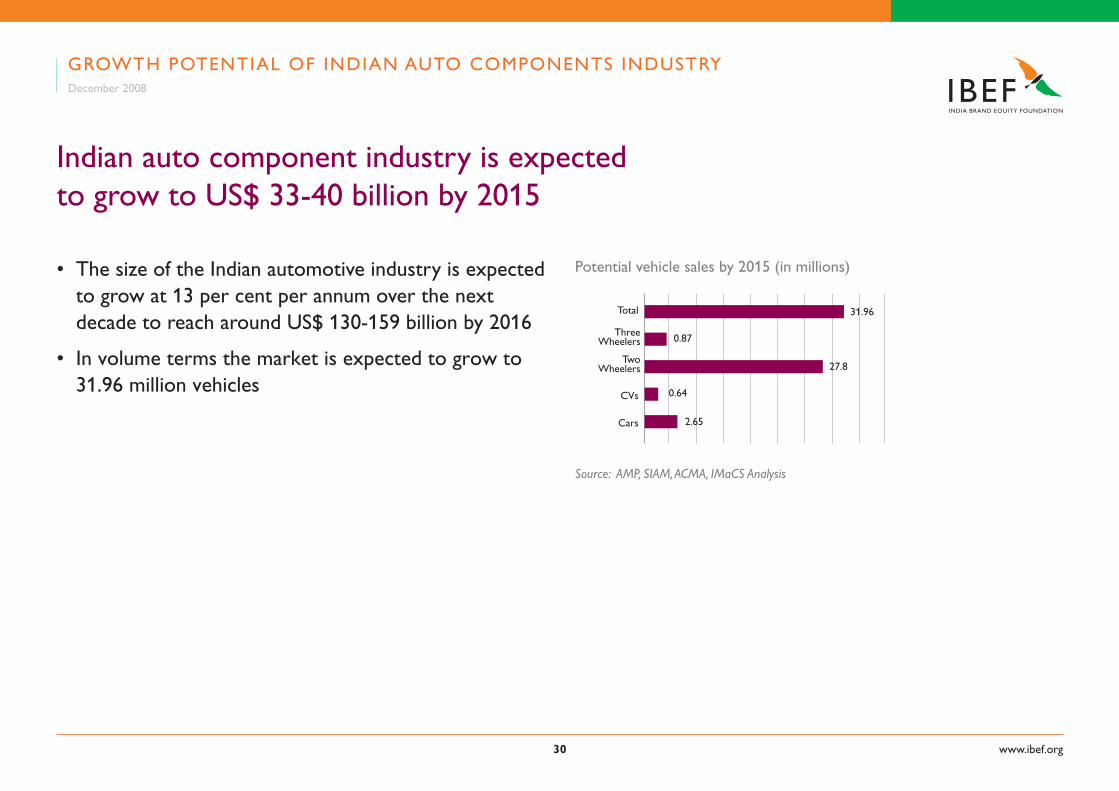
Indian auto component industry is expected to grow to US$ 33-40 billion by 2015
• The size of the Indian automotive industry is expected to grow at 13 per cent per annum over the next decade to reach around US$ 130-159 billion by 2016
• In volume terms the market is expected to grow to 31.96 million vehicles
Potential vehicle sales by 2015 (in millions)
Source: AMP, SIAM, ACMA, IMaCS Analysis
Total
Three Wheelers
CVs
Cars
31.96
0.87
27.8
0.64
2.65
Two Wheelers
GROWTH POTENTIAL OF INDIAN AUTO COMPONENTS INDUSTRYDecember 2008
www.ibef.org�1
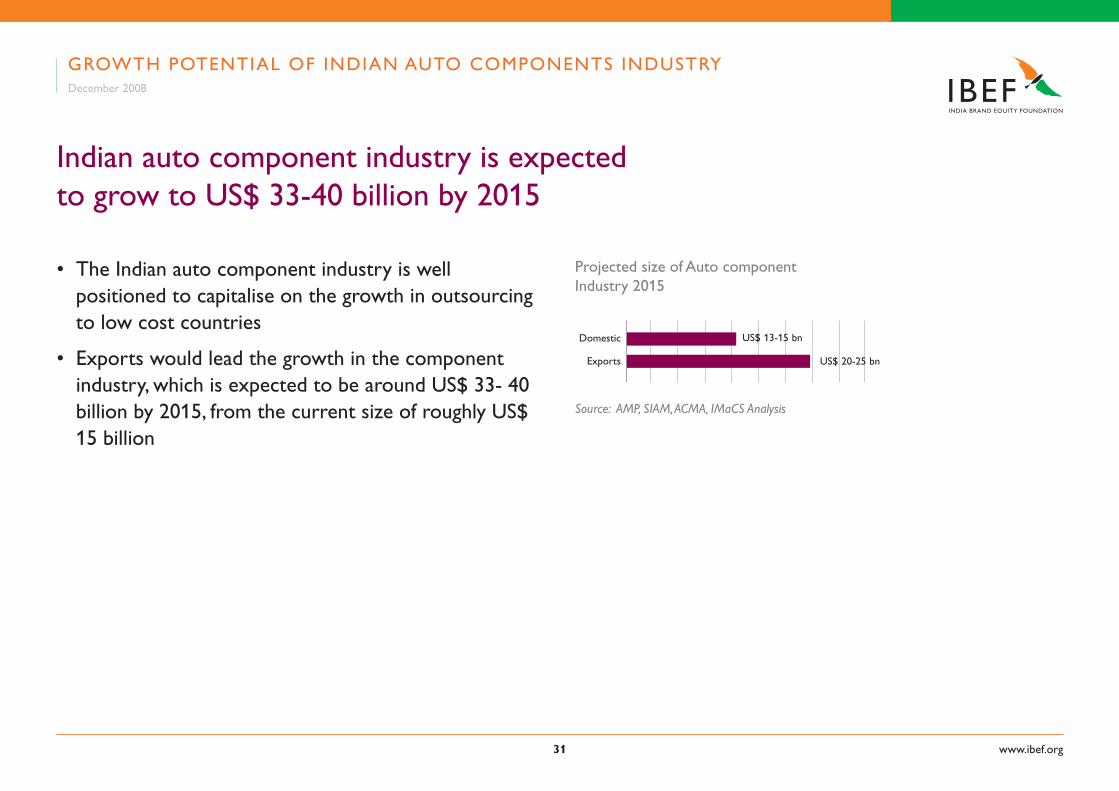
Indian auto component industry is expected to grow to US$ 33-40 billion by 2015
• The Indian auto component industry is well positioned to capitalise on the growth in outsourcing to low cost countries
• Exports would lead the growth in the component industry, which is expected to be around US$ 33- 40 billion by 2015, from the current size of roughly US$ 15 billion
Projected size of Auto component Industry 2015
Source: AMP, SIAM, ACMA, IMaCS Analysis
Exports
Domestic
US$ 20-25 bn
US$ 13-15 bn
GROWTH POTENTIAL OF INDIAN AUTO COMPONENTS INDUSTRYDecember 2008
www.ibef.org��
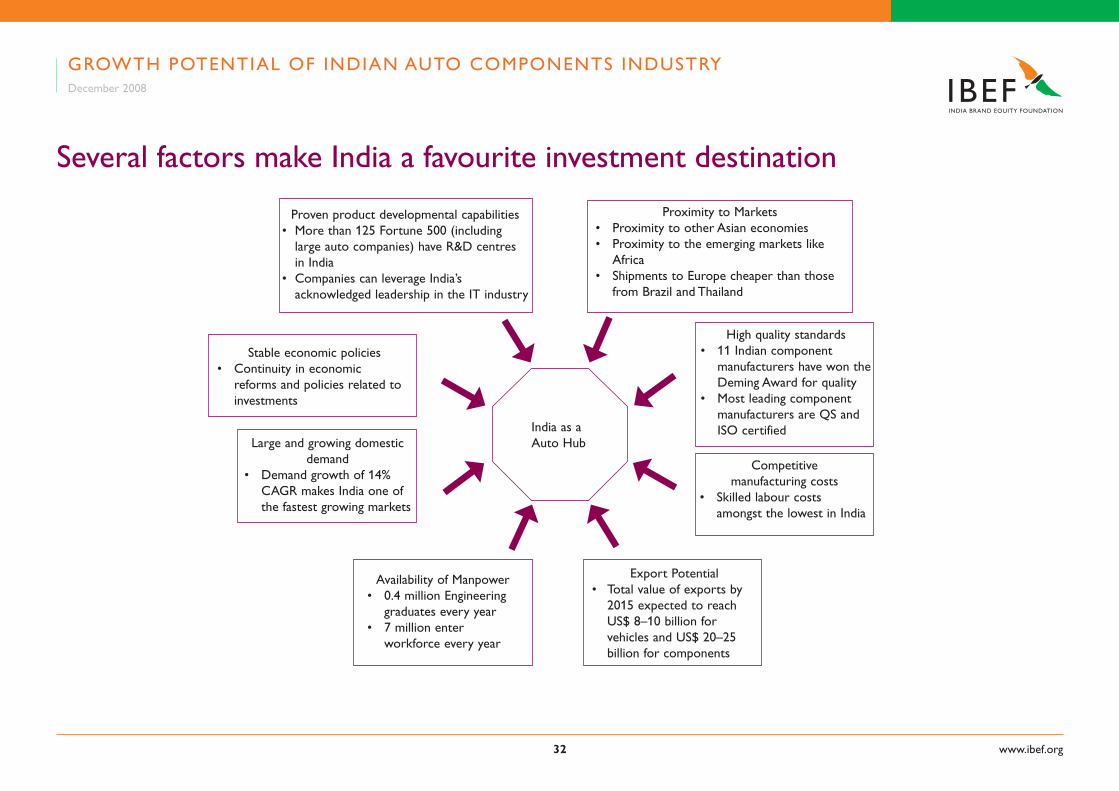
Several factors make India a favourite investment destination
Proven product developmental capabilities• More than 125 Fortune 500 (including
large auto companies) have R&D centres in India
• Companies can leverage India’s acknowledged leadership in the IT industry
Proximity to Markets• Proximity to other Asian economies • Proximity to the emerging markets like
Africa• Shipments to Europe cheaper than those
from Brazil and Thailand
Stable economic policies• Continuity in economic
reforms and policies related to investments
High quality standards• 11 Indian component
manufacturers have won the Deming Award for quality
• Most leading component manufacturers are QS and ISO certified
Large and growing domestic demand
• Demand growth of 14% CAGR makes India one of the fastest growing markets
Competitive manufacturing costs
• Skilled labour costs amongst the lowest in India
Availability of Manpower• 0.4 million Engineering
graduates every year• 7 million enter
workforce every year
Export Potential• Total value of exports by
2015 expected to reach US$ 8–10 billion for vehicles and US$ 20–25 billion for components
India as a Auto Hub
GROWTH POTENTIAL OF INDIAN AUTO COMPONENTS INDUSTRYDecember 2008
www.ibef.org��
Indian auto component offers a balance between quality and cost
Quality Services
• Indian IT recognised worldwide
Quality Manpower
• 0.4 Million engineering graduates
Quality Suppliers
• 456 Nos ISO 9000 certified Suppliers
Lower
• Labour cost
Lower
• Design cost
GROWTH POTENTIAL OF INDIAN AUTO COMPONENTS INDUSTRYDecember 2008
www.ibef.org��
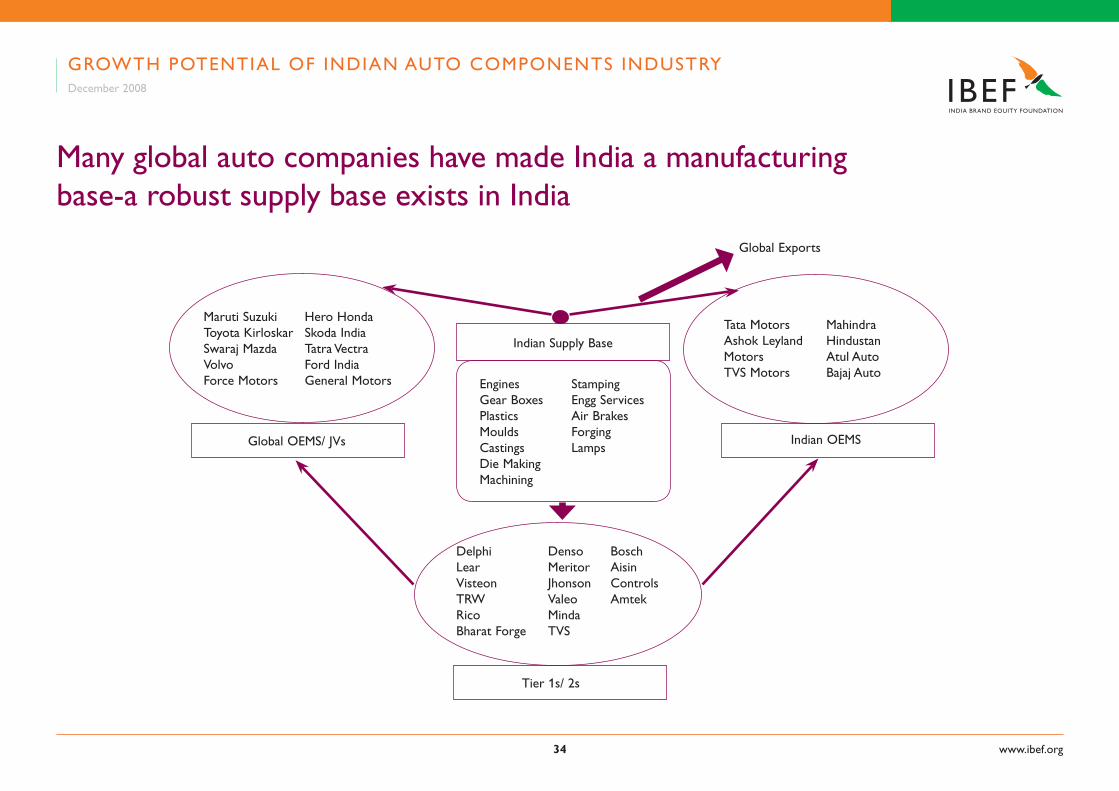
Many global auto companies have made India a manufacturing base-a robust supply base exists in India
Engines StampingGear Boxes Engg ServicesPlastics Air BrakesMoulds ForgingCastings LampsDie MakingMachining
Indian Supply Base
Delphi Denso Bosch Lear Meritor AisinVisteon Jhonson ControlsTRW Valeo Amtek Rico Minda Bharat Forge TVS
Maruti Suzuki Hero HondaToyota Kirloskar Skoda India Swaraj Mazda Tatra VectraVolvo Ford IndiaForce Motors General Motors
Tata Motors Mahindra Ashok Leyland Hindustan Motors Atul Auto TVS Motors Bajaj Auto
Tier 1s/ 2s
Indian OEMSGlobal OEMS/ JVs
Global Exports
GROWTH POTENTIAL OF INDIAN AUTO COMPONENTS INDUSTRYDecember 2008
www.ibef.org��
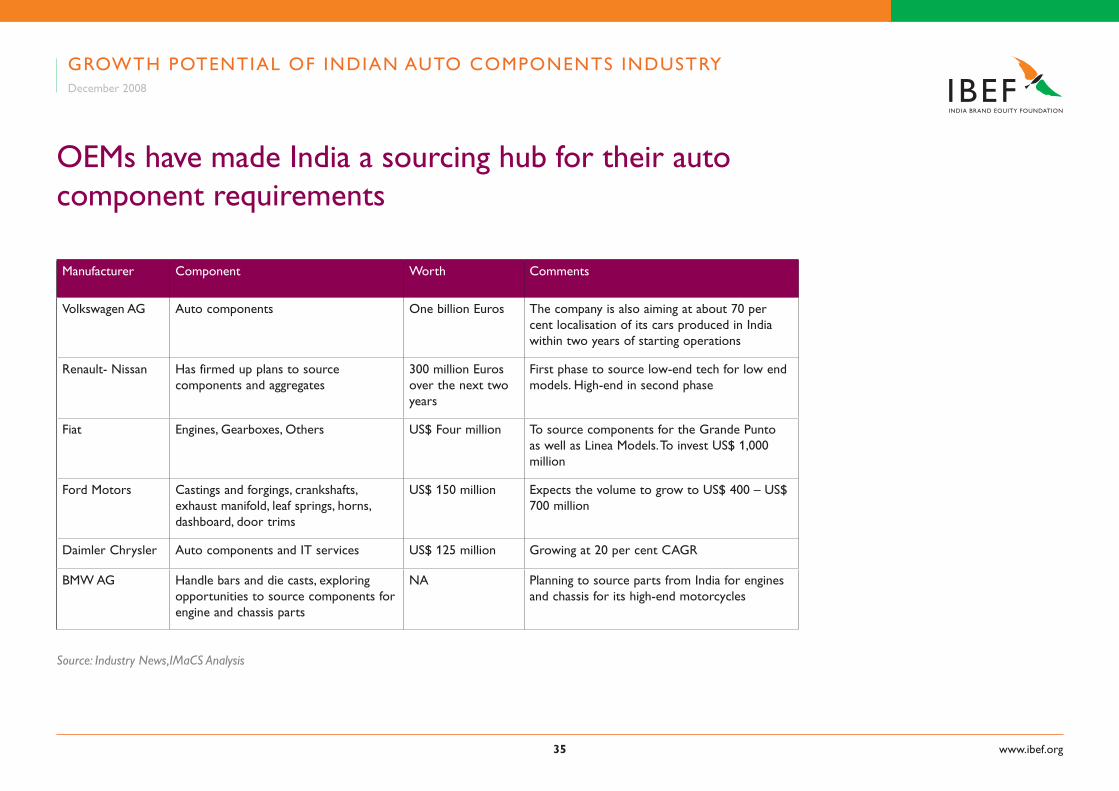
OEMs have made India a sourcing hub for their auto component requirements
Manufacturer Component Worth Comments
Volkswagen AG Auto components One billion Euros The company is also aiming at about 70 per cent localisation of its cars produced in India within two years of starting operations
Renault- Nissan Has firmed up plans to source components and aggregates
300 million Euros over the next two years
First phase to source low-end tech for low end models. High-end in second phase
Fiat Engines, Gearboxes, Others US$ Four million To source components for the Grande Punto as well as Linea Models. To invest US$ 1,000 million
Ford Motors Castings and forgings, crankshafts, exhaust manifold, leaf springs, horns, dashboard, door trims
US$ 150 million Expects the volume to grow to US$ 400 – US$ 700 million
Daimler Chrysler Auto components and IT services US$ 125 million Growing at 20 per cent CAGR
BMW AG Handle bars and die casts, exploring opportunities to source components for engine and chassis parts
NA Planning to source parts from India for engines and chassis for its high-end motorcycles
GROWTH POTENTIAL OF INDIAN AUTO COMPONENTS INDUSTRYDecember 2008
Source: Industry News,IMaCS Analysis
www.ibef.org��
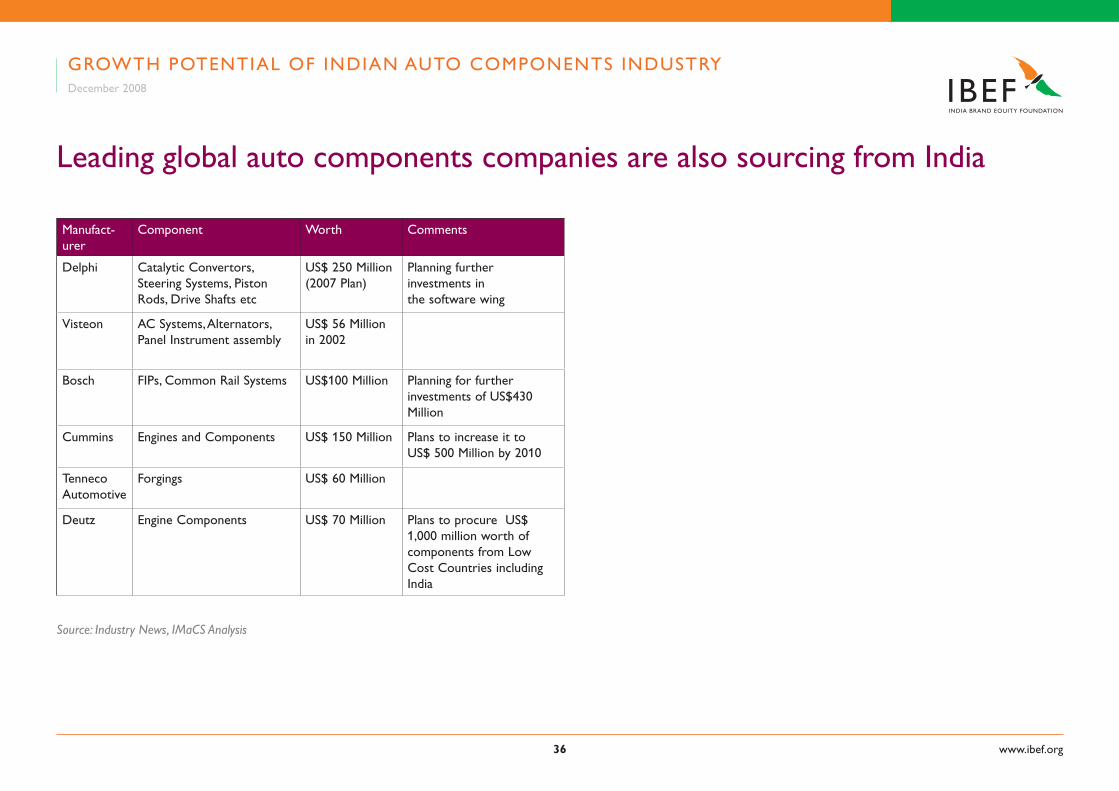
Leading global auto components companies are also sourcing from India
Manufact- urer
Component Worth Comments
Delphi Catalytic Convertors, Steering Systems, Piston Rods, Drive Shafts etc
US$ 250 Million (2007 Plan)
Planning further investments in the software wing
Visteon AC Systems, Alternators, Panel Instrument assembly
US$ 56 Million in 2002
Bosch FIPs, Common Rail Systems US$100 Million Planning for further investments of US$430 Million
Cummins Engines and Components US$ 150 Million Plans to increase it to US$ 500 Million by 2010
Tenneco Automotive
Forgings US$ 60 Million
Deutz Engine Components US$ 70 Million Plans to procure US$ 1,000 million worth of components from Low Cost Countries including India
Source: Industry News, IMaCS Analysis
GROWTH POTENTIAL OF INDIAN AUTO COMPONENTS INDUSTRYDecember 2008
www.ibef.org��
Competitiveness of Indian auto component manufacturing
• In order to emerge as a manufacturing hub, India would face competition from other low cost countries such as
* China
* Thailand
* Brazil
• IMaCS has compared the cost competitiveness of manufacturing 6 automative component groups (Engine, Transmission and Steering, Suspension and braking, Electricals, Equipment and others) manufacturing in India with respect to these countries in terms of factors like - Taxes and duties
- Cost of manufacturing (for example, power and fuel costs, labour costs, including productivity interest rates)
- Economies of scale
GROWTH POTENTIAL OF INDIAN AUTO COMPONENTS INDUSTRYDecember 2008
www.ibef.org��
Competitiveness of Indian auto component manufacturing
• Competitiveness of manufacturing in India can be improved by reducing the level of taxes impact of taxes and by improving the business infrastructure
GROWTH POTENTIAL OF INDIAN AUTO COMPONENTS INDUSTRYDecember 2008
www.ibef.org��
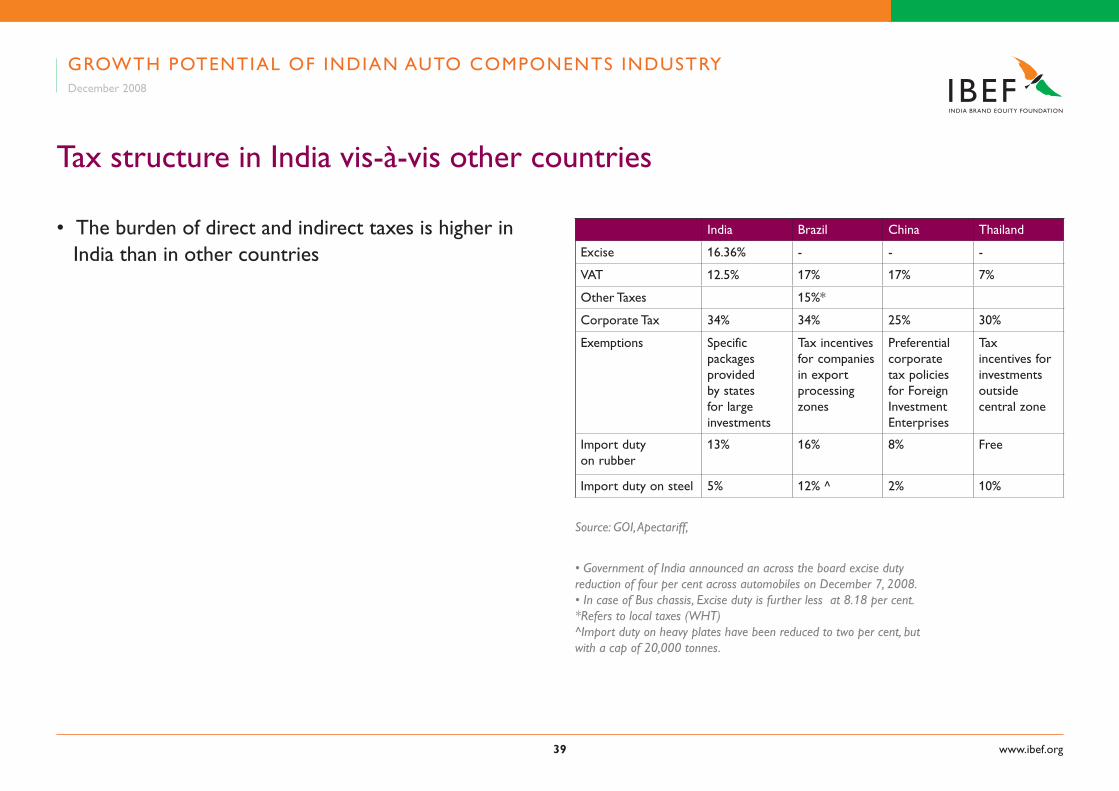
Tax structure in India vis-à-vis other countries
• The burden of direct and indirect taxes is higher in India than in other countries
India Brazil China Thailand
Excise 16.36% - - -
VAT 12.5% 17% 17% 7%
Other Taxes 15%*
Corporate Tax 34% 34% 25% 30%
Exemptions Specific packages provided by states for large investments
Tax incentives for companies in export processing zones
Preferential corporate tax policies for Foreign Investment Enterprises
Tax incentives for investments outside central zone
Import duty on rubber
13% 16% 8% Free
Import duty on steel 5% 12% ^ 2% 10%
• Government of India announced an across the board excise duty reduction of four per cent across automobiles on December 7, 2008.• In case of Bus chassis, Excise duty is further less at 8.18 per cent.*Refers to local taxes (WHT)^Import duty on heavy plates have been reduced to two per cent, but with a cap of 20,000 tonnes.
GROWTH POTENTIAL OF INDIAN AUTO COMPONENTS INDUSTRYDecember 2008
Source: GOI, Apectariff,
www.ibef.org�0
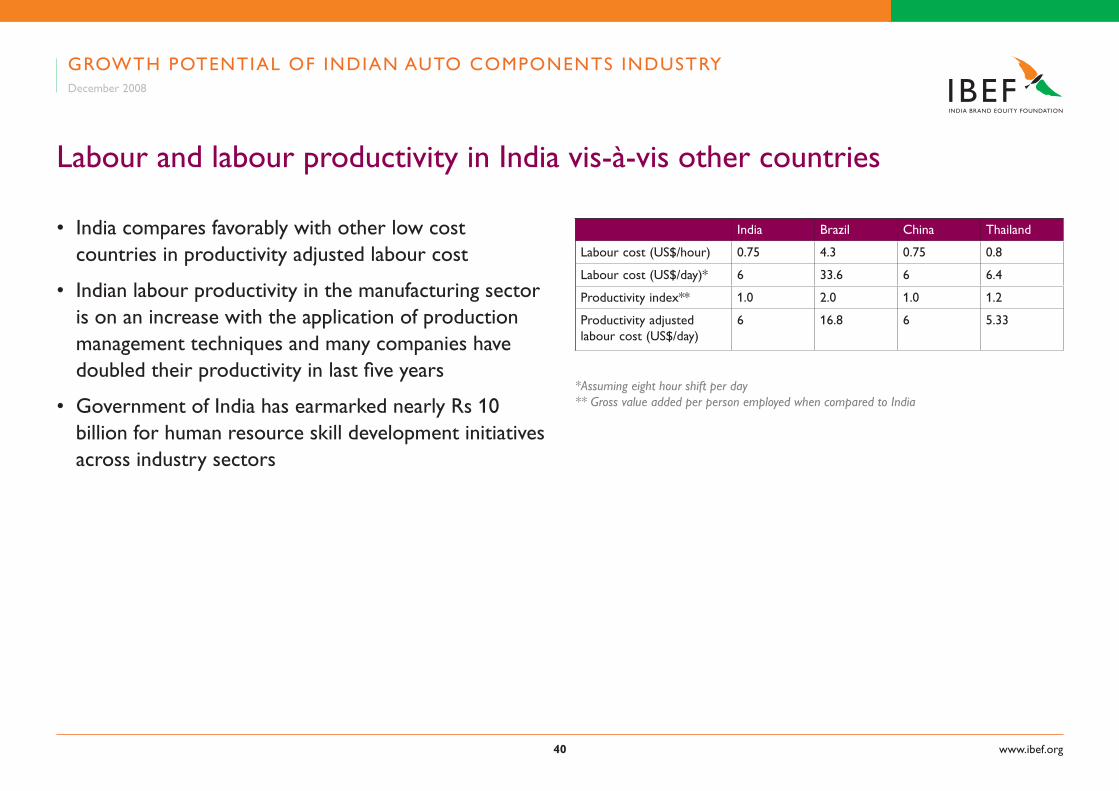
Labour and labour productivity in India vis-à-vis other countries
• India compares favorably with other low cost countries in productivity adjusted labour cost
• Indian labour productivity in the manufacturing sector is on an increase with the application of production management techniques and many companies have doubled their productivity in last five years
• Government of India has earmarked nearly Rs 10 billion for human resource skill development initiatives across industry sectors
India Brazil China Thailand
Labour cost (US$/hour) 0.75 4.3 0.75 0.8
Labour cost (US$/day)* 6 33.6 6 6.4
Productivity index** 1.0 2.0 1.0 1.2
Productivity adjusted labour cost (US$/day)
6 16.8 6 5.33
*Assuming eight hour shift per day** Gross value added per person employed when compared to India
GROWTH POTENTIAL OF INDIAN AUTO COMPONENTS INDUSTRYDecember 2008
www.ibef.org�1
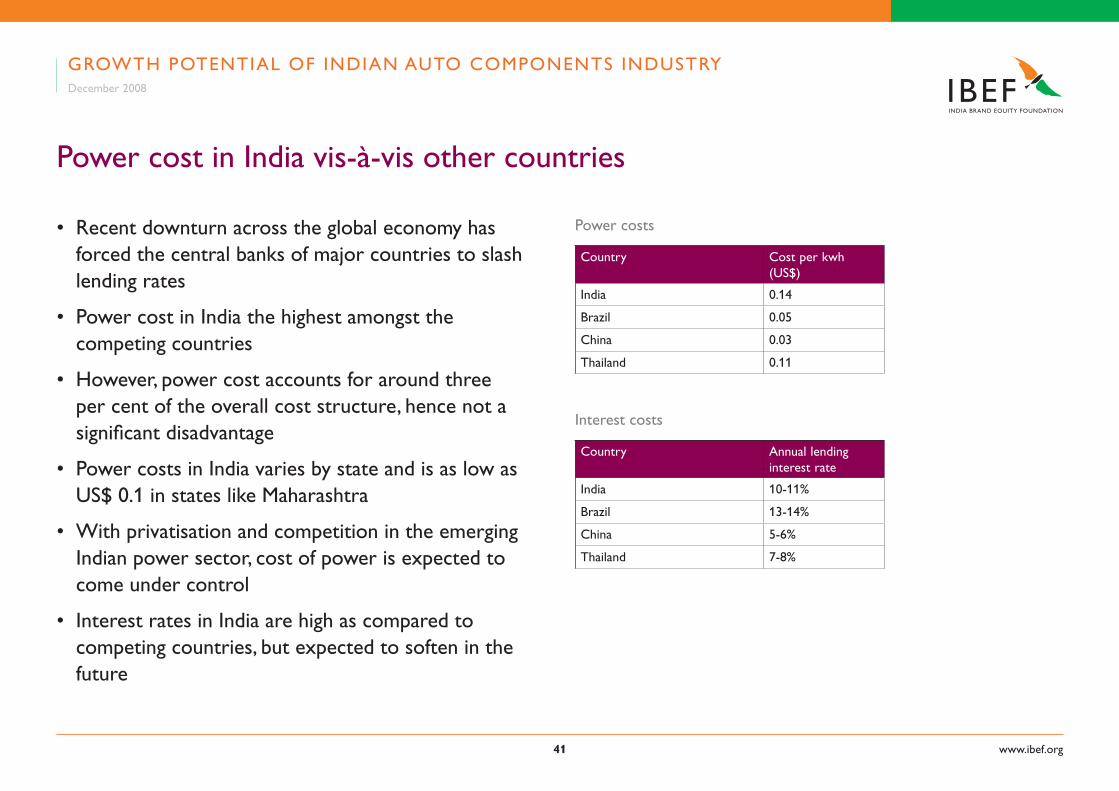
Power cost in India vis-à-vis other countries
• Recent downturn across the global economy has forced the central banks of major countries to slash lending rates
• Power cost in India the highest amongst the competing countries
• However, power cost accounts for around three per cent of the overall cost structure, hence not a significant disadvantage
• Power costs in India varies by state and is as low as US$ 0.1 in states like Maharashtra
• With privatisation and competition in the emerging Indian power sector, cost of power is expected to come under control
• Interest rates in India are high as compared to competing countries, but expected to soften in the future
Country Cost per kwh (US$)
India 0.14
Brazil 0.05
China 0.03
Thailand 0.11
Power costs
Country Annual lending interest rate
India 10-11%
Brazil 13-14%
China 5-6%
Thailand 7-8%
Interest costs
GROWTH POTENTIAL OF INDIAN AUTO COMPONENTS INDUSTRYDecember 2008
www.ibef.org��
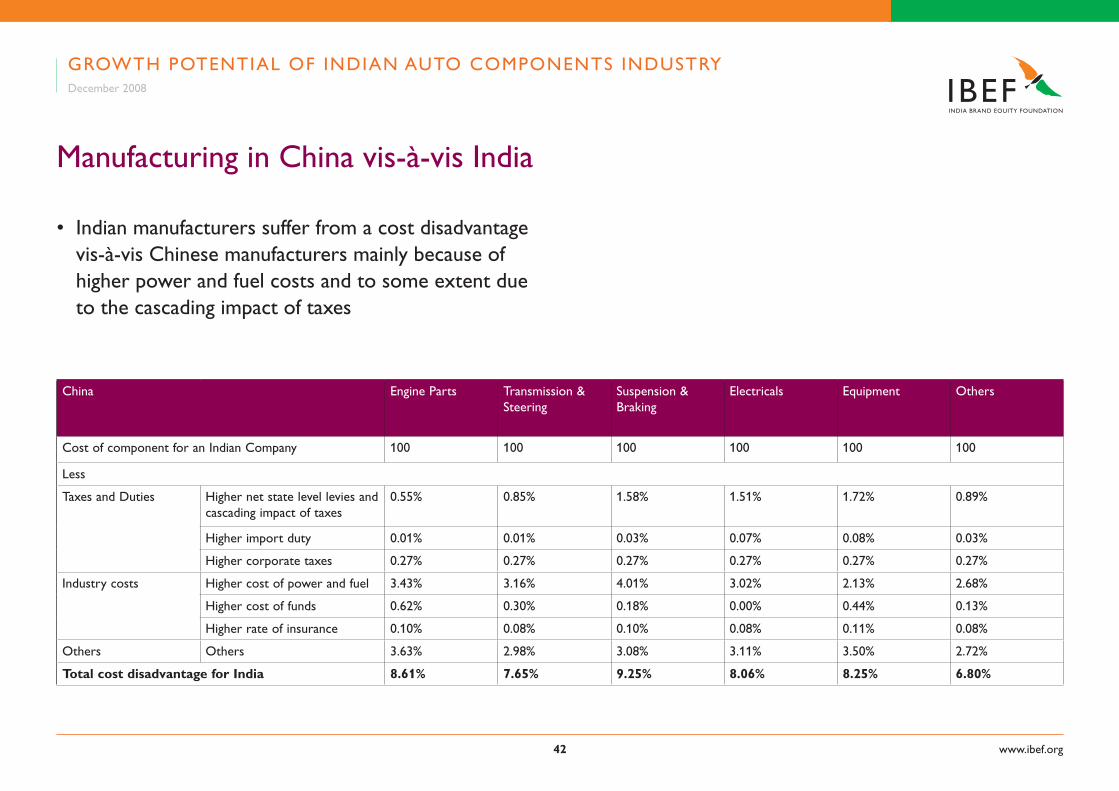
Manufacturing in China vis-à-vis India
• Indian manufacturers suffer from a cost disadvantage vis-à-vis Chinese manufacturers mainly because of higher power and fuel costs and to some extent due to the cascading impact of taxes
China Engine Parts Transmission & Steering
Suspension & Braking
Electricals Equipment Others
Cost of component for an Indian Company 100 100 100 100 100 100
Less
Taxes and Duties Higher net state level levies and cascading impact of taxes
0.55% 0.85% 1.58% 1.51% 1.72% 0.89%
Higher import duty 0.01% 0.01% 0.03% 0.07% 0.08% 0.03%
Higher corporate taxes 0.27% 0.27% 0.27% 0.27% 0.27% 0.27%
Industry costs Higher cost of power and fuel 3.43% 3.16% 4.01% 3.02% 2.13% 2.68%
Higher cost of funds 0.62% 0.30% 0.18% 0.00% 0.44% 0.13%
Higher rate of insurance 0.10% 0.08% 0.10% 0.08% 0.11% 0.08%
Others Others 3.63% 2.98% 3.08% 3.11% 3.50% 2.72%
Total cost disadvantage for India �.�1% �.��% �.��% �.0�% �.��% �.�0%
GROWTH POTENTIAL OF INDIAN AUTO COMPONENTS INDUSTRYDecember 2008
www.ibef.org��
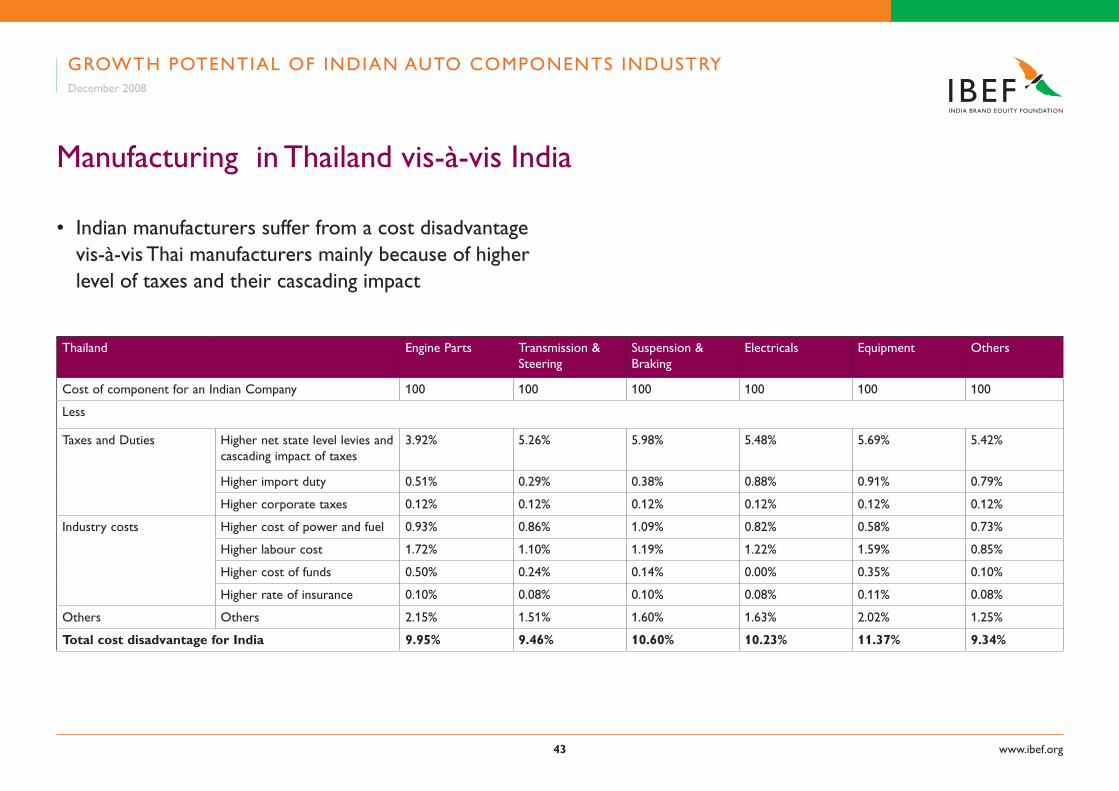
Manufacturing in Thailand vis-à-vis India
• Indian manufacturers suffer from a cost disadvantage vis-à-vis Thai manufacturers mainly because of higher level of taxes and their cascading impact
Thailand Engine Parts Transmission & Steering
Suspension & Braking
Electricals Equipment Others
Cost of component for an Indian Company 100 100 100 100 100 100
Less
Taxes and Duties Higher net state level levies and cascading impact of taxes
3.92% 5.26% 5.98% 5.48% 5.69% 5.42%
Higher import duty 0.51% 0.29% 0.38% 0.88% 0.91% 0.79%
Higher corporate taxes 0.12% 0.12% 0.12% 0.12% 0.12% 0.12%
Industry costs Higher cost of power and fuel 0.93% 0.86% 1.09% 0.82% 0.58% 0.73%
Higher labour cost 1.72% 1.10% 1.19% 1.22% 1.59% 0.85%
Higher cost of funds 0.50% 0.24% 0.14% 0.00% 0.35% 0.10%
Higher rate of insurance 0.10% 0.08% 0.10% 0.08% 0.11% 0.08%
Others Others 2.15% 1.51% 1.60% 1.63% 2.02% 1.25%
Total cost disadvantage for India �.��% �.��% 10.�0% 10.��% 11.��% �.��%
GROWTH POTENTIAL OF INDIAN AUTO COMPONENTS INDUSTRYDecember 2008
www.ibef.org��
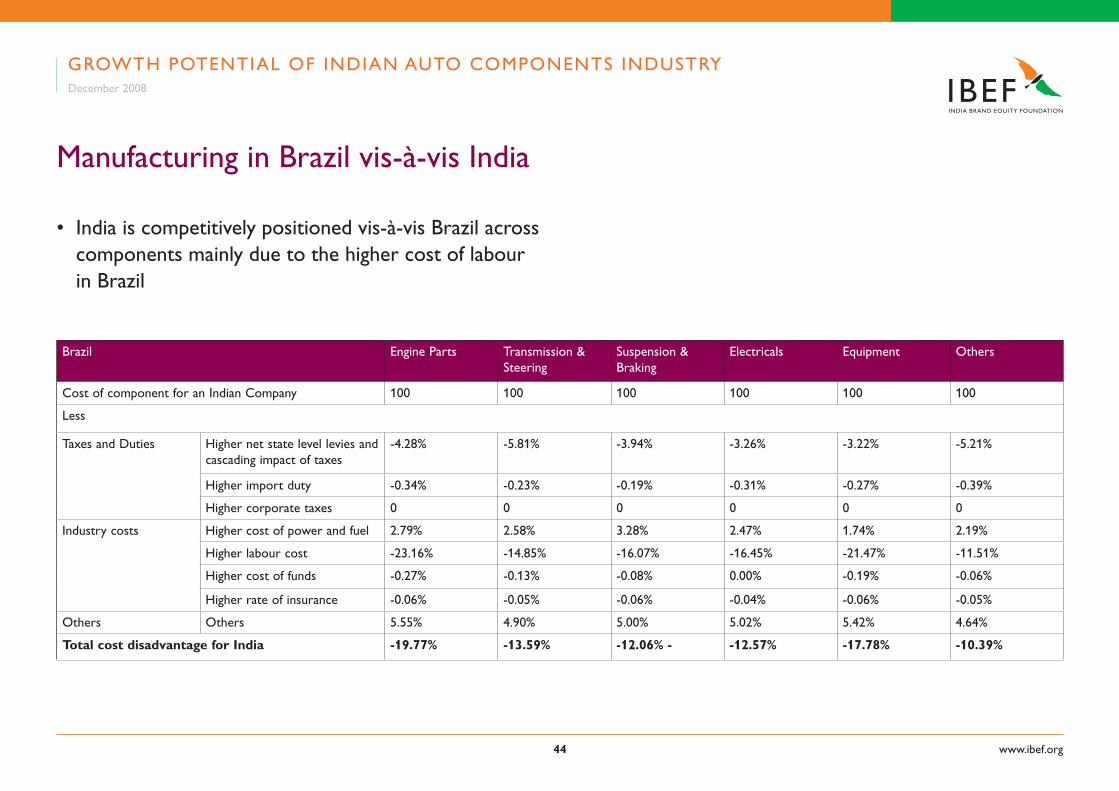
Manufacturing in Brazil vis-à-vis India
• India is competitively positioned vis-à-vis Brazil across components mainly due to the higher cost of labour in Brazil
Brazil Engine Parts Transmission & Steering
Suspension & Braking
Electricals Equipment Others
Cost of component for an Indian Company 100 100 100 100 100 100
Less
Taxes and Duties Higher net state level levies and cascading impact of taxes
-4.28% -5.81% -3.94% -3.26% -3.22% -5.21%
Higher import duty -0.34% -0.23% -0.19% -0.31% -0.27% -0.39%
Higher corporate taxes 0 0 0 0 0 0
Industry costs Higher cost of power and fuel 2.79% 2.58% 3.28% 2.47% 1.74% 2.19%
Higher labour cost -23.16% -14.85% -16.07% -16.45% -21.47% -11.51%
Higher cost of funds -0.27% -0.13% -0.08% 0.00% -0.19% -0.06%
Higher rate of insurance -0.06% -0.05% -0.06% -0.04% -0.06% -0.05%
Others Others 5.55% 4.90% 5.00% 5.02% 5.42% 4.64%
Total cost disadvantage for India -1�.��% -1�.��% -1�.0�% - -1�.��% -1�.��% -10.��%
GROWTH POTENTIAL OF INDIAN AUTO COMPONENTS INDUSTRYDecember 2008
www.ibef.org��
Conclusions
• India has a cost advantage when compared to Brazil, however suffers from a cost disadvantage vis-à-vis China and Thailand (to a lesser extent), primarily due to high level of taxes and their cascading impact
• India, in the near future is expected to go ahead with the abolition of interstate Central Sales Tax (CST), which will reduce the cascading impact of taxes to some extent
• Implementation of Goods and Services tax (along the lines of VAT) and abolition of all other taxes by 2010 is under consideration, which will reduce the taxation loading on the automotive sector considerably. This step is expected to strengthen India’s future position as a leading automobile manufacturing hub
• Various steps being taken by the Indian government in improving infrastructure would reduce the disadvantage that India suffers from because of poor infrastructure that causes project delays, delays in deliveries and so on. This would increase the demand for road transportation in the country and consequently demand for auto components
• India’s exports of auto components have the advantage of proximity to automotive manufacturing nations like Thailand; trade agreements being signed with ASEAN nations are expected to give a further boost to exports
GROWTH POTENTIAL OF INDIAN AUTO COMPONENTS INDUSTRYDecember 2008
��
AUTO COMPONENTSDecember 2008
This presentation has been prepared jointly by the India Brand Equity Foundation (“IBEF”) and ICRA Management Consulting Services Limited, IMaCS (“Authors”).
All rights reserved. All copyright in this presentation and related works is owned by IBEF and the Authors. The same may not be reproduced, wholly or in part in any material form (including photocopying or storing it in any medium by electronic means and whether or not transiently or incidentally to some other use of this presentation), modified or in any manner communicated to any third party except with the written approval of IBEF.
This presentation is for information purposes only. While due care has been taken during the compilation of this presentation to ensure that the information is accurate to the best of the
Author’s and IBEF’s knowledge and belief, the content is not to be construed in any manner whatsoever as a substitute for professional advice.
The Author and IBEF neither recommend or endorse any specific products or services that may have been mentioned in this presentation and nor do they assume any liability or responsibility for the outcome of decisions taken as a result of any reliance placed in this presentation.
Neither the Author nor IBEF shall be liable for any direct or indirect damages that may arise due to any act or omission on the part of the user due to any reliance placed or guidance taken from any portion of this presentation.
DISCLAIMER
www.ibef.org