Embed Size (px)
Citation preview
Flevum Roundtable
2 november 2011
Slide 2 | 2 november 2011
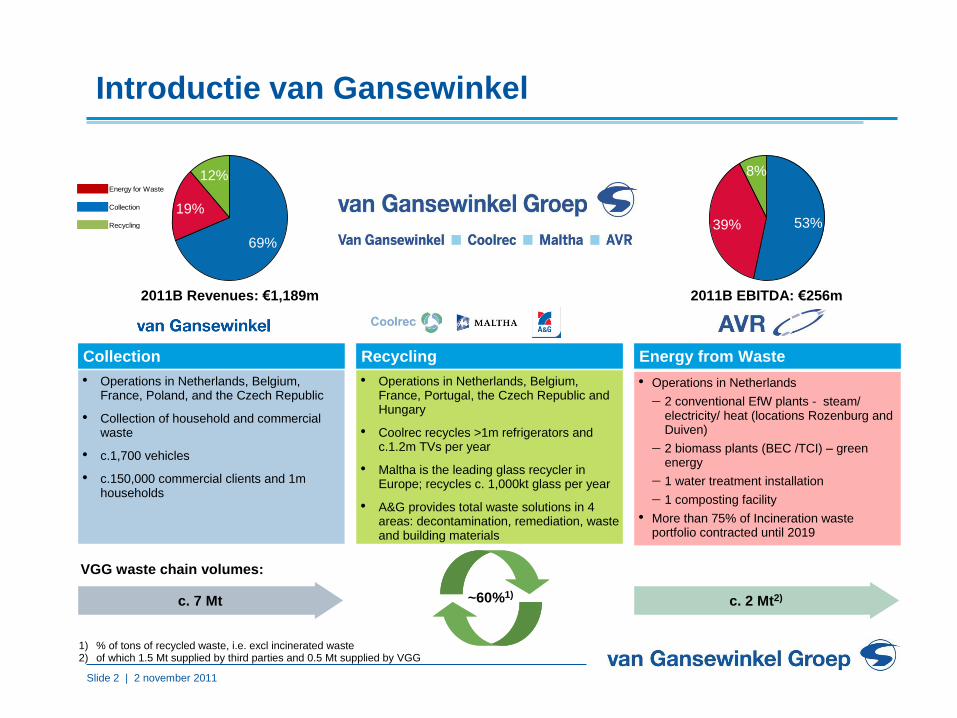
c. 2 Mt2)
Collection Recycling Energy from Waste
• Operations in Netherlands, Belgium, France, Poland, and the Czech Republic
• Collection of household and commercial waste
• c.1,700 vehicles
• c.150,000 commercial clients and 1m households
• Operations in Netherlands, Belgium, France, Portugal, the Czech Republic and Hungary
• Coolrec recycles >1m refrigerators and c.1.2m TVs per year
• Maltha is the leading glass recycler in Europe; recycles c. 1,000kt glass per year
• A&G provides total waste solutions in 4 areas: decontamination, remediation, waste and building materials
• Operations in Netherlands
2 conventional EfW plants - steam/ electricity/ heat (locations Rozenburg and Duiven)
2 biomass plants (BEC /TCI) – green energy
1 water treatment installation
1 composting facility
• More than 75% of Incineration waste portfolio contracted until 2019
c. 7 Mt ~60%1)
2011B Revenues: €1,189m 2011B EBITDA: €256m
VGG waste chain volumes:
Energy for Waste
Collection
Recycling 53%39%
8%
69%
19%
12%
1) % of tons of recycled waste, i.e. excl incinerated waste2) of which 1.5 Mt supplied by third parties and 0.5 Mt supplied by VGG
Introductie van Gansewinkel

Grondstoffen?
Het kan niet op!!
Afvalstoffen in
perspectief

Slide 4 | 2 november 2011
19e eeuw: hygiëne

Slide 5 | 2 november 2011
Ander afval bestond niet

Slide 6 | 2 november 2011
20e eeuw: welvaart maakt afval

Slide 7 | 2 november 2011
20e eeuw: afval moet weg

Slide 8 | 2 november 2011
20e eeuw: milieu
Slide 9 | 2 november 2011
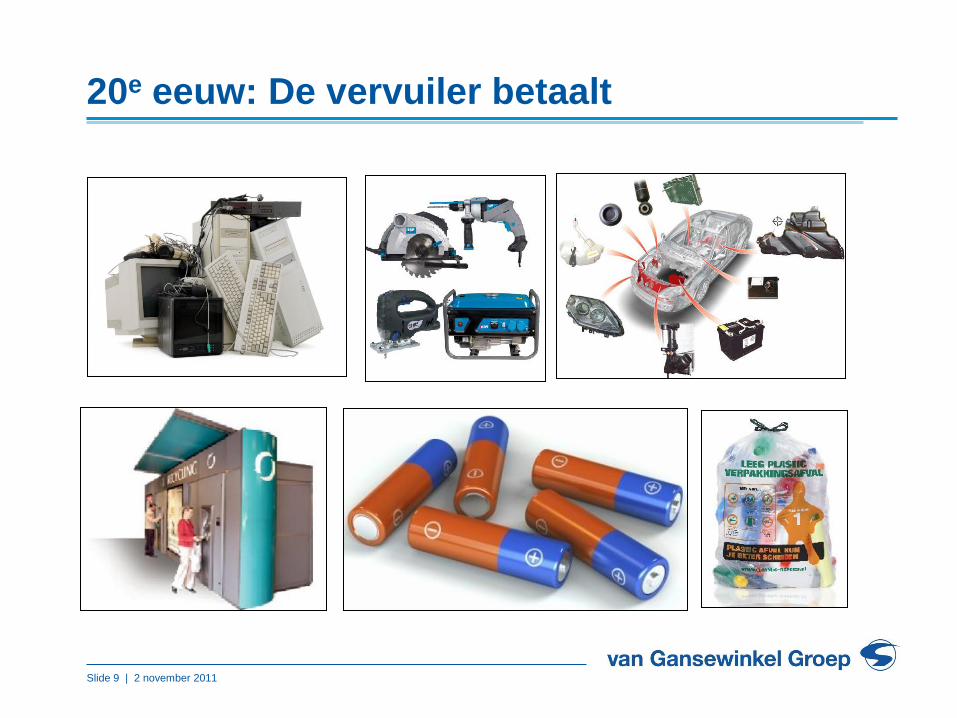
20e eeuw: De vervuiler betaalt
Slide 10 | 2 november 2011
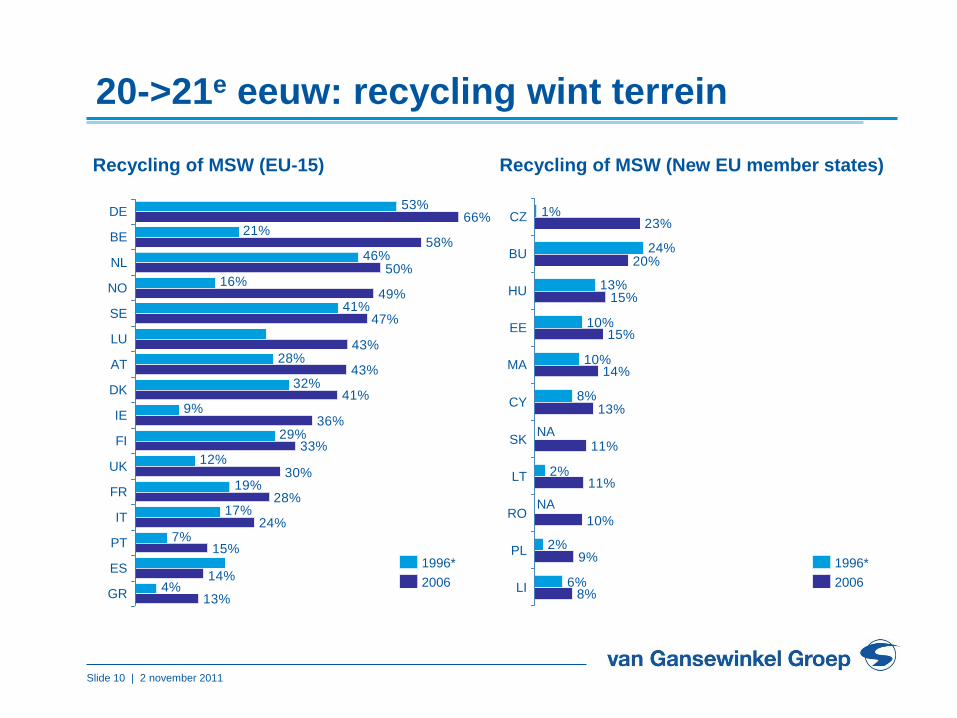
20->21e eeuw: recycling wint terrein
Recycling of MSW (EU-15) Recycling of MSW (New EU member states)
4%
7%
17%
19%
12%
29%
9%
32%
28%
41%
16%
46%
21%
53%
13%
14%
15%
24%
28%
30%
33%
36%
41%
43%
43%
47%
49%
50%
58%
66%
NL
BE
DE
DK
GR
ES
PT
IT
FR
UK
FI
IE
AT
LU
SE
NO
2006
1996*
6%
2%
2%
8%
10%
10%
13%
24%
1%
8%
9%
10%
11%
11%
13%
14%
15%
15%
20%
23%
LI
PL
RO
LT
SK
CY
CZ
MA
EE
HU
BU
2006
1996*
NA
NA

Slide 11 | 2 november 2011
Afval in Nederland (2008, miljoen ton)
0
5
10
15
20
25
30
Bouw
- en s
loopsecto
r
Industr
ie
Huis
houdens
Handel,
die
nste
n e
n
overh
eid
Landbouw
, bosbouw
en v
isserij
Energ
ievoorz
ienin
g
Rio
olw
ate
rzuiv
ering
Verk
eer
en v
erv
oer
Drinkw
ate
rvoorz
ienin
g
Storten + lozen
Verbranden
Nuttige toepassing
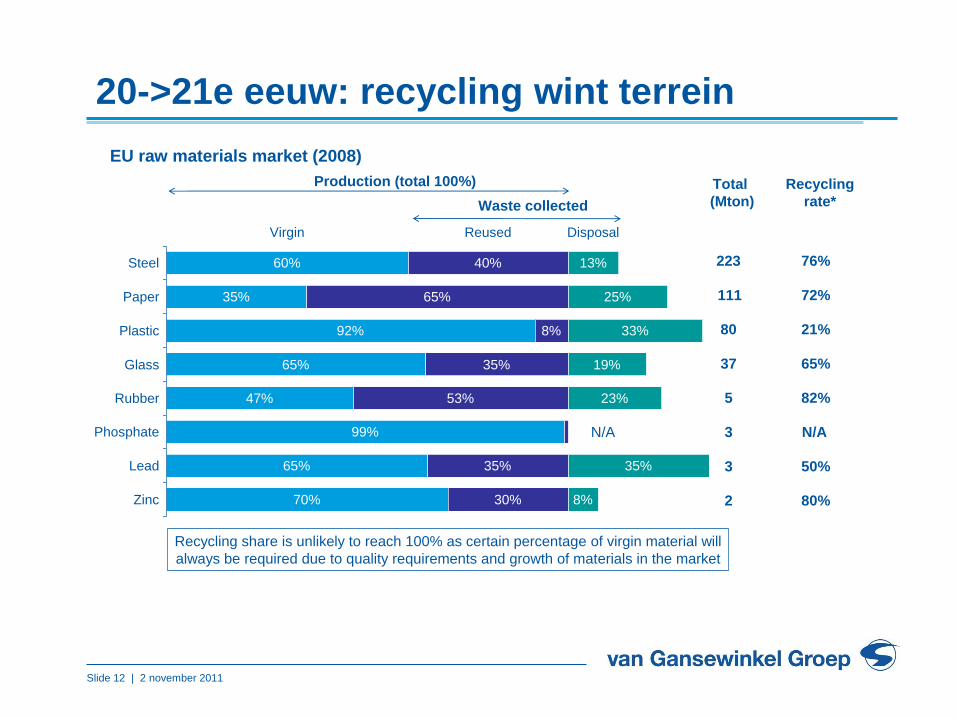
20->21e eeuw: recycling wint terrein
Slide 12 | 2 november 2011
20->21e eeuw: recycling wint terrein
Reused Disposal
Zinc 70% 30% 8%
Lead 65% 35% 35%
Phosphate 99%
Rubber 47% 53% 23%
Virgin
65% 35% 19%
Plastic 92% 8% 33%
Paper 35% 65% 25%
Steel 60% 40% 13%
Glass
Recycling
rate*
Production (total 100%)
Waste collected
EU raw materials market (2008)
76%
72%
21%
65%
82%
50%
Recycling share is unlikely to reach 100% as certain percentage of virgin material will
always be required due to quality requirements and growth of materials in the market
223
111
80
37
5
3
Total
(Mton)
80%2
N/A3N/A

Slide 13 | 2 november 2011
Downcycling
21e eeuw: nuttige toepassing, maar….

Slide 14 | 2 november 2011
Energetisch
hergebruik
21e eeuw: nuttige toepassing, maar….

Slide 15 | 2 november 2011
21e eeuw: nuttige toepassing, maar….
CN, US, IN Self-regenerating and will not run out
CN, RU, CA Large recycling share
CN, US, IN Very large supply but often difficult to mine
CN, US, MA Current scarcity specific for Europe
CN, AU, BR Large recycling shares, polluted by non-ferros
US, RU, CA Large in VGG’s home market
CL, US, PE Demand kept rising during crisis
SA, RU, US Energy substitutes already available
CN, BO, SA Main reliance on Chinese production
PE, MX, CN Mined globally
CN, JP, KO Recovery from other base metals possible
Raw Material Markets
Oil 43 yrs
Copper 44 yrs
Gas 61 yrs
Iron ore 64 yrs
Phosphate 75 yrs
Coal 148 yrs
Aluminium* 161 yrs
Soda ∞
Antimony 30 yrs
Silver 29 yrs
Indium 13 yrs
NM
55%
69%
75%
50%
42%
47%
41%
Years to depletion Top 3
producers
Share of
top 3
Comments
95%
44%
78%Rare metals

Slide 16 | 2 november 2011
21e eeuw: Motivatie niet alleen milieu
Price developments Virgin materials(Index 2000=100)
0
50
100
150
200
250
300
350
2000 2001 2002 2003 2004 2005 2006 2007 2008 2009
Tungsten
Tin
Antimony
Soda
Phosphate
NaturalGas
Crude oil
Coal
WoodChips
Rubber
Aluminium ore
Copper ore
Ironore
Economic crisisInflation
2009
239
238
225
205
189
187
172
154
150
145
141
137
130
Inflation 123
2009
239
238
225
205
189
187
172
154
150
145
141
137
130
Inflation 123
Slide 17 | 2 november 2011
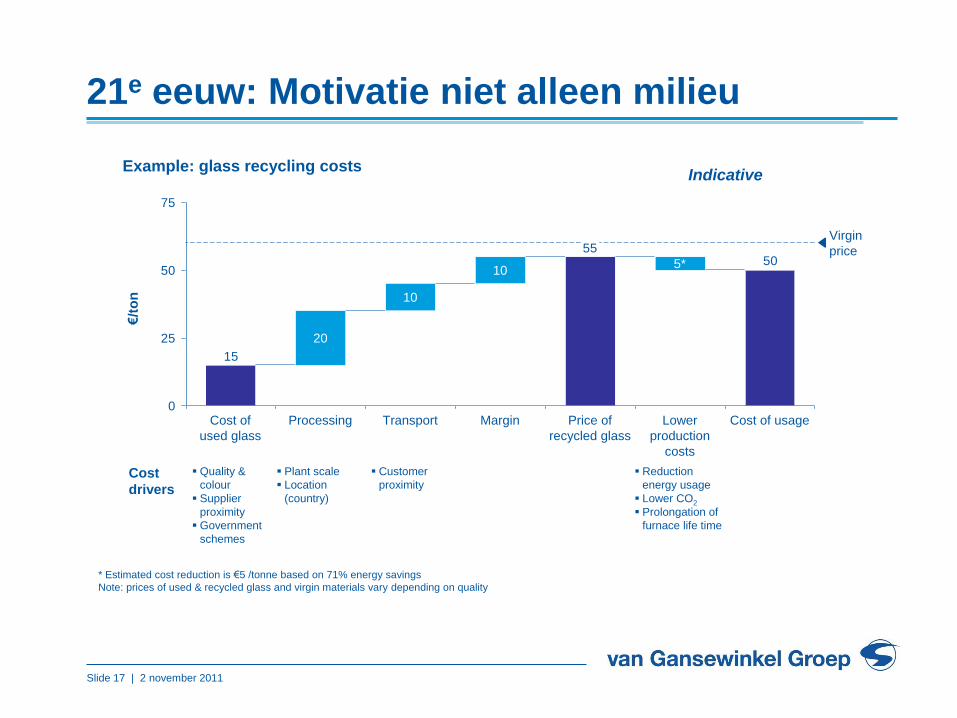
21e eeuw: Motivatie niet alleen milieu
5055
15
0
25
50
75
Virgin
price
Cost of usageLower
production
costs
5*
Price of
recycled glass
Margin
10
Transport
10
Processing
20
Cost of
used glass
Example: glass recycling costs
€/t
on
Cost
drivers
Quality &
colour
Supplier
proximity
Government
schemes
Plant scale
Location
(country)
Customer
proximity
Reduction
energy usage
Lower CO2
Prolongation of
furnace life time
* Estimated cost reduction is €5 /tonne based on 71% energy savings
Note: prices of used & recycled glass and virgin materials vary depending on quality
Indicative
Slide 18 | 2 november 2011
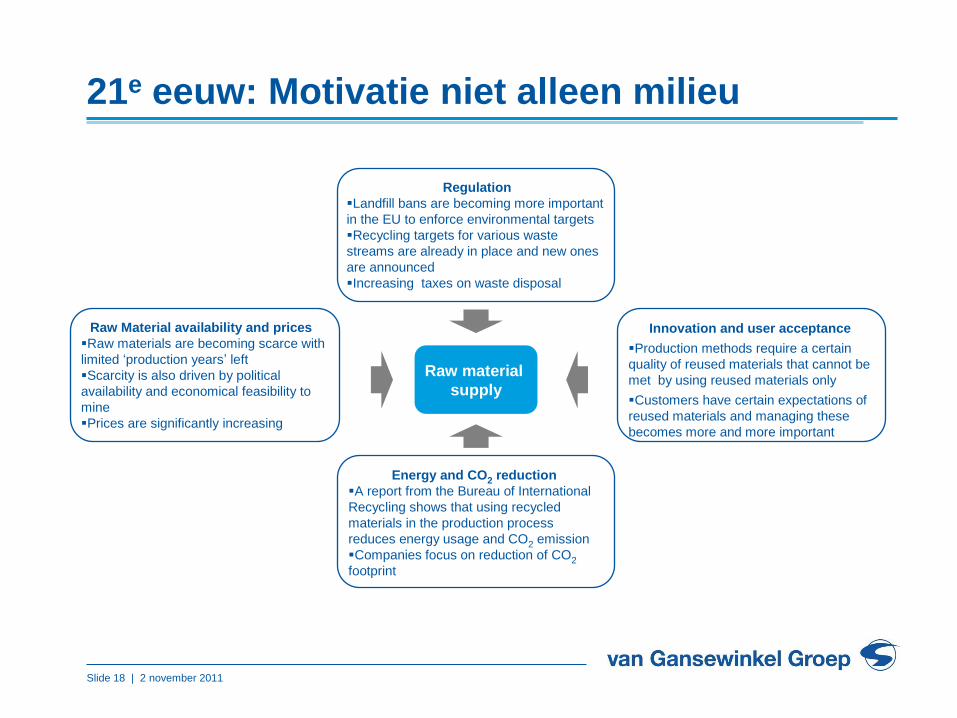
21e eeuw: Motivatie niet alleen milieu
Raw material
supply
Raw Material availability and prices .
Raw materials are becoming scarce with
limited ‘production years’ left
Scarcity is also driven by political
availability and economical feasibility to
mine
Prices are significantly increasing
Innovation and user acceptance
Production methods require a certain
quality of reused materials that cannot be
met by using reused materials only
Customers have certain expectations of
reused materials and managing these
becomes more and more important
Energy and CO2 reduction
A report from the Bureau of International
Recycling shows that using recycled
materials in the production process
reduces energy usage and CO2 emission
Companies focus on reduction of CO2
footprint
Regulation
Landfill bans are becoming more important
in the EU to enforce environmental targets
Recycling targets for various waste
streams are already in place and new ones
are announced
Increasing taxes on waste disposal

Slide 19 | 2 november 2011
21e eeuw: conclusie: Afval bestaat niet
Grondstoffen en Energie:
• Schaars
• Duur
Afval
• bevat grondstoffen
• bevat energie

Slide 20 | 2 november 2011
21e eeuw: Afval bestaat niet
Voorbeeld:
Grote bank in Nederland
• > 500 kantoren
• alle afval
• 3 jaar

Slide 21 | 2 november 2011
21e eeuw: Afval bestaat niet
Voorbeeld:
Grote bank in Nederland
• > 500 kantoren
• alle afval
• 3 jaar
Afvalomzet ????????

Slide 22 | 2 november 2011
Afval bestaat niet: stellingen
• De schillenboer/lompenkar komt terug in ons straatbeeld
• Groei van recycling is 100% afhankelijk van grondstofprijzen
• Regelgeving moet niet recycling van gebruikte producten
afdwingen, maar gebruik van gerecyclede grondstoffen.
• Een ‘closed loop’ is te creëren met de ondernemingen vandaag
aanwezig
• De volgende wereldoorlog wordt gevoerd om grondstoffen
(buiten olie)
• Think global, act local dient adagium te zijn voor EU, (&NL,
provincie, gemeente) op gebied van productie en consumptie
Slide 23 | 2 november 2011

Slide 24 | 2 november 2011
Potential savings (reused vs. virgin)*
76%
18%
99%
11%
58%
40%
65%
92%
Zinc 60%
Paper 65%
Lead 65%
Glass 71%
Steel 74%
Plastic 80%
Copper 85%
Aluminium 95%
Energy CO2
Energy and CO2 reduction have been
compared for the entire production
process of the end product
Using recycled material often reduces
the required energy in production as raw
materials are more comparable to the
end product (e.g. scrap vs. bauxite ore
for aluminium production)
CO2 is saved not only in production but
also in transportation
Raw ores are transported in large
quantities from elsewhere in the world to
be prepared for production locally
Not only is the production process for
glass and paper much simpler but these
are found closer to home which results
in more possible reduction of CO2

Slide 25 | 2 november 2011
Trade volume in reused material EU-27
-4%
-2%
0%
2%
4%
6%
8%
10%
12%
14%
0 10.000 20.000 30.000 40.000 50.000 60.000 70.000 80.000
Volume (Mton)
WoodRubber
Plastic
Paper and pulp
Non-Ferrous
Nickel
Glass
Ferrous
Copper
Aluminium
CA
GR
’00-’
09
Ø = 3.5%
Slide 26 | 2 november 2011
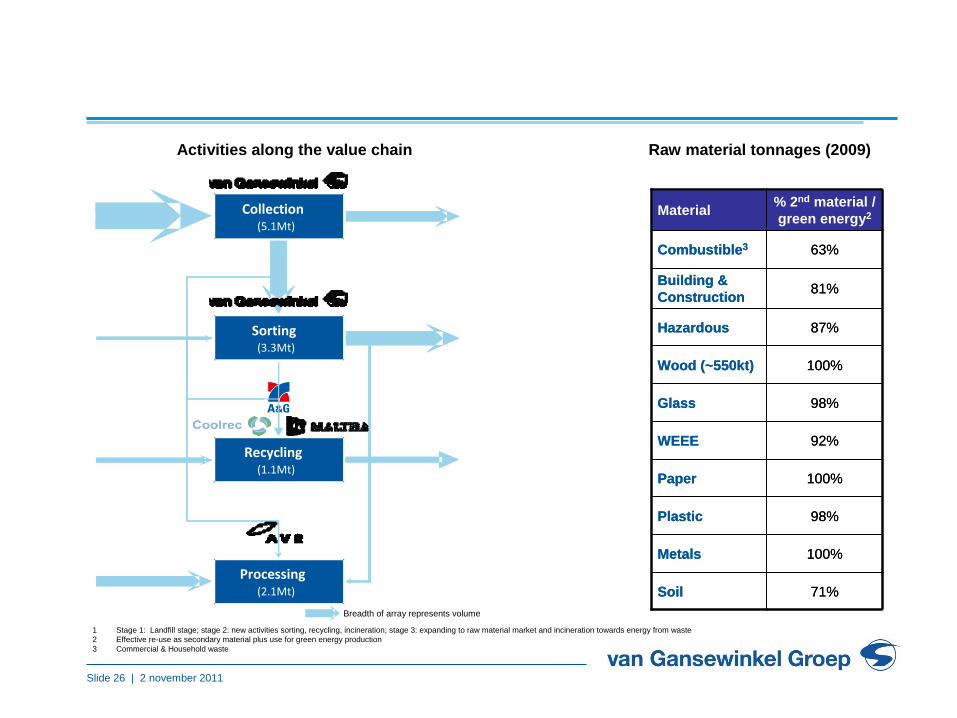
Treatment
Recycling
Incineration
CollectionServicesCollection
(5.1Mt)
Sorting(3.3Mt)
Recycling(1.1Mt)
Processing(2.1Mt)
Treatment
Recycling
Incineration
CollectionServicesCollection
(5.1Mt)
Sorting(3.3Mt)
Recycling(1.1Mt)
Processing(2.1Mt)
Breadth of array represents volume
1 Stage 1: Landfill stage; stage 2: new activities sorting, recycling, incineration; stage 3: expanding to raw material market and incineration towards energy from waste
2 Effective re-use as secondary material plus use for green energy production
3 Commercial & Household waste
81%Building &
Construction
87%Hazardous
63%Combustible3
71%Soil
100%Metals
98%Plastic
100%Paper
92%WEEE
98%Glass
100%Wood (~550kt)
% 2nd material /
green energy2Material
81%Building &
Construction
87%Hazardous
63%Combustible3
71%Soil
100%Metals
98%Plastic
100%Paper
92%WEEE
98%Glass
100%Wood (~550kt)
% 2nd material /
green energy2Material
Raw material tonnages (2009)Activities along the value chain
Slide 27 | 2 november 2011
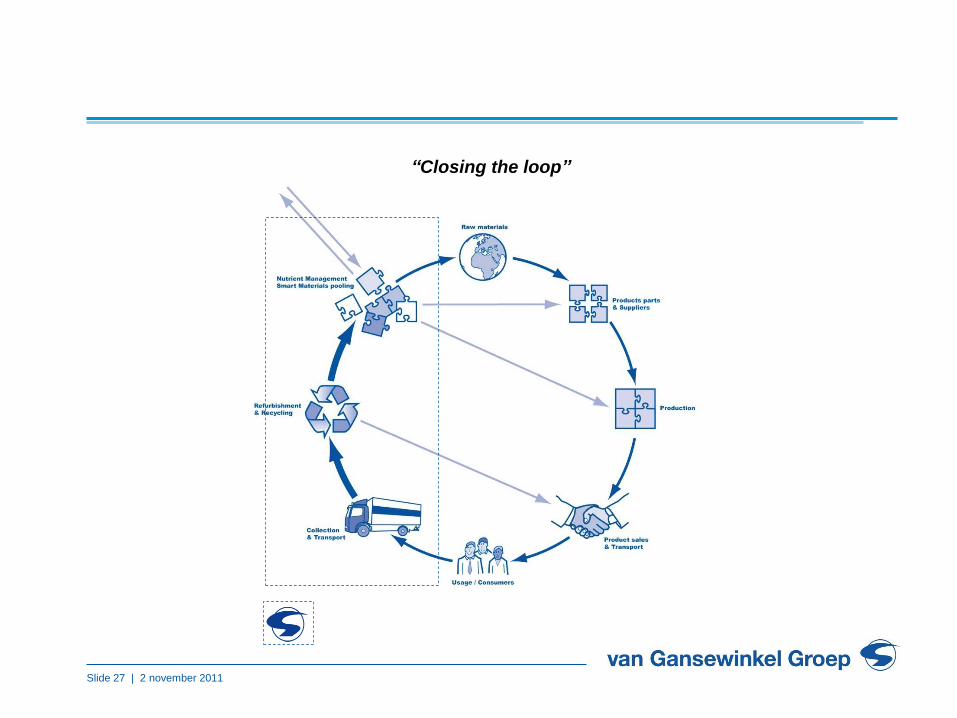
“Closing the loop”


![[HANDBUCH] "Geld verdienen im Internet mit Affiliate Marketing"](https://img.pdfslide.us/doc/110x75/5461fb1fb1af9fbc4d8b4f41/handbuch-geld-verdienen-im-internet-mit-affiliate-marketing.jpg)
