Embed Size (px)
Citation preview
C t “Fift YComments on “Fifty Years of Distortions in World
Food Markets”Eugenio Diaz Bonilla
Executive Director for Argentina and HaitigInter-American Development Bank

OverviewCongratulations
Methodology
Applications
Only economists care about “distortions” ?distortions ...?
…. or some random thoughts about communicating with interestedcommunicating with interested audiences…
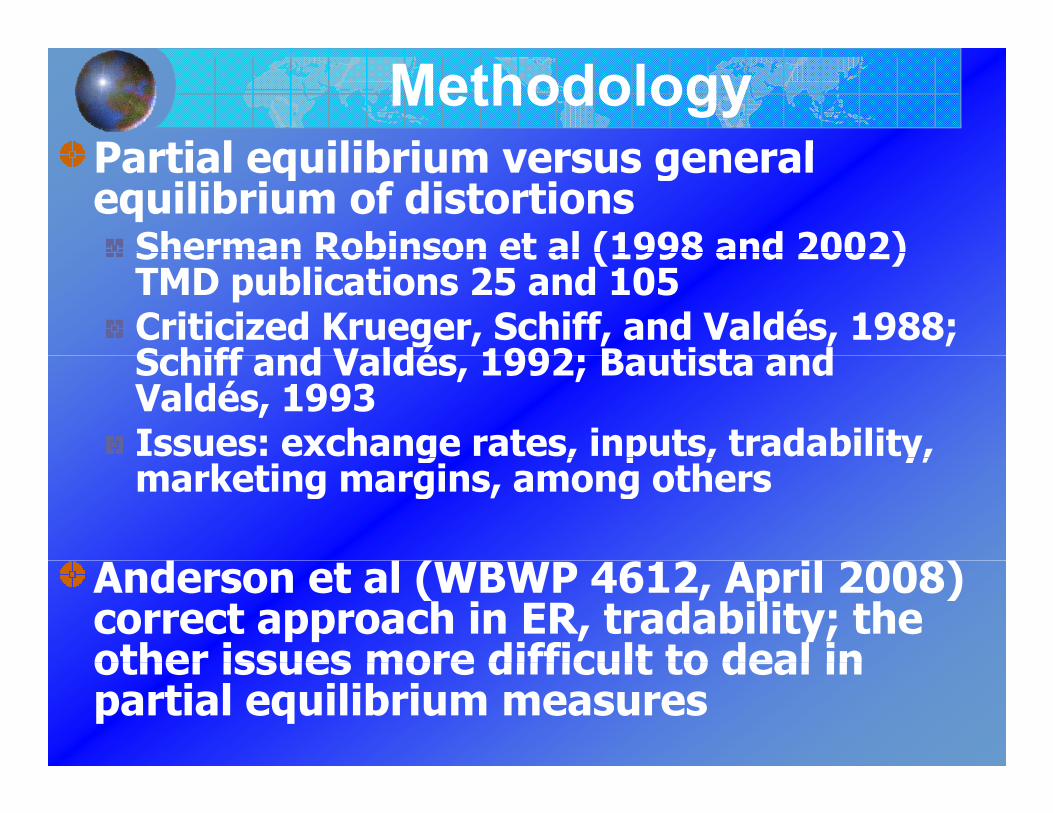
MethodologyPartial equilibrium versus generalPartial equilibrium versus general equilibrium of distortions
Sherman Robinson et al (1998 and 2002)Sherman Robinson et al (1998 and 2002) TMD publications 25 and 105Criticized Krueger, Schiff, and Valdés, 1988; Schiff and Valdés 1992; Bautista andSchiff and Valdés, 1992; Bautista and Valdés, 1993 Issues: exchange rates, inputs, tradability, g , p , y,marketing margins, among others
d l ( il )Anderson et al (WBWP 4612, April 2008) correct approach in ER, tradability; the other issues more difficult to deal inother issues more difficult to deal in partial equilibrium measures
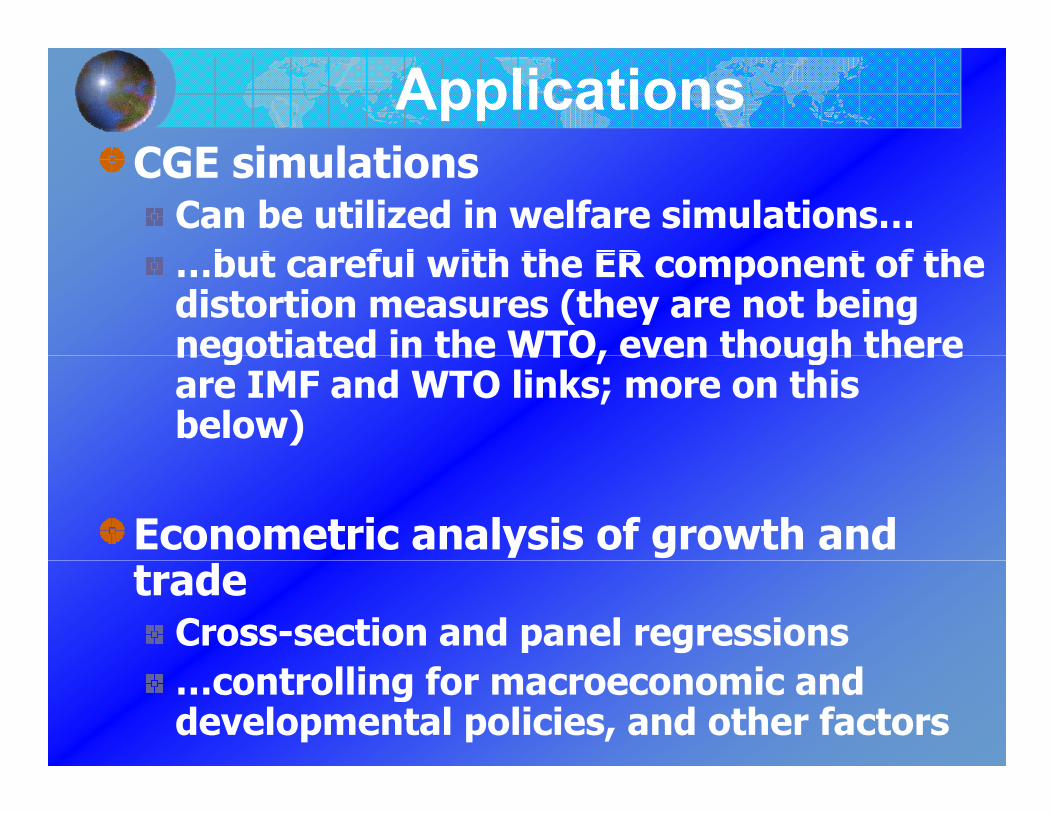
ApplicationsCGE i l tiCGE simulations
Can be utilized in welfare simulations… b t f l ith th ER t f th…but careful with the ER component of the
distortion measures (they are not being negotiated in the WTO, even though therenegotiated in the WTO, even though there are IMF and WTO links; more on this below)
Econometric analysis of growth and trade
Cross-section and panel regressions…controlling for macroeconomic and developmental policies, and other factors
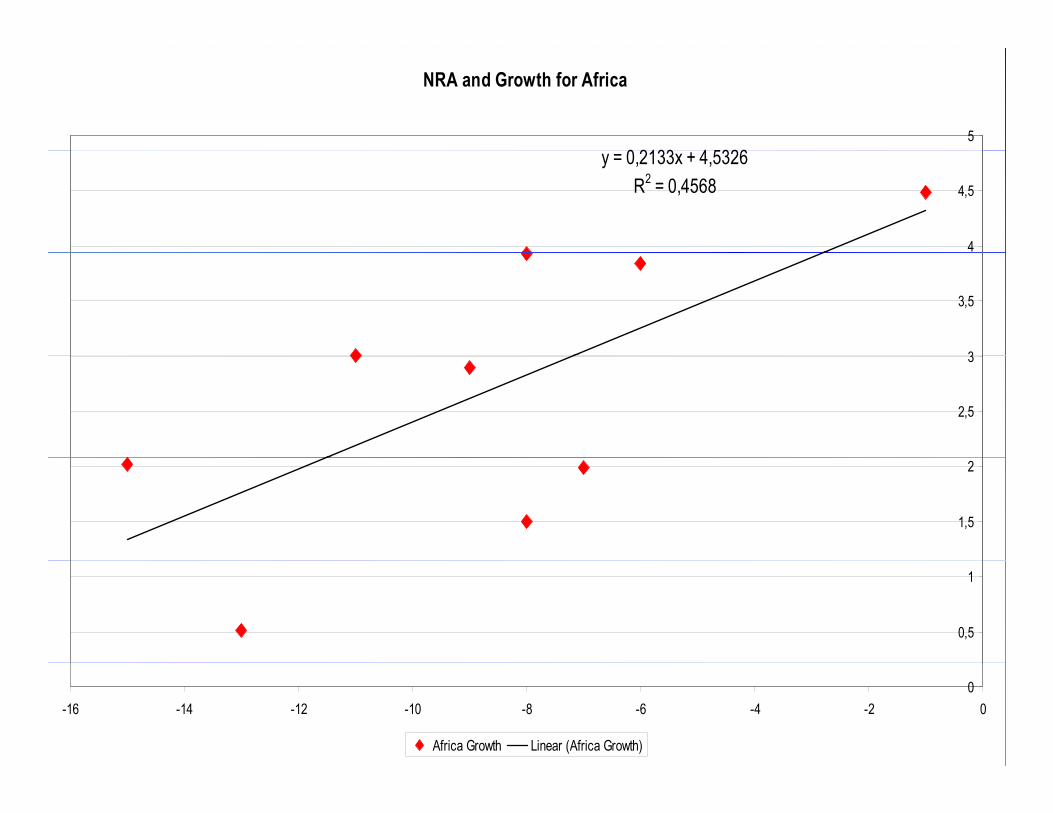
NRA and Growth for Africa
0 2133 4 53265
y = 0,2133x + 4,5326R2 = 0,4568
4
4,5
3
3,5
2,5
3
1,5
2
0,5
1
0-16 -14 -12 -10 -8 -6 -4 -2 0
Africa Growth Linear (Africa Growth)
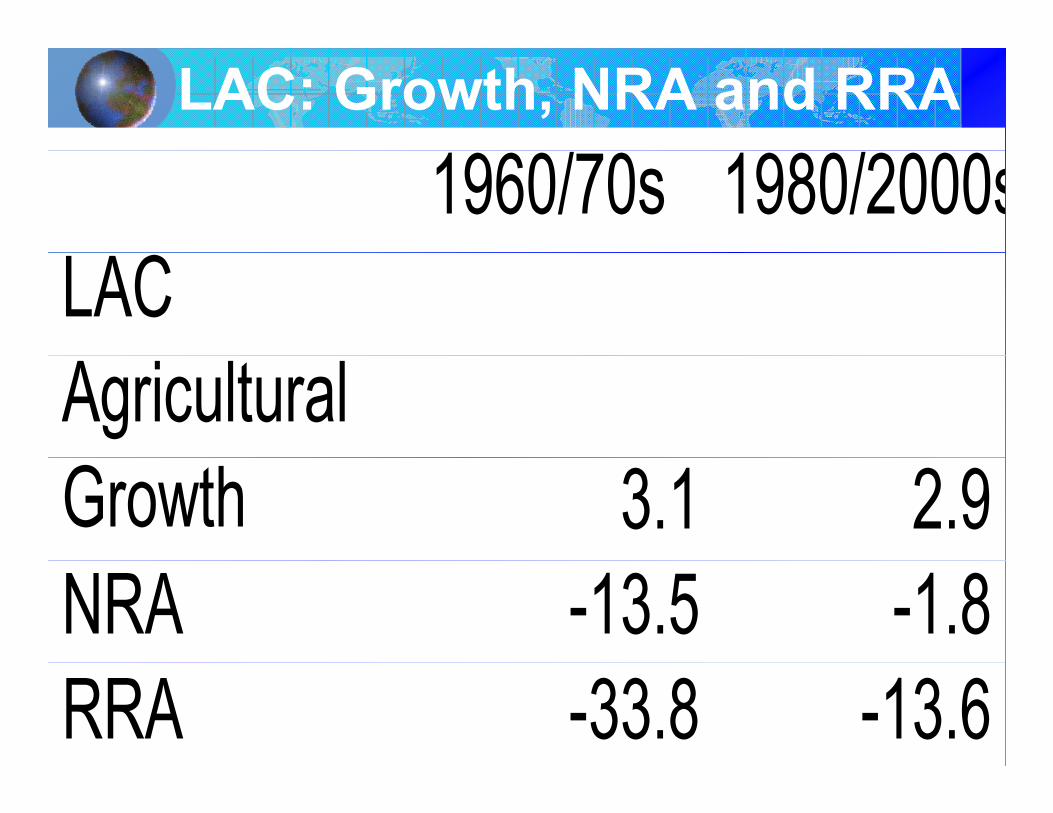
LAC: Growth, NRA and RRA
1960/70s 1980/2000sLAC Agricultural Growth 3.1 2.9NRA -13.5 -1.8RRA -33.8 -13.6
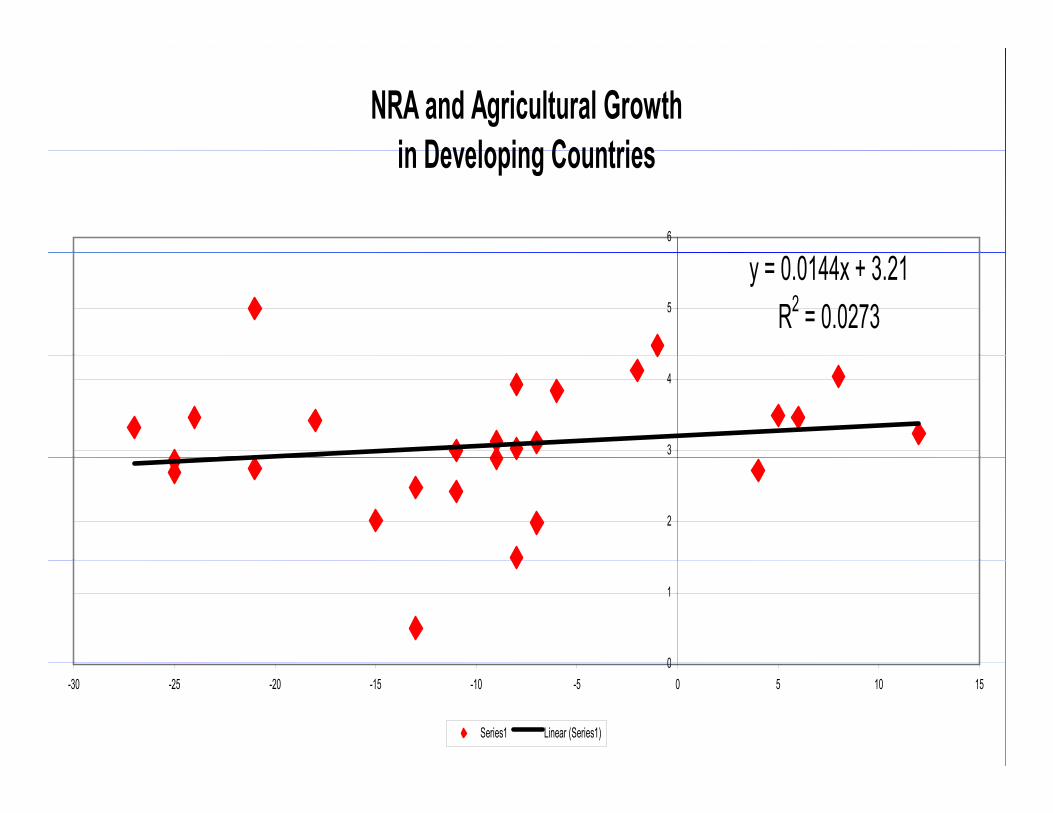
NRA and Agricultural Growth in Developing Countriesin Developing Countries
6
y = 0.0144x + 3.21R2 = 0.02735
3
4
2
0
1
0-30 -25 -20 -15 -10 -5 0 5 10 15
Series1 Linear (Series1)
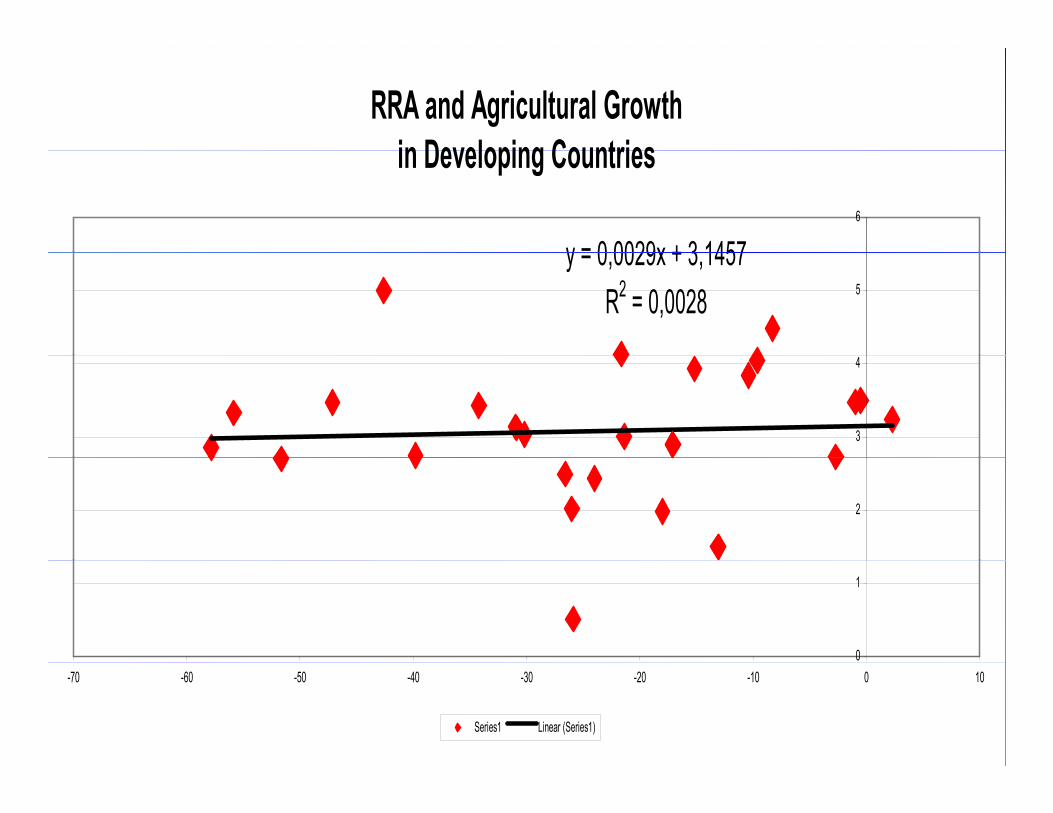
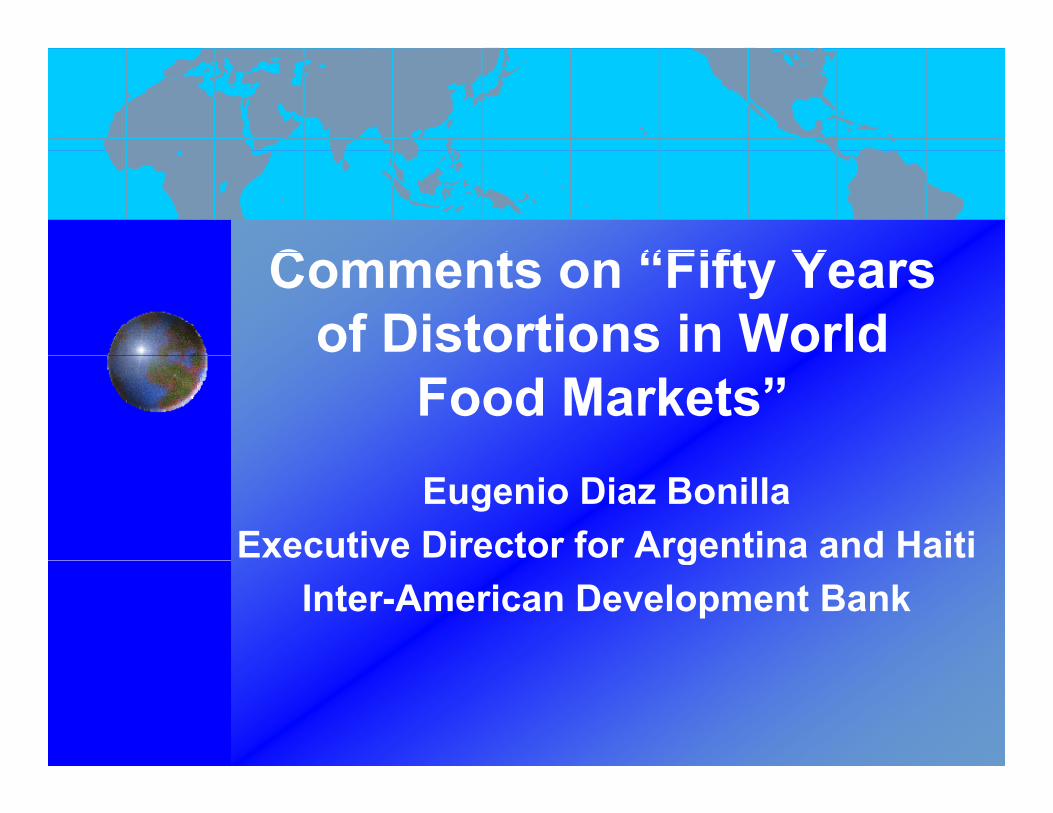
RRA and Agricultural Growth in Developing Countriesin Developing Countries
y = 0 0029x + 3 14576
y = 0,0029x + 3,1457R2 = 0,0028 5
3
4
2
0
1
-70 -60 -50 -40 -30 -20 -10 0 10
Series1 Linear (Series1)
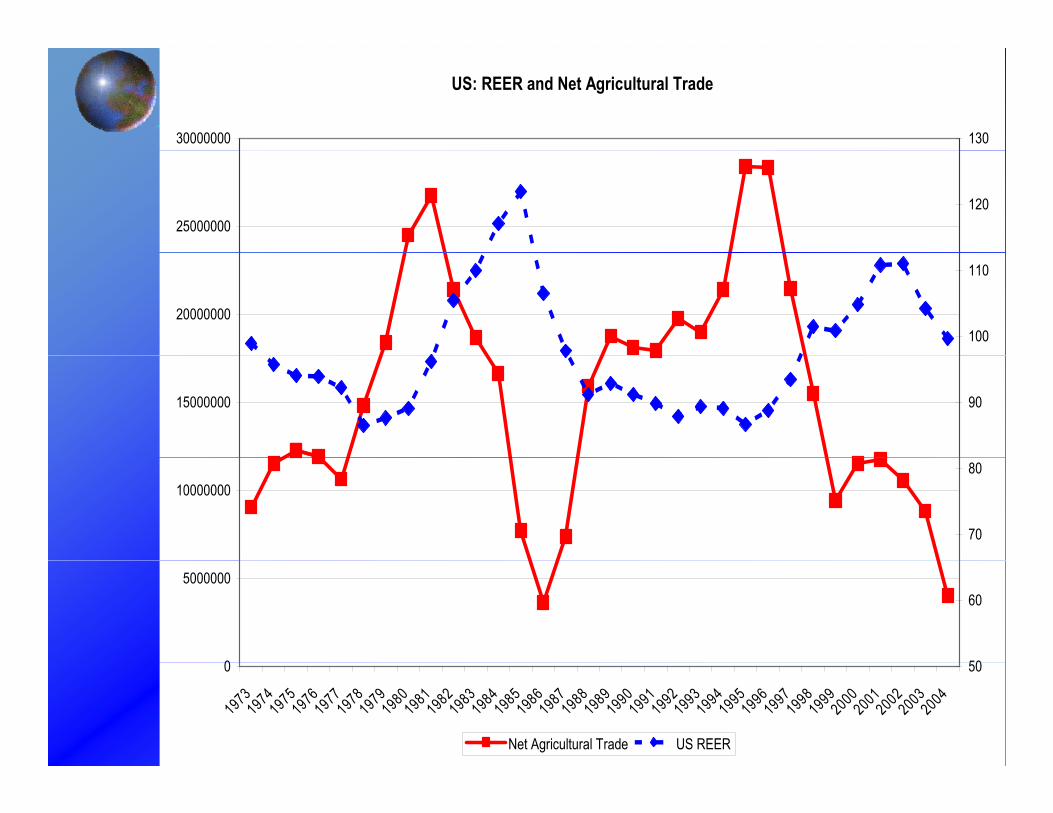
US: REER and Net Agricultural Trade
30000000 130
25000000120
20000000100
110
15000000 90
10000000
70
80
0
5000000
50
60
0
19731974197519761977197819791980198119821983198419851986198719881989199019911992199319941995199619971998199920002001200220032004
50
Net Agricultural Trade US REER
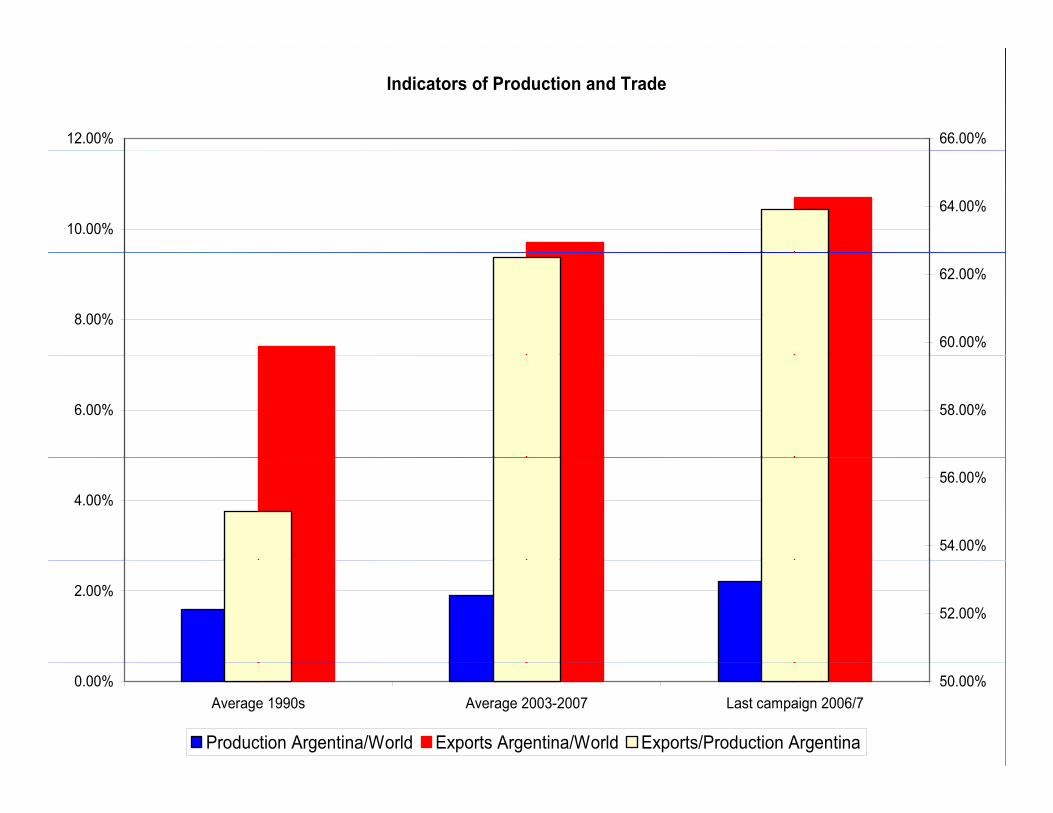
Indicators of Production and Trade
12.00% 66.00%
10.00%64.00%
8.00%60.00%
62.00%
6.00% 58.00%
4.00%
54.00%
56.00%
2.00%52.00%
0.00%Average 1990s Average 2003-2007 Last campaign 2006/7
50.00%
Production Argentina/World Exports Argentina/World Exports/Production Argentina
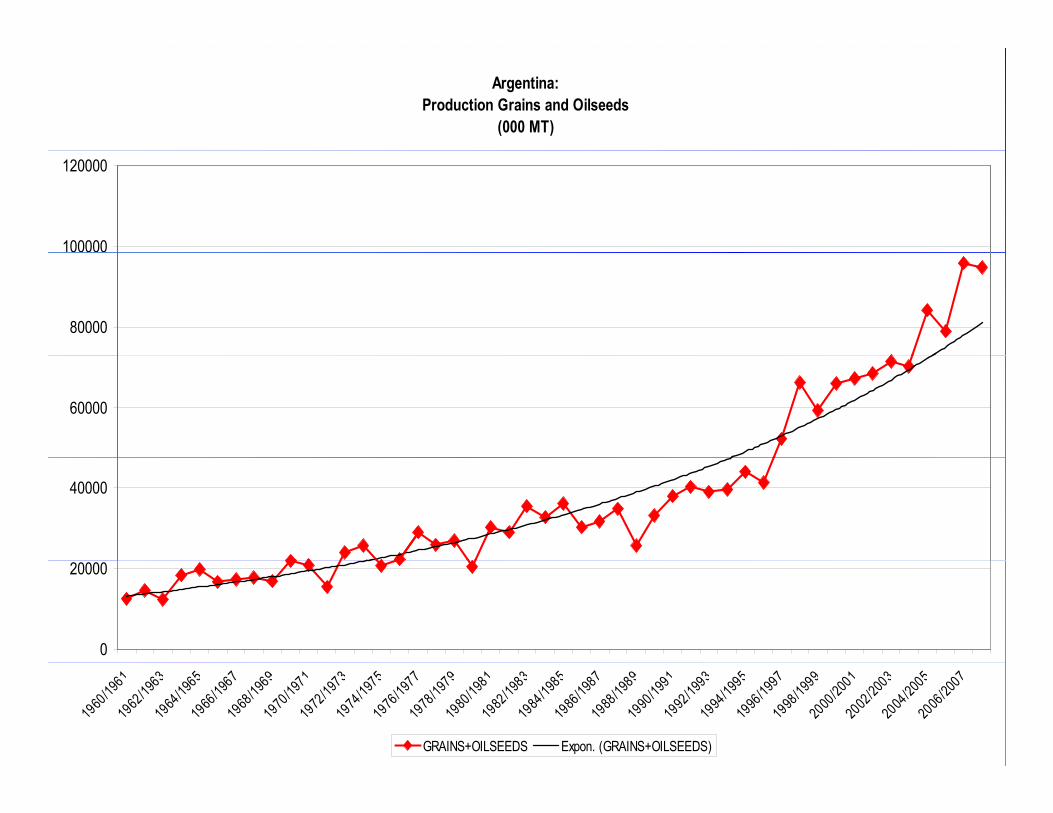
Argentina: Production Grains and Oilseeds
(000 MT)
100000
120000
80000
60000
40000
0
20000
1960
/1961
1962
/1963
1964
/1965
1966
/1967
1968
/1969
1970
/1971
1972
/1973
1974
/1975
1976
/1977
1978
/1979
1980
/1981
1982
/1983
1984
/1985
1986
/1987
1988
/1989
1990
/1991
1992
/1993
1994
/1995
1996
/1997
1998
/1999
2000
/2001
2002
/2003
2004
/2005
2006
/2007
GRAINS+OILSEEDS Expon. (GRAINS+OILSEEDS)
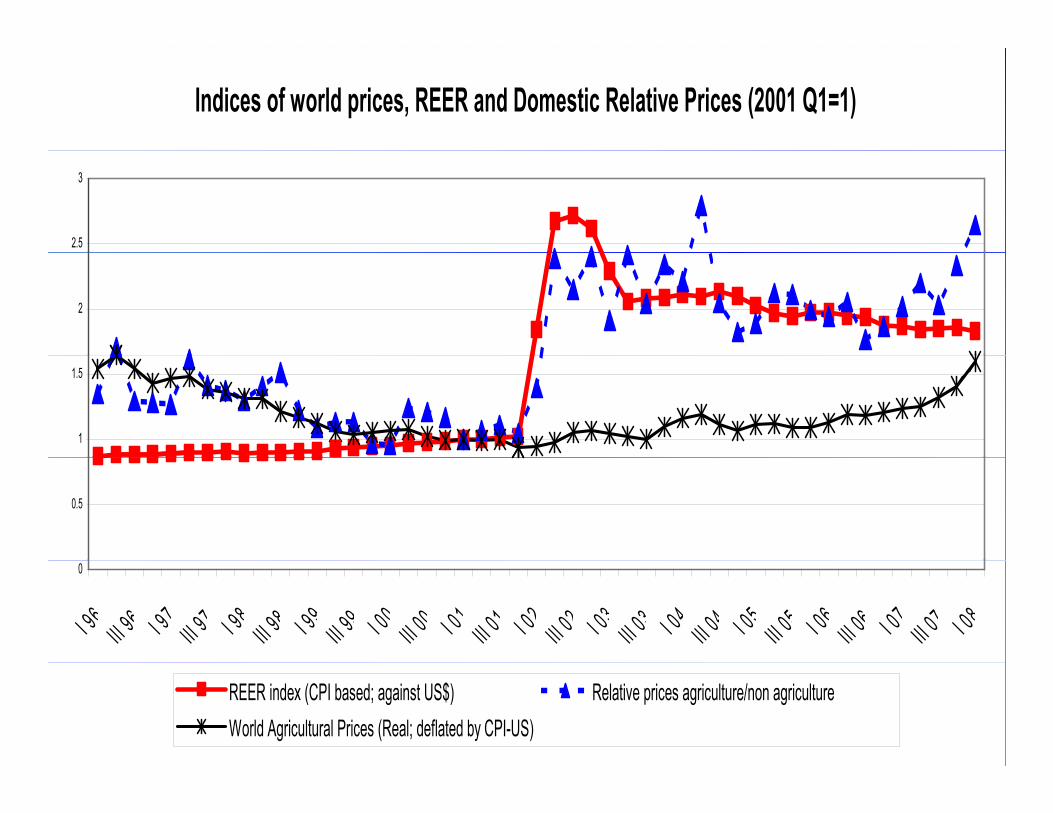
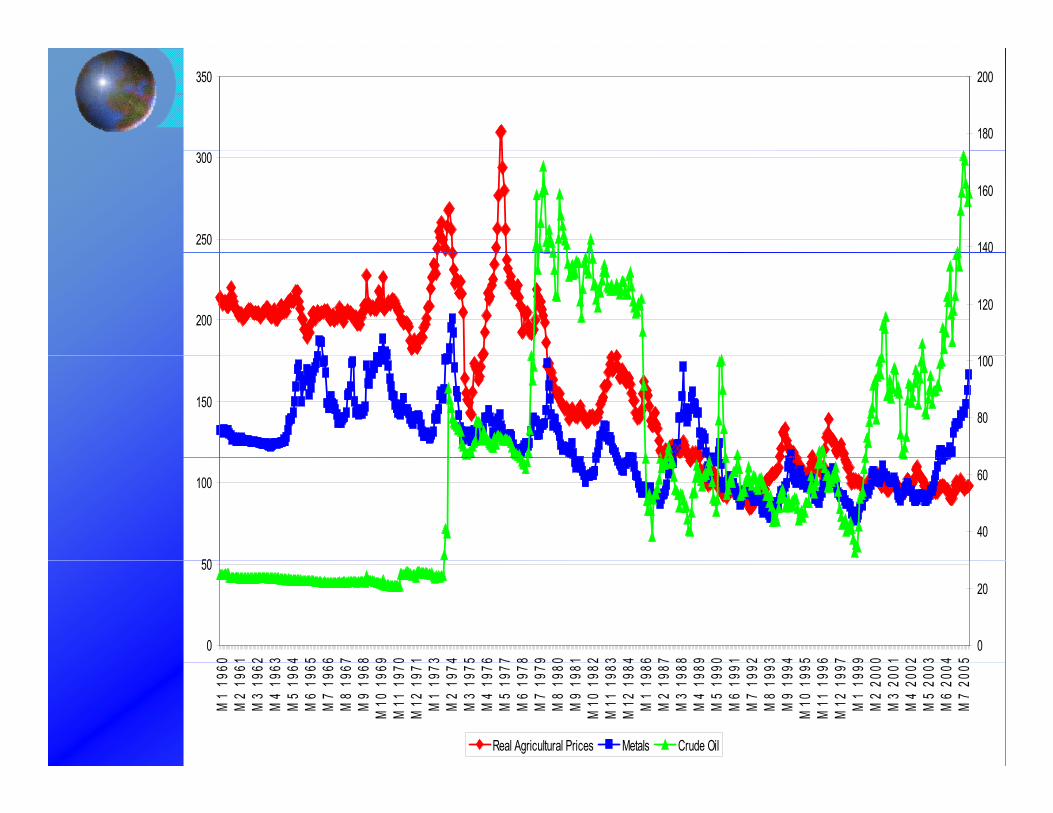
Indices of world prices, REER and Domestic Relative Prices (2001 Q1=1)
2.5
3
2
1
1.5
0.5
0
I 96III 9
6 I 97III 9
7 I 98III 9
8 I 99III 9
9 I 00III 0
0 I 01III 0
1 I 02III 0
2 I 03III 0
3 I 04III 0
4 I 05III 0
5 I 06III 0
6 I 07III 0
7 I 08
REER index (CPI based; against US$) Relative prices agriculture/non agricultureWorld Agricultural Prices (Real; deflated by CPI-US)
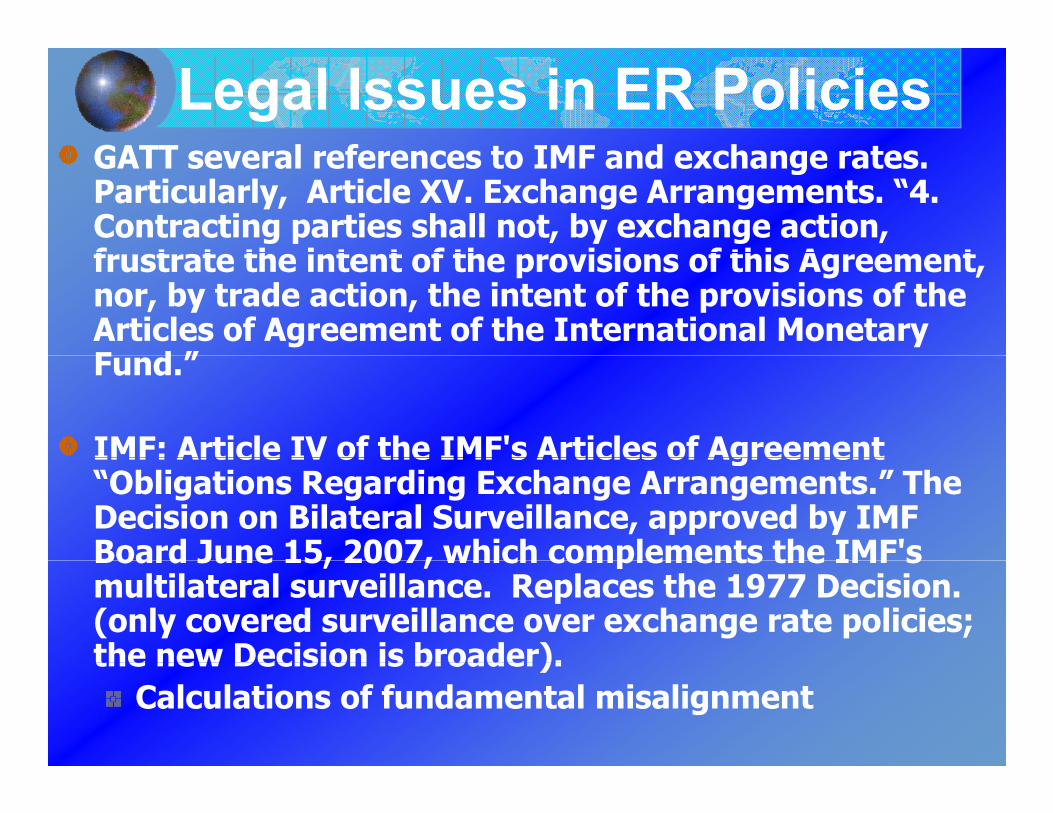
Legal Issues in ER PoliciesGATT se e al efe ences to IMF and e change atesGATT several references to IMF and exchange rates. Particularly, Article XV. Exchange Arrangements. “4. Contracting parties shall not, by exchange action, f t t th i t t f th i i f thi A tfrustrate the intent of the provisions of this Agreement, nor, by trade action, the intent of the provisions of the Articles of Agreement of the International Monetary F d ”Fund.”
IMF: Article IV of the IMF's Articles of AgreementIMF: Article IV of the IMF s Articles of Agreement “Obligations Regarding Exchange Arrangements.” The Decision on Bilateral Surveillance, approved by IMF Board June 15, 2007, which complements the IMF'sBoard June 15, 2007, which complements the IMF s multilateral surveillance. Replaces the 1977 Decision. (only covered surveillance over exchange rate policies; the new Decision is broader).the new Decision is broader).
Calculations of fundamental misalignment

CommunicationW i t t d t t lk i t fWe economists tend to talk in terms of distortions and gains in welfare…L b tt tt ti ttLosses are better attention getter
“Tell me where it hurts” paperN d t d b t th “ l ”Need to debate the same “values”
Food security (paper with cluster analysis)analysis)Poverty (microsimulations; careful with labor market modeling)labor market modeling)Multifunctionality (“That was then and this is now” paper)Livelihood or survival strategies (“Thinking Inside the Boxes” paper)
ConclusionsG t j b t t ti f lGreat job at constructing useful indicators with large coverage (time, country, products)country, products)Need to better understand links to agricultural growth and trade…Consider price effects but also income effects; broader framework with other macroeconomic and growth policiesmacroeconomic and growth policies…For trade negotiations, ER issues are separate (although they may eventuallyseparate (although they may eventually converge…)As economists our research program and
ffcommunication efforts must also consider “values” being debated…

Thanks....
350
180
200
250
300
140
160
200120
15080
100
50
100
40
60
0
50
0 1 2 3 4 5 6 7 8 9 0 1 3 4 5 6 7 8 9 0 1 2 3 4 6 7 8 9 0 1 2 3 4 5 6 7 9 0 1 2 3 4 5
0
20
M1
196
M2
196
M3
196
M4
196
M5
1964
M6
196
M7
196
M8
196
M9
196
M10
196
M11
197
M12
197
M1
197
M2
1974
M3
197
M4
197
M5
197
M6
197
M7
197
M8
198
M9
198
M10
198
M11
198
M12
198
4M
1 19
8M
2 19
8M
3 19
8M
4 19
8M
5 19
9M
6 19
9M
7 19
9M
8 19
9M
9 19
94M
10 1
99M
11 1
99M
12 1
99M
1 19
9M
2 20
0M
3 20
0M
4 20
0M
5 20
0M
6 20
04M
7 20
0
Real Agricultural Prices Metals Crude Oil
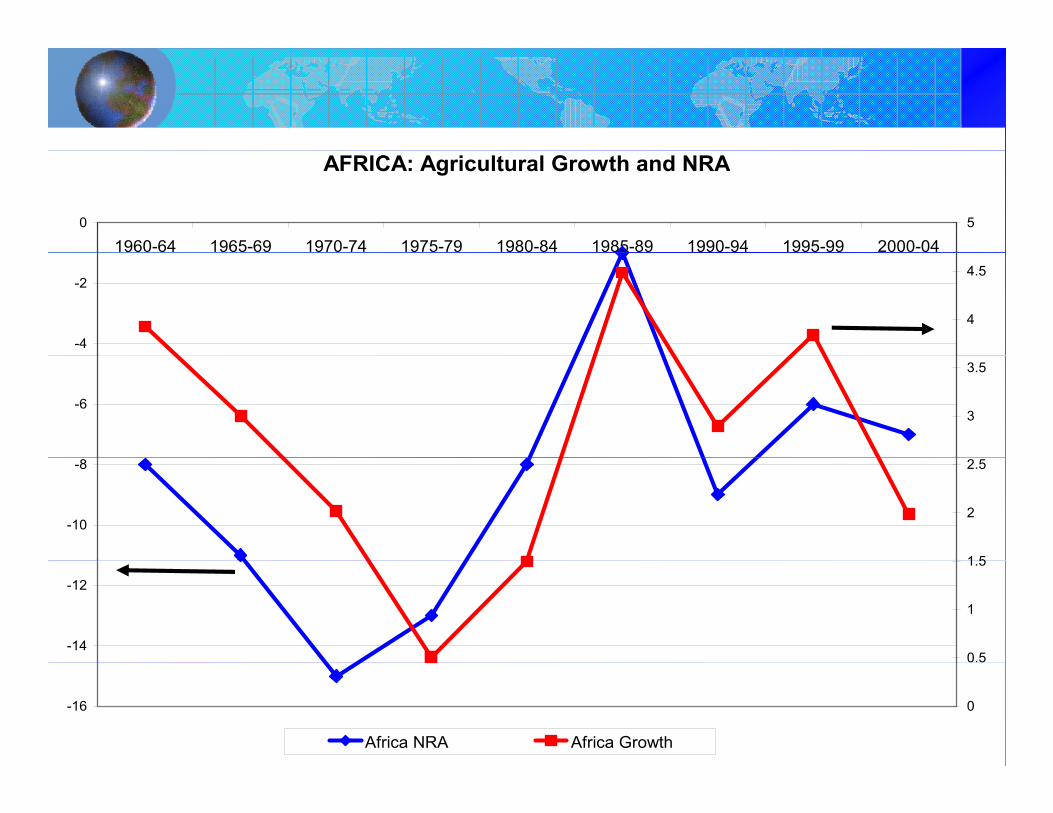
AFRICA: Agricultural Growth and NRA
0
1960-64 1965-69 1970-74 1975-79 1980-84 1985-89 1990-94 1995-99 2000-045
-4
-2
4
4.5
-63
3.5
-10
-8
1 5
2
2.5
-14
-12
0.5
1
1.5
-16 0
Africa NRA Africa Growth
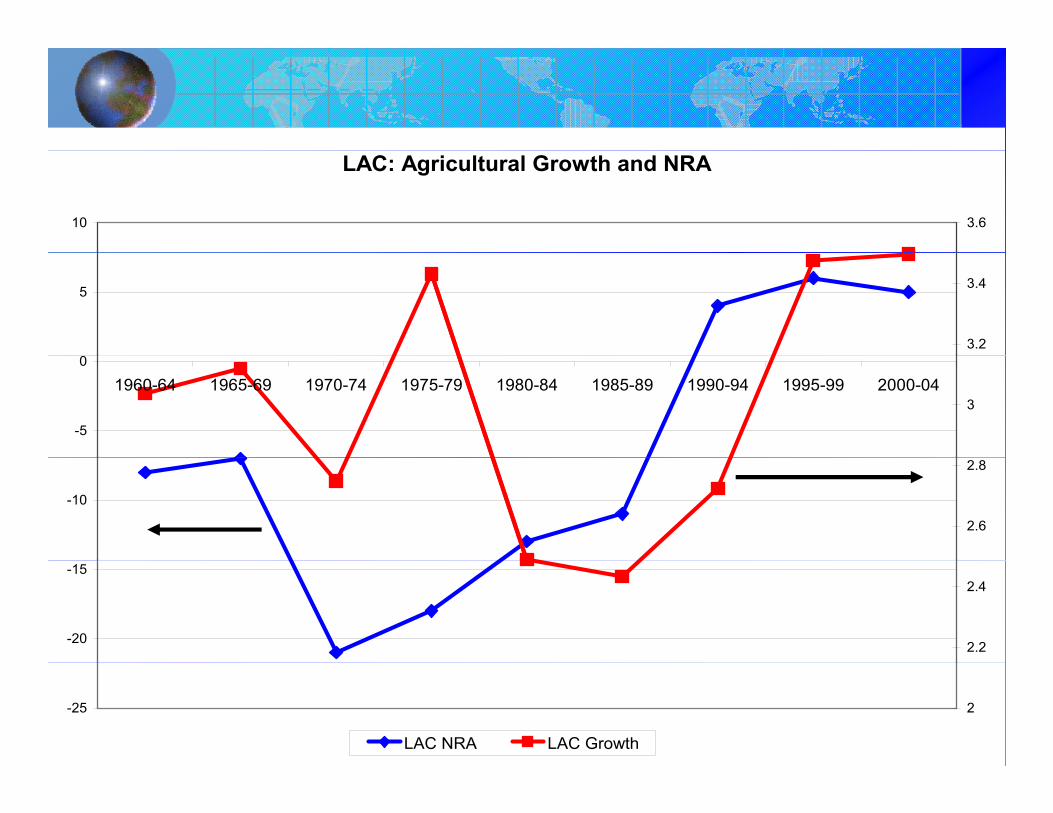
LAC: Agricultural Growth and NRA
10 3.6
5
3.2
3.4
-5
0
1960-64 1965-69 1970-74 1975-79 1980-84 1985-89 1990-94 1995-99 2000-043
-10
2.6
2.8
-20
-15
2.2
2.4
-25 2
LAC NRA LAC Growth
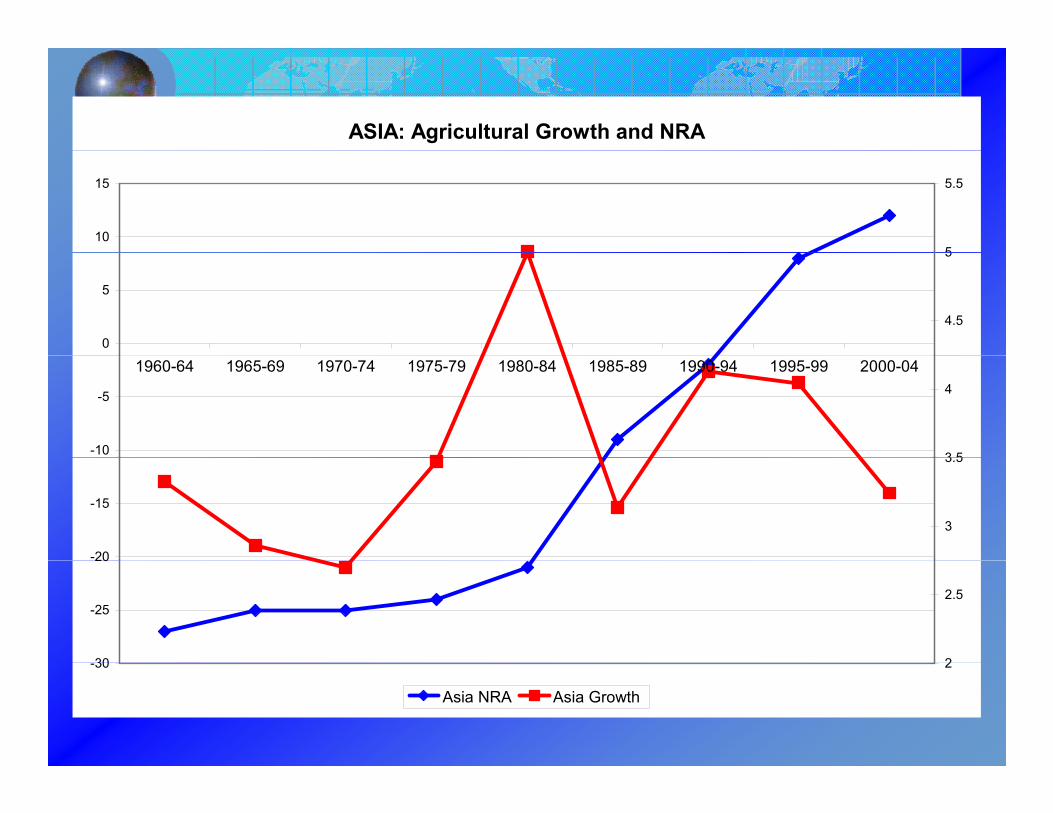
ASIA: Agricultural Growth and NRA
10
15
5
5.5
0
5
4.5
5
-10
-5
1960-64 1965-69 1970-74 1975-79 1980-84 1985-89 1990-94 1995-99 2000-04
3 5
4
-20
-15
3
3.5
30
-25
20
2
2.5
-30 2
Asia NRA Asia Growth
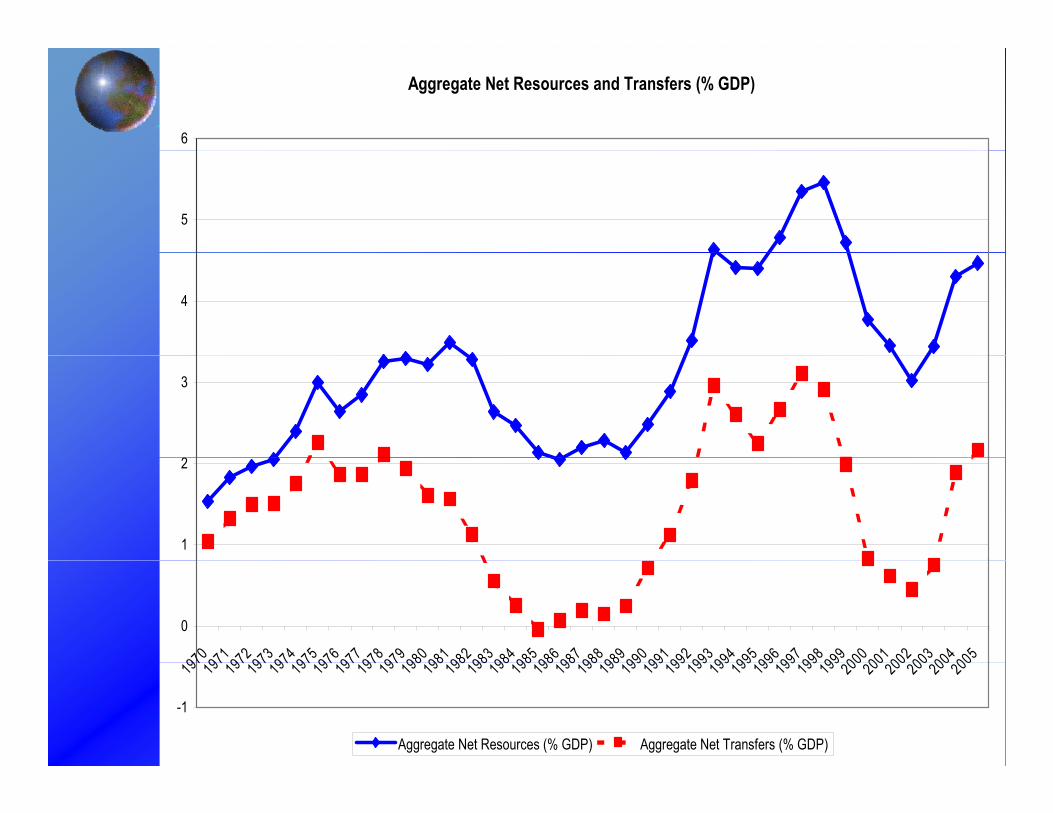
Aggregate Net Resources and Transfers (% GDP)
6
5
4
2
3
1
2
0
970971972973974975976977978979980981982983984985986987988989990991992993994995996997998999200020012002200320042005
-1
197197197197197197197197197197198198198198198198198198198198199199199199199199199199199199200200200200200200
Aggregate Net Resources (% GDP) Aggregate Net Transfers (% GDP)
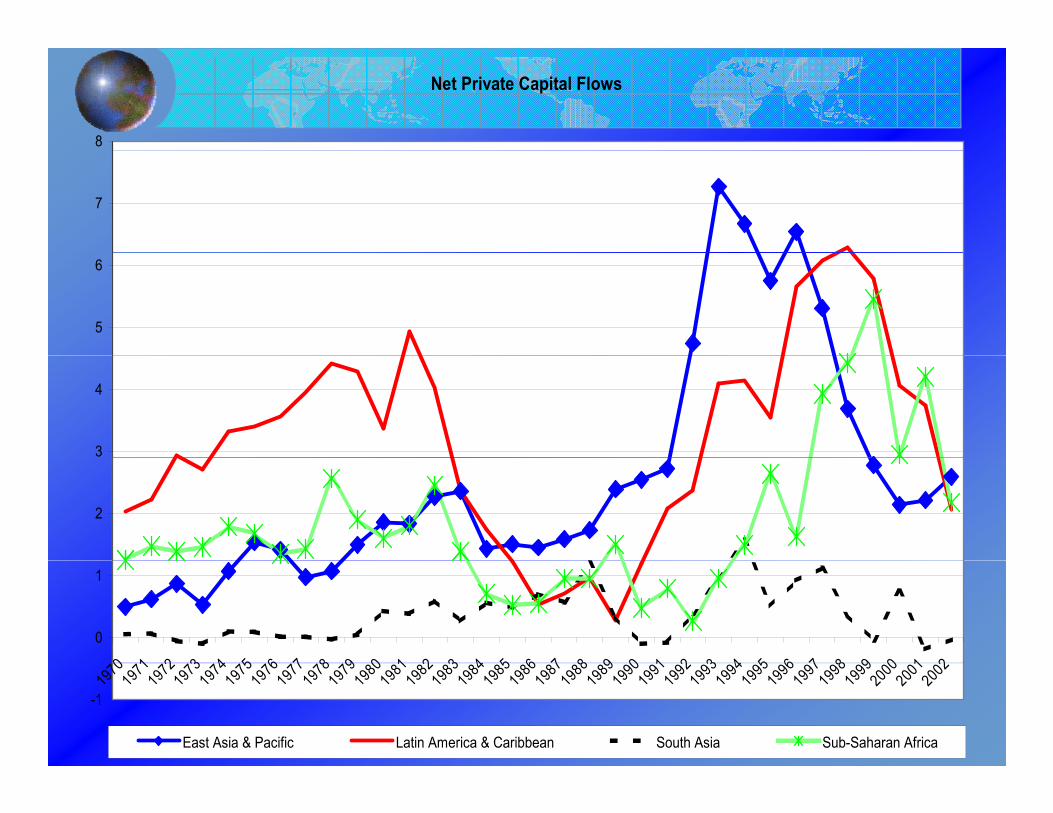
Net Private Capital Flows
8
7
5
6
3
4
2
0
1
0 1 2 3 4 5 6 7 8 9 0 1 2 3 4 5 6 7 8 9 0 1 2 3 4 5 6 7 8 9 0 1 2
-1
1970
1971
197219
73197
4197519
76197
719
78197
9198019
81198
2198319
84198
519
86198
7198819
89199
0199119
92199
319
94199
5199619
97199
8199920
00200
120
02
East Asia & Pacific Latin America & Caribbean South Asia Sub-Saharan Africa
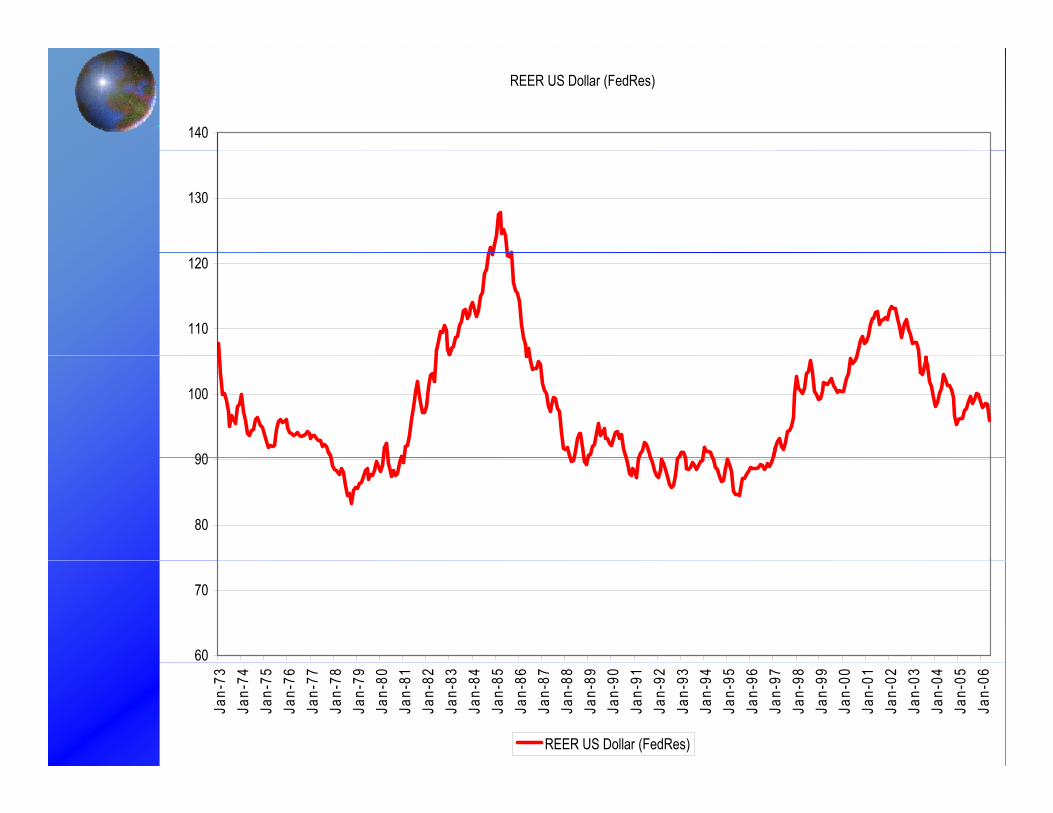
REER US Dollar (FedRes)
140
130
110
120
90
100
80
90
60
70
Jan-
73Ja
n-74
Jan-
75Ja
n-76
Jan-
77Ja
n-78
Jan-
79Ja
n-80
Jan-
81Ja
n-82
Jan-
83Ja
n-84
Jan-
85Ja
n-86
Jan-
87Ja
n-88
Jan-
89Ja
n-90
Jan-
91Ja
n-92
Jan-
93Ja
n-94
Jan-
95Ja
n-96
Jan-
97Ja
n-98
Jan-
99Ja
n-00
Jan-
01Ja
n-02
Jan-
03Ja
n-04
Jan-
05Ja
n-06
REER US Dollar (FedRes)
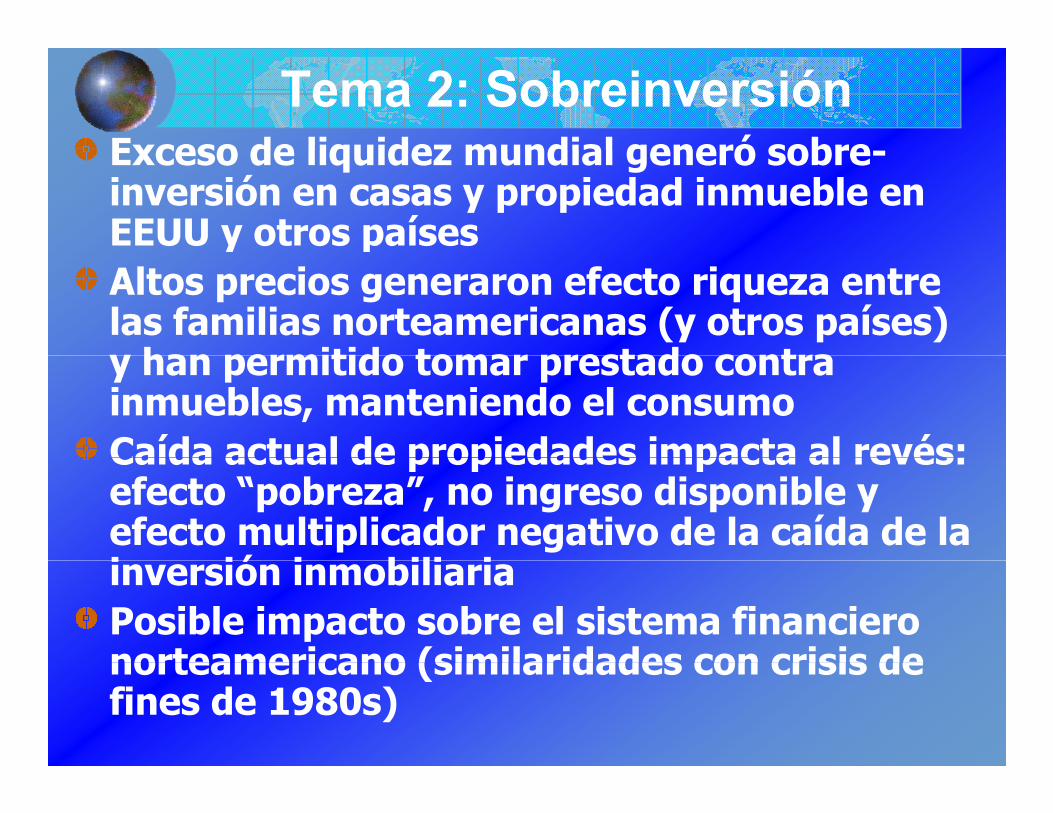
Tema 2: Sobreinversión Exceso de liquidez mundial generó sobreExceso de liquidez mundial generó sobre-inversión en casas y propiedad inmueble en EEUU y otros paísesy pAltos precios generaron efecto riqueza entre las familias norteamericanas (y otros países) y han permitido tomar prestado contray han permitido tomar prestado contra inmuebles, manteniendo el consumoCaída actual de propiedades impacta al revés:Caída actual de propiedades impacta al revés: efecto “pobreza”, no ingreso disponible y efecto multiplicador negativo de la caída de la i ió i bili iinversión inmobiliariaPosible impacto sobre el sistema financiero norteamericano (similaridades con crisis denorteamericano (similaridades con crisis de fines de 1980s)
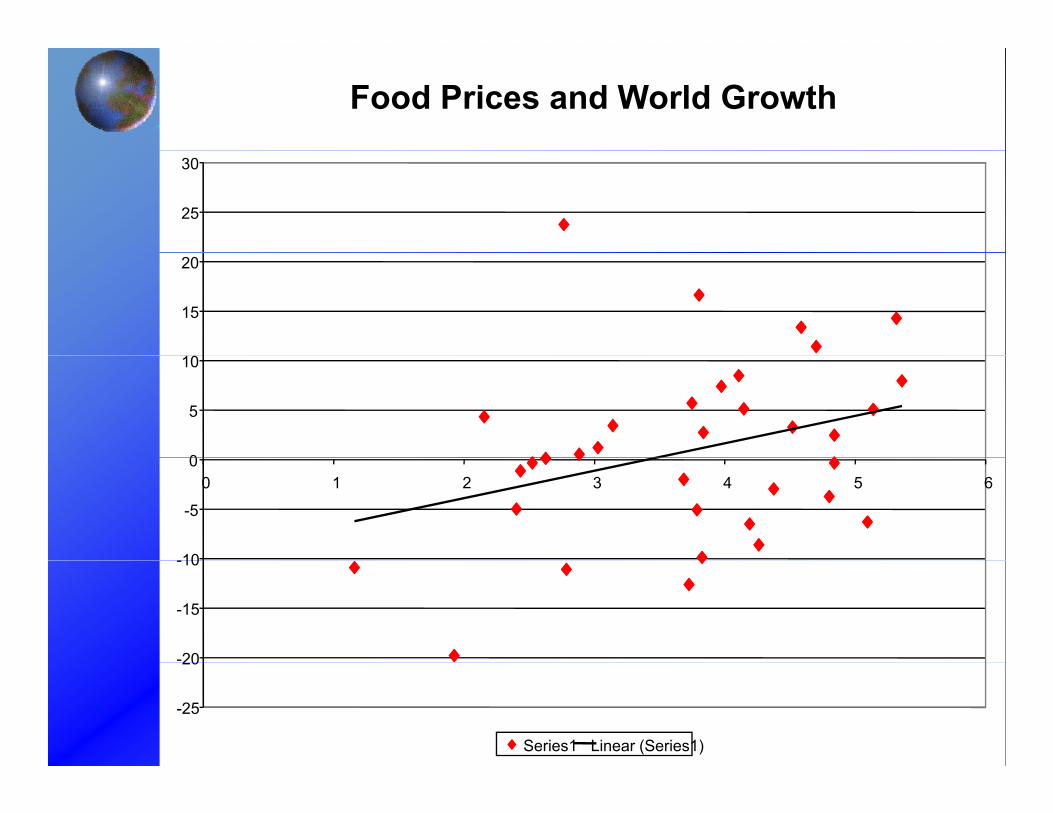
Food Prices and World Growth
25
30
15
20
0
5
10
-10
-5
00 1 2 3 4 5 6
-20
-15
-10
-25
20
Series1 Linear (Series1)
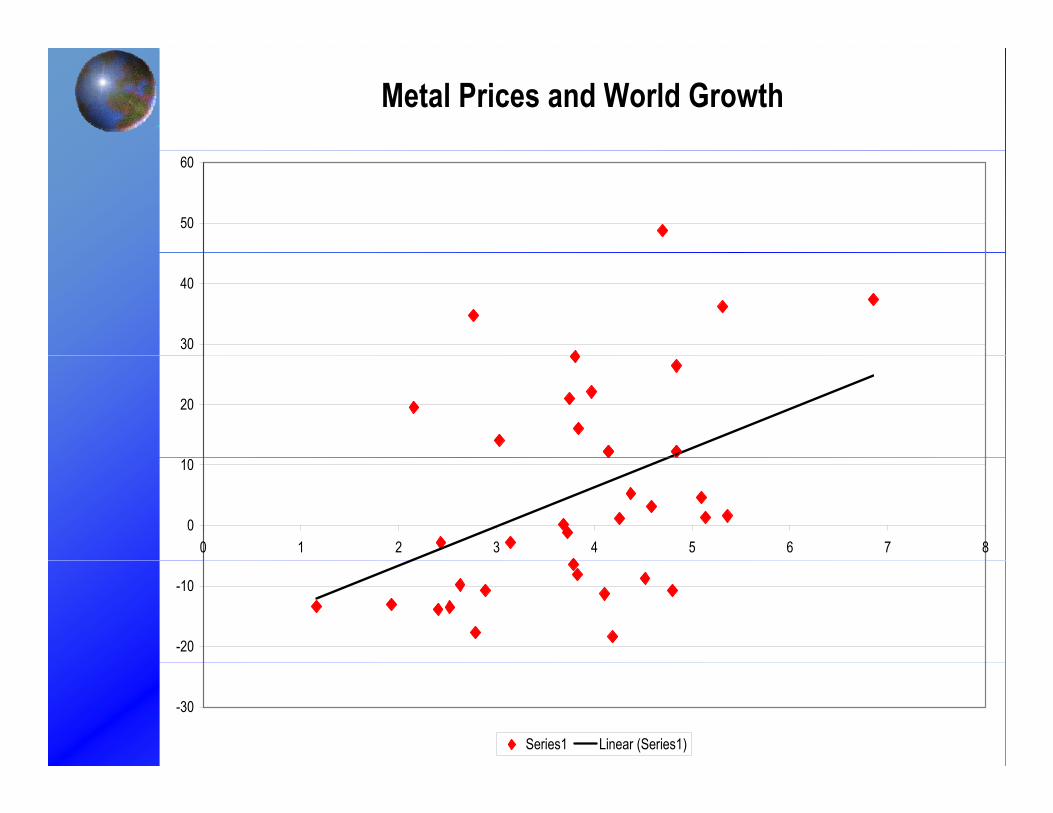
Metal Prices and World Growth
50
60
30
40
20
0
10
0 1 2 3 4 5 6 7 8
-20
-10
-30
Series1 Linear (Series1)
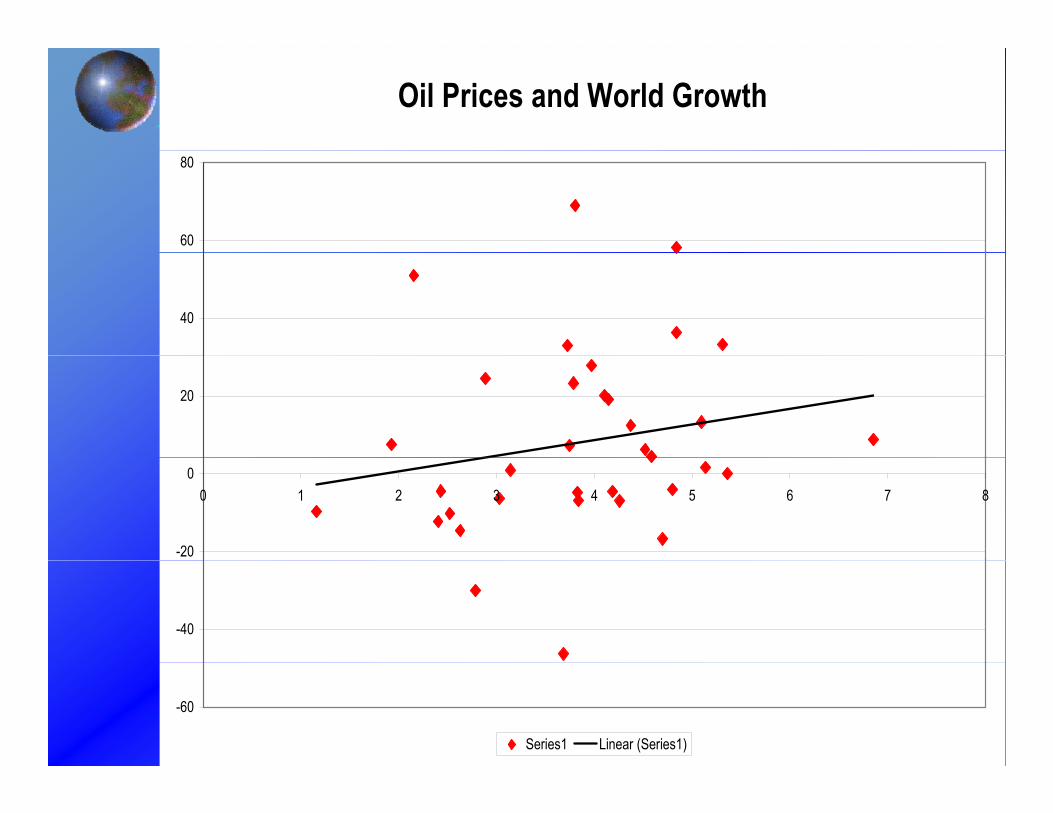
Oil Prices and World Growth
60
80
40
20
-20
00 1 2 3 4 5 6 7 8
-40
-60
Series1 Linear (Series1)
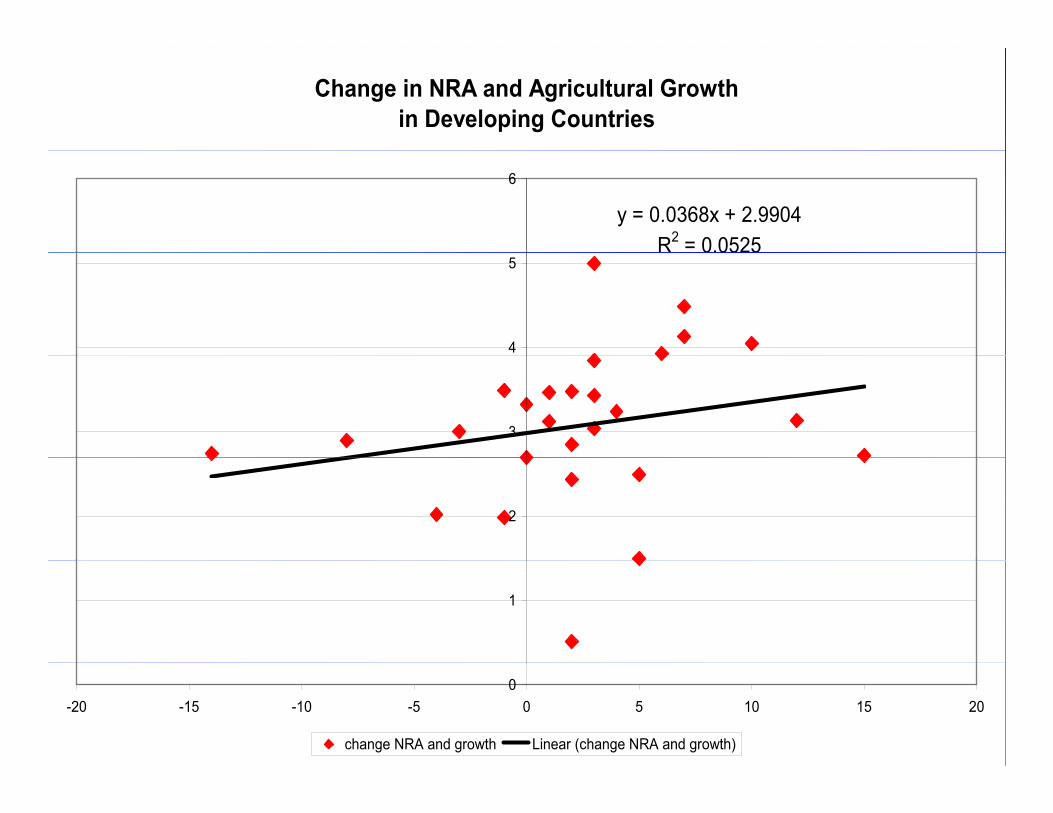
Change in NRA and Agricultural Growth in Developing Countries
y = 0.0368x + 2.9904R2 = 0.0525
6
4
5
3
2
1
0-20 -15 -10 -5 0 5 10 15 20
change NRA and growth Linear (change NRA and growth)
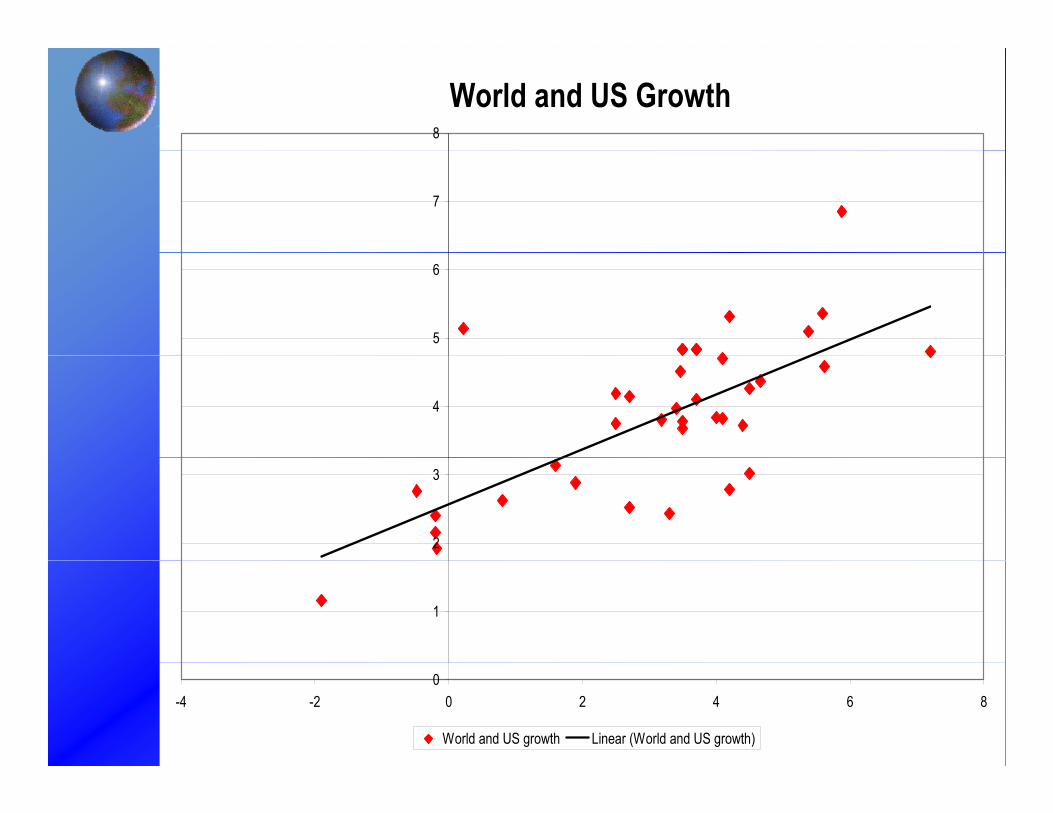
World and US Growth 8
7
5
6
4
2
3
1
0-4 -2 0 2 4 6 8
World and US growth Linear (World and US growth)
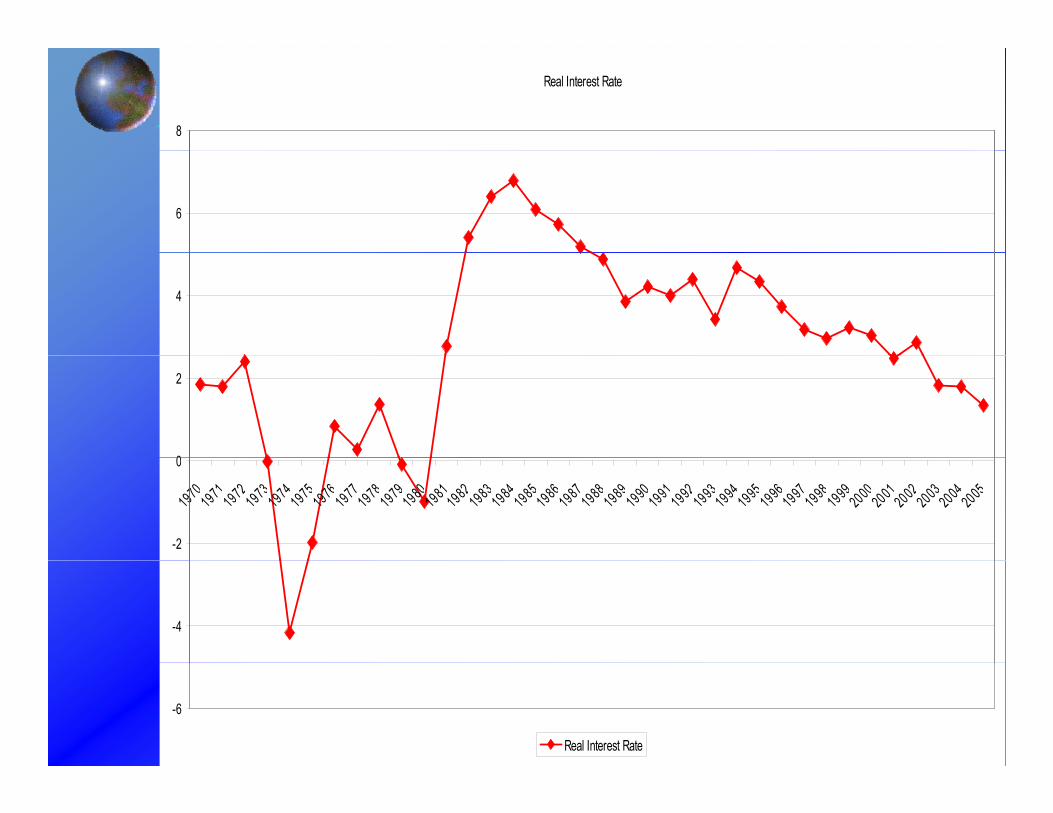
Real Interest Rate
8
6
4
0
2
-2
0
197019711972197319741975197619771978197919801981198219831984198519861987198819891990199119921993199419951996199719981999200020012002200320042005
-4
-6
Real Interest Rate
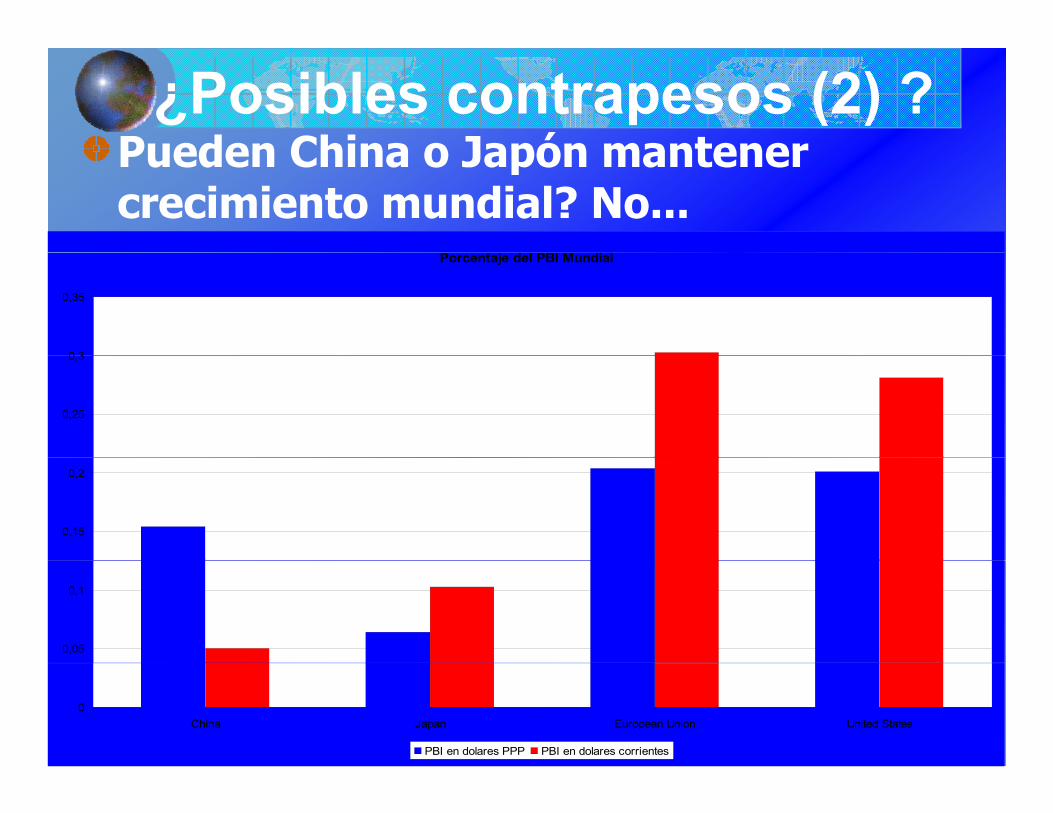
¿Posibles contrapesos (2) ?Pueden China o Japón mantenerPueden China o Japón mantener crecimiento mundial? No...
P j d l PBI M di lPorcentaje del PBI Mundial
0 3
0,35
0,25
0,3
0,15
0,2
0,05
0,1
0China Japan European Union United States
PBI en dolares PPP PBI en dolares corrientes