Embed Size (px)
Citation preview

credit-suisse.com/holtmethodology Market Commentary
HOLT
Global Accounting Distortions The Impact on Financial Metrics and Investor Insights
December 7, 2016
Chris Morck
HOLT Model Specialist
312-345-6175
Ron Graziano, CPA
HOLT Accounting and Equity Insights
312-345-6169
CLARITY IS CONFIDENCE HOLT
THIS IS MARKET COMMENTARY AND NOT A RESEARCH DOCUMENT.
Given consistent inputs/assumptions, all operating & valuation metrics
should produce the same result
Law of One Price
Relative Valuation Models (P/E, P/B
Multiples)
Discounted Cash Flows Models (CFROI®, EVA)
Option Valuation Models
1
Source: HOLT

CLARITY IS CONFIDENCE HOLT
THIS IS MARKET COMMENTARY AND NOT A RESEARCH DOCUMENT.
THIS IS MARKET COMMENTARY AND NOT A RESEARCH DOCUMENT.
Special Charges (Pro-Forma)
Pensions Charges
Share Buybacks
Let assets age
Increasing Debt
Taxes
Cut R&D
Lease assets off balance sheet
Change depreciation schedule
Grow sales
Increase margins
Improve asset utilization
Grow sales
Increase (cleaned up) margins
Improve asset uti l ization
(including all assets)
No Economic Improvement
Accounting (IFRS and US GAAP) based metrics contain distortions
Ways to Improve Accounting Returns Ways to Improve Economic Returns
Source: HOLT
2
CLARITY IS CONFIDENCE HOLT
THIS IS MARKET COMMENTARY AND NOT A RESEARCH DOCUMENT.
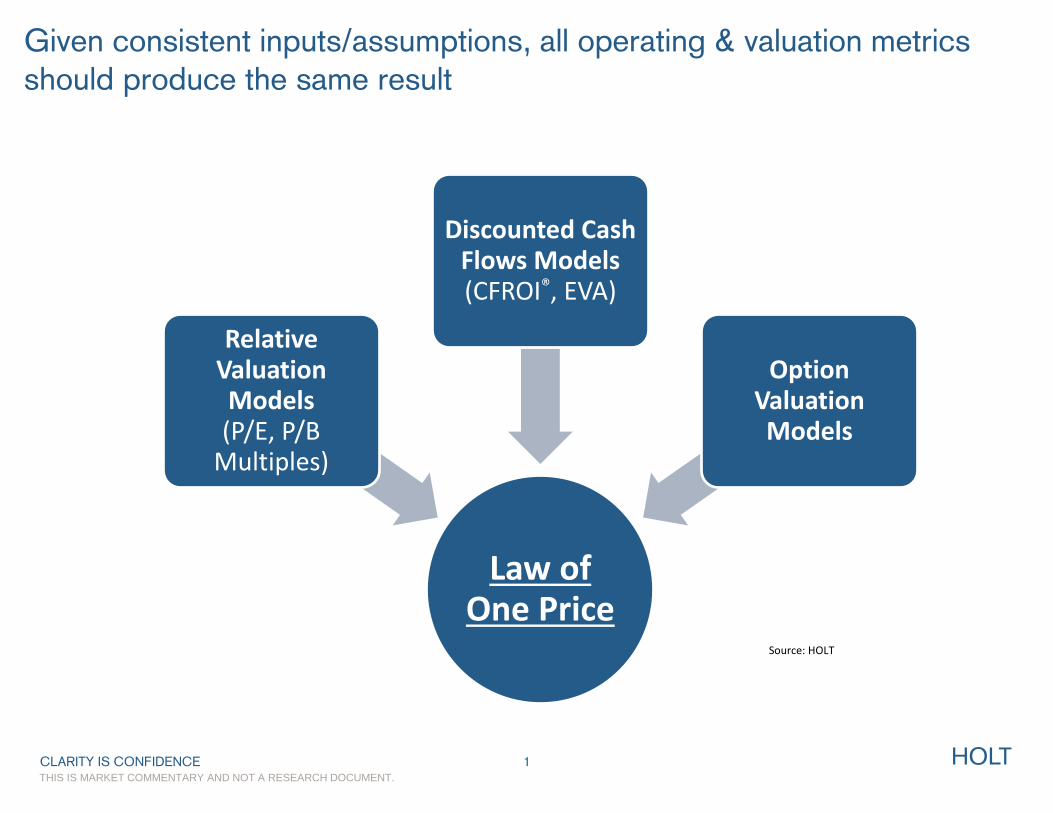
These distortions can surface in many different formats depending on
the metric
ROIC
ROE
USA Aggregate: ROE vs ROIC vs CFROI®
CFROI
3
Source: HOLT Lens™. Universe largest US companies (ex financials and reg. utilities) by market cap (1,800 firms as of 2015 ). 2016 is estimate.
CLARITY IS CONFIDENCE HOLT
THIS IS MARKET COMMENTARY AND NOT A RESEARCH DOCUMENT.
THIS IS MARKET COMMENTARY AND NOT A RESEARCH DOCUMENT.
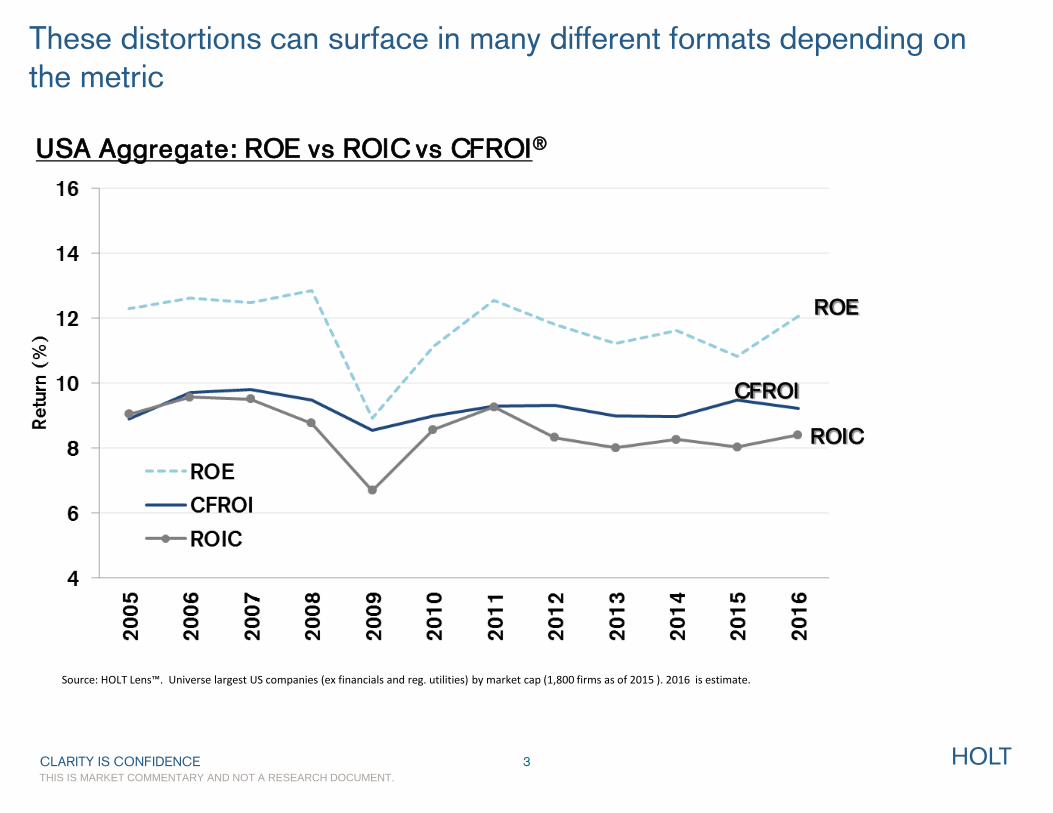
HOLT’s Relative Wealth Chart: A clean measure of operating returns
HOLT Adjustments to Calculate CFROI
Inflation adjusted
Depreciation (use gross instead of net plant)
Asset Life/Mix
Acquisition Accounting (Intangibles)
Pension Gains/Losses
Include the net pension obligation as debt
Taxes
Capitalize Research & Development
Adjust for Special Items/ProForma
Capitalize Operating Leases
LIFO & FIFO Accounting
Adjust for stock option accounting
CFROI trend: What is the cash flow return on total investment
Asset Growth: Is the company able to reinvest cash flows
Microsoft (MSFT)
Source: HOLT Lens™ Company is shown for illustration purposes only.
4

CLARITY IS CONFIDENCE HOLT
THIS IS MARKET COMMENTARY AND NOT A RESEARCH DOCUMENT.
THIS IS MARKET COMMENTARY AND NOT A RESEARCH DOCUMENT.
Five Accounting Distortions That Matter Right Now
1. Debt…Leveraging ROE
2. Unpredictable Pensions
3. Intangibles…A Tangible Distortion
4. Pro-Forma EPS
5. Corporate Tax Reform…It’s Gonna Happen?
5

CLARITY IS CONFIDENCE HOLT
THIS IS MARKET COMMENTARY AND NOT A RESEARCH DOCUMENT.
THIS IS MARKET COMMENTARY AND NOT A RESEARCH DOCUMENT.
Debt…Leveraging ROE
6

CLARITY IS CONFIDENCE HOLT
THIS IS MARKET COMMENTARY AND NOT A RESEARCH DOCUMENT.
THIS IS MARKET COMMENTARY AND NOT A RESEARCH DOCUMENT.
Cash is up, but so is debt
Source: HOLT Data. Universe: USA (ex financials and regulated utilities) top 1500 firms by market cap. Total Cash includes: cash, cash equivalents, short-term investments and marketable securities.
USA Aggregate: Book Debt
USA Aggregate: Cash on the Balance Sheet
Cash is up 34% over the past five years
Debt is up 78% over the past five years
7
CLARITY IS CONFIDENCE HOLT
THIS IS MARKET COMMENTARY AND NOT A RESEARCH DOCUMENT.
THIS IS MARKET COMMENTARY AND NOT A RESEARCH DOCUMENT.
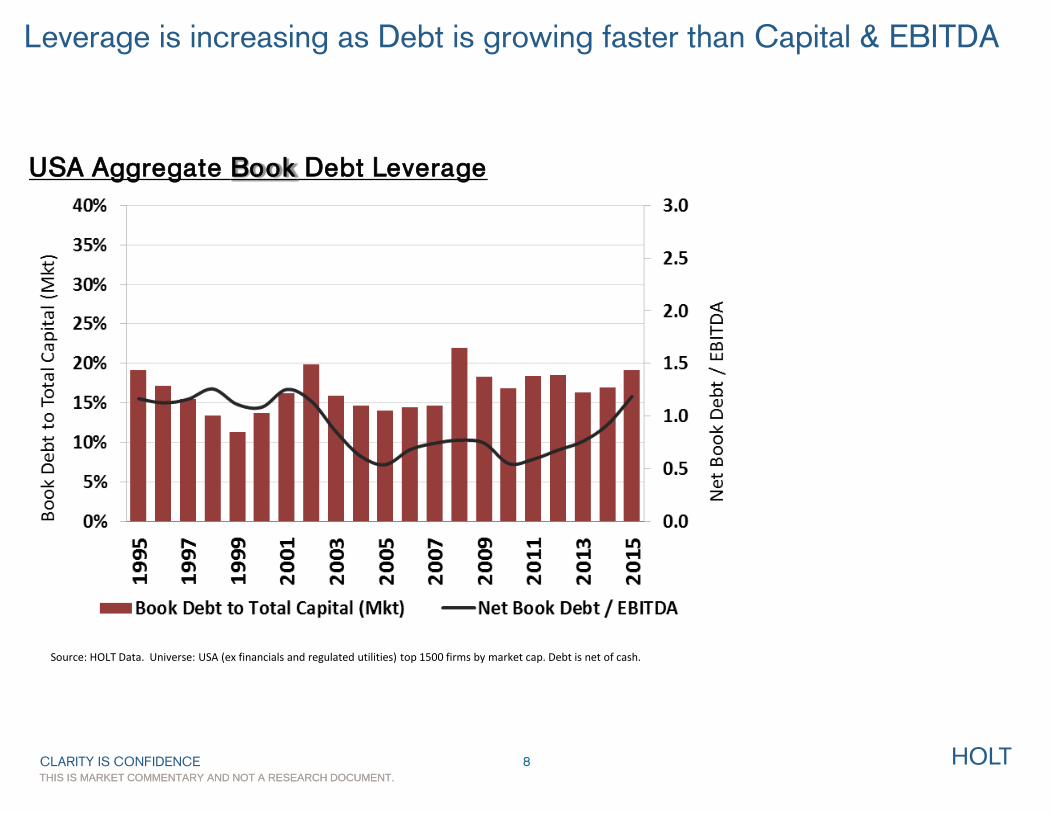
USA Aggregate Book Debt Leverage
Leverage is increasing as Debt is growing faster than Capital & EBITDA
8
Source: HOLT Data. Universe: USA (ex financials and regulated utilities) top 1500 firms by market cap. Debt is net of cash.

CLARITY IS CONFIDENCE HOLT
THIS IS MARKET COMMENTARY AND NOT A RESEARCH DOCUMENT.
THIS IS MARKET COMMENTARY AND NOT A RESEARCH DOCUMENT.
As debt (leverage) continues to rise, it also can elevate/distort some
metrics such as ROE
USA Aggregate 5 yr. Change in Drivers of ROE
ROE = Profit Margin% * Asset Turnover * Leverage (equity multiplier)
USA Aggregate 5 yr. Change in ROE
Leverage
Profit
Margin
Asset
Turnover
ROE
If debt increases
So does the equity multiplier
Resulting in higher ROE
9
Source: HOLT Data. Universe: USA (ex financials and regulated utilities) top 1500 firms by market cap. Change is indexed with base year of 2010.

CLARITY IS CONFIDENCE HOLT
THIS IS MARKET COMMENTARY AND NOT A RESEARCH DOCUMENT.
THIS IS MARKET COMMENTARY AND NOT A RESEARCH DOCUMENT.
If leverage is held constant, Return on Equity would be a lot lower
USA Aggregate 5 yr. Change in Drivers of ROE*
(hold leverage constant)
USA Aggregate 5 yr. Change in ROE*
(hold leverage constant)
Leverage*
Profit
Margin
Asset
Turnover
ROE = Profit Margin% * Asset Turnover * Leverage (equity multiplier)
10
Source: HOLT Data. Universe: USA (ex financials and regulated utilities) top 1500 firms by market cap. * In the charts above the equity multiplier (total assets/common equity) is held constant over the five year period and ROE is then recomputed based on this scenario. Change is indexed with base year of 2010.
*

CLARITY IS CONFIDENCE HOLT
THIS IS MARKET COMMENTARY AND NOT A RESEARCH DOCUMENT.
THIS IS MARKET COMMENTARY AND NOT A RESEARCH DOCUMENT.
Potential ROE distortion screen: Companies where ROE is up, but
Profit Margins & Asset Turns are down and Debt is up
Source: HOLT Data Universe: SP 500 (ex financials). Companies where five year change in ROE and Debt >0; Margins and Asset Turnover < 0. Sorted by change in ROE in descending order, top 10 companies shown. All data is as of last fiscal year as shown in HOLT Lens
11
COTY INC COTY Consumer Staples 979% -2% -18% 69%
AMERISOURCEBERGEN ABC Health Care 385% -30% -8% 156%
OWENS-ILLINOIS INC OI Materials 320% -5% -21% 38%
MCDONALD'S CORP MCD Consumer Discretionary 77% 0% -18% 93%
CVS HEALTH CORP CVS Consumer Staples 57% -1% -1% 174%
SCRIPPS NETWORKS SNI Consumer Discretionary 43% -9% -14% 190%
CARMAX INC KMX Consumer Discretionary 38% -1% -13% 207%
AUTONATION INC AN Consumer Discretionary 24% -2% -2% 44%
COCA-COLA CO KO Consumer Staples 21% -1% -16% 55%
WALGREENS BOOTS WBA Consumer Staples 21% -3% -25% 252%
Company Ticker Sector
Return on
Equity Margins
Asset
Turns Debt
Five Year Change

CLARITY IS CONFIDENCE HOLT
THIS IS MARKET COMMENTARY AND NOT A RESEARCH DOCUMENT.
THIS IS MARKET COMMENTARY AND NOT A RESEARCH DOCUMENT.
Companies with negative Shareholder’s Equity
ROE can not be computed screen
Why is Shareholder’s Equity in
decline? S&P 500 Aggregate:
Treasury Stock ($2T) is currently at ten year high.
Accumulated Unrealized
Loss (FX, Pensions) ($0.5T) is also at a ten year high.
12
Source: HOLT Data. Universe: SP 500 (ex financials). Companies where total shareholder’s equity is negative last fiscal year. Sorted by total shareholder's equity in ascending order, top 10 companies shown. All data is as of last fiscal year as shown in HOLT Lens
Company Ticker Sector
Shareholder's
Equity ROE
PHILIP MORRIS PM Consumer Staples (13,244) -52%
HCA HOLDINGS INC HCA Health Care (7,599) -31%
MARRIOTT INTL INC MAR Consumer Discretionary (3,590) -24%
AUTOZONE INC AZO Consumer Discretionary (1,788) -69%
DUN & BRADSTREET DNB Industrials (1,117) -23%
VERISIGN INC VRSN Information Technology (1,070) -35%
TRANSDIGM GROUP INC TDG Industrials (1,038) -46%
MEAD JOHNSON NUTR MJN Consumer Staples (632) -110%
COLGATE-PALMOLIVE CO CL Consumer Staples (299) -842%
L BRANDS INC LB Consumer Discretionary (259) -464%

CLARITY IS CONFIDENCE HOLT
THIS IS MARKET COMMENTARY AND NOT A RESEARCH DOCUMENT.
THIS IS MARKET COMMENTARY AND NOT A RESEARCH DOCUMENT.
Does this really happen? Yes!
Return on Equity (ROE) Distortion Example
Boeing (BA): Return on Equity vs CFROI
Boeing adopts FASB 158 -$8B pension charge to equity
$7.6B in actuarial pension gains to equity
Credit crisis. -$8.5B pension actuarial charge to equity
-$29B in accum. treasury stock
13
Source: HOLT Data and company annual reports. Note Boeing (BA) is shown for illustration purposes only.

CLARITY IS CONFIDENCE HOLT
THIS IS MARKET COMMENTARY AND NOT A RESEARCH DOCUMENT.
THIS IS MARKET COMMENTARY AND NOT A RESEARCH DOCUMENT.
Unpredictable Pensions
14
CLARITY IS CONFIDENCE HOLT
THIS IS MARKET COMMENTARY AND NOT A RESEARCH DOCUMENT.
THIS IS MARKET COMMENTARY AND NOT A RESEARCH DOCUMENT.
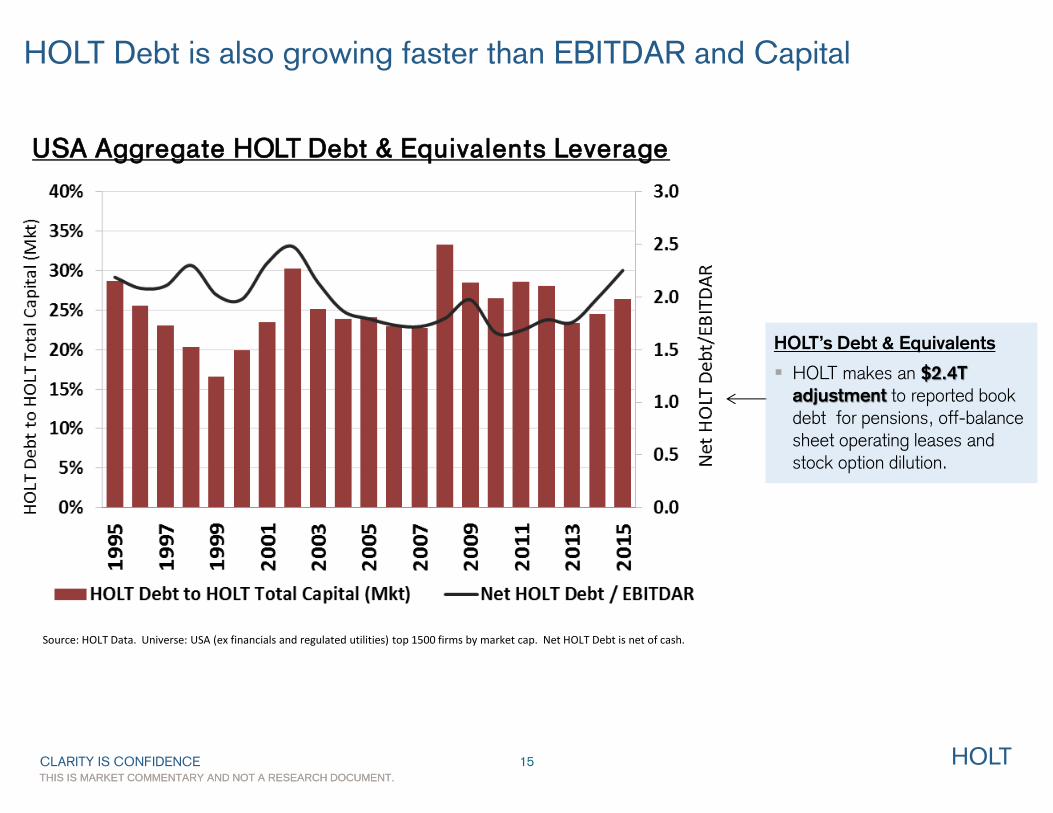
USA Aggregate HOLT Debt & Equivalents Leverage
HOLT Debt is also growing faster than EBITDAR and Capital
15
Source: HOLT Data. Universe: USA (ex financials and regulated utilities) top 1500 firms by market cap. Net HOLT Debt is net of cash.
HOLT’s Debt & Equivalents
HOLT makes an $2.4T
adjustment to reported book debt for pensions, off-balance sheet operating leases and stock option dilution.

CLARITY IS CONFIDENCE HOLT
THIS IS MARKET COMMENTARY AND NOT A RESEARCH DOCUMENT.
THIS IS MARKET COMMENTARY AND NOT A RESEARCH DOCUMENT.
GENERAL ELECTRIC CO GE USA $90,340 $63,088 ($27,252) 70% 32% 45% 7% 16% 4.1%
GENERAL MOTORS CO GM USA $95,249 $74,062 ($21,187) 78% 57% 12% 7% 24% 3.8%
BOEING CO BA USA $74,388 $56,514 ($17,874) 76% 48% 28% 9% 15% 4.2%
EXXON MOBIL CORP XOM USA $44,700 $29,402 ($15,298) 66% 60% 36% 0% 4% 3.9%
LOCKHEED MARTIN CORP LMT USA $43,702 $32,096 ($11,606) 73% 40% 38% 3% 19% 4.4%
Companies with the largest net pension obligations in HOLT
Included in HOLT Debt
Click here to see full l ist in HOLT Lens
Source: Credit Suisse HOLT Data, Factset. Universe: USA SP 500 and EuroStoxx 600 (ex financials). Companies are sorted by Pension Funded Status in ascending order. All data is last fiscal year. Top five companies in USA and EUR shown
VOLKSWAGEN AG VOWG_P DEU€ 37,216 € 9,769 (€ 27,447) 26% 64% 18% 4% 14% 3.5%
ELECTRICITE DE FRANCE EDF FRA € 41,567 € 19,075 (€ 22,492) 46% 60% 32% 2% 6% 3.1%
BAYER AG BAYGN DEU€ 26,074 € 15,580 (€ 10,494) 60% 63% 26% 5% 6% 2.8%
SIEMENS AG SIEGN DEU€ 36,818 € 27,296 (€ 9,522) 74% 56% 23% 5% 16% 3.0%
BT GROUP PLC BT GBR€ 68,301 € 59,644 (€ 8,657) 87% 44% 34% 13% 9% 3.3%
Company Ticker Country
Pension
Obligation
2015
Pension
Plan
Assets
2015
Pension $
Funded
Status
Pension %
Funded
Status
%
Bonds
%
Equity
%
Property
%
Other
Pension
Discount
Rate
(LFY)
Breakdown of Pension Plan Asset Allocations (LFY)
16

CLARITY IS CONFIDENCE HOLT
THIS IS MARKET COMMENTARY AND NOT A RESEARCH DOCUMENT.
THIS IS MARKET COMMENTARY AND NOT A RESEARCH DOCUMENT.
Interest rates impact pensions…as it drives the pension discount rate
Change YTD:
-100bps
-56bps
Pension Discount Rate (proxy)*
17
*Source: Credit Suisse HOLT, Worldscope as of November 30, 2016. Pension DR is based on AA or better corporate bonds, 10+ years to maturity for EUR. USA is based on Citigroup Pension Liability Index (standard long term rate) Note that this is a proxy for the pension discount rate which can vary based on country where pension employees reside, duration and other factors.

CLARITY IS CONFIDENCE HOLT
THIS IS MARKET COMMENTARY AND NOT A RESEARCH DOCUMENT.
THIS IS MARKET COMMENTARY AND NOT A RESEARCH DOCUMENT.
Interest rates also impact the return on pension plan assets
Rising allocations
to fixed income
USA Pension Plan Asset Allocations EUR Pension Plan Asset Allocations
18
*Source: Credit Suisse HOLT, Worldscope Universe: S&P 500 and EuroStoxx 600 (ex financials). Data based on last fiscal year.

CLARITY IS CONFIDENCE HOLT
THIS IS MARKET COMMENTARY AND NOT A RESEARCH DOCUMENT.
THIS IS MARKET COMMENTARY AND NOT A RESEARCH DOCUMENT.
Source: HOLT Analysis. The above is a simplified example of the components that comprise the net pension gain(loss) recorded on the income statement. 1. Specific rule change is IAS 19R , effective Jan 1, 2013.
Pension Earnings under US GAAP vs IFRS1
(Service Costs)
(Interest Costs)
Expect Return on Plan Assets
Actuarial Gain/(Loss)
= Pension (Income)/Cost
US GAAP (Service Costs)
(Net Interest Costs)/Income
N/A
N/A
= Pension (Income)/Cost
IFRS +
+
+ Post 20131
+
What about the pension effect on earnings…it is filled with accounting distortions
19

CLARITY IS CONFIDENCE HOLT
THIS IS MARKET COMMENTARY AND NOT A RESEARCH DOCUMENT.
THIS IS MARKET COMMENTARY AND NOT A RESEARCH DOCUMENT.
The magnitude of pension accounting distortions on operating income can be significant
Pension Impact on Reported Earnings
Reported earnings include multi-billion dollar distortions such as pension interest costs, actuarial gain/losses and expected return on pension plan assets.
Source: HOLT Data. Companies shown for illustration purposes only and were chosen based on previous slide (companies with largest pension deficits). All data as of last fiscal year.
20
CLARITY IS CONFIDENCE HOLT
THIS IS MARKET COMMENTARY AND NOT A RESEARCH DOCUMENT.
THIS IS MARKET COMMENTARY AND NOT A RESEARCH DOCUMENT.
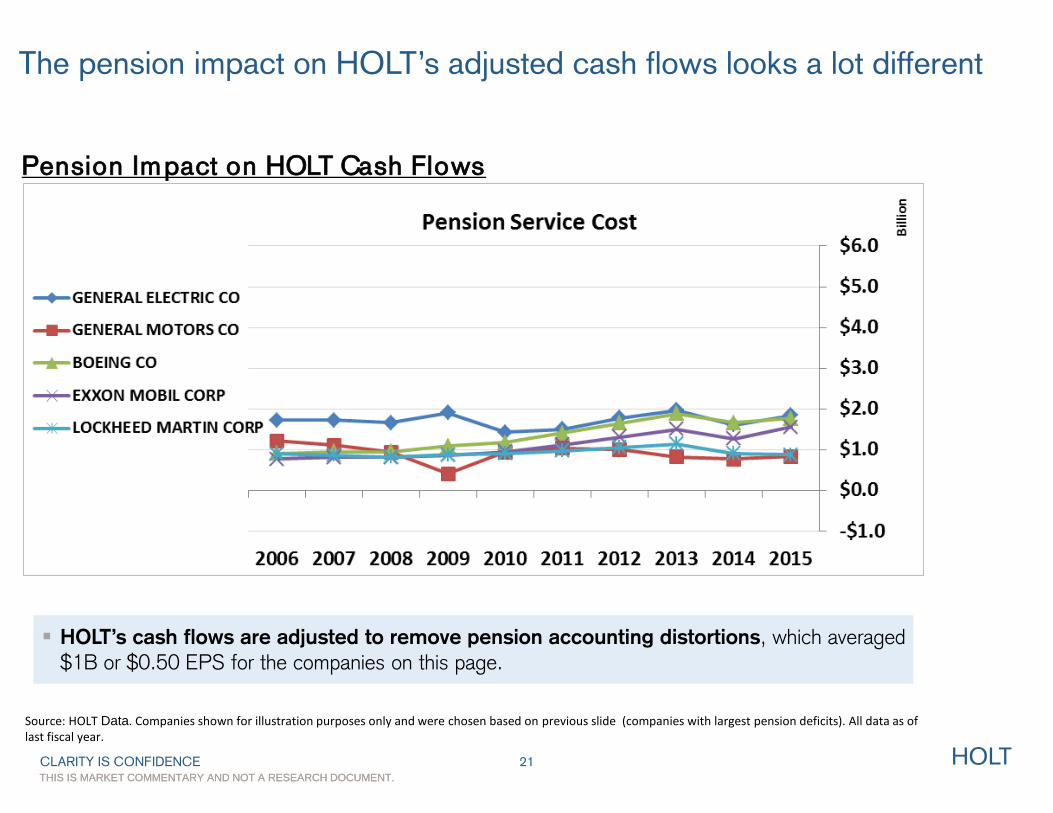
The pension impact on HOLT’s adjusted cash flows looks a lot different
Pension Impact on HOLT Cash Flows
HOLT’s cash flows are adjusted to remove pension accounting distortions, which averaged $1B or $0.50 EPS for the companies on this page.
Source: HOLT Data. Companies shown for illustration purposes only and were chosen based on previous slide (companies with largest pension deficits). All data as of last fiscal year.
21
CLARITY IS CONFIDENCE HOLT
THIS IS MARKET COMMENTARY AND NOT A RESEARCH DOCUMENT.
THIS IS MARKET COMMENTARY AND NOT A RESEARCH DOCUMENT.
Intangibles…A Tangible Distortion
22

CLARITY IS CONFIDENCE HOLT
THIS IS MARKET COMMENTARY AND NOT A RESEARCH DOCUMENT.
THIS IS MARKET COMMENTARY AND NOT A RESEARCH DOCUMENT.
Intangibles are on the rise and resulting in a lot of confusion on company balance sheets
The Rise of Intangibles, USA (ex financials and energy)
Source: HOLT Data SP 500 (ex financials and energy)
Non-Goodwill Intangibles (Brand, Patents, Customer Lists)
Fast Growing
Prone to distortions under US GAAP and IFRS
23
CLARITY IS CONFIDENCE HOLT
THIS IS MARKET COMMENTARY AND NOT A RESEARCH DOCUMENT.
THIS IS MARKET COMMENTARY AND NOT A RESEARCH DOCUMENT.
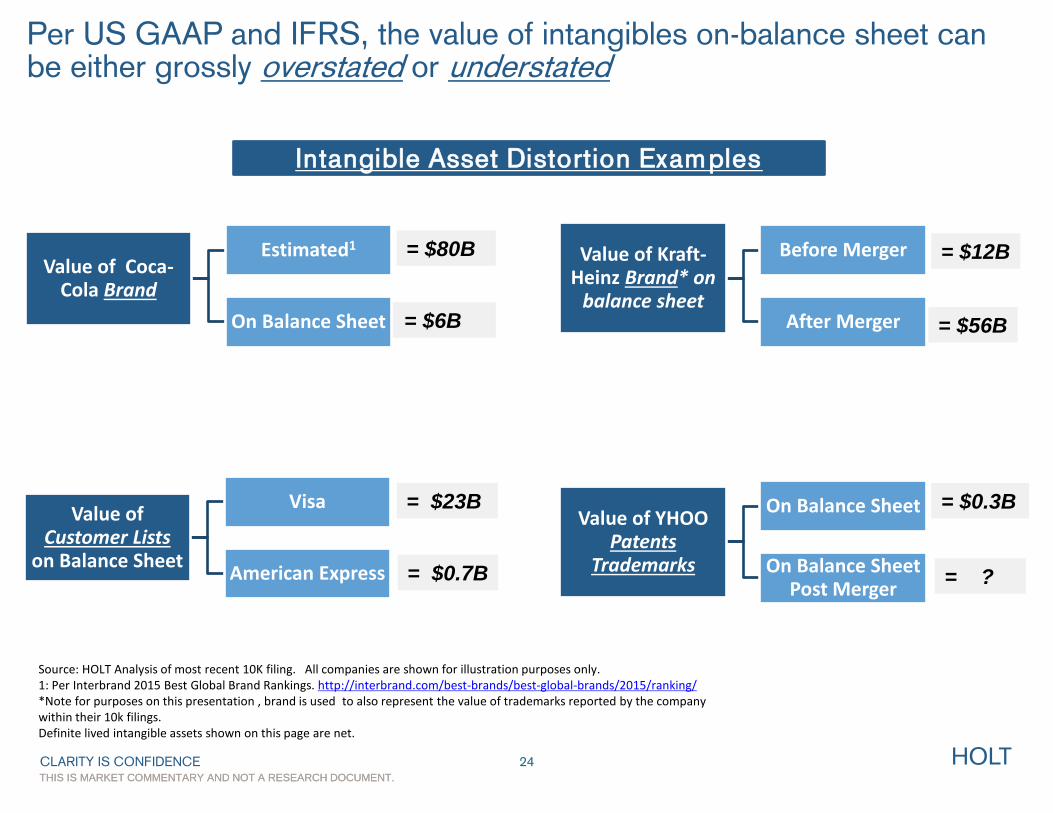
Per US GAAP and IFRS, the value of intangibles on-balance sheet can be either grossly overstated or understated
= $6B
= $80B Value of Coca-
Cola Brand
Estimated1
On Balance Sheet = $56B
= $12B Value of Kraft- Heinz Brand* on
balance sheet
Before Merger
After Merger
= $0.7B
= $23B Value of
Customer Lists on Balance Sheet
Visa
American Express
= $0.3B Value of YHOO
Patents Trademarks
On Balance Sheet
On Balance Sheet Post Merger
= ?
Source: HOLT Analysis of most recent 10K filing. All companies are shown for illustration purposes only. 1: Per Interbrand 2015 Best Global Brand Rankings. http://interbrand.com/best-brands/best-global-brands/2015/ranking/ *Note for purposes on this presentation , brand is used to also represent the value of trademarks reported by the company within their 10k filings. Definite lived intangible assets shown on this page are net.
24
Intangible Asset Distortion Examples
CLARITY IS CONFIDENCE HOLT
THIS IS MARKET COMMENTARY AND NOT A RESEARCH DOCUMENT.
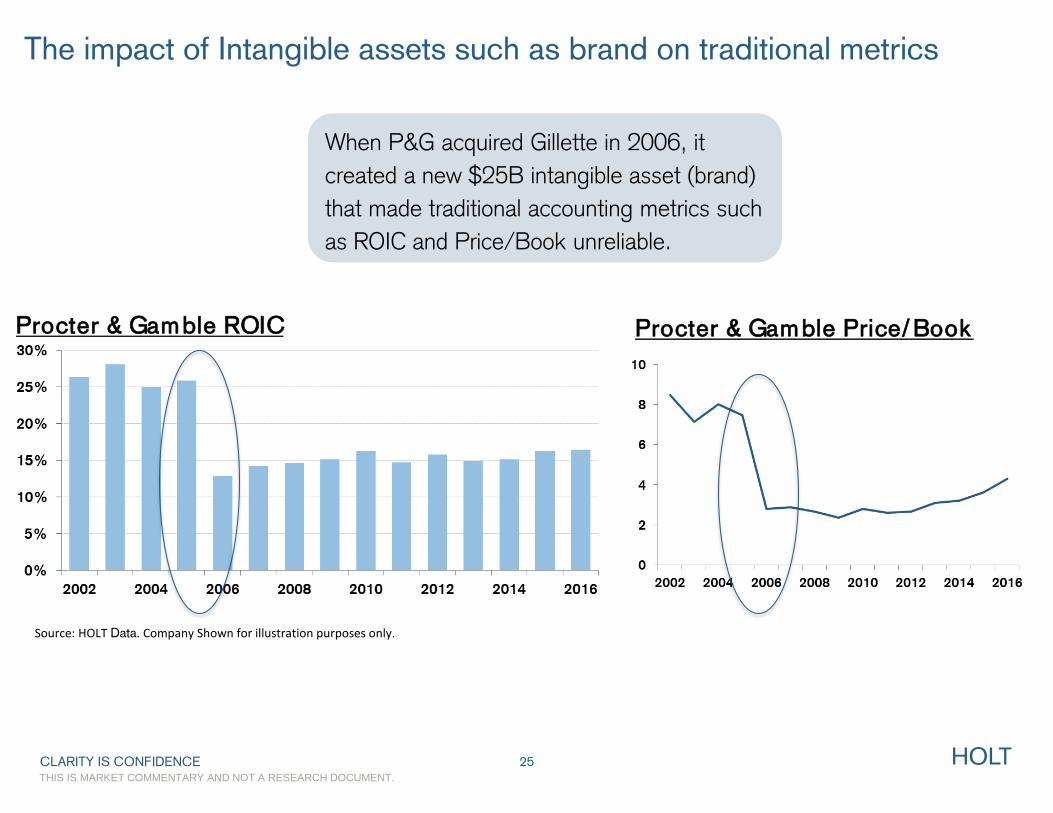
The impact of Intangible assets such as brand on traditional metrics
When P&G acquired Gillette in 2006, it
created a new $25B intangible asset (brand)
that made traditional accounting metrics such
as ROIC and Price/Book unreliable.
25
Procter & Gamble ROIC Procter & Gamble Price/Book
Source: HOLT Data. Company Shown for illustration purposes only.
CLARITY IS CONFIDENCE HOLT
THIS IS MARKET COMMENTARY AND NOT A RESEARCH DOCUMENT.
THIS IS MARKET COMMENTARY AND NOT A RESEARCH DOCUMENT.
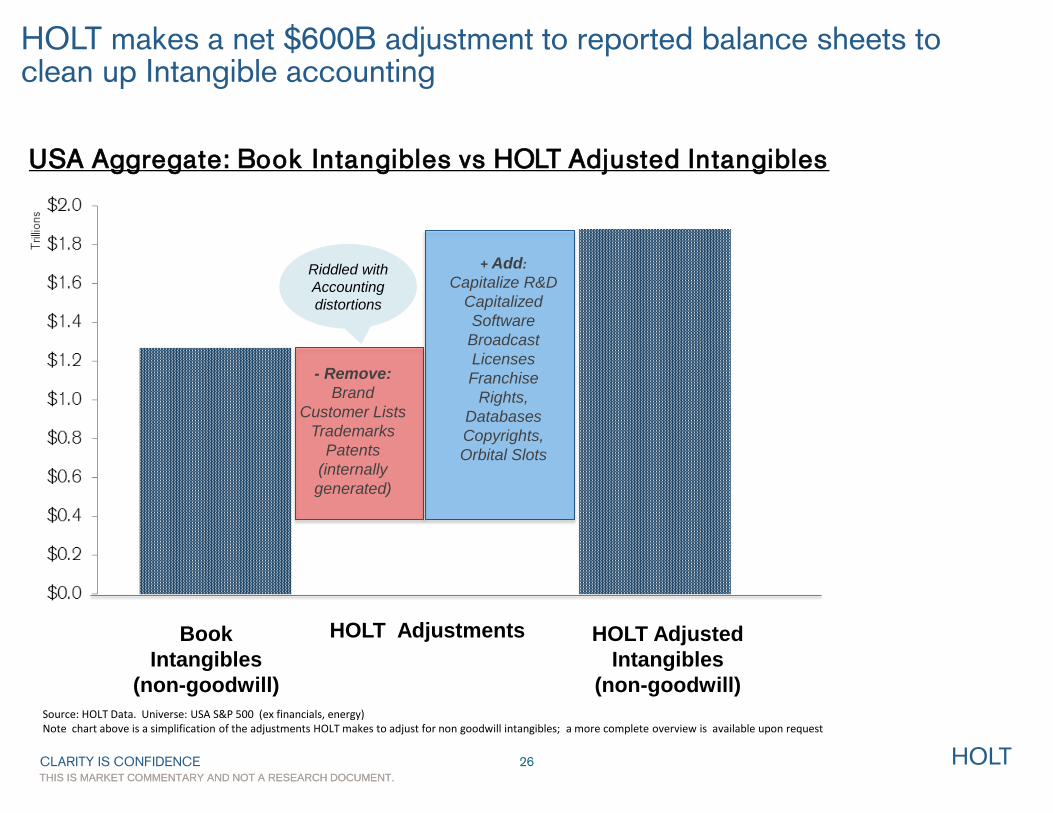
HOLT makes a net $600B adjustment to reported balance sheets to clean up Intangible accounting
Riddled with
Accounting
distortions
Book
Intangibles
(non-goodwill)
HOLT Adjustments HOLT Adjusted
Intangibles
(non-goodwill)
- Remove:
Brand
Customer Lists
Trademarks
Patents
(internally
generated)
+ Add:
Capitalize R&D
Capitalized
Software
Broadcast
Licenses
Franchise
Rights,
Databases
Copyrights,
Orbital Slots
26
Source: HOLT Data. Universe: USA S&P 500 (ex financials, energy) Note chart above is a simplification of the adjustments HOLT makes to adjust for non goodwill intangibles; a more complete overview is available upon request
USA Aggregate: Book Intangibles vs HOLT Adjusted Intangibles
CLARITY IS CONFIDENCE HOLT
THIS IS MARKET COMMENTARY AND NOT A RESEARCH DOCUMENT.
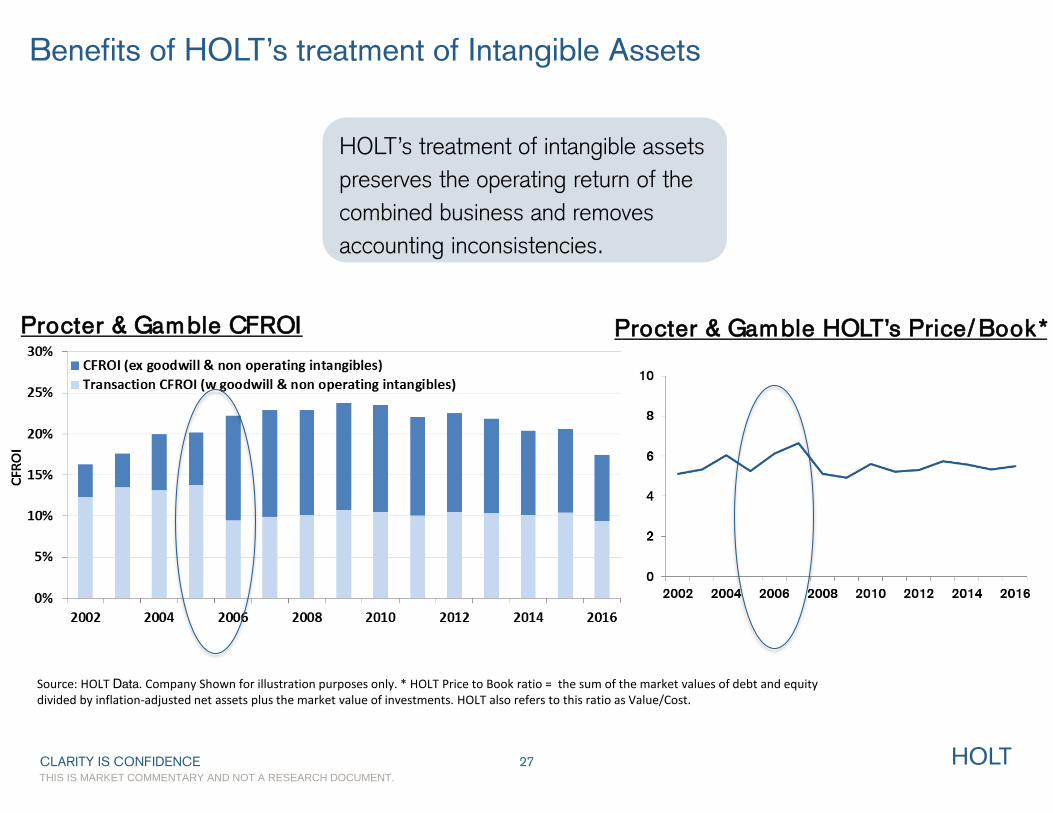
Benefits of HOLT’s treatment of Intangible Assets
27
Procter & Gamble CFROI Procter & Gamble HOLT’s Price/Book*
Source: HOLT Data. Company Shown for illustration purposes only. * HOLT Price to Book ratio = the sum of the market values of debt and equity divided by inflation-adjusted net assets plus the market value of investments. HOLT also refers to this ratio as Value/Cost.
HOLT’s treatment of intangible assets
preserves the operating return of the
combined business and removes
accounting inconsistencies.
CLARITY IS CONFIDENCE HOLT
THIS IS MARKET COMMENTARY AND NOT A RESEARCH DOCUMENT.
THIS IS MARKET COMMENTARY AND NOT A RESEARCH DOCUMENT.
Pro Forma…A Tangled Web
28

CLARITY IS CONFIDENCE HOLT
THIS IS MARKET COMMENTARY AND NOT A RESEARCH DOCUMENT.
THIS IS MARKET COMMENTARY AND NOT A RESEARCH DOCUMENT.
Pro-forma EPS continues to increase at a faster pace than GAAP EPS
and CFROI levels
Source: HOLT Data and Factset IBES data. Russell 1000 ex financials and energy. 2016 are annual estimates.
Pro-forma vs. GAAP EPS (Russell 1000, ex Energy and Financials)
Pro-Forma EPS is
adjusted for both recurring “special” items such as pensions, intangible amortization, and stock option expense; and nonrecurring “special” items such as impairments, tax adjustments, and restructuring.
29

CLARITY IS CONFIDENCE HOLT
THIS IS MARKET COMMENTARY AND NOT A RESEARCH DOCUMENT.
THIS IS MARKET COMMENTARY AND NOT A RESEARCH DOCUMENT.
HOLT makes $1.5T in adjustments to convert Net Income to Cash Flows
Net Income HOLT
Adjustments
HOLT Cash
Flows
Depreciation
Amortization
Special Items
Pensions
Operating
Leases
R&D
Interest
LIFO
Stock Options
30
USA Aggregate: Net Income vs HOLT Cash Flows
Source: HOLT Data. Universe: USA (ex financials and regulated utilities) top 1500 firms by market cap.
‘ HOLT makes a cash flow
adjustment to historical &
forecast periods
65% of the Russell 1000
reports Pro-Forma EPS

CLARITY IS CONFIDENCE HOLT
THIS IS MARKET COMMENTARY AND NOT A RESEARCH DOCUMENT.
THIS IS MARKET COMMENTARY AND NOT A RESEARCH DOCUMENT.
Pro-forma vs GAAP EPS screen
ALLERGAN PLC AGN Health Care $0.020 $14.000 93253% 16177 17 19
PERRIGO CO PLC PRGO Health Care $1.340 $6.980 423% 69 13 19
ZIMMER BIOMET HOLDINGS ZBH Health Care $2.050 $7.960 288% 65 17 23
SALESFORCE.COM INC CRM Information Technology $0.290 $0.950 228% 259 79 52
MICROCHIP TECHNOLOGY MCHP Information Technology $1.180 $3.430 191% 52 18 24
BOSTON SCIENTIFIC CORP BSX Health Care $0.400 $1.100 175% 59 22 30
IMS HEALTH HOLDINGS INC IMS Health Care $0.610 $1.640 169% 51 19 29
EXPEDIA INC EXPE Consumer Discretionary $2.000 $4.910 146% 59 24 26
AIR PRODUCTS & CHEMICALS APD Materials $3.130 $7.500 140% 43 18 28
XEROX CORP XRX Information Technology $0.500 $1.130 126% 20 9 18
ALEXION PHARMACEUTICALS ALXN Health Care $2.290 $4.630 103% 55 27 23
MYLAN NV MYL Health Care $2.450 $4.850 98% 16 8 13
NIELSEN HOLDINGS PLC NLSN Industrials $1.520 $2.870 89% 35 18 29
VANTIV INC VNTV Information Technology $1.410 $2.660 89% 40 21 35
MERCK & CO MRK Health Care $2.030 $3.750 85% 31 17 27
Company Ticker Sector
GAAP EPS
Estimate
FY1
Pro-Forma
EPS
Estimate
FY1
%
Difference
PE
GAAP
PE Pro-
Forma
PE
(HOLT)
31
Source: HOLT Data and Factset IBES data. Russell 1000 ex financials and energy; >$10B Market cap. Top ten companies sorted by % difference in GAAP and Pro Forma EPS shown. Data Date 10/2016
Using a framework that makes consistent adjustments to cash flows (amortization, special items)
and the balance sheet (treatment of intangibles) is the only way.
CLARITY IS CONFIDENCE HOLT
THIS IS MARKET COMMENTARY AND NOT A RESEARCH DOCUMENT.
THIS IS MARKET COMMENTARY AND NOT A RESEARCH DOCUMENT.
Corporate Tax Reform…Its Gonna Happen?
32
CLARITY IS CONFIDENCE HOLT
THIS IS MARKET COMMENTARY AND NOT A RESEARCH DOCUMENT.
THIS IS MARKET COMMENTARY AND NOT A RESEARCH DOCUMENT.
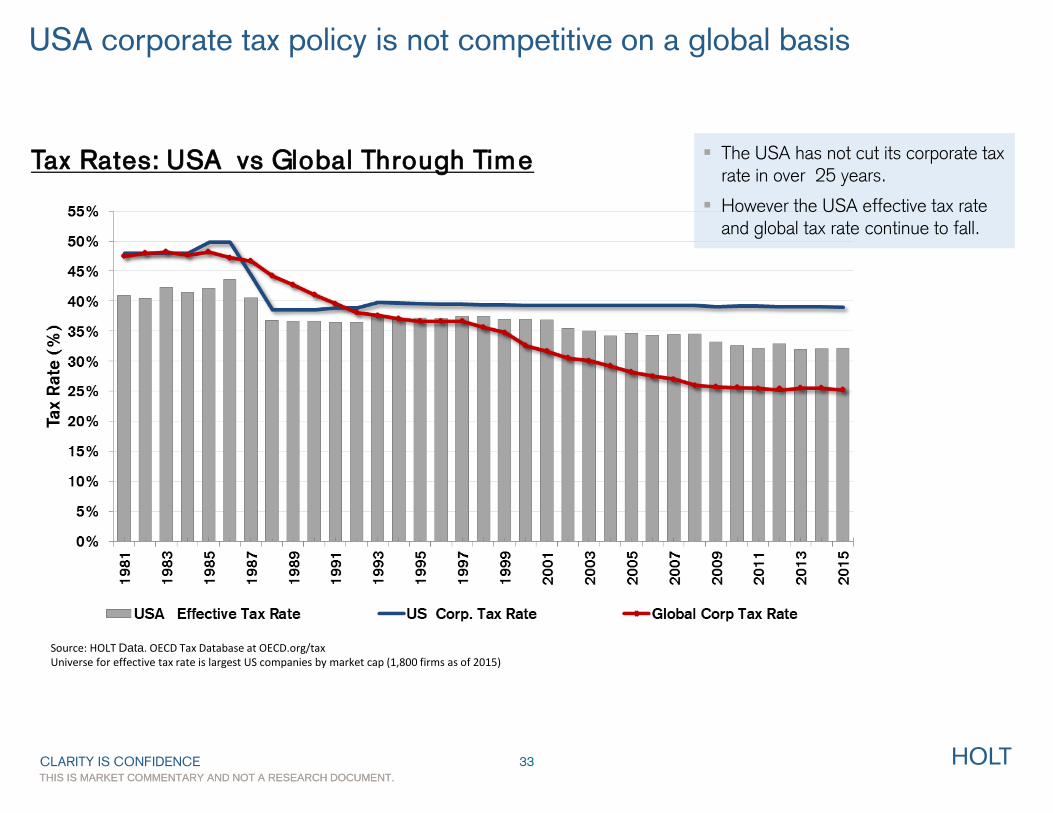
USA corporate tax policy is not competitive on a global basis
Tax Rates: USA vs Global Through Time The USA has not cut its corporate tax rate in over 25 years.
However the USA effective tax rate and global tax rate continue to fall.
Source: HOLT Data. OECD Tax Database at OECD.org/tax Universe for effective tax rate is largest US companies by market cap (1,800 firms as of 2015)
33

CLARITY IS CONFIDENCE HOLT
THIS IS MARKET COMMENTARY AND NOT A RESEARCH DOCUMENT.
Some sectors could gain more than others if there is a drop in Tax Rate
Information Technology Sector Aggregate Effective Tax Rate
Consumer Discretionary Sector Aggregate Effective Tax Rate
Source: HOLT Data Universe for effective tax rate is largest US companies per sector by market cap
Tax Cut or Tax Shift?
Companies with USA Domestic exposure should benefit
USA Multinationals (profit shifting) and US companies that rely on foreign imports/suppliers could come under pressure (border adjustments).
34
CLARITY IS CONFIDENCE HOLT
THIS IS MARKET COMMENTARY AND NOT A RESEARCH DOCUMENT.
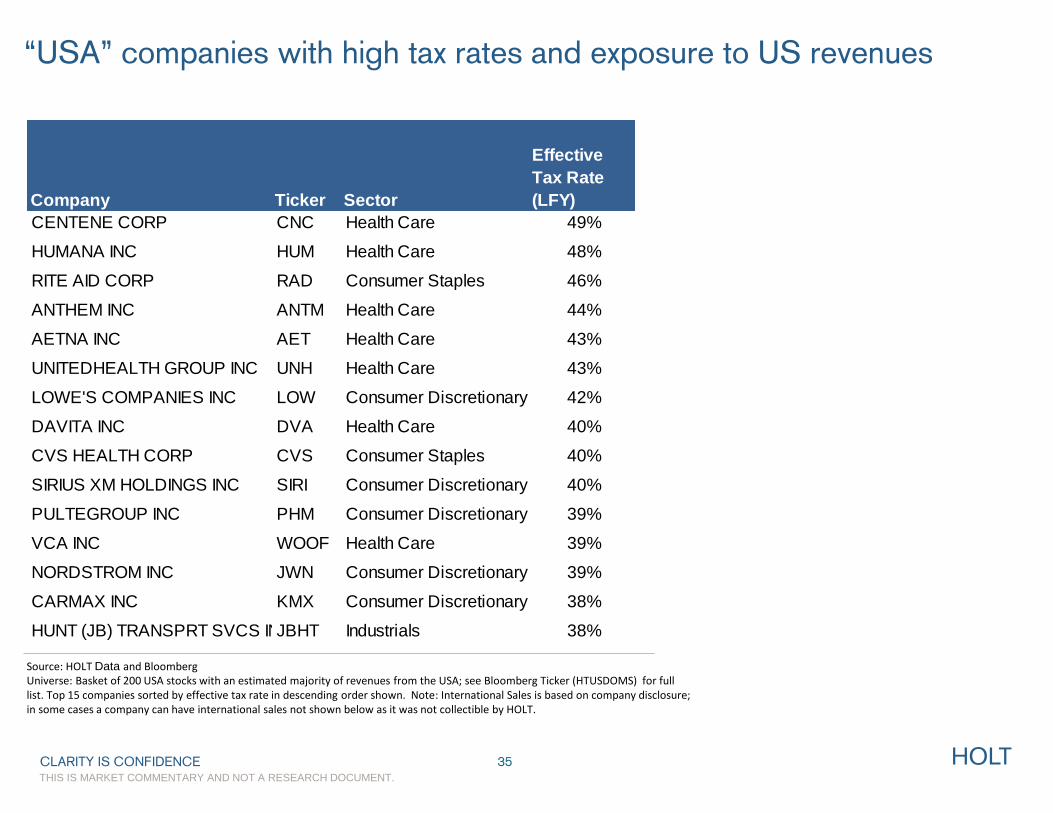
“USA” companies with high tax rates and exposure to US revenues
Source: HOLT Data and Bloomberg Universe: Basket of 200 USA stocks with an estimated majority of revenues from the USA; see Bloomberg Ticker (HTUSDOMS) for full list. Top 15 companies sorted by effective tax rate in descending order shown. Note: International Sales is based on company disclosure; in some cases a company can have international sales not shown below as it was not collectible by HOLT.
35
CENTENE CORP CNC Health Care 49%
HUMANA INC HUM Health Care 48%
RITE AID CORP RAD Consumer Staples 46%
ANTHEM INC ANTM Health Care 44%
AETNA INC AET Health Care 43%
UNITEDHEALTH GROUP INC UNH Health Care 43%
LOWE'S COMPANIES INC LOW Consumer Discretionary 42%
DAVITA INC DVA Health Care 40%
CVS HEALTH CORP CVS Consumer Staples 40%
SIRIUS XM HOLDINGS INC SIRI Consumer Discretionary 40%
PULTEGROUP INC PHM Consumer Discretionary 39%
VCA INC WOOF Health Care 39%
NORDSTROM INC JWN Consumer Discretionary 39%
CARMAX INC KMX Consumer Discretionary 38%
HUNT (JB) TRANSPRT SVCS INCJBHT Industrials 38%
Company Ticker Sector
Effective
Tax Rate
(LFY)

CLARITY IS CONFIDENCE HOLT
THIS IS MARKET COMMENTARY AND NOT A RESEARCH DOCUMENT.
THIS IS MARKET COMMENTARY AND NOT A RESEARCH DOCUMENT.
Tax scorecard…companies with low tax rates and foreign exposure are
more at risk to global tax reforms
Source: Universe S&P 500 (ex Financials, REITS, Inversions and negative pretax income). Source: HOLT Data and Factset. All values above are five year medians. Companies are sorted by overall tax risk in descending order. Top five companies overall and top five companies ex Tech and Health Care are shown on this page. % foreign income is pre tax. Data Date: 11/2016
ELECTRONIC ARTS INC EA Software -14% 99% 57% 77% 54% 93% 6% 91% 92%
MICROCHIP TECHNOLOGY MCHP Semiconductors 9% 95% 80% 97% 20% 76% 2% 98% 92%
WESTERN DIGITAL CORP WDC Technology Hardware 8% 96% 79% 96% 16% 74% 4% 94% 91%
XILINX INC XLNX Semiconductors 11% 94% 74% 92% 15% 73% 1% 99% 90%
WESTERN UNION CO WU IT Services 12% 93% 72% 92% 24% 81% 5% 92% 90%
MONDELEZ INTERNATIONAL MDLZ Food Products 12% 93% 80% 97% 25% 83% 16% 69% 88%
MATTEL INC MAT Leisure Products 18% 87% 51% 69% 38% 90% 16% 70% 81%
MOHAWK INDUSTRIES INC MHK Household Durables 18% 87% 25% 41% 25% 83% 1% 99% 79%
STANLEY BLACK & DECKER SWK Machinery 15% 90% 52% 70% 13% 71% 19% 59% 77%
COCA-COLA CO KO Beverages 24% 75% 54% 73% 25% 82% 18% 64% 74%
Top five ex
Tech, Health
Care
Weights: 45% 20% 20% 15%
Company Ticker Industry
Corporate
Effective
Tax Rate
%
Rank
%Foreign
Sales
%
Rank
%Foreign
Income -
% Foreign
Sales
%
Rank
Tax Rate
on Foreign
Earnings
%
Rank
Overall
Tax Risk
Rank
36

CLARITY IS CONFIDENCE HOLT
THIS IS MARKET COMMENTARY AND NOT A RESEARCH DOCUMENT.
THIS IS MARKET COMMENTARY AND NOT A RESEARCH DOCUMENT.
Cash Overseas! $920B or 50% of all US cash is sitting overseas
Cash Overseas By Sector
Source: HOLT Data, Bloomberg and company annual reports. Universe: SP 500 (ex Financials). All data is last fiscal year as of June, 2016. Top ten companies with foreign cash shown. Cash includes cash equivalents, short-term investments and marketable securities. Cash balances are also adjusted to exclude financial subsidiary cash if relevant. 1 HOLT’s Life-Cycle classification is a propriety rating that is based on trends/levels in CFROI, asset growth rates, debt levels and valuation.
37
Cash Overseas by HOLT’s Life-Cycle1
CLARITY IS CONFIDENCE HOLT
THIS IS MARKET COMMENTARY AND NOT A RESEARCH DOCUMENT.
THIS IS MARKET COMMENTARY AND NOT A RESEARCH DOCUMENT.
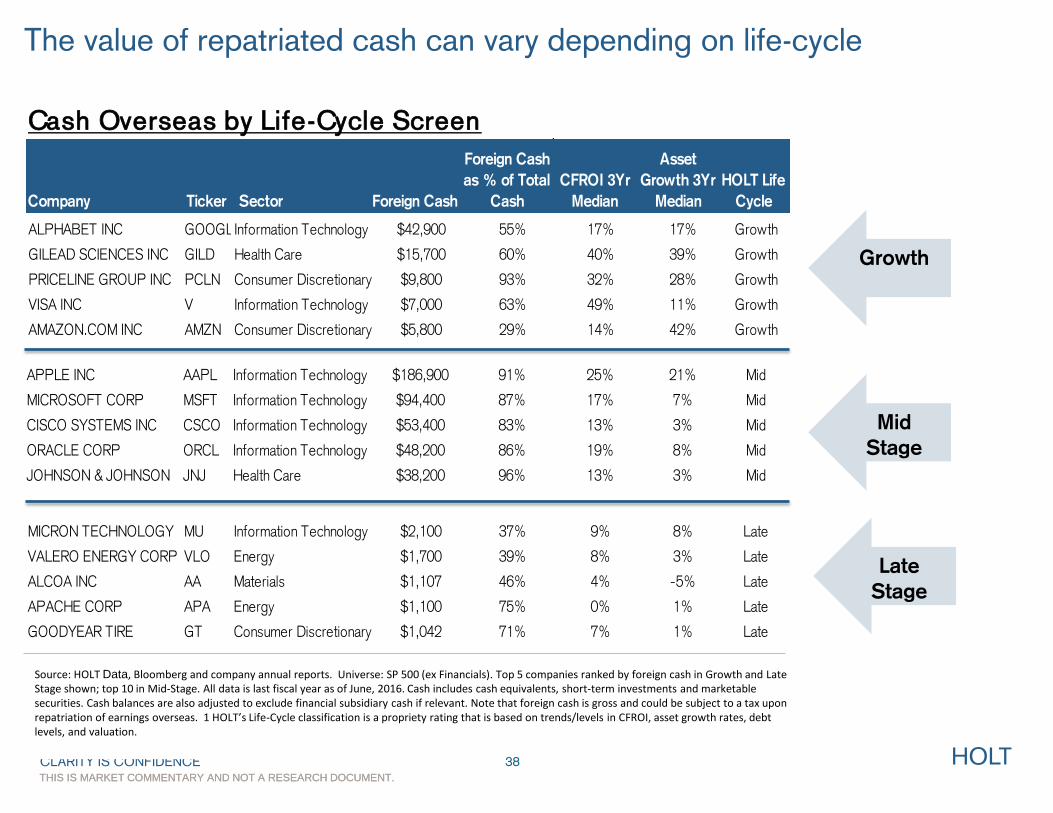
The value of repatriated cash can vary depending on life-cycle
Cash Overseas by Life-Cycle Screen
Growth
Mid
Stage
Late
Stage
Source: HOLT Data, Bloomberg and company annual reports. Universe: SP 500 (ex Financials). Top 5 companies ranked by foreign cash in Growth and Late Stage shown; top 10 in Mid-Stage. All data is last fiscal year as of June, 2016. Cash includes cash equivalents, short-term investments and marketable securities. Cash balances are also adjusted to exclude financial subsidiary cash if relevant. Note that foreign cash is gross and could be subject to a tax upon repatriation of earnings overseas. 1 HOLT’s Life-Cycle classification is a propriety rating that is based on trends/levels in CFROI, asset growth rates, debt levels, and valuation.
Company Ticker Sector Foreign Cash
Foreign Cash
as % of Total
Cash
CFROI 3Yr
Median
Asset
Growth 3Yr
Median
HOLT Life
Cycle
ALPHABET INC GOOGLInformation Technology $42,900 55% 17% 17% Growth
GILEAD SCIENCES INC GILD Health Care $15,700 60% 40% 39% Growth
PRICELINE GROUP INC PCLN Consumer Discretionary $9,800 93% 32% 28% Growth
VISA INC V Information Technology $7,000 63% 49% 11% Growth
AMAZON.COM INC AMZN Consumer Discretionary $5,800 29% 14% 42% Growth
APPLE INC AAPL Information Technology $186,900 91% 25% 21% Mid
MICROSOFT CORP MSFT Information Technology $94,400 87% 17% 7% Mid
CISCO SYSTEMS INC CSCO Information Technology $53,400 83% 13% 3% Mid
ORACLE CORP ORCL Information Technology $48,200 86% 19% 8% Mid
JOHNSON & JOHNSON JNJ Health Care $38,200 96% 13% 3% Mid
PFIZER INC PFE Health Care $35,360 90% 8% -6% Mid
AMGEN INC AMGN Health Care $29,000 92% 13% 5% Mid
QUALCOMM INC QCOM Information Technology $25,600 83% 21% 9% Mid
MERCK & CO MRK Health Care $22,505 85% 8% -3% Mid
COCA-COLA CO KO Consumer Staples $17,900 73% 17% 3% Mid
MICRON TECHNOLOGY MU Information Technology $2,100 37% 9% 8% Late
VALERO ENERGY CORP VLO Energy $1,700 39% 8% 3% Late
ALCOA INC AA Materials $1,107 46% 4% -5% Late
APACHE CORP APA Energy $1,100 75% 0% 1% Late
GOODYEAR TIRE GT Consumer Discretionary $1,042 71% 7% 1% Late
38

CLARITY IS CONFIDENCE HOLT
THIS IS MARKET COMMENTARY AND NOT A RESEARCH DOCUMENT.
THIS IS MARKET COMMENTARY AND NOT A RESEARCH DOCUMENT.
Microsoft (MSFT)
39
Source: HOLT Lens. Company is shown for illustration purposes only.
Conclusion: A clean measure of operating returns to compare across
time, borders and other companies…ultimately to model valuation

CLARITY IS CONFIDENCE HOLT
THIS IS MARKET COMMENTARY AND NOT A RESEARCH DOCUMENT.
THIS IS MARKET COMMENTARY AND NOT A RESEARCH DOCUMENT.
Global Market Commentary Disclaimer References to Credit Suisse include all of the subsidiaries and affiliates of Credit Suisse AG operating under its Global Markets division. For more information on our structure, please follow the attached link: https://www.credit-suisse.com/us/en/about-us/our-company.html. This material has been prepared by individual traders or sales personnel of Credit Suisse identified in this material as “Authors” and not by Credit Suisse's research department. The information contained in this document has been provided as general market commentary only and does not constitute any form of regulated financial advice, legal, tax or other regulated financial service. It is intended only to provide observations and views of these traders or sales personnel, which may be different from, or inconsistent with, the observations and views of Credit Suisse research department analysts, other Credit Suisse traders or sales personnel, or the proprietary positions of Credit Suisse. Observations and views expressed herein may be changed by the trader or sales personnel at any time without notice. Credit Suisse accepts no liability for losses arising from the use of this material. This material does not purport to contain all of the information that an interested party may desire and, in fact, provides only a limited view of a particular market. It is not investment research, or a research recommendation for regulatory purposes, as it does not constitute substantive research or analysis. The information provided is not intended to provide a sufficient basis on which to make an investment decision and is not a personal recommendation or investment advice. While it has been obtained from or based upon sources believed by the trader or sales personnel to be reliable, each of the trader or sales personnel and Credit Suisse does not represent or warrant its accuracy or completeness and is not responsible for losses or damages arising from the use of this material. This material is provided for informational purposes and does not constitute an invitation or offer to subscribe for or purchase any of the products or services mentioned. It is directed exclusively at Credit Suisse's market professional and institutional investor clients (e.g. QIBs) as defined by the rules of the relevant regulatory authority, and must not be forwarded or shared with retail customers or the public. It is not intended for private customers and such persons should not rely on this material. Moreover, any investment or service to which this material may relate will not be made available by Credit Suisse to such private customers. This material may have previously been communicated to the Credit Suisse trading desk or other Credit Suisse clients. You should assume that the trading desk makes markets and/or currently maintains positions in any of the securities mentioned above. Credit Suisse may, from time to time, participate or invest in transactions with issuers of securities that participate in the markets referred to herein, perform services for or solicit business from such issuers, and/or have a position or effect transactions in the securities or derivatives thereof. Information provided on any trades executed with Credit Suisse will not constitute an official confirmation of the trade details, and all preliminary trade report information is subject to our formal written confirmation. FOR IMPORTANT DISCLOSURES on companies covered in Credit Suisse Investment Banking Division research reports, please see www.credit-suisse.com/researchdisclosures. To obtain a copy of the most recent Credit Suisse research on any company mentioned please contact your sales representative or go to http://www.credit-suisse.com/researchandanalytics. Past performance should not be taken as an indication or guarantee of future performance, and no representation or warranty, expressed or implied is made regarding future performance. Backtested, hypothetical or simulated performance results have inherent limitations. Simulated results are achieved by the retroactive application of a backtested model itself designed with the benefit of hindsight. The backtesting of performance differs from the actual account performance because the investment strategy may be adjusted at any time, for any reason and can continue to be changed until desired or better performance results are achieved. Alternative modeling techniques or assumptions might produce significantly different results and prove to be more appropriate. Past hypothetical backtest results are neither an indicator nor a guarantee of future returns. Actual results will vary from the analysis. Investment principal on securities can be eroded depending on sale price or market price. In addition, there are securities on which investment principal may be eroded due to changes in redemption amounts. Care is required when investing in such instruments.
HOLT Disclaimer The HOLT methodology does not assign ratings or a target price to a security. It is an analytical tool that involves use of a set of proprietary quantitative algorithms and warranted value calculations, collectively called the HOLT valuation model, that are consistently applied to all the companies included in its database. Third-party data (including consensus earnings estimates) are systematically translated into a number of default variables and incorporated into the algorithms available in the HOLT valuation model. The source financial statement, pricing, and earnings data provided by outside data vendors are subject to quality control and may also be adjusted to more closely measure the underlying economics of firm performance. These adjustments provide consistency when analyzing a single company across time, or analyzing multiple companies across industries or national borders. The default scenario that is produced by the HOLT valuation model establishes a warranted price for a security, and as the third-party data are updated, the warranted price may also change. The default variables may also be adjusted to produce alternative warranted prices, any of which could occur. The warranted price is an algorithmic output applied systematically across all companies based on historical levels and volatility of returns. Additional information about the HOLT methodology is available on request CFROI, CFROE, HOLT, HOLT Lens, HOLTfolio, “Clarity is Confidence” and “Powered by HOLT” are trademarks or registered trademarks of Credit Suisse Group AG or its affiliates in the United States and other countries. HOLT is a corporate performance and valuation advisory service of Credit Suisse. © 2016 Credit Suisse Group AG and its subsidiaries and affiliates. All rights reserved. European Market Abuse Regulation (Securities Traded on EU-Regulated Markets) The date and time published on the title page of this material (the “Published Date and Time”) are the date and time of completion of production of this material and the date and time of its first dissemination. The European Market Abuse Regulation (596/2014) and associated rules (“MAR”) define “investment recommendations” as information recommending or suggesting an investment strategy, explicitly or implicitly, concerning one or several financial instruments or the issuers, including any opinion as to the present or future value or price of such instruments, intended for distribution channels or for the public. To the extent this material contains any “investment recommendation” as defined under MAR for a security traded on an EU-regulated market, the Published Date and Time are also the date and time of completion of production, and the date and time of first dissemination, of any such “investment recommendation” (unless otherwise expressly specified in this material). This material is produced and distributed by Credit Suisse and its subsidiaries and affiliates. Such subsidiaries and affiliates may include: Credit Suisse Securities (Europe) Limited, Credit Suisse Securities (USA) LLC, Credit Suisse Management (Australia) Pty, Credit Suisse Securities (Japan) Limited, Credit Suisse Securities (Europe) Limited, Seoul Branch, Credit Suisse AG, Singapore Branch, Credit Suisse (Hong Kong) Limited, Credit Suisse Securities (Johannesburg) Proprietary Limited. Please follow the attached hyperlink for important further information regarding conflicts of interest, disclosures, and a history of our “investment recommendations” as defined by MAR: https://rave.credit-suisse.com/disclosures/view/nr For region specific disclosures, including information about applicable registrations and certain regulatory disclosures, please follow the links below: Americas: https://www.credit-suisse.com/legal/en/ib/market_commentary.jsp Europe: https://www.credit-suisse.com/legal/en/ib/europe.jsp (Credit Suisse Securities (Europe) Limited is authorised by the Prudential Regulation Authority and regulated by the Financial Conduct Authority and the Prudential Regulation Authority in the United Kingdom) Asia: https://www.credit-suisse.com/legal/en/ib/market_commentary_disclaimer_asia.jsp General investors in Japan should open the following link and read it: https://www.credit-suisse.com/jp/investment_banking/ja/disclaimer/