Embed Size (px)
Citation preview

NUST JOURNAL OF SOCIAL SCIENCES AND HUMANITIES
Vol.2 No.1 (January-June 2016) pp. 29-49
Economic Efficiency and Distortions to Incentives in Production of
Cotton and Rice Crops in Punjab
ABDUL SALAM1 and SADIA TUFAIL2
Abstract:
The study based on crop budgets, for 2010-12 crops, was, inter alia, designed
to examine economic efficiency and distortions in incentives to production of cotton
and basmati rice, long grain aromatic rice, crops in Punjab. The analysis has
confirmed the competitiveness of their production in Punjab as farmers’ gross revenues
from these crops exceeded their total costs, enabling farmers make some profit. The
competitiveness, nevertheless, is sensitive to changes in prices of the produce and those
of the inputs. The analysis conducted at economic prices have indicated economic
efficiency and comparative advantage of Punjab in producing both basmati rice and
cotton. The domestic resource cost coefficients for basmati as well as cotton were
consistently less than one, confirming Punjab’s comparative advantage and economic
efficiency in their farming. The estimation and analysis of nominal projection
coefficients and effective protection coefficients for basmati and cotton crops have
indicated implicit taxation as well as some protection to domestic producers. The
results of economic efficiency and comparative advantage, of both basmati and cotton,
are quite sensitive to the fluctuations and developments in world markets with spill over
to the domestic market, impacting their competitiveness.
Keywords: Domestic Resource Cost, Effective Protection, Agriculture Policy Matrix
1Abdul Salam <[email protected]> is currently visiting professor at the
Department of Economics, School of Social Sciences and Humanities (S3H), National
University of Sciences and Technology (NUST), Sector H-12, Islamabad, Pakistan. 2Sadia Tufail <[email protected]> is a graduate of the School of Economics,
Federal Urdu University of Arts, Science and Technology, Islamabad.
Authors’ Note: The crop budgets forming the basis of analysis reported in this paper
were adapted from the policy analysis reports of the Agriculture Policy Institute
(API).The authors would like to express their gratitude to the officers of API for
providing the policy reports, sharing unpublished data on prices and sparing time to
discuss many issues that arose during the course of this study. The authors gratefully
acknowledge the comments of Professor Dr. Zafar Mahmood and referees of this
Journal on an earlier draft, which were useful in improving the manuscript. However,
views expressed are sole responsibility of the authors.

30 Salam And Tufail
1. INTRODUCTION
Cotton and rice are the most important export crops of Pakistan.
Annually planted over an area covering three million hectares, cotton is
the 2nd largest and principal cash crop of the country. Cotton farming is
the main source of raw material and mainstay for the textile sector— the
major source of employment in large scale manufacturing in Pakistan.
With annual production of cotton averaging over 2 million tons and
ranking 4th in world cotton production, Pakistan is an important player
in cotton markets. An important by-product of cotton production is
cotton seed, which is widely used in the domestic vegetable oil and ghee
industry to produce cooking oil. Cotton seed cake, obtained as a by-
product of processing cotton seed in vegetable oil industry, is a valuable
feed for livestock and dairy farming. Exports of cotton and its made-ups
account for over 60 percent of the foreign exchange earned from exports
of merchandize goods. Rice, with annual area exceeding 2.5 million
hectares, is the 2nd most important food grain and the 3rd largest crop of
the country. Pakistan is famous the world over for its production and
exports of long grain aromatic rice-basmati. Pakistan also exports
substantial quantity of coarse rice with total rice exports averaging 2.5
million tons in recent past [GoP (2012)]. Pakistan with its share of 11
percent in world rice trade of about 30 million tons per year is an active
player in rice markets, ranking at 4-5 on world rice trade map. A good
harvest of cotton and rice is imperative not only for the performance of
agriculture in Pakistan but also for the robust growth in manufacturing
and healthy balance of trade.
In view of their economic importance, production and marketing,
rice and cotton have been subjected to several policy interventions in
Pakistan, ranging from restrictions on their cultivation in certain
districts/areas to zoning, and monopoly procurements in domestic
markets and exports. There were also restrictions on the movement of
basmati rice, requiring a permit from the Punjab Food Department for its
movement. In 1974, Rice Export Corporation of Pakistan (RECP) was
set up in the public sector and it had monopoly in rice exports. It also
acted as the government agency for implementing official price support
for rice through procurement operations [UCGL (1989)]. Rice Mills
Economic Efficiency and Distortions to Incentives in Production 31
were nationalized in 1976 and denationalized in 1977. Similarly, cotton
ginning was nationalized in 1976 and denationalized in 1977 [Hamid,
Ijaz and Anjum (1990)]. Cotton Exports Corporation (CEC), established
in the 1974 had the monopoly over cotton exports which lasted until
1986-87 [Salam (2008)]. When CEC was formed it worked at two levels:
as the main agency for the purchase of cotton from the farmers and as
the exporter to international traders at government regulated prices [Altaf
(2008)]. Cotton and rice exports were also subjected to export duty and
other taxes [Salam (2008) and Altaf (2008)]. All these interventions in
domestic marketing and trade of cotton and rice created many distortions
in the cotton and rice sectors, impacting the structures of incentives and
investments in these important sub-sectors of economy. Under the
economic reforms initiated under structural adjustment program in 1985,
many of these restrictions on marketing and trade of rice and cotton along
with the RECP and CEC have been phased out and private sector fully
taken over the marketing and trade in cotton and rice.
With their extensive forward and backward linkages production,
processing and marketing of cotton and rice crops play a crucial role not
only in agriculture but also in industrial growth, employment generation
and balance of trade. Thus, it is important to examine and analyze their
economic efficiency and ascertain incentives in their domestic
production. The subject is of critical importance and interest for policy
planners and those interested in the development of agriculture. There
are not many studies on the subject and some of these are dated. Dorosh
and Salam (2009), and Salam (2010)] in their analysis of economic
protection and taxation of agriculture and important crops in Pakistan
had, inter alia, examined the distortions in incentives to cotton and rice
production and so did Hamid, Ijaz and Nasim (1990). Appleyard (1987)
in his assessment of the comparative advantage of important crops in the
1980s also addressed the issue of protection to cotton and rice crops in
Pakistan. Other recent studies relating to the topic are those by Akhtar,
et al. (2007), Chaudhry, et al. (2009) and Quddus and Mustafa (2011).
The present study has been designed to ascertain the efficiency of
cultivation of cotton and rice and estimating distortions to incentives, if
any, in the course of their production in the Punjab -- the largest producer
of these crops in the country. Punjab with 84 percent of the cotton area

32 Salam And Tufail
contributes about 75 percent of its total production. Its contributions in
case of rice are estimated at 67 and 55 percent in area and production,
while cultivation of long grain aromatic basmati rice is confined to
Punjab only [GoP (2013)].
The organization of remaining paper is as follows: The Policy
Analysis Matrix (PAM), the main plank of the analytical frame work
used here to evaluate the economic efficiency and distortions in
incentives to production of cotton and rice is explained in section 2. The
data requirements of PAM are also discussed in section 2. The empirical
results emerging from PAM are described at length in section 3. The
paper sums up main results and their policy implications in section 4.
2. POLICY ANALYSIS MATRIX: METHODOLOGY
AND DATA
2.1. Methodology
Enterprise budgets, providing details of various inputs used, their
prices, outputs and prices thereof form the building blocks of policy
analysis aimed at estimating their efficiency and related measures. These
data are nevertheless to be transformed into various summary measures
and indicators of profitability and efficiency. In this context Policy
Analysis Matrix (PAM), developed by Monk and Pearson (1989), comes
handy. The way PAM, given in Table 1, has been designed and
constructed provides a detailed analytical framework, outlining its
requirements of data and their arrangement, to estimate various
indicators of financial and economic viability of given enterprises. PAM
is also helpful in estimating various measures of protection such as
nominal and effective protection coefficients, manifesting the impact of
various interventions in input-output markets, providing clue to the
nature of distortions in incentives to the enterprises under examination.
The indicators of private and social profitability, used to ascertain
the efficiency and profitability of basmati rice and cotton and other
measures of their comparative advantage are explained below:

Economic Efficiency and Distortions to Incentives in Production 33
Table 1. Policy Analysis Matrix (PAM)
Item
Revenue
Costs
Profit Tradable Inputs Domestic Factors
Private Prices A B C D
Social Prices E F G H
Divergence I J K L
Source: Monke and Pearson (1989).
Private Profit, D = A – (B+C), measures the private profitability and
competitiveness of a given enterprise at market prices of inputs and
output. A positive value of D is indicative of the enterprise’s private
profitability and its financial viability.
Output – Input Ratio = Gross income / gross costs = A / (B+C). It
is an overall measure and indicator of relative efficiency and
profitability of the enterprises under reference.
Profitability Ratio. In terms of the symbols used in Table 1, it is: C
/ (A-B), providing an estimate of cost of domestic factors per unit of
value added at private prices. It is a useful measure for ranking
private profitability and financial viability of different crops and
other farm enterprises.
Social Profit for a given enterprise is evaluated at social / economic
prices of inputs and outputs. For economic viability of a given
enterprise its social profit: as indicated by H = (E-F-G), in Table 1,
must be positive.
Domestic Resource Cost: It is the cost of domestic factors used in
production of a commodity per unit of the foreign exchange earned
from its increased exports or saved through its import substitution.
DRC is the ratio between cost of domestic factors and value added at
social prices, G / (E-F). In case DRC > 1 the country does not have
comparative advantage in domestic production of the commodity and
when DRC < 1 the country enjoys comparative advantage.
Nominal Protection Coefficient (NPC): It is the simplest measure
of protection. It is calculated by dividing the domestic market prices
of a commodity by its international prices adjusted for domestic
marketing costs, or Pdi / Pwi, where Pdi is the domestic price of the
commodity and Pwi is the corresponding social (world) price. In

34 Salam And Tufail
terms of the symbols used in Table 1, it is obtained by calculating the
ratio between A and E, i.e., dividing total revenue estimated at actual
market prices by the total revenue evaluated at social prices. When
NPC > 1, domestic production enjoys protection and a value of NPC
< 1 implies implicit taxation and discouragement to domestic
producers.
Effective Protection Coefficient (EPC): It measures the net effect
of interventions in factor inputs and output markets. It is calculated
by taking a ratio between the values added by an enterprise at private
prices and at social prices, i.e., (A – B) / (E- F). The interpretation
of EPC is similar to that of the NPC discussed earlier.
The formulae for estimating different coefficients as given above
are based and adapted from the discussions in Scandizzo and Bruce
(1980) and Monke and Pearson (1989).
2.2. Data for Constructing PAM
Data for filling in various cells of PAM, as outlined in Table
1, were adapted from the cost of production estimates of basmati rice
and cotton crops reported in the respective Policy analysis reports of
the Agriculture Policy Institute. These data were supplemented,
where needed, from the analysis and information presented in the
unpublished M. Phil thesis of Tufail (2014). Data on output prices
were also supplemented with the information provided in the
Statistical Appendix of Pakistan Journal of Agricultural Economics
January 2012 issue and some of the economic prices were estimated
by the authors from the data on international prices of cotton and rice
reported in Pakistan Economic Survey. Based on these data, as
explained above, PAM for basmati rice and cotton were constructed
and are given at Annexes 1-3. Data used in the study relate to 2010-
2012 crop years, which are characterized by considerable variation
in input and output prices, the main reason for selecting period of
study.
Farm inputs used in production of rice and cotton for use in
constructing PAM are divided into tradable and non-tradable. The
prices of inputs and outputs for use in policy analysis matrix were
Economic Efficiency and Distortions to Incentives in Production 35
categorized into market / private and social / economic prices as
explained below:
Tradable Inputs: They include all those inputs which were
either purchased or can be traded in the international market. In
our analysis these are seed, chemical fertilizers, pesticides,
services of farm machinery, i.e., tractor, thresher, tube well, etc.
Non-Tradable Inputs/Domestic Factors: They include land,
labour, and farm yard manure and canal water.
Private Prices are the market prices actually paid by the farmers
for their purchases of inputs and received for their produce.
Social Prices of Inputs and Outputs: These were worked back
from the actual international prices of various inputs and outputs
accounting for costs and margins entailed in their marketing and
distribution.
3. RESULTS FROM POLICY ANALYSIS MATRIX
From the data in Annexes 1-3, indicators of private profitability,
economic efficiency and comparative advantage and distortions to
incentives, as detailed above, were estimated. These indicators are
explained here under along with their implications for distortions in
incentives in cotton and rice farming in Punjab.
3.1. Private Profitability and Competitiveness
The market prices reflect the underlying economic costs and
valuation and the effects of all policies and market failures [Monke and
Pearson (1989)]. The private profitability of rice and cotton crops in the
Punjab is reflected by the positive values in the second column of Table
2, showing their competitiveness all along for the period under reference.
As the gross revenues accruing to the producers from the sale proceeds
of each crop were higher than the total costs entailed in the use of
tradable and non- tradable factors producers received above normal
returns to their investment in producing these crops.
In view of the varying use levels of farm inputs and differences
in durations of growing periods of cotton and rice, resulting in a lot of

36 Salam And Tufail
variation in their overall investment, absolute values of profits may not
be appropriate for comparing their profitability. To overcome this
limitation, we estimated the ratio of the domestic factors’ costs to the
value added at private prices in production of cotton and rice. The ratio
between the costs of domestic factors and value added at private prices
shows how much a given enterprise can afford to pay domestic factors
and still remain competitive [Monke and Pearson (1989)]. Assuming
cost minimization behavior of farmers, lower the ratio between cost of
domestic factors and the value added, higher the profitability ranking of
that crop / enterprise. The input-output coefficients may also change on
account of technological development and result in changing use level
of inputs and resulting output. But this is more likely to happen in the
long run or in period of rapid technological changes. Thus, to account
for the impact of varying levels of total investments on crop profitability
we have estimated the ratios between total revenues and total costs, i.e.,
output–input ratio to estimate the relative efficiency and overall rate of
return to the costs incurred in the process. To account for the impact of
price fluctuations on profitability and relative positions output input
ratios were calculated for three crop years. The results of these estimate-
ions are also given in Table 2.
During 2009-10 crop year, cotton farming experienced higher
ranking in terms of domestic factors’ cost per unit of value added as
compared to basmati rice. The analysis based on the ratio between total
revenue and total costs also confirmed this ranking and indicated higher
returns to investment in cotton farming as compared to those of basmati
rice. During 2010-11, there was a dramatic improvement in the ranking
of cotton as the ratio of domestic factors’ cost to value added at domestic
prices declined from 0.45 in 2009-10 to 0.21 in 2010-11. There was a
marginal improvement for basmati rice as well. The output input ratio
for cotton also increased from 1.57 in 2009-10 to 2.76 in 2010-11, while
that of rice improved from 1.18 to 1.22. The situation in 2011-12 crop
year witnessed a significant change in the economics of both cotton and
rice, as the prices received by cotton growers fell sharply; from Rs.4,003
per 40 kg in 2010-11 to Rs.2,558 in 2011-12 while those of basmati
paddy increased from Rs.1,320 per 40 kg to Rs.1,424. As the input prices
of various inputs were on the rise profitability of both cotton and rice are
Economic Efficiency and Distortions to Incentives in Production 37
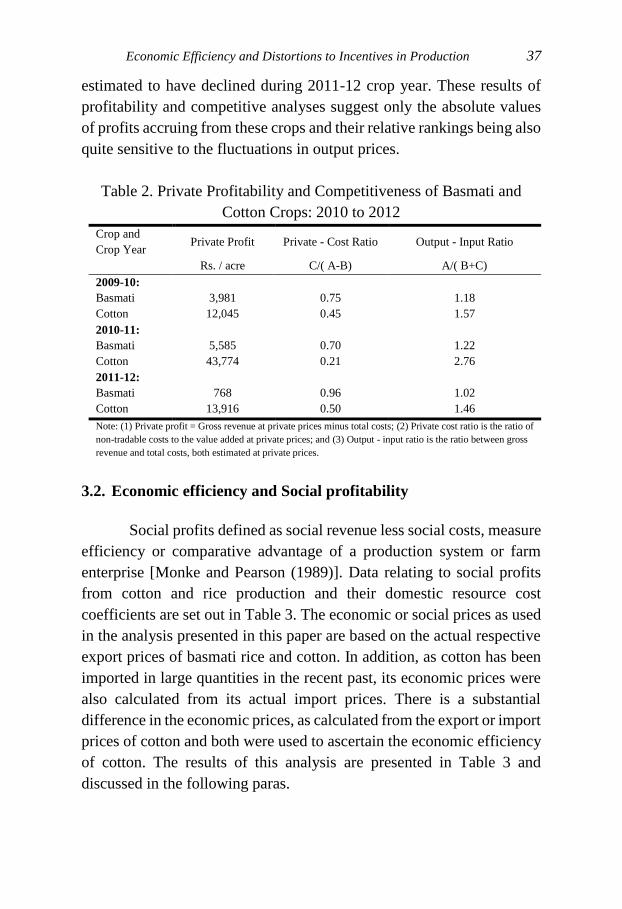
estimated to have declined during 2011-12 crop year. These results of
profitability and competitive analyses suggest only the absolute values
of profits accruing from these crops and their relative rankings being also
quite sensitive to the fluctuations in output prices.
Table 2. Private Profitability and Competitiveness of Basmati and
Cotton Crops: 2010 to 2012
Crop and
Crop Year Private Profit Private - Cost Ratio Output - Input Ratio
Rs. / acre C/( A-B) A/( B+C)
2009-10:
Basmati 3,981 0.75 1.18
Cotton 12,045 0.45 1.57
2010-11:
Basmati 5,585 0.70 1.22
Cotton 43,774 0.21 2.76
2011-12:
Basmati 768 0.96 1.02
Cotton 13,916 0.50 1.46
Note: (1) Private profit = Gross revenue at private prices minus total costs; (2) Private cost ratio is the ratio of
non-tradable costs to the value added at private prices; and (3) Output - input ratio is the ratio between gross
revenue and total costs, both estimated at private prices.
3.2. Economic efficiency and Social profitability
Social profits defined as social revenue less social costs, measure
efficiency or comparative advantage of a production system or farm
enterprise [Monke and Pearson (1989)]. Data relating to social profits
from cotton and rice production and their domestic resource cost
coefficients are set out in Table 3. The economic or social prices as used
in the analysis presented in this paper are based on the actual respective
export prices of basmati rice and cotton. In addition, as cotton has been
imported in large quantities in the recent past, its economic prices were
also calculated from its actual import prices. There is a substantial
difference in the economic prices, as calculated from the export or import
prices of cotton and both were used to ascertain the economic efficiency
of cotton. The results of this analysis are presented in Table 3 and
discussed in the following paras.
38 Salam And Tufail
Table 3. Social Profits and Domestic Resource Costs of Basmati
and Cotton : 2010 to 2012
Crop and Crop Year Social Profit DRC
Rs. /acre
2009-10:
Basmati – export price 9,197 0.64
Cotton – export price 1,294 0.92
Cotton – import price 18,923 0.43
2010-11:
Basmati – export price 3,614 0.84
Cotton – export price 46,013 0.27
Cotton – import price 67,875 0.20
2011-12:
Basmati – export price (6,549) 1.38
Cotton – export price (7,414) 1.44
Cotton – import price 23,696 0.51
Note: (1) Social profit = Gross revenue - total costs of tradable and non-tradable inputs, all estimated at
social/economic prices; (2) Social prices of basmati and cotton export were estimated from their actual export prices;
(3) As large quantity of cotton has been imported, its social prices also estimated from import prices and used here;
(4) Data in cotton export and cotton import rows based on its export and import parity prices; and (5) The values in
parentheses are in negative, indicating negative profitability.
The respective values of social profits, for both cotton and
basmati rice, for the 2009-10 and 2010-11 crop years, were positive.
Thus, cultivation of these crops was economical from the national
perspective. In other words, Punjab enjoyed economic efficiency and had
comparative advantage in cultivation of both cotton and rice during these
two crop seasons. However, the absolute values of social profits of rice
and cotton, as reported in Table 3, reflect vast differences. This is mainly
on account of the varying intensity of factor inputs use and varying
periods of crop duration, resulting in varying levels of farm investment
values. To overcome this problem we have estimated domestic resource
cost coefficients for both cotton and rice. The DRCs measure the
country’s international comparative advantage in production and foreign
exchange generating capacity of specific production activities [FAO
(1991)]. Appleyard (1987) noted since DRC coefficient shows the
domestic resource costs incurred per unit of foreign exchange earned or
Economic Efficiency and Distortions to Incentives in Production 39
saved, when DRC for a given commodity is less than 1, (DRC < 1), the
country has comparative advantage in its produc-tion and vice versa.
The DRCs estimated for both cotton and rice, for 2009-10 crop
year, were less than one (<1), thus Punjab had a comparative advantage
in their production. These results also indicated economic efficiency of
Punjab in the cultivation of these export crops. However, there was wide
difference in the DRC coefficients of the two crops, impacting their
economic rankings. During the next crop season, 2010-11, the world
prices of cotton witnessed a significant increase that translated into much
higher economic prices in relation to the last season; (Rs. 4, 647 / 40 kg
in 2010-11 as compared to 1,709 in 2009-10). However, export parity
price of basmati paddy in 2010-11 declined, (from Rs. 1,511 per 40 kg
in 2009-10 to Rs. 1, 480 in 2010-11) due to lower export prices of
basmati rice obtaining in export markets (Table 4). Accordingly,
economic position of cotton as reflected in its higher social profits in
2010-11 was strengthened over that of 2009-10 but that of basmati rice
weakened. Nevertheless, rice continued to enjoy economic viability and
social profitability as reflected by its positive values of social profit. In
view of the contrasting changes in their economic prices during 2010-
11, as explained above, comparative advantage of cotton as reflected in
its declining domestic resource cost coefficient also improved over that
of basmati rice. Although, DRCs for both cotton and rice in 2010-11crop
year, estimated at 0.27 and 0.84, respectively, indicative of their
comparative advantage in export markets their relative positions vis-a-
vis each other had changed considerably due to the varying
developments in international markets. In view of these DRC estimates,
cotton had a much higher comparative advantage as it required 66
percent less domestic resources to earn one unit of foreign exchange as
compared to that of rice.
For the 2011-12 crop, the economic position of both cotton and
rice, deteriorated sharply as their international prices precipitated and
translated into much lower economic prices in relation to the last year
(cotton Rs.2,416 and basmati paddy at Rs.1,392 per 40 kg). The social
profitability of both cotton and rice when evaluated at export parity
prices was negative as the gross revenue at social prices was less than
the total costs expended by the society in their farming. The DRC
40 Salam And Tufail
coefficients of cotton and rice, as estimated from their respective export
parity prices, during 2011-12 were 1.44 and 1.38; exceeding one
(DRC >1) by a substantial margin and reflecting comparative
disadvantage in world trade/markets. This dramatic turnaround in the
economic fortunes of two of the most important cash and export
commodities of Pakistan was primarily triggered by the sharp fall in their
export prices.
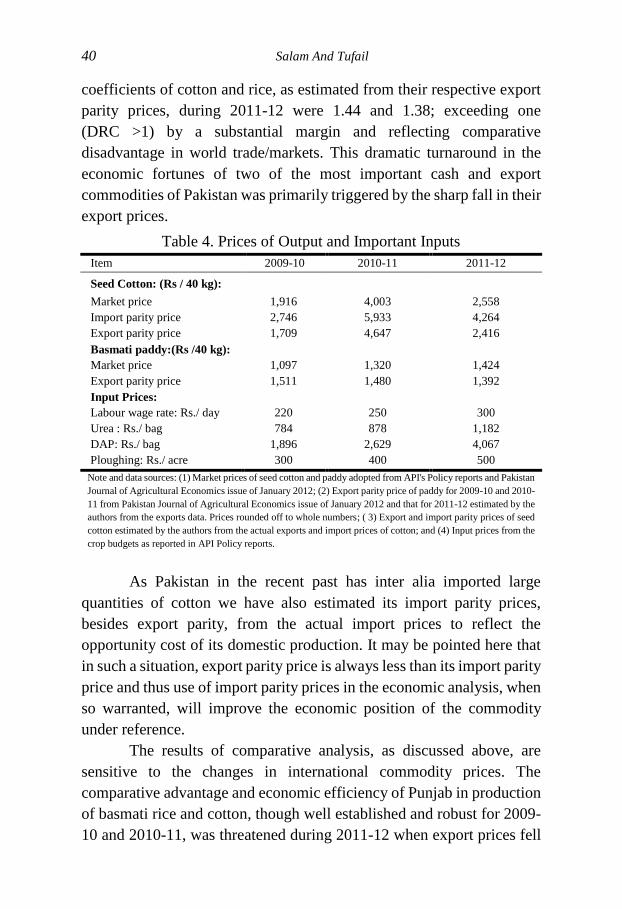
Table 4. Prices of Output and Important Inputs
Item 2009-10 2010-11 2011-12
Seed Cotton: (Rs / 40 kg):
Market price 1,916 4,003 2,558
Import parity price 2,746 5,933 4,264
Export parity price 1,709 4,647 2,416
Basmati paddy:(Rs /40 kg):
Market price 1,097 1,320 1,424
Export parity price 1,511 1,480 1,392
Input Prices:
Labour wage rate: Rs./ day 220 250 300
Urea : Rs./ bag 784 878 1,182
DAP: Rs./ bag 1,896 2,629 4,067
Ploughing: Rs./ acre 300 400 500
Note and data sources: (1) Market prices of seed cotton and paddy adopted from API's Policy reports and Pakistan
Journal of Agricultural Economics issue of January 2012; (2) Export parity price of paddy for 2009-10 and 2010-
11 from Pakistan Journal of Agricultural Economics issue of January 2012 and that for 2011-12 estimated by the
authors from the exports data. Prices rounded off to whole numbers; ( 3) Export and import parity prices of seed
cotton estimated by the authors from the actual exports and import prices of cotton; and (4) Input prices from the
crop budgets as reported in API Policy reports.
As Pakistan in the recent past has inter alia imported large
quantities of cotton we have also estimated its import parity prices,
besides export parity, from the actual import prices to reflect the
opportunity cost of its domestic production. It may be pointed here that
in such a situation, export parity price is always less than its import parity
price and thus use of import parity prices in the economic analysis, when
so warranted, will improve the economic position of the commodity
under reference.
The results of comparative analysis, as discussed above, are
sensitive to the changes in international commodity prices. The
comparative advantage and economic efficiency of Punjab in production
of basmati rice and cotton, though well established and robust for 2009-
10 and 2010-11, was threatened during 2011-12 when export prices fell
Economic Efficiency and Distortions to Incentives in Production 41
sharply. Thus, here is a lesson for all those concerned with agricultural
development in general and cotton and rice in particular. The lesson is to
keep a continuous watch on the developments in international markets
and monitor and analyze the commodity prices and advise the concerned
quarters of the emerging policy challenges facing the country in world
markets.
The results of empirical analysis presented here are in line with
those published by Appleyard, based on crop budgets of the 1980s
[Appleyard (1987)]. The comparative advantage of both rice basmati and
cotton in Punjab-Pakistan was ascertained on the basis of their social
prices, estimated as export parity prices from their corresponding export
prices. Thus, increasing production and exports of cotton and basmati
rice in the province is an economic proposition and in the country’s
interest. These results are similar to those reported by Chaudry, et al.
(2009) in their study of cotton in Punjab.
3.3. Distortions to incentives
To examine the situation of incentives to domestic production of
cotton and rice and distortions thereof, their nominal and effective
protection coefficients were estimated. These coefficients are presented
in Table 5. The nominal protection coefficient for seed cotton for 2009-
10 crop was greater than one, (>1). Thus, domestic market prices of seed
cotton as received by growers were higher than the corresponding world
prices. The producer prices of seed cotton in domestic market, on the
average, exceeded export parity prices by about 12 percent. The effect-
ive protection coefficients for cotton, which reflect the net effect of v
interventions in factor inputs and output markets, also endorsed the
contention of protection and incentive to cotton producers. It needs to
be mentioned here that there is a vast domestic market for cotton feeding
the domestic textile industry and competing with exports for quality
cotton, offering attractive prices for the produce. Nevertheless, producer
prices of seed cotton were considerably less than its corresponding
economic prices worked back from the actual import prices of lint. The
NPC and EPC for seed cotton based on its import parity prices worked

42 Salam And Tufail
back from its actual import prices were respectively 0.70 and 0.66,
indicating implicit taxation of domestic production.
The NPC for basmati rice during 2002-10 crop year, estimated at
0.74 was less than one, (<1), indicating 26 percent implicit taxation of
domestic production. Taxation of basmati as estimated from its EPC
increased to 36 percent, reflecting the net outcome of government
interventions in farm input and output markets. The implicit taxation of
basmati rice and resource transfers from basmati farmers have also been
reported by the earlier studies on the subject; Appleyard (1987), GoP
(1988) Hamid, Ijaz and Nasim (1990), Akhtar, et al. (2007), Chaudhry,
et al. (2009), Dorosh and Salam (2009), Salam (2009 and 2010), and
Qudus and Mustafa (2011).
Table 5. Nominal and Effective Protection Coefficients in Rice and
Cotton Production:
2010 to 2012
Crop and Crop Year NPC EPC
2009-10:
Basmati paddy 0.74 0.64
Seed cotton 1 1.12 1.42
Seed cotton 2 0.70 0.66
2010-11:
Basmati paddy 0.90 0.84
Seed cotton 1 0.86 0.88
Seed cotton 2 0.68 0.65
2011-12:
Basmati paddy 1.02 1.05
Seed cotton 1 1.06 1.66
Seed cotton 2 0.61 0.58
Note: Coefficients of basmati paddy based on economic prices estimated from export prices of long grain
aromatic rice.
Seed cotton 1 coefficients are based on export parity prices of cotton as estimated from its export prices.
Seed cotton 2 coefficients are based on import parity prices of cotton as worked base from its actual import
prices.
The NPCs and EPCs calculated from the PAM for cotton for the
2010-11 crop year, based on its import parity prices, like the ones
discussed for the previous crop, indicate continued implicit taxation of
domestic production. As the international prices of cotton scaled new
heights, its export parity prices experienced a quantum jump. The
domestic prices of seed cotton also rose in tandem with the world prices
Economic Efficiency and Distortions to Incentives in Production 43
but were considerably less than the corresponding export parity prices.
Thus NPC of seed cotton was estimated at 0.86 while its EPC was 0.88.
As these estimates of NPC and EPC, both based on export and import
parity prices, were less than one, domestic production of cotton during
2010-11 crop year was subjected to implicit taxation, ranging from 12 to
35 percent. The, NPC and EPC for basmati paddy estimated at 0.90 and
0. 84 respectively, being less than one, (< 1), indicated continued
taxation of basmati producers during 2010-11. However, incidence of
implicit taxation of rice basmati, as reflected by the higher values of its
NPC and EPC in relation to previous crop year, declined to 10-16 percent
as compared to 26-36 percent in 2009-10 crop year.
The situation of incentives for basmati crop during 2011-12
season as reflected by its NPC and EPC estimates of 1.02 and 1.05
reflected marginal protection to domestic producers as the prices
received by them were somewhat higher than the corresponding
economic price as worked back from export prices. Thus there was a
qualitative change from previous years of its high implicit taxation. For
cotton crop with NPC and EPC estimates of 0.61 and 0.58, calculated
from the import parity prices, the implicit taxation as observed in
previous years continued. Nevertheless, the situation of implicit taxation
of domestic cotton production changed into protection when economic
prices of domestic cotton were worked back from its actual export price
as the NPC and EPC calculated at 1.06 and 1.66, respectively, from the
2011-12 crop data were greater than one. These results are similar to
those reported by Qudus and Mustafa (2011) for cotton in their study of
comparative advantage of major crops in Punjab.
Both cotton and rice are important export crops of Pakistan.
There is also an active domestic market for both cotton and rice as
substantial proportion of the domestic production of cotton is processed
into various products in domestic textile industry. Similarly, a
considerable proportion of domestic production of long grain aromatic
basmati rice is consumed domestically. Accordingly, there is active
trading of these commodities in domestic market, and competition
between domestic and export markets for cotton and rice aligning the
trends in domestic market prices with the developments in world
markets. This is amply borne out by the wide fluctuations in the values

44 Salam And Tufail
of protection coefficients estimated from the annual data. These
fluctuations in prices add to the risk and uncertainty, hallmark of
agriculture and crop production and underline the need for adopting such
measures as to minimize the adverse effects on domestic production
emanating from the price fluctuations in world markets.
The results of PAM as reported in this paper depend not only on
the technical efficiency of farmers but also on the structure and
functioning of inputs and output markets. The construction of PAM is
also quite demanding in terms of its data, requiring a good understanding
of the technical details of the enterprises under examination and
conceptual issues entailed in classification of various inputs and
estimation of economic prices. The results are also sensitive to the trade
orientation of a given commodity, whether imported or exported as it
impacts on the level of resulting opportunity cost of the domestic
produce which is also influenced by the supporting infrastructures in the
domestic markets. The results, as highlighted by the changes in the
annual estimates of different indicators, are quite sensitive to the
developments in international and domestic markets, thus need to be
interpreted with care, keeping in view the organization of domestic
markets and their linkages with the commodity markets at large.
4. CONCLUSION
Analysis of crop budgets for basmati rice and cotton, 2010 to
2012 crops, has confirmed competitiveness of their production in
Punjab. The degree of competitiveness however remains sensitive to
fluctuations in input and output prices. Farmers’ total revenue exceeded
their gross costs incurred in the production of cotton and rice. The sur-
plus revenue however fluctuated from year to year, impacting the extent
of competitiveness. The domestic resource cost coefficients, for both the
crops, though varying from year to year, were consistently less than
one. Thus, results of economic analysis confirm their comparative
advantage and economically efficient production in Punjab.
The estimation and analysis of NPCs and EPCs for basmati and
cotton crops have indicated implicit taxation as well as some protection
to domestic producers. Nevertheless the extent of taxation and protect-

Economic Efficiency and Distortions to Incentives in Production 45
ion, as manifested by varying size of the NPC and EPCs, keeps on
changing with the developments in world commodity markets and their
spill over to domestic market. The comparison of domestic prices of seed
cotton with corresponding world prices, worked back from export prices
of lint has indicated some protection to cotton production during some
of the crop years but implicit taxation when comparison is based on
economic prices estimated from actual import prices of cotton.
As per results of the analysis presented in this paper, basmati rice
and cotton have been generally subjected to implicit taxation, intensity
varying from year to year due to changes in domestic and world prices.
The earlier studies by Appleyard (1987), Hamid, Nabi and Nasim (1990),
GoP (1988), Dorosh and Salam (2009), Salam (2009), Chaudhry, et al.
(2009), Qudus and Mustafa (2011), had also reported significant implicit
taxation of basmati and cotton crops. Much water has since passed under
the bridge. Economic reforms and policy initiatives resulting into
dwindling role of the public sector and increasing role of private sector
in farm output and input markets have been undertake. Nevertheless,
domestic producers of basmati and cotton continue to be implicitly taxed,
resulting in large resource transfers, adversely impacting producer
incentives, farm investments and efforts aimed at alleviating rural
poverty.
Punjab has a comparative advantage in production of both
basmati rice and cotton, important export crops. Their producers and
production need all the encouragement through research and
development efforts. Implicit taxation of domestic production and
resource transfers from farmers need to be arrested.
Under the 18th Amendment, in 2011, agriculture as a subject has
been devolved to the provinces [GoP (2011)]. Since basmati rice and
cotton are the two most important export crops of the Punjab, the
provincial Department of Agriculture should make all-out efforts to
ensure competition in the markets, improve marketing infrastructure and
market intelligence to help farmers get better prices for their produce.
Efforts also need to be directed to improve the processing of paddy and
ginning of seed cotton so as to fetch higher prices in the world markets.
Since basmati rice and cotton are two most important exports, their
domestic prices are bound to reflect the developments in world markets.

46 Salam And Tufail
Excessive fluctuations in market prices, however, would have adverse
implications for resource use and productivity, farm incomes and
household welfare. Ways and means ought to be found and steps taken
to insulate domestic producers from excessive fluctuations in market
prices. However, this is predicated on the availability and development
of institutional capacity to continuously monitor and analyze the
developments in the domestic and world markets.
ANNEXES
Annex 1: Policy Analysis Matrix for Basmati Paddy: 2010-12
Crop Year Gross Revenue Tradable Inputs Cost Domestic Factors' Cost Profit
Rs./Acre
Private Prices 25,634.00 9,392.00 12,261.00 3,981.00
Social Prices 34,742.00 9,374.00 16,171.00 9,197.00
Transfers (9,108.00) 18.00 (3,910.00) (5,216.00)
2010-11:
Private Prices 30,840.00 12,295.00 12,960.00 5,585.00
Social Prices 34,360.00 12,385.00 18,361.00 3,614.00
Transfers (3,520.00) (90.00) (5,401.00) 1,971.00
2011-12:
Private Prices 33,828.00 15,635.00 17,425.00 768.00
Social Prices 33,124.00 15,756.00 23,917.00 (6,549.00)
Transfers 704.00 (121.00) (6,492.00) 7,317.00
Note: Basic data used in these calculations are adopted from the crop budgets as reported in API’s Policy reports,
prices data supplemented with other sources as indicated in the text.
Annex 2: Policy Analysis Matrix for Seed Cotton Based on Its Export Parity Prices: 2010-12
Crop Year
Gross
Revenue
Tradable Inputs’
Cost Domestic Factors’ Cost Profit
Rs./Acre
2009-10:
Private Prices 33,032.00 11,121.00 9,866.00 12,045.00
Social Prices 29,513.00 14,056.00 14,163.00 1,294.00
Transfers 3,519.00 (2,935.00) (4,297.00) 10,751.00
2010-11:
Private Prices 68,626.00 13,179.00 11,673.00 43,774.00
Social Prices 79,574.00 16,733.00 16,828.00 46,013.00
Transfers (10,948.00) (3,554.00) (5,155.00) (2,239.00)
2011-12:
Private Prices 44,186.00 16,136.00 14,134.00 13,916.00
Social Prices 41,772.00 24,855.00 24,331.00 (7,414.00)
Transfers 2,414.00 (8,719.00) (10,197.00) 21,330.00
Note: Basic data used in these calculations are adopted from the crop budgets as reported in API’s Policy reports,
prices data supplemented with other sources as indicated in the text.

Economic Efficiency and Distortions to Incentives in Production 47
Annex 3: Policy Analysis Matrix for Seed Cotton Based on Its Import Parity Prices: 2010-12
Crop Year Gross Revenue
Tradable Inputs’
Cost
Domestic Factors’ Cost
RS/Acre Profit
2009-10:
Private prices 33,032.00 11,121.00 9,866.00
12,045.0
0
Social prices 47,142.00 14,056.00 14,163.00
18,923.0
0
Transfers (14,110.00) (2,935.00) (4,297.00)
(6,878.00
)
2010-11:
Private prices 68,626.00 13,179.00 11,673.00
43,774.0
0
Social prices 101,436.00 16,733.00 16,828.00
67,875.0
0
Transfers (32,810.00) (3,554.00) (5,155.00)
(24,101.0
0)
2011-12;
Private Prices 44,186.00 16,136.00 14,134.00
13,916.0
0
Social prices 72,882.00 24,855.00 24,331.00
23,696.0
0
Transfers (28,696.00) (8,719.00) (10,197.00)
(9,780.00
)
Note: Basic data used in these calculations are adopted from the crop budgets as reported in API’s Policy reports,
prices data supplemented with other sources as indicated in the text.
REFERENCES
API (2010) Rice Paddy Policy Analysis for 2009-10 Crop. Agriculture
Policy Institute, Islamabad.
API (2010a) Rice Paddy Policy Analysis for 2009-10 Crop. Agriculture
Policy Institute, Islamabad.
API (2011) Cotton Policy Analysis for 2011-12 Crop. Agriculture Policy
Institute, Islamabad.
API (2011a) Rice Paddy Policy Analysis for 2011-120 Crop. Agriculture
Policy Institute, Islamabad.
Akhtar,W., M. Sharif, and N. Akmal (2007) Analysis of Economic
Efficiency and Competitiveness of the Rice Production Systems
of Pakistan’s Punjab. The Lahore Journal of Economics, 12:1,
141-153.
Altaf, Z. (2008) Challenges in the Pakistan Cotton, Yarn, Textile and
Apparel Sectors”. In “Cotton-Textile-Apparel Sectors of
Pakistan. Situations and Challenges Faced. Cororaton, B. Caesar,
48 Salam And Tufail
et al. (eds.) IFPRI Markets, Trade and Institutions Division.
Discussion Paper 00800, 52-98, September 2008.
Amin, M. (2012) Statistical Appendix. Pakistan Journal of Agricultural
Economics, 63:3, 627-638.
Appleyard, D. (1987) Comparative Advantage of Agricultural
Production Systems and Its Policy Implications in Pakistan. FAO
Economic and Social Development Paper No. 68, Rome.
Chaudry, I. S., M. B. Khan, and M. H. Akhtar (2009) Economic Analysis
of Competing Crops with Special Reference to Cotton
Production in Pakistan: The Case of Multan and Bahawalpur
Regions. Pakistan Journal of Social Sciences, 29:1, 51-63.
Food and Agriculture Organization (1991) Economic Analysis of
Agricultural Policies: A Basic Training Manual with Special
Reference to Price Analysis. Training Materials for Agricultural
Planning No. 30, Rome.
GoP (1988) Report of the National Commission on Agriculture.
Government of Pakistan.
GoP (2011) Notification No. 4-9/2011—Min I. Cabinet Division,
Government of Pakistan, June 29.
GoP (2012) Pakistan Economic Survey (Statistical Supplement): 2011-
12. Ministry of Finance, Government of Pakistan, Islamabad
GoP (2013) Agricultural Statistics of Pakistan 2011-12. Government of
Pakistan.
Hamid, N., I. Nabi, and A. Nasim (1990) Trade, Exchange Rate and
Agricultural Pricing Policies in Pakistan (The Political Economy
of Agricultural Pricing Policy). Washington, D.C.: The World
Bank.
Monke, E. A. and S. R. Pearson (1989) The Policy Analysis Matrix for
Agricultural Development. Ithaca and London: Cornell
University Press.
Quddus, M. A. and U. Mustafa (2011) Comparative Advantage of Major
Crops Production in Punjab: An Application of Policy Analysis
Matrix. The Lahore Journal of Economics, 16: 1, 63-94.
Salam, A. (2008) Production, Prices and emerging Challenges in the
Pakistan Cotton Sector. In Cotton-Textile-Apparel Sectors of
Pakistan. Situations and Challenges Faced. Cororaton, B. Caesar,

Economic Efficiency and Distortions to Incentives in Production 49
et al. (eds.) IFPRI Markets, Trade and Institutions Division.
Discussion Paper 00800, 52-98, September 2008.
Salam, A. (2009) Distortions in Incentives to Production of Major Crops
in Pakistan: 1991-2008. Journal of International Agricultural
Trade and Development, 5:2, 185-208.
Salam, A. (2010) Distortions in Prices of Food grains in Pakistan: 1996-
2006. Pakistan Journal of Applied Economics, 1:2, 13-28.
Scandizzo, P. L. and C. Bruce (1980) Methodologies for Measuring
Agricultural Price Intervention Effects. World Bank Staff
Working Paper No. 394. Washington, D.C.: The World Bank.
Tufail, S. (2014) Comparative Advantage of Major Crops in Punjab,
Pakistan: An Application of Policy Analysis Matrix.
M.Phil. Thesis submitted to Federal Urdu University of Arts,
Science and Technology, Islamabad.