Embed Size (px)
Citation preview
Welcome to
Bentleys key client
Economic Update
Presented by Bankwest
1st of December 2016
Alan Langford
Chief Economist
Bankwest
Accountants AdvisorsAuditors
10-Year Government Bond Yields
Jan 80 84 86 88 90 92 94 96 98 00 02 04 06 08 10 12 14 Nov 16
2
3
4
5
6
7
8
9
10
11
12
13
14
15
16
17
months
pe
r c
en
t p
er
an
nu
m
Australia
US
Australia only - 2016
J F M A M J J A S O N D1.8
1.9
2
2.1
2.2
2.3
2.4
2.5
2.6
2.7
2.8
days
sources: RBA, Fed, Bloomberg

Accountants AdvisorsAuditors
90-Day Bank Bill and 3-Year Swap Yields
Jan 70 75 80 85 90 95 00 05 10 Nov 161
2
3
4
5
6
7
8
9
10
11
12
13
14
15
16
17
18
19
20
21
22
months
per
cen
t p
er
an
nu
m
swaps only, daily - 2016
J F M A M J J A S O N D
1.6
1.7
1.8
1.9
2
2.1
2.2
2.3
days
source: RBA
bills
swaps
Accountants AdvisorsAuditors
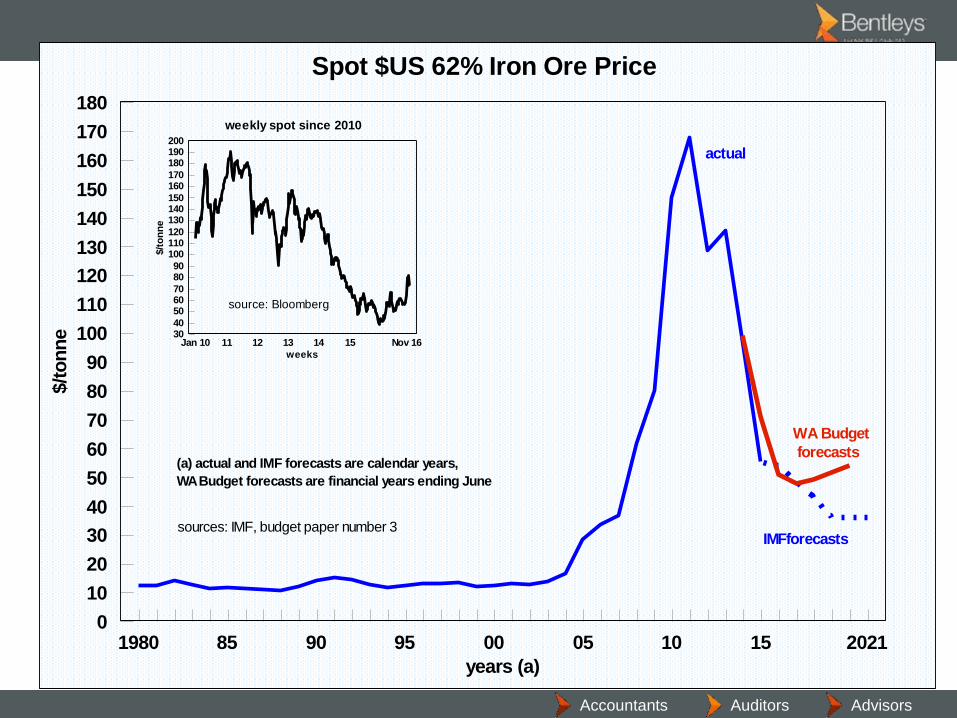
Spot $US 62% Iron Ore Price
1980 85 90 95 00 05 10 15 20210
10
20
30
40
50
60
70
80
90
100
110
120
130
140
150
160
170
180
years (a)
$/t
on
ne
weekly spot since 2010
Jan 10 11 12 13 14 15 Nov 163040
506070
8090
100110120
130140150
160170
180190200
weeks
$/t
on
ne
source: Bloomberg
sources: IMF, budget paper number 3
(a) actual and IMF forecasts are calendar years,
WA Budget forecasts are financial years ending June
actual
IMFforecasts
WA Budget
forecasts

Accountants AdvisorsAuditors
Australian Iron Ore Exports
65 70 75 80 85 90 95 00 05 10 15 210
50
100
150
200
250
300
350
400
450
500
550
600
650
700
750
800
850
900
950
30
40
50
60
70
80
90
100
110
120
130
140
150
160
170
financial years ending June
volume (mt) real $A price (a)
solid lines are actual data; dotted lines and iron ore
trade in 2016 are Bureau of Resources and Energy
Economics (BREE) March 2016 forecasts/projections.
(a) notional nominal export prices derived by dividing
total value by volume, then converted to real by deflating
nominal prices by 2000 tax-change-adjusted CPI
real price
(right scale) volume
(left scale)
iron ore trade - 2016 (mt)
Aust: 846
Brazil: 393
Ukraine: 52
Canada: 34
exports imports
China: 1023
EU: 136
Japan: 131
Korea: 67
BREE AUDUSD
assumptions
15-16: 0.73
16-17: 0.74
17-18: 0.73
18-19: 0.72
19-20: 0.72
20-21: 0.72
2011
source: BREE
Accountants AdvisorsAuditors
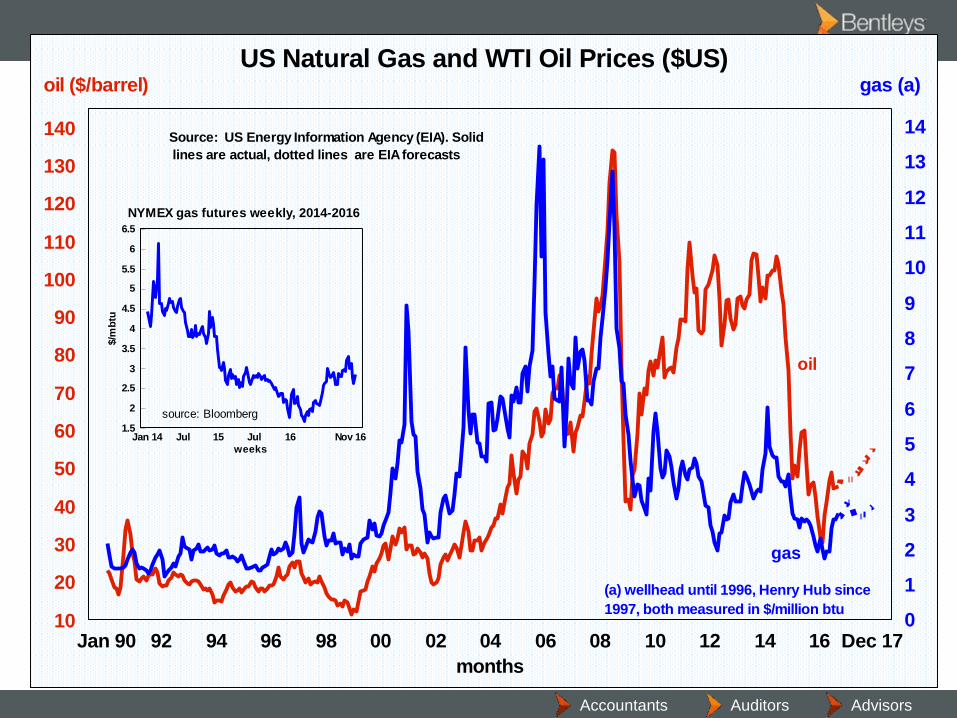
US Natural Gas and WTI Oil Prices ($US)
Jan 90 92 94 96 98 00 02 04 06 08 10 12 14 16 Dec 1710
20
30
40
50
60
70
80
90
100
110
120
130
140
0
1
2
3
4
5
6
7
8
9
10
11
12
13
14
months
oil ($/barrel) gas (a)
gas
oil
Source: US Energy Information Agency (EIA). Solid
lines are actual, dotted lines are EIA forecasts
(a) wellhead until 1996, Henry Hub since
1997, both measured in $/million btu
source: Bloomberg
NYMEX gas futures weekly, 2014-2016
Jan 14 Jul 15 Jul 16 Nov 161.5
2
2.5
3
3.5
4
4.5
5
5.5
6
6.5
weeks
$/m
btu

Accountants AdvisorsAuditors
Perth CBD Office Vacancy Rate
Jan 90 92 94 96 98 00 02 04 06 08 10 12 14 Jul 160
2
4
6
8
10
12
14
16
18
20
22
24
26
28
30
32
34
half-years (January/July)
per
cen
t
source: Property Council
Jul 08
(0.3%)
Jul 10
(10.6%)
Jan 93
(31.8%)
Jul 04
(13.9%)

Accountants AdvisorsAuditors
WA's Population Growth Rate
75 80 85 90 95 00 05 10 15 20
0.75
1
1.25
1.5
1.75
2
2.25
2.5
2.75
3
3.25
3.5
financial years ending June
per
cen
t
actual
Budget
forecasts
sources:ABS catalogue 3101.0; WA state budget paper number 3
13
09
03
89

Accountants AdvisorsAuditors
Trend Residential Building Approvals (000)
Jan 85 89 91 93 95 97 99 01 03 05 07 09 11 13 Sep 161
1.2
1.4
1.6
1.8
2
2.2
2.4
2.6
2.8
3
8
9
10
11
12
13
14
15
16
17
18
19
months
WA rest of Australia
WA(left scale)
rest of
Australia(right scale)
source:ABS catalogue 8731.0

Accountants AdvisorsAuditors
Residential Rental Vacancy Rate - Perth
Mar 80 84 86 88 90 92 94 96 98 00 02 04 06 08 10 12 Sep 160.5
1
1.5
2
2.5
3
3.5
4
4.5
5
5.5
6
6.5
7
7.5
8
8.5
9
quarters
per
cen
t
average since 1980
(3.4 per cent)
source: REIWA
Accountants AdvisorsAuditors
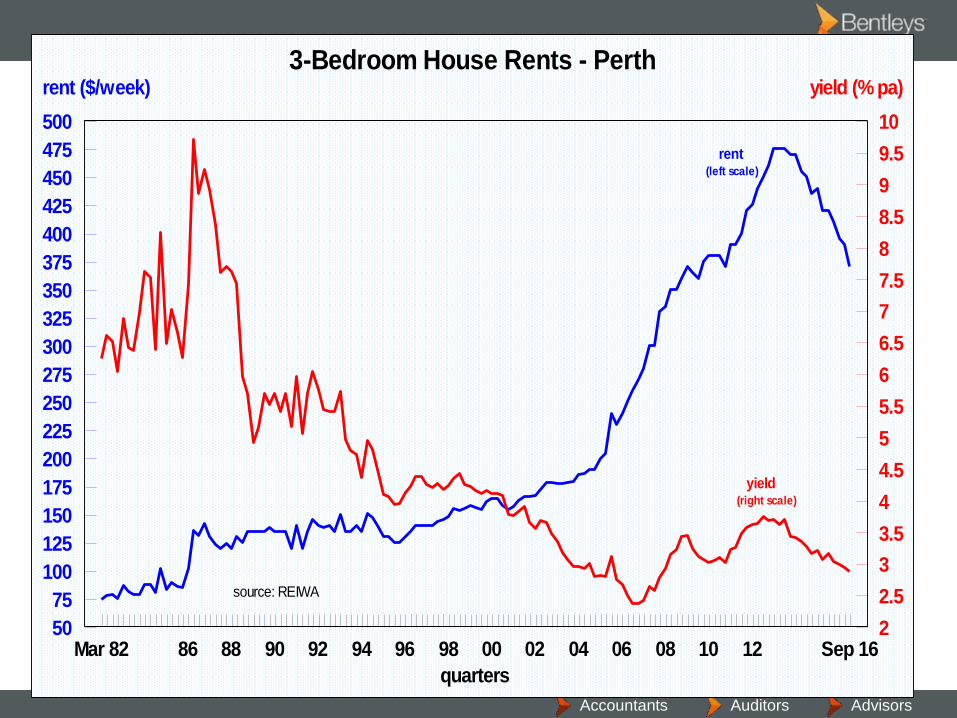
3-Bedroom House Rents - Perth
Mar 82 86 88 90 92 94 96 98 00 02 04 06 08 10 12 Sep 1650
75
100
125
150
175
200
225
250
275
300
325
350
375
400
425
450
475
500
2
2.5
3
3.5
4
4.5
5
5.5
6
6.5
7
7.5
8
8.5
9
9.5
10
quarters
rent ($/week) yield (% pa)
rent(left scale)
yield(right scale)
source: REIWA

Accountants AdvisorsAuditors
Median House Price - Perth
Mar 80 84 86 88 90 92 94 96 98 00 02 04 06 08 10 12 Sep 1625
50
75
100
125
150
175
200
225
250
275
300
325
350
375
400
425
450
475
500
525
550
575
quarters
Pri
ce (
$000)
average annual growth:
since 1980:
houses: 7.4%
inflation: 4.1%
in 10 years to Dec 2015:
houses: 5.8%
inflation: 2.9%
quarterly % change since 2012
Mar 12 13 14 15 Sep 16-5
-4
-3
-2
-1
0
1
2
3
4
5
6
7
quarters
pe
r ce
nt
85% cumulative rise in
3 years to 2006, during
which time the CPI rose
by 10%, and average
weekly earnings
grew by 21%
source: REIWA
Jun 15: 549
Sep 15: 533
Dec 15: 540
Mar 16: 530
Jun16: 532
Sep16: 515
$000
Accountants AdvisorsAuditors
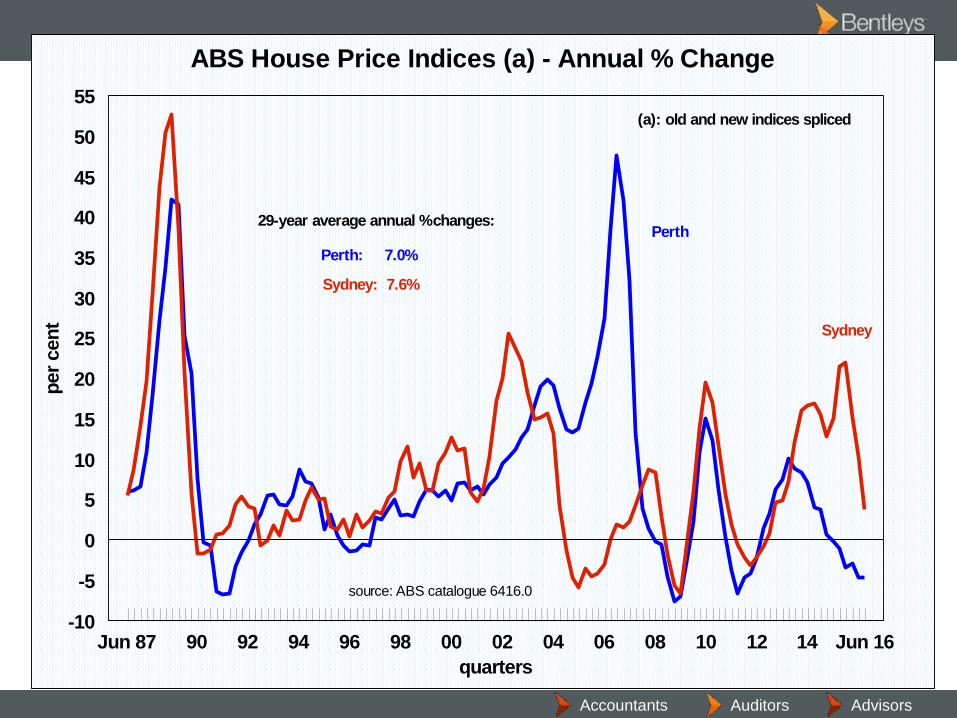
ABS House Price Indices (a) - Annual % Change
Jun 87 90 92 94 96 98 00 02 04 06 08 10 12 14 Jun 16-10
-5
0
5
10
15
20
25
30
35
40
45
50
55
quarters
per
cen
t Sydney
Perth
source: ABS catalogue 6416.0
(a): old and new indices spliced
29-year average annual %changes:
Perth: 7.0%
Sydney: 7.6%
Accountants AdvisorsAuditors
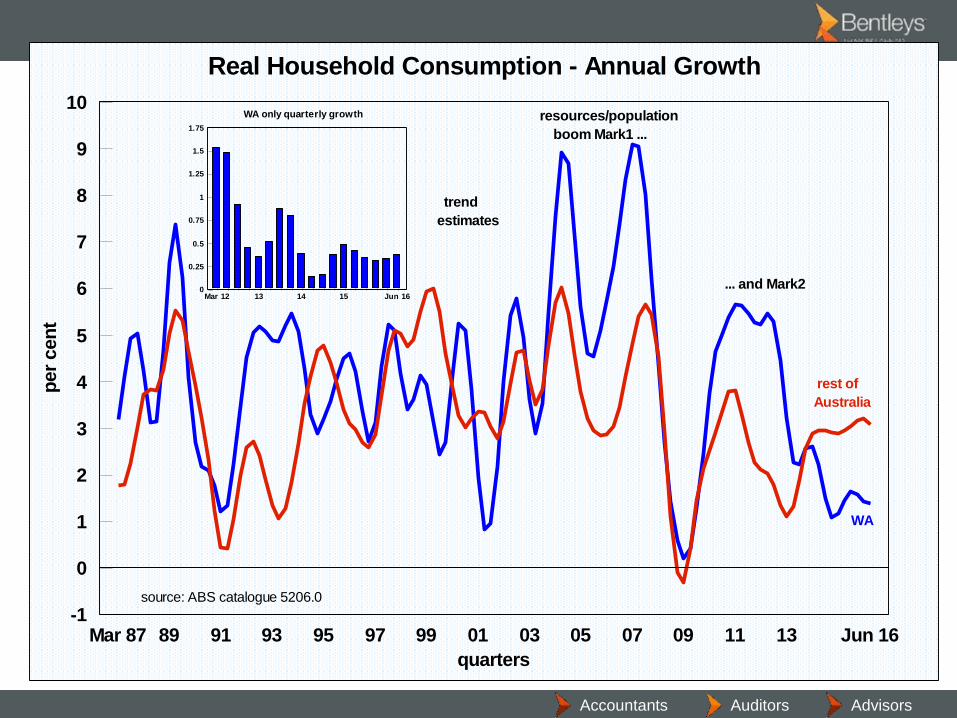
Real Household Consumption - Annual Growth
Mar 87 89 91 93 95 97 99 01 03 05 07 09 11 13 Jun 16-1
0
1
2
3
4
5
6
7
8
9
10
quarters
per
cen
t
trend
estimates
source: ABS catalogue 5206.0
WA
rest of
Australia
resources/population
boom Mark1 ...
... and Mark2
WA only quarterly growth
Mar 12 13 14 15 Jun 160
0.25
0.5
0.75
1
1.25
1.5
1.75
Accountants AdvisorsAuditors
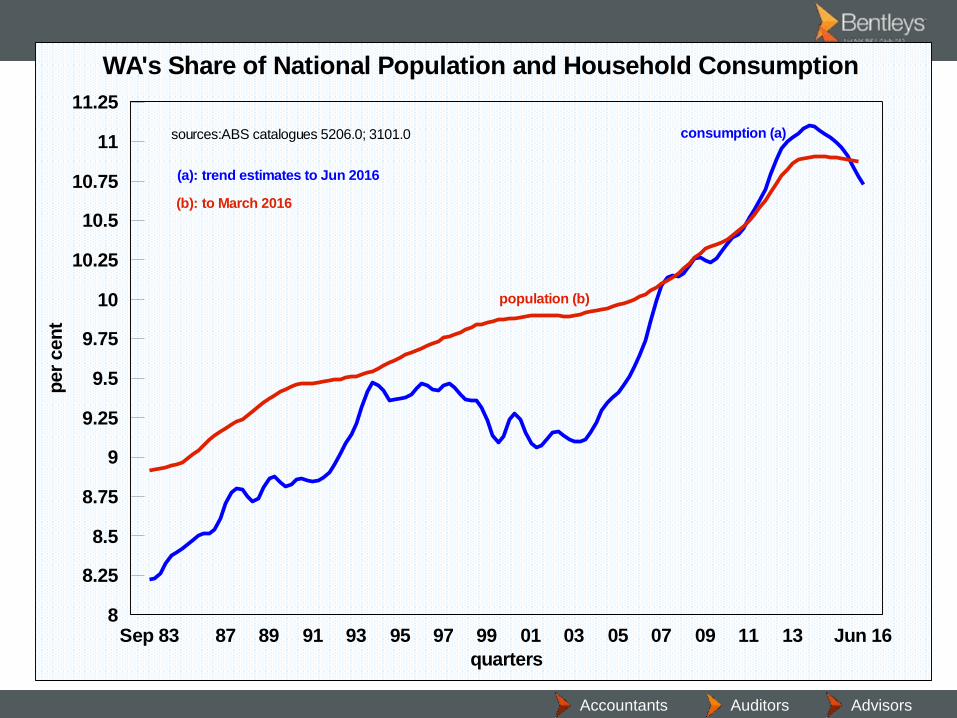
WA's Share of National Population and Household Consumption
Sep 83 87 89 91 93 95 97 99 01 03 05 07 09 11 13 Jun 168
8.25
8.5
8.75
9
9.25
9.5
9.75
10
10.25
10.5
10.75
11
11.25
quarters
per
cen
t
consumption (a)
population (b)
sources:ABS catalogues 5206.0; 3101.0
(a): trend estimates to Jun 2016
(b): to March 2016
Accountants AdvisorsAuditors
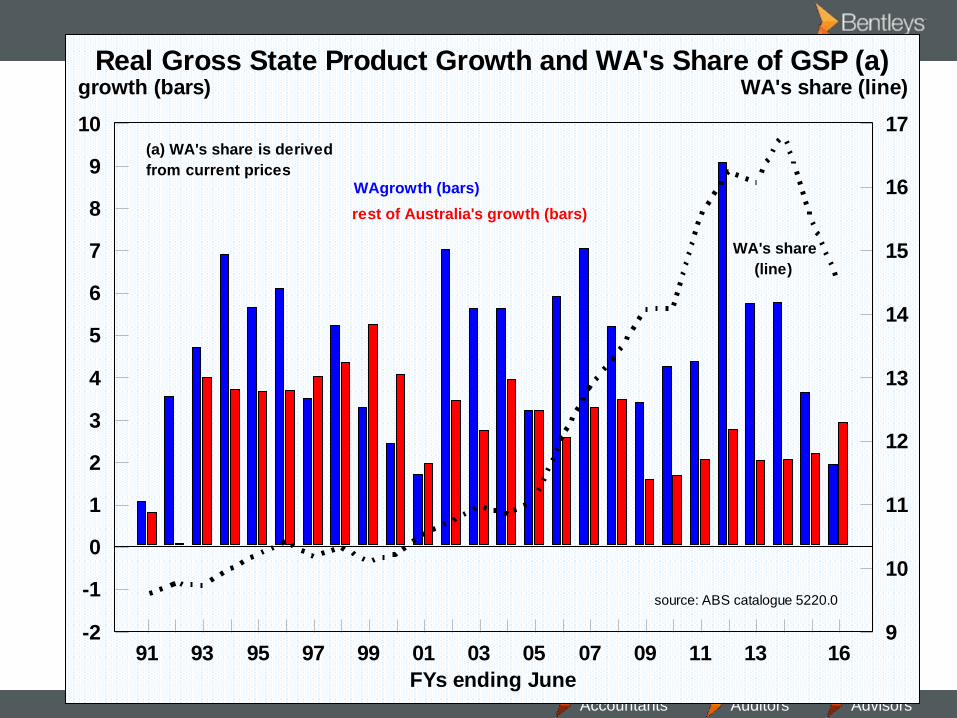
Real Gross State Product Growth and WA's Share of GSP (a)
91 93 95 97 99 01 03 05 07 09 11 13 16-2
-1
0
1
2
3
4
5
6
7
8
9
10
9
10
11
12
13
14
15
16
17
FYs ending June
growth (bars) WA's share (line)
source: ABS catalogue 5220.0
rest of Australia's growth (bars)
WAgrowth (bars)
(a) WA's share is derived
from current prices
WA's share
(line)
Accountants AdvisorsAuditors
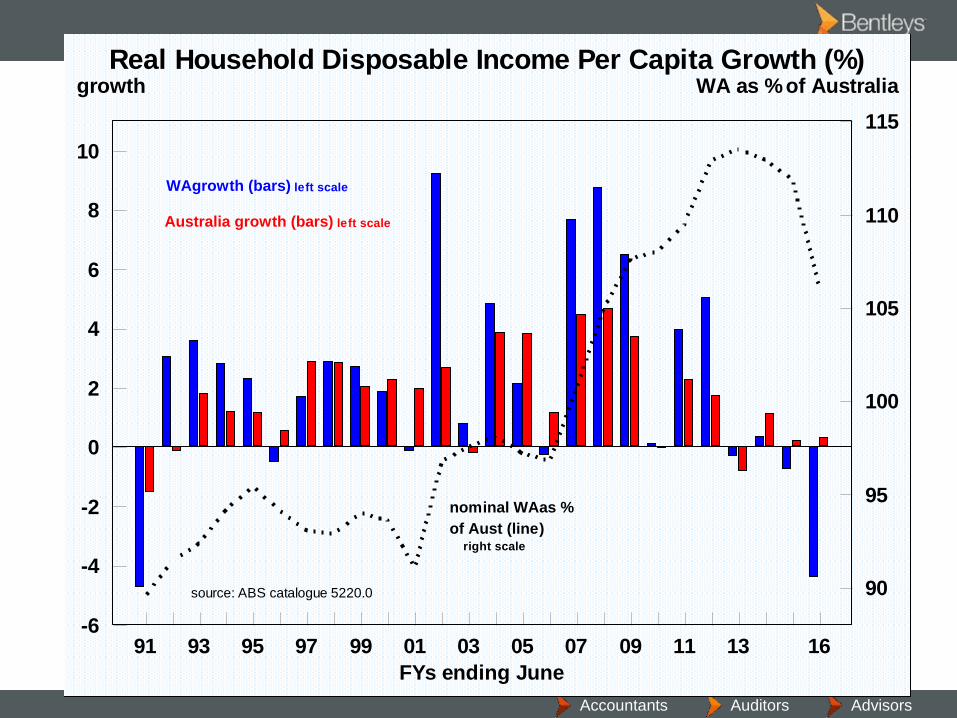
Real Household Disposable Income Per Capita Growth (%)
91 93 95 97 99 01 03 05 07 09 11 13 16-6
-4
-2
0
2
4
6
8
10
90
95
100
105
110
115
FYs ending June
growth WA as % of Australia
WAgrowth (bars) left scale
Australia growth (bars) left scale
nominal WAas %
of Aust (line) right scale
source: ABS catalogue 5220.0
Accountants AdvisorsAuditors
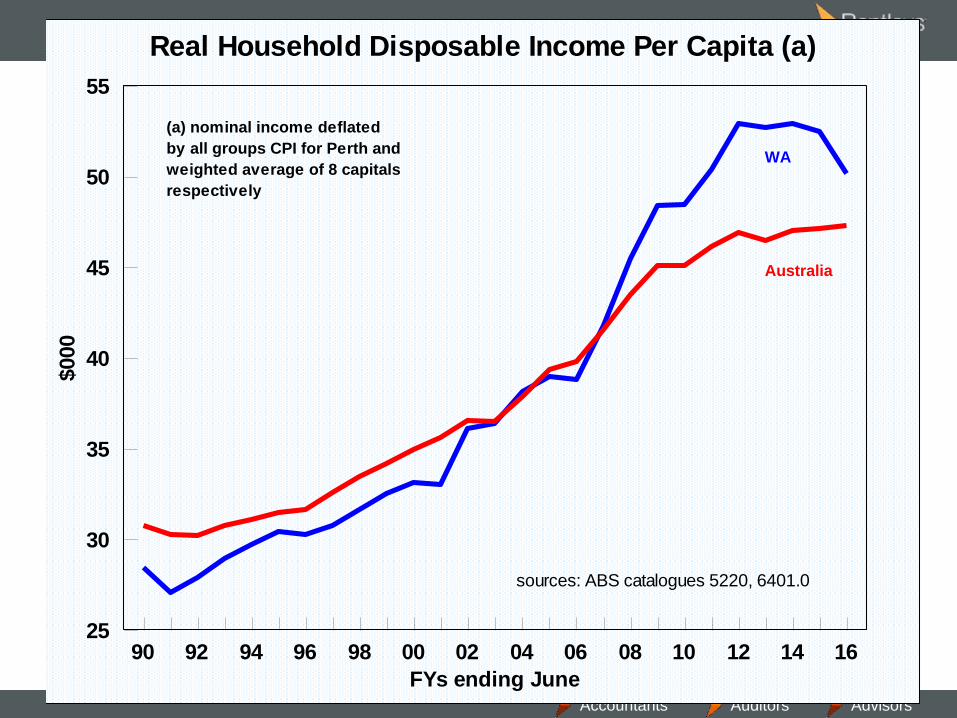
Real Household Disposable Income Per Capita (a)
90 92 94 96 98 00 02 04 06 08 10 12 14 1625
30
35
40
45
50
55
FYs ending June
$000
WA
Australia
(a) nominal income deflated
by all groups CPI for Perth and
weighted average of 8 capitals
respectively
sources: ABS catalogues 5220, 6401.0

Accountants AdvisorsAuditors
Trend Unemployment Rates
Jan 80 84 86 88 90 92 94 96 98 00 02 04 06 08 10 12 14 Oct 162
2.5
3
3.5
4
4.5
5
5.5
6
6.5
7
7.5
8
8.5
9
9.5
10
10.5
11
11.5
months
per
cen
t
WA
Australia
source: ABS catalogue 6202.0
WA Aust
Oct 15: 6.3 6.0
Sep 16: 6.3 5.6
Oct 16: 6.4 5.6
Accountants AdvisorsAuditors
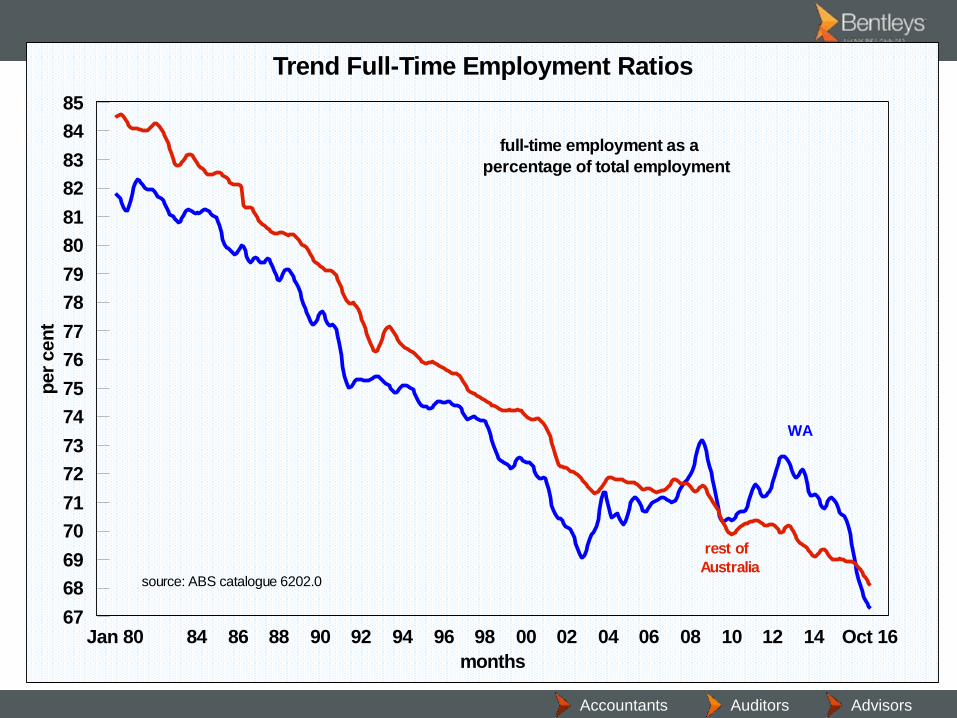
Trend Full-Time Employment Ratios
Jan 80 84 86 88 90 92 94 96 98 00 02 04 06 08 10 12 14 Oct 1667
68
69
70
71
72
73
74
75
76
77
78
79
80
81
82
83
84
85
months
per
cen
t
source: ABS catalogue 6202.0
full-time employment as a
percentage of total employment
WA
rest of
Australia

Accountants AdvisorsAuditors
Australian Dollar Against US Dollar
Jan 84 88 90 92 94 96 98 00 02 04 06 08 10 12 14 Nov 160.45
0.5
0.55
0.6
0.65
0.7
0.75
0.8
0.85
0.9
0.95
1
1.05
months
$U
S p
er
$A
daily - 2016
J F M A M J J A S O N D0.68
0.69
0.7
0.71
0.72
0.73
0.74
0.75
0.76
0.77
0.78
days
Jul 08
Feb 09
'banana republic'
GFC
peak to trough fall in late 2008 was similar to
Paul Keating's mid-1980s 'banana republic'
decline - but what took two and half years back
then took less than three months in the wake
of Lehman Brothers collpapse sources: RBA, Bloomberg
Fed first flags
intention to taper

Accountants AdvisorsAuditors
Australian Dollar Against Chinese Renminbi
Jan 84 88 90 92 94 96 98 00 02 04 06 08 10 12 14 Nov 161.5
2
2.5
3
3.5
4
4.5
5
5.5
6
6.5
7
months
ren
min
bi p
er
$A
daily - 2016
J F M A M J J A S O N N4.5
4.6
4.7
4.8
4.9
5
5.1
5.2
days
source: RBA
Accountants AdvisorsAuditors
Questions?