Embed Size (px)
Citation preview
Visteon Confidential
Luminance and Contrast Decreasedue to White Point Calibration
Hans-Ulrich Lauer, Osama Amin
Nuernberg, 15.03.2017
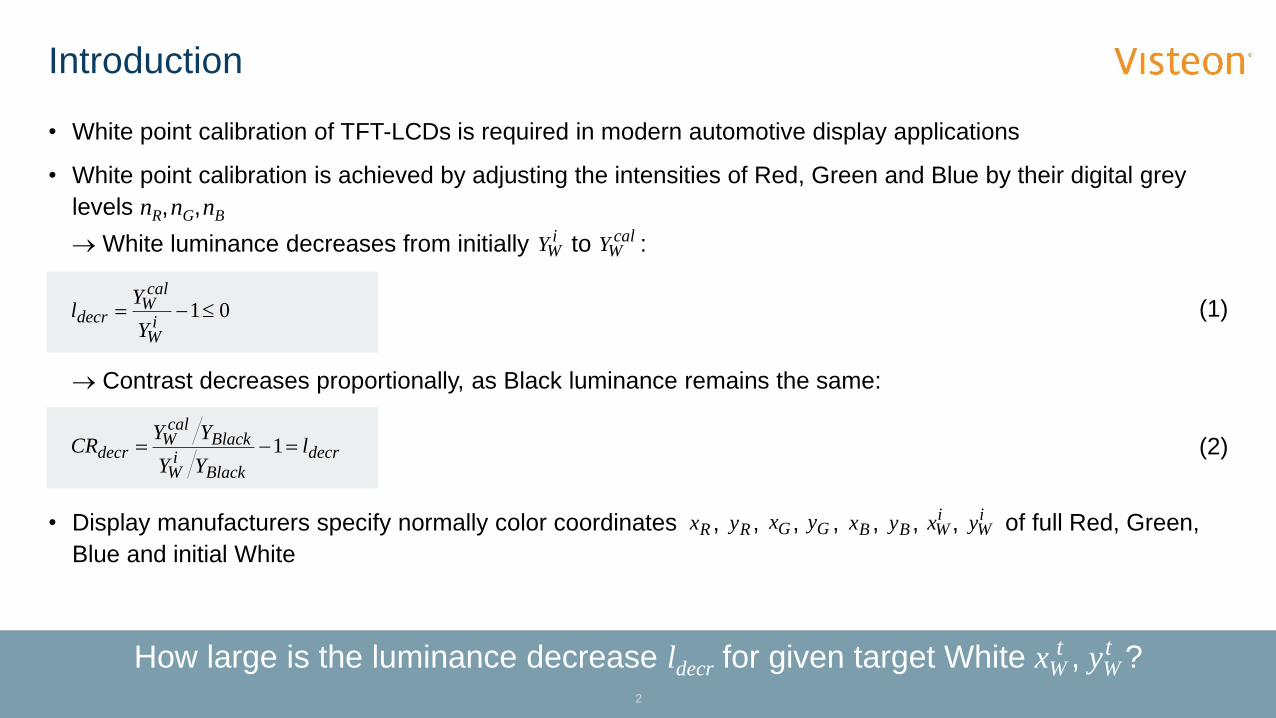
How large is the luminance decrease ldecr for given target White xW , yW ?
• White point calibration of TFT-LCDs is required in modern automotive display applications
• White point calibration is achieved by adjusting the intensities of Red, Green and Blue by their digital grey
levels nR,nG,nB
White luminance decreases from initially to :
Contrast decreases proportionally, as Black luminance remains the same:
• Display manufacturers specify normally color coordinates , , , , , , , of full Red, Green,
Blue and initial White
Introduction
01i
W
calW
decrY
Yl
Gx GyRx Ry Bx By iWx i
Wy
iWY cal
WY
2
t t
decr
Blacki
W
Blackcal
Wdecr l
YY
YYCR 1 (2)
(1)
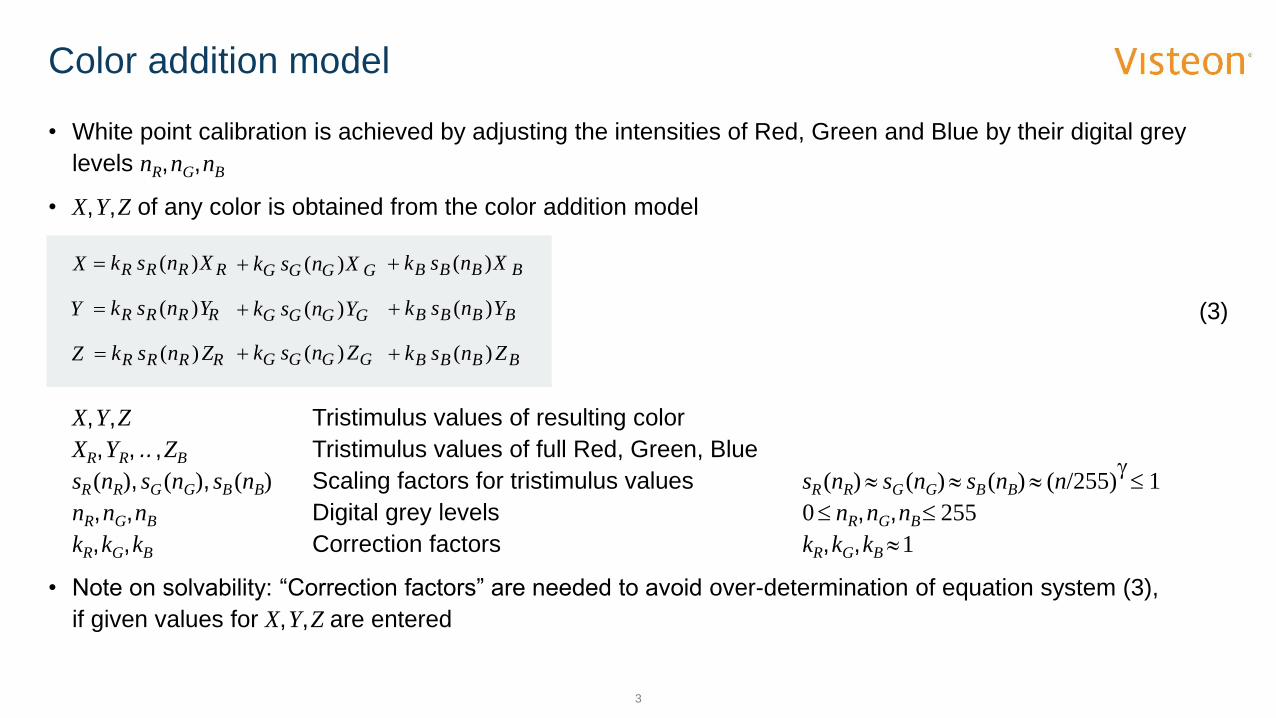
• White point calibration is achieved by adjusting the intensities of Red, Green and Blue by their digital grey
levels nR,nG,nB
• X,Y,Z of any color is obtained from the color addition model
X,Y,Z Tristimulus values of resulting color
XR,YR, .. ,ZB Tristimulus values of full Red, Green, Blue
sR(nR), sG(nG), sB(nB) Scaling factors for tristimulus values sR(nR) sG(nG) sB(nB) (n/255) 1
nR,nG,nB Digital grey levels 0 nR,nG,nB 255
kR,kG,kB Correction factors kR,kG,kB 1
• Note on solvability: “Correction factors” are needed to avoid over-determination of equation system (3),
if given values for X,Y,Z are entered
3
Color addition model
X RRRR Xnsk )( GGGG Xnsk )( BBBB Xnsk )(
Y RRRR Ynsk )( GGGG Ynsk )( BBBB Ynsk )(
Z RRRR Znsk )( GGGG Znsk )( BBBB Znsk )(
(3)
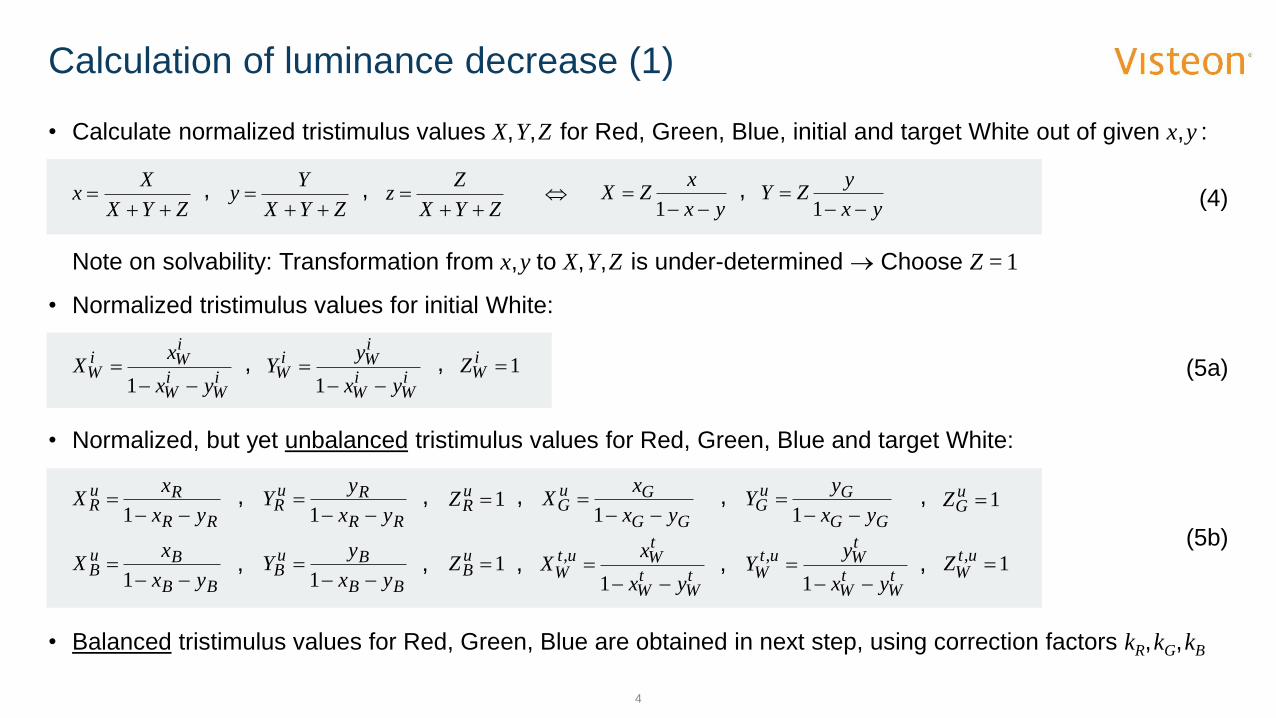
• Calculate normalized tristimulus values X,Y,Z for Red, Green, Blue, initial and target White out of given x,y :
Note on solvability: Transformation from x,y to X,Y,Z is under-determined Choose Z = 1
• Normalized tristimulus values for initial White:
• Normalized, but yet unbalanced tristimulus values for Red, Green, Blue and target White:
• Balanced tristimulus values for Red, Green, Blue are obtained in next step, using correction factors kR,kG,kB
4
Calculation of luminance decrease (1)
iW
iW
iWi
Wyx
xX
1 iW
iW
iWi
Wyx
yY
11i
WZ
RR
RuR
yx
xX
1 RR
RuR
yx
yY
1 GG
GuG
yx
xX
1 GG
GuG
yx
yY
1
BB
BuB
yx
xX
1 BB
BuB
yx
yY
1
ZYX
Xx
ZYX
Yy
ZYX
Zz
yx
xZX
1 yx
yZY
1, , ,
, ,
(4)
(5a)
(5b)
, , , , ,1uRZ 1u
GZ
, , , , ,1uBZ
tW
tW
tWut
Wyx
xX
1
,
tW
tW
tWut
Wyx
yY
1
, 1, utWZ
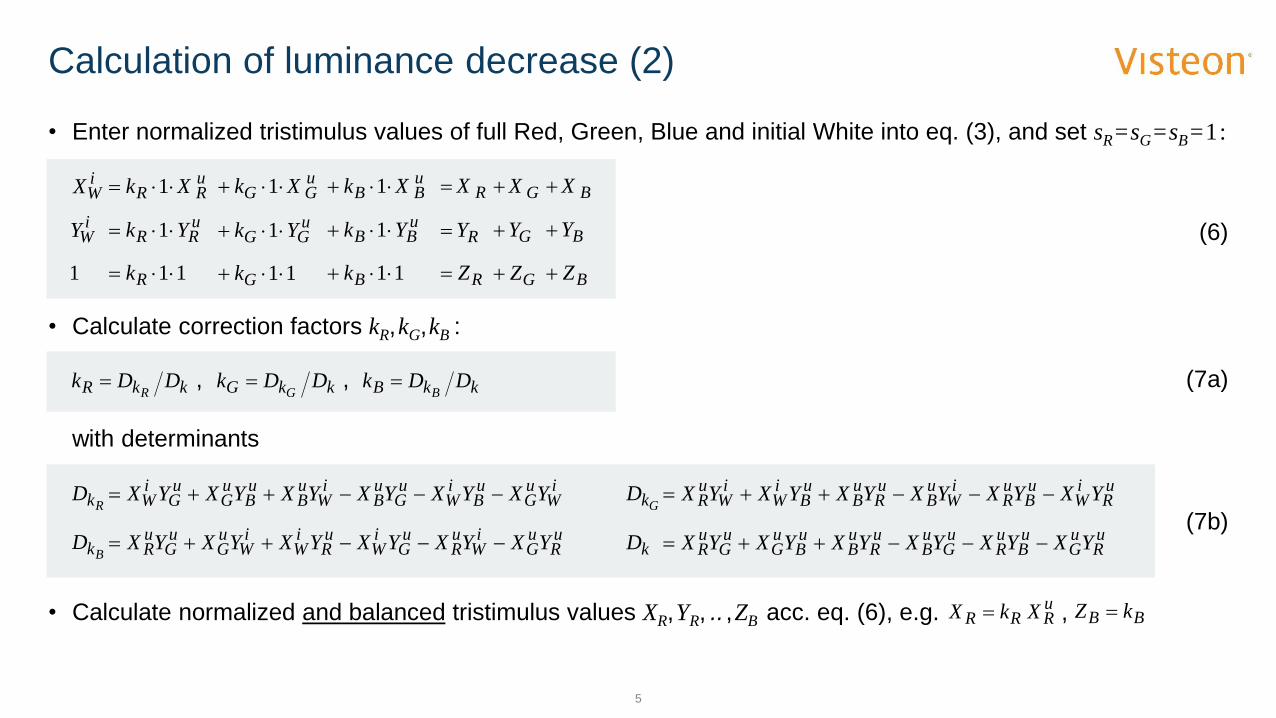
• Enter normalized tristimulus values of full Red, Green, Blue and initial White into eq. (3), and set sR=sG=sB=1:
• Calculate correction factors kR,kG,kB :
with determinants
• Calculate normalized and balanced tristimulus values XR,YR, .. ,ZB acc. eq. (6), e.g. ,
5
Calculation of luminance decrease (2)
kD
RkDGkD
BkD uR
uG
uB
uR
uG
uB
uR
uB
uB
uG
uG
uR YXYXYXYXYXYX
iW
uG
uB
iW
uG
uB
iW
uB
uB
uG
uG
iW YXYXYXYXYXYX u
RiW
uB
uR
iW
uB
uR
uB
uB
iW
iW
uR YXYXYXYXYXYX
uR
uG
iW
uR
uG
iW
uR
iW
iW
uG
uG
uR YXYXYXYXYXYX
kkR DDkR
(6)
kkG DDkG
kkB DDkB
uRRR XkX BB kZ
iWX
uRR Xk 1
uGG Xk 1 u
BB Xk 1 RX GX BX
iWY
uRR Yk 1 u
GG Yk 1uBB Yk 1 RY GY BY
1 11 Rk 11 Gk 11 Bk RZ GZ BZ
, ,
(7b)
(7a)
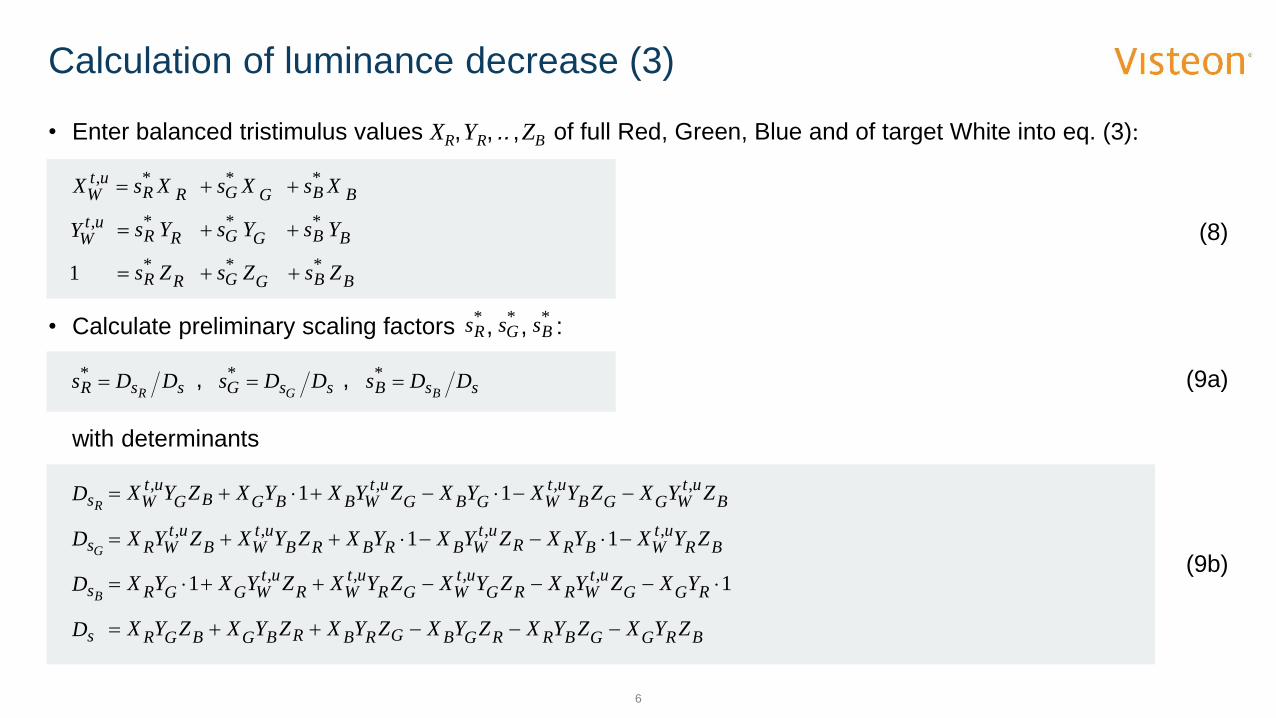
• Enter balanced tristimulus values XR,YR, ..,ZB of full Red, Green, Blue and of target White into eq. (3):
• Calculate preliminary scaling factors , , :
with determinants
6
Calculation of luminance decrease (3)
sD
RsD
GsD
BsD
BRGGBRRGBGRBRBGBGR ZYXZYXZYXZYXZYXZYX
But
WGGBut
WGBGut
WBBGBGut
W ZYXZYXYXZYXYXZYX ,,,, 11
BRut
WBRRut
WBRBRBut
WBut
WR ZYXYXZYXYXZYXZYX ,,,, 11
11 ,,,, RGGut
WRRGut
WGRut
WRut
WGGR YXZYXZYXZYXZYXYX
ssR DDsR
*
(8)
ssG DDsG
*ssB DDs
B*
utWX ,
RR Xs* GG Xs* BB Xs*
utWY ,
RR Ys* GG Ys* BB Ys*
1 RR Zs* GG Zs* BB Zs*
, ,
(9b)
(9a)
***BGR sss
Luminance decrease ldecr calculated out of x,y with normalized X,Y,Z values
Calculation of luminance decrease (4)
7
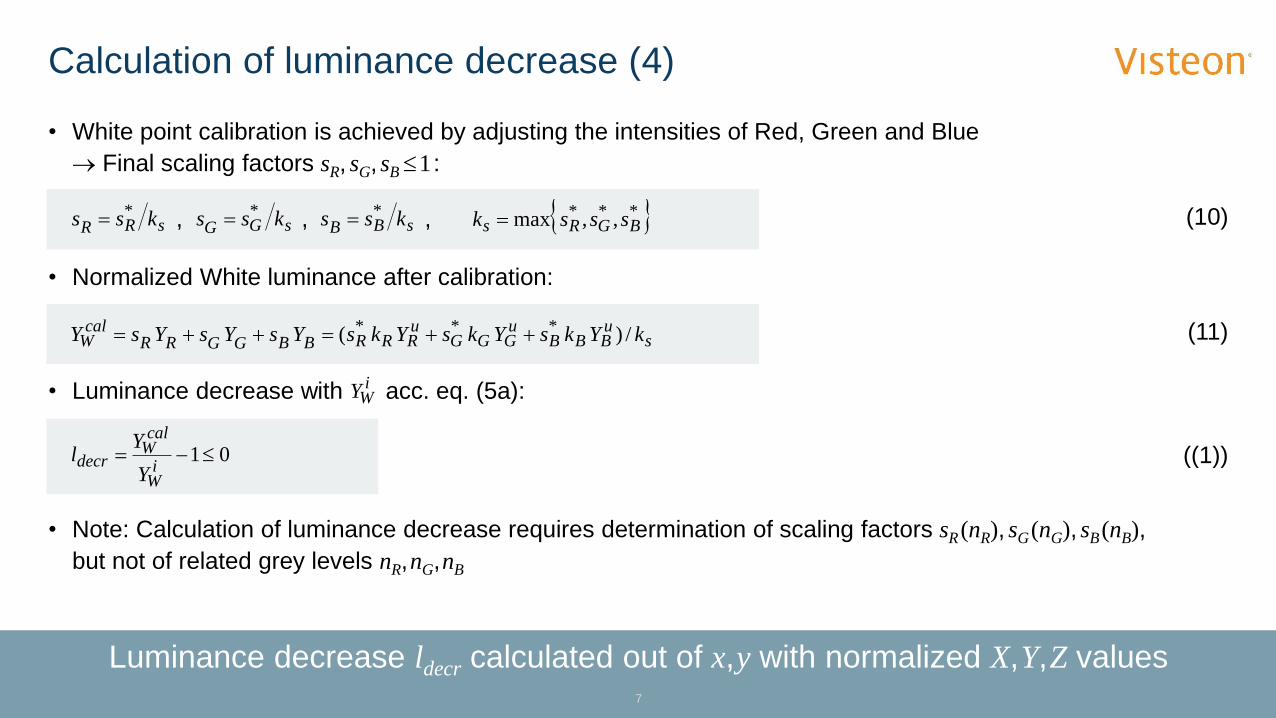
• White point calibration is achieved by adjusting the intensities of Red, Green and Blue
Final scaling factors sR, sG, sB 1 :
• Normalized White luminance after calibration:
• Luminance decrease with acc. eq. (5a):
• Note: Calculation of luminance decrease requires determination of scaling factors sR(nR), sG(nG), sB(nB),
but not of related grey levels nR,nG,nB
*** ,,max BGRs sssk sGG kss *sRR kss * sBB kss *, , (10)
suBBB
uGGG
uRRRBBGGRR
calW kYksYksYksYsYsYsY /)( *** (11)
01i
W
calW
decrY
Yl ((1))
iWY
,
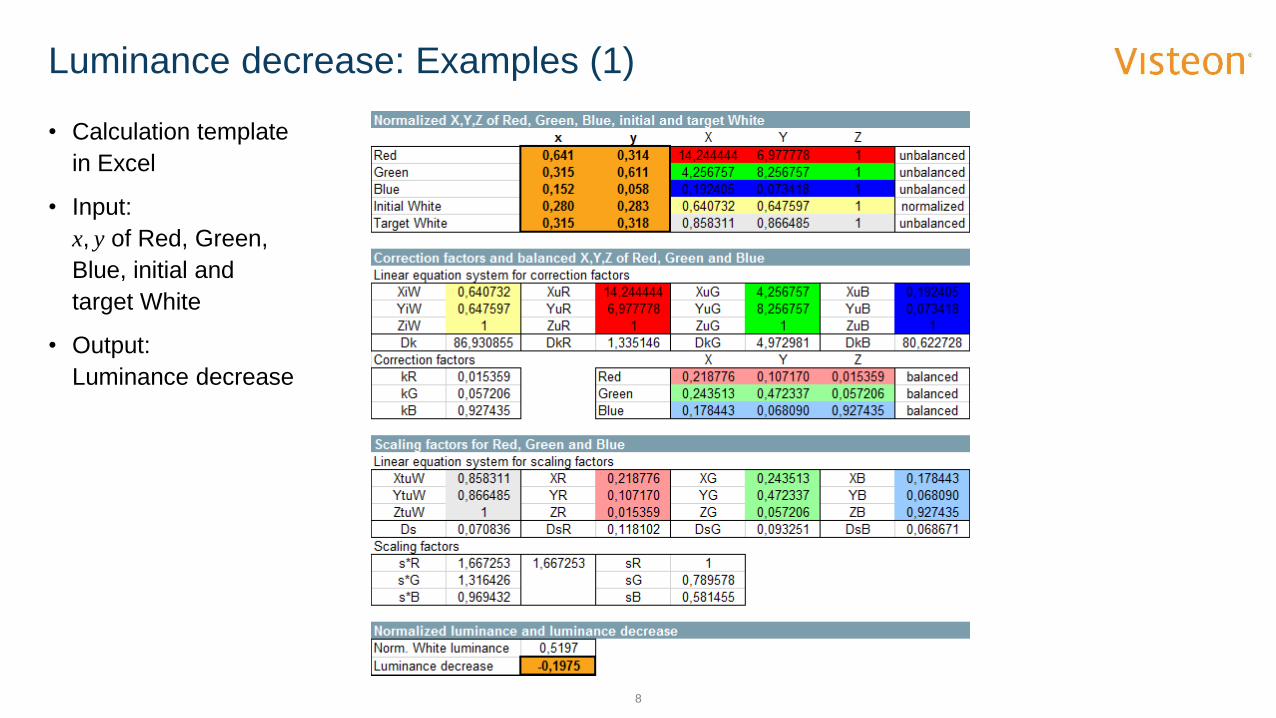
• Calculation template
in Excel
• Input:
x, y of Red, Green,
Blue, initial and
target White
• Output:
Luminance decrease
8
Luminance decrease: Examples (1)
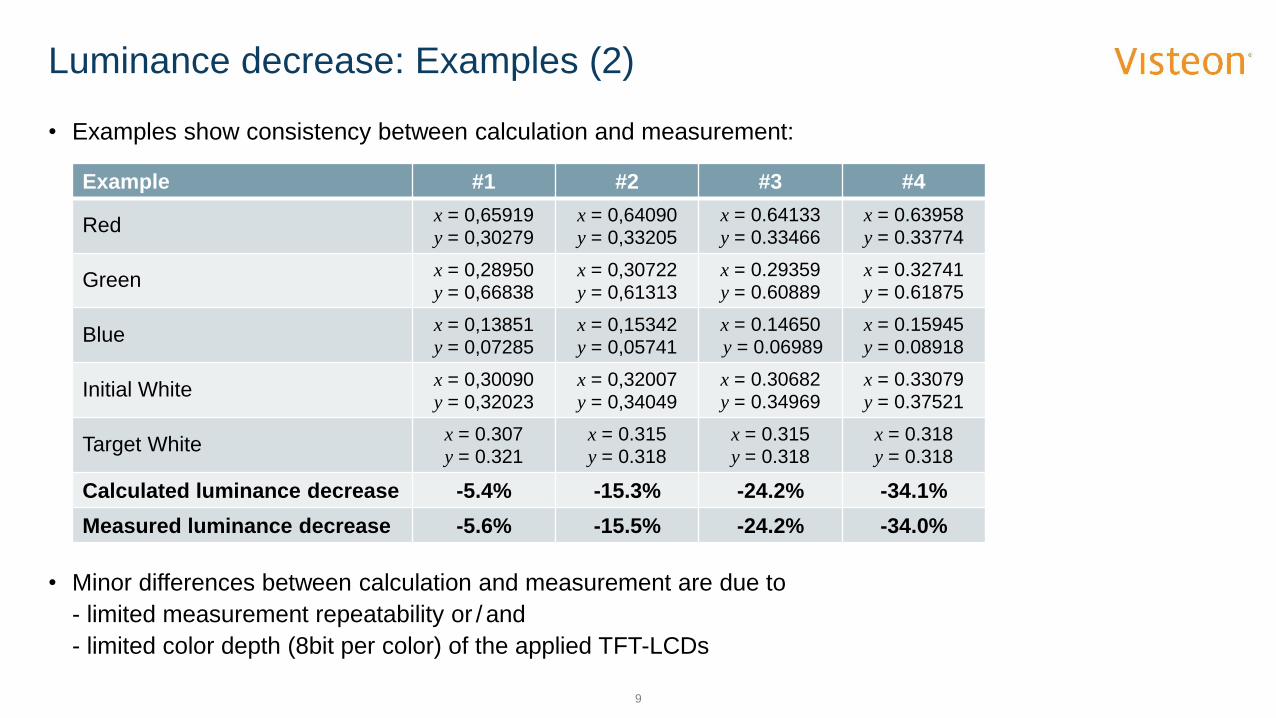
• Examples show consistency between calculation and measurement:
• Minor differences between calculation and measurement are due to
- limited measurement repeatability or / and
- limited color depth (8bit per color) of the applied TFT-LCDs
9
Luminance decrease: Examples (2)
Example #1 #2 #3 #4
Redx = 0,65919y = 0,30279
x = 0,64090y = 0,33205
x = 0.64133y = 0.33466
x = 0.63958y = 0.33774
Greenx = 0,28950y = 0,66838
x = 0,30722y = 0,61313
x = 0.29359y = 0.60889
x = 0.32741y = 0.61875
Bluex = 0,13851y = 0,07285
x = 0,15342y = 0,05741
x = 0.14650y = 0.06989
x = 0.15945y = 0.08918
Initial Whitex = 0,30090y = 0,32023
x = 0,32007y = 0,34049
x = 0.30682y = 0.34969
x = 0.33079y = 0.37521
Target Whitex = 0.307y = 0.321
x = 0.315y = 0.318
x = 0.315y = 0.318
x = 0.318y = 0.318
Calculated luminance decrease -5.4% -15.3% -24.2% -34.1%
Measured luminance decrease -5.6% -15.5% -24.2% -34.0%
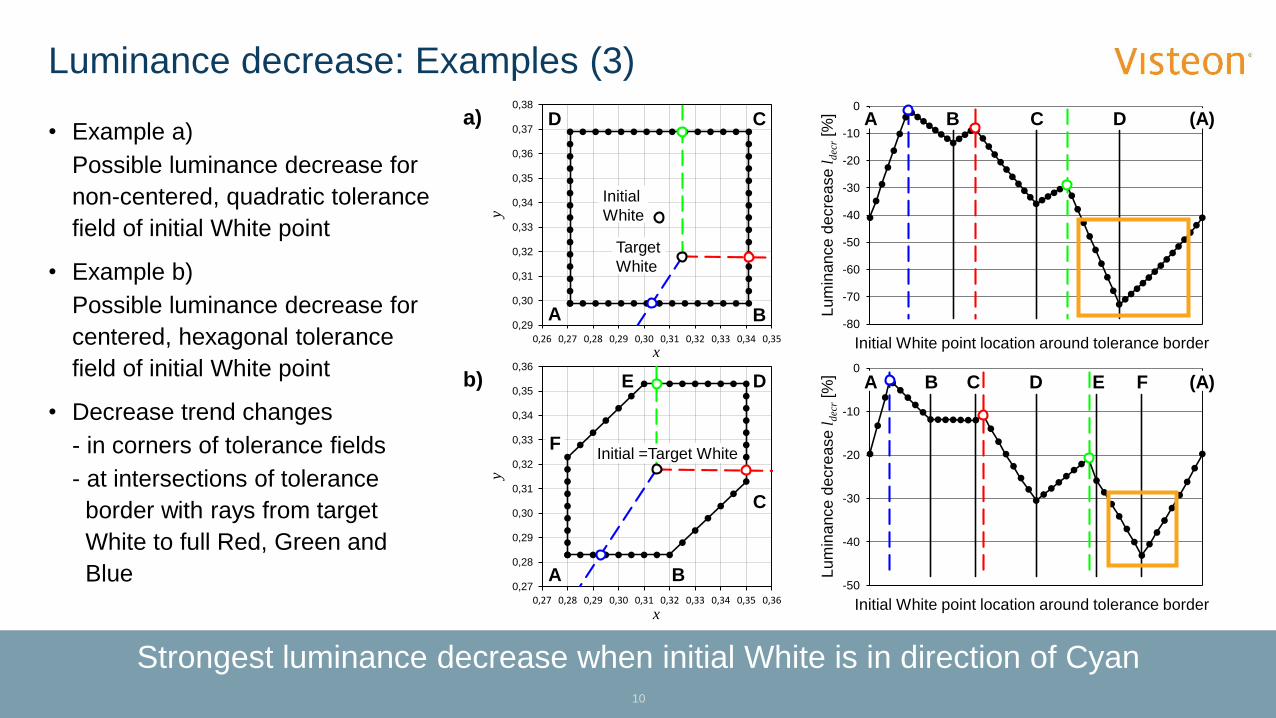
Strongest luminance decrease when initial White is in direction of Cyan
• Example a)
Possible luminance decrease for
non-centered, quadratic tolerance
field of initial White point
• Example b)
Possible luminance decrease for
centered, hexagonal tolerance
field of initial White point
• Decrease trend changes
- in corners of tolerance fields
- at intersections of tolerance
border with rays from target
White to full Red, Green and
Blue
Luminance decrease: Examples (3)
10
0,29
0,30
0,31
0,32
0,33
0,34
0,35
0,36
0,37
0,38
0,26 0,27 0,28 0,29 0,30 0,31 0,32 0,33 0,34 0,35
A B
CD
Initial
White
Target
White
x
y
a)
-80
-70
-60
-50
-40
-30
-20
-10
0
A B C D (A)
Lu
min
ance d
ecre
ase l
dec
r[%
]
Initial White point location around tolerance border
0,27
0,28
0,29
0,30
0,31
0,32
0,33
0,34
0,35
0,36
0,27 0,28 0,29 0,30 0,31 0,32 0,33 0,34 0,35 0,36
A B
C
DE
F
y
x
b)
-50
-40
-30
-20
-10
0
A B C D (A)E F
Lu
min
ance d
ecre
ase l
dec
r[%
]
Initial White point location around tolerance border
Initial =Target White
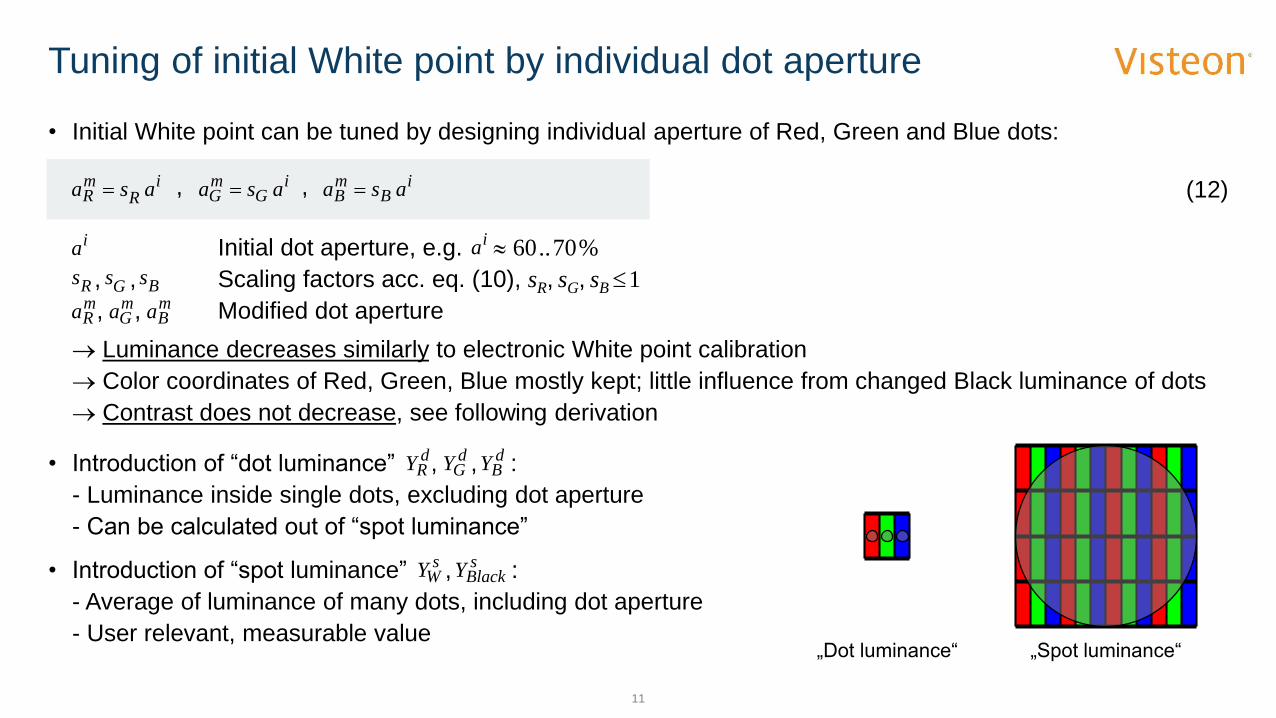
• Initial White point can be tuned by designing individual aperture of Red, Green and Blue dots:
Initial dot aperture, e.g. 60..70%
, , Scaling factors acc. eq. (10), sR, sG, sB 1
, , Modified dot aperture
Luminance decreases similarly to electronic White point calibration
Color coordinates of Red, Green, Blue mostly kept; little influence from changed Black luminance of dots
Contrast does not decrease, see following derivation
• Introduction of “dot luminance” , , :
- Luminance inside single dots, excluding dot aperture
- Can be calculated out of “spot luminance”
• Introduction of “spot luminance” , :
- Average of luminance of many dots, including dot aperture
- User relevant, measurable value
11
Tuning of initial White point by individual dot aperture
iG
mG asa i
RmR asa i
BmB asa , , (12)
ia
mB
mG
mR aaa
BGR sss
„Dot luminance“ „Spot luminance“
ia
dB
dG
dR YYY
sBlack
sW YY
Tuning of dot aperture decreases luminance, but preserves contrast
Luminance and contrast for individual dot aperture
12
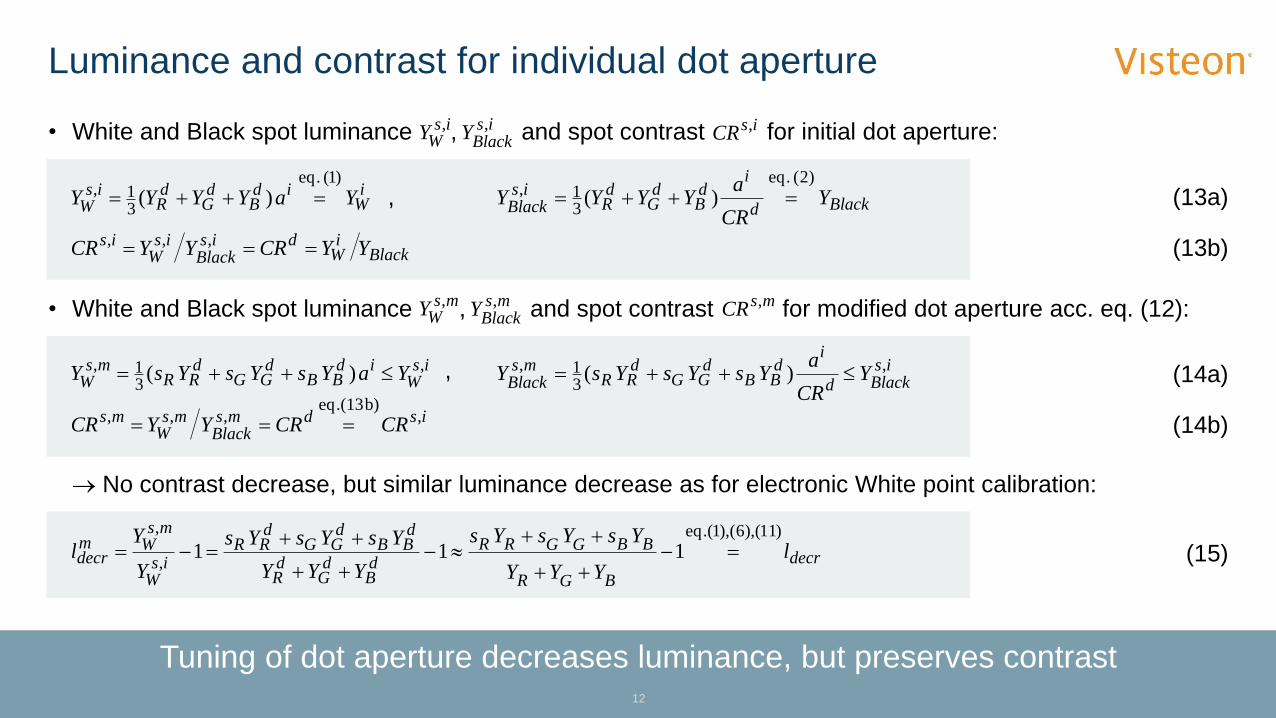
• White and Black spot luminance , and spot contrast for initial dot aperture:
• White and Black spot luminance , and spot contrast for modified dot aperture acc. eq. (12):
No contrast decrease, but similar luminance decrease as for electronic White point calibration:
(13a)iW
idB
dG
dR
isW YaYYYY
)1(.eq
31, )( Blackd
idB
dG
dR
isBlack Y
CR
aYYYY
)2(.eq
31, )(
Blacki
Wdis
Blackis
Wis YYCRYYCR ,,, (13b)
,
isWY , is
BlackY , isCR ,
msWY , ms
BlackY , msCR ,
isW
idBB
dGG
dRR
msW YaYsYsYsY ,
31, )( is
Blackd
idBB
dGG
dRR
msBlack Y
CR
aYsYsYsY ,
31, )( (14a)
(14b)isdmsBlack
msW
ms CRCRYYCR ,b).(13eq
,,,
,
decr
BGR
BBGGRRdB
dG
dR
dBB
dGG
dRR
isW
msWm
decr lYYY
YsYsYs
YYY
YsYsYs
Y
Yl
)11(),6(),1.(eq
,
,
111
(15)
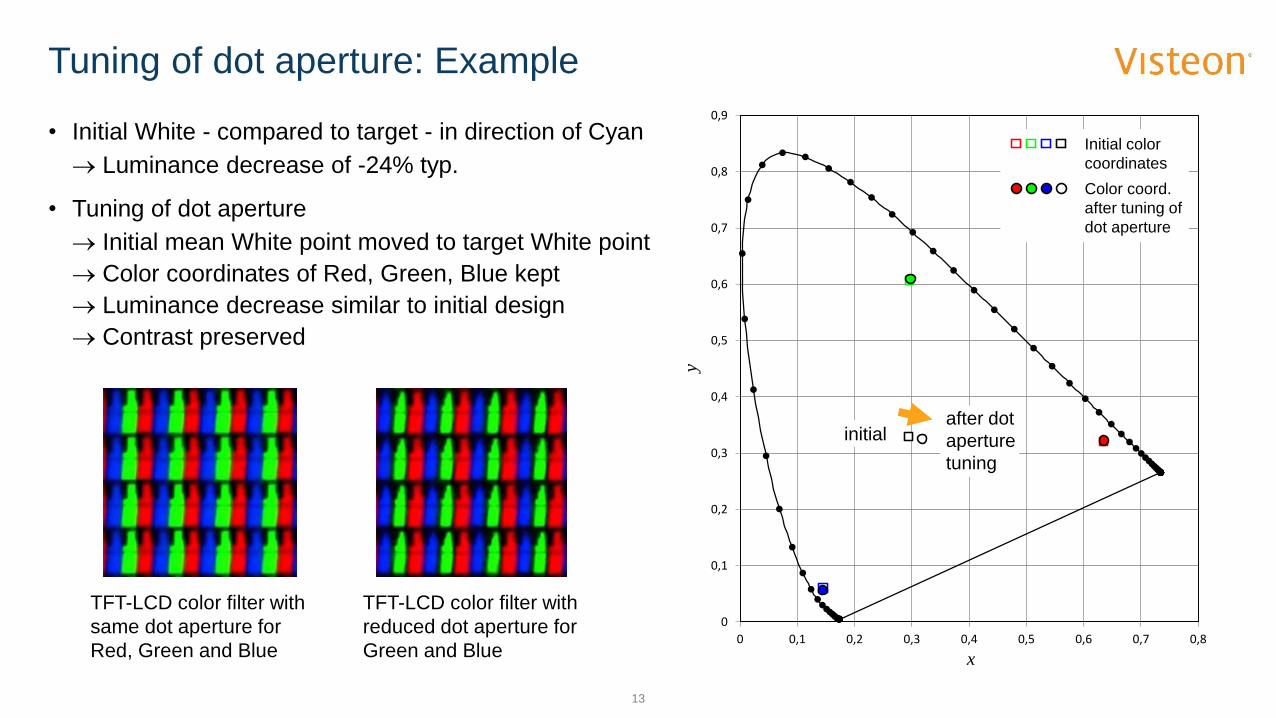
• Initial White - compared to target - in direction of Cyan
Luminance decrease of -24% typ.
• Tuning of dot aperture
Initial mean White point moved to target White point
Color coordinates of Red, Green, Blue kept
Luminance decrease similar to initial design
Contrast preserved
13
Tuning of dot aperture: Example
TFT-LCD color filter with
same dot aperture for
Red, Green and Blue
TFT-LCD color filter with
reduced dot aperture for
Green and Blue
0
0,1
0,2
0,3
0,4
0,5
0,6
0,7
0,8
0,9
0 0,1 0,2 0,3 0,4 0,5 0,6 0,7 0,8
x
y
Initial color
coordinates
Color coord.
after tuning of
dot aperture
after dot
aperture
tuning
initial
• White point calibration can decrease White luminance and contrast significantly
Product capability for luminance and contrast might be seriously affected
• Luminance and contrast decrease calculated out of given color coordinates x, y
Consistency with measurements demonstrated
Strongest luminance decrease when initial White point is in direction of Cyan
• Tuning of dot aperture
Sets initial mean White point to a defined target
Keeps mostly the color coordinates of Red, Green and Blue
Decreases White luminance similarly to the electronic White point calibration
Preserves contrast
14
Summary


![BLIND IMAGE QUALITY ASSESSMENT WITH LOCAL CONTRAST … · Based on the luminance, contrast and structure of an image, the Structural Similarity Index Measure (SSIM) [3] is developed](https://img.pdfslide.us/doc/110x75/606a2fd01b32974f30711f71/blind-image-quality-assessment-with-local-contrast-based-on-the-luminance-contrast.jpg)