Embed Size (px)
Citation preview
Aalto University School of Science and Technology Department of Electronics, Lighting Unit Espoo 2010 Report 56
DEVELOPMENT AND ENHANCEMENT OF ROAD LIGHTING PRINCIPLES Aleksanteri Ekrias Dissertation for the degree of Doctor of Science in Technology to be presented with due permission of the Faculty of Electronics, Communications and Automation for public examination and debate in Auditorium S4 at Aalto University School of Science and Technology (Espoo, Finland) on the 4th of June, 2010, at 12 noon. Aalto University School of Science and Technology Faculty of Electronics, Communications and Automation Department of Electronics, Lighting Unit
Distribution: Aalto University School of Science and Technology Department of Electronics Lighting Unit P.O. Box 13340 00076 Aalto http://www.ele.tkk.fi http://www.lightinglab.fi Tel. +358 50 3160999 Fax +358 9 4514982 E-mail: [email protected] © Aleksanteri Ekrias and Aalto University School of Science and Technology ISBN 978-952-60-3082-1 ISBN 978-952-60-3083-8 (pdf) ISSN 1797-4178 ISSN 1797-4186 (pdf) Multiprint Oy Espoo 2010
3
ABSTRACT OF DOCTORAL DISSERTATION
AALTO UNIVERSITY SCHOOL OF SCIENCE AND TECHNOLOGY P.O. BOX 11000, 00076 Aalto http://www.tkk.fi
Author Aleksanteri Ekrias
Name of the dissertation Development and enhancement of road lighting principles
Manuscript submitted 28.9.2009 Manuscript revised 18.2.2010
Date of the defence 4.6.2010
Monograph Article dissertation (summary + original articles)
Faculty Electronics, Communications and Automation
Department Electronics
Field of research Illuminating Engineering
Opponent(s) Prof. Georges Zissis
Supervisor Prof. Liisa Halonen
Instructor Dr. Marjukka Eloholma
Abstract
The work starts with a short introduction concerning the history of road lighting, outlining the trends and changes that have taken place in road lighting research during the past century. The introduction is followed by a review of trends, directions, and problems in current road lighting research and practice. The following part of the work introduces an advanced approach to road lighting measurements and calculations, based on the use of an imaging luminance photometer and the Road LumiMeter v2.0 computer program. The work sets out to investigate the variations in the characteristics of the quality of the road lighting at the same pilot locations in relation to the calculation methods used. In the work mesopic visual performance and the effects of the spectral transmittance of the vehicle windshield on the visibility conditions of the driver are also analysed.
The work continues with road lighting measurements in various weather conditions in order to study the effects of snowy and wet road surface conditions on road lighting luminances. The results show that in Finland, snowy conditions offer very good opportunities to save electricity without adversely affecting either the safety of driving or the quality of road lighting. The following measurements set out to investigate the contribution of halogen and high-intensity discharge headlights to road lighting and whether this has a conflicting effect on the luminance contrasts of various targets located on the road or at the side of the road. The results indicate that, in general, the use of vehicle headlights in the presence of road lighting reduces the luminance contrasts of targets.
The work continues with road lighting visibility experiments which study the visibility of achromatic and coloured targets in MH lamp and HPS lamp installations. The results show that colours have a major effect on target visibility if the road is illuminated with a light source with adequate colour rendering properties. Finally, pavement sample measurements are made to study the effects of aggregate lightness and aggregate colour on the reflectance properties of pavements. HPS lamps are found to be more effective than MH lamps in terms of light reflected from pavements.
Keywords Road lighting, measurements and calculations, imaging luminance photometer, weather conditions, vehicle headlights, colour contrast, pavement materials
ISBN (printed) 978-952-60-3082-1 ISSN (printed) 1797-4178
ISBN (pdf) 978-952-60-3083-8 ISSN (pdf) 1797-4186
Language English (U.K.) Number of pages 66 p. + app. 142 p.
Publisher Department of Electronics, Aalto University School of Science and Technology
Print distribution Department of Electronics, Aalto University School of Science and Technology
The dissertation can be read at http://lib.tkk.fi/Diss/

4
Preface The work presented in this thesis was conducted at the Lighting Unit of Aalto University School of Science and Technology. Part of the work was carried out in the national project “ValOT” funded by the Finnish Funding Agency for Technology and Innovation, the Finnish Road Administration, Philips Oy, Silux Oy, Tepcomp Oy, Osram Oy, Helsingin Energia, the City of Vantaa, the City of Espoo, the City of Tampere, Oy Turku Energia - Åbo Energi Ab, Lemminkäinen Oy, Suomen Energiaurakointi Oy, and Destia. It would not have been possible to write this doctoral thesis without the help and support of the kind people around me, to only some of whom it is possible to give a particular mention here. I gratefully thank my supervisor, Professor Liisa Halonen, for believing in me and for her encouragement and supportive attitude towards my work. I am also deeply grateful to my instructor, Dr. Marjukka Eloholma, for all her help and priceless guidance during the production of the thesis. I wish to express my thanks to my former colleagues Esa Kurhinen, Jaakko Ketomäki, Leena Väisänen, and Anne Ylinen for giving their time and help whenever needed. My special thanks go to Jorma Lehtovaara for our joyful discussions and his always useful advice. I also thank the whole of the staff of the Lighting Unit for their help. I would like to thank Dr. Per Ole Wanvik and Professor Sermin Onaygil for their valuable comments during the preliminary examination process of the thesis. I also acknowledge the Technological Foundation of Finland, Finnish Cultural Foundation, Ulla Tuominen Foundation, Fortum Foundation, and Henry Ford Foundation for supporting this work. Last but not least, I want to acknowledge the role my family and friends played in my doctoral work. Thanks to my parents, Viktor and Valentina, for providing me with the genes for handling the demands of a D.Sc. Thanks also go to my parents-in-law Markku and Satu for always being so kind and supportive. Thanks to my younger brother Pavel and to all my friends, for being patient when I was “too” busy. This, I believe, is one of the keys to getting through a D.Sc. programme – having good friends to have fun with and complain to. My deepest and warmest thanks go to my lovely wife Niina, for standing by me in the toughest of times, for laughing at my jokes and for being a wonderful mother and wife. Finally, I would like to dedicate this work to my children Sofia and Samuel, who bring joy and light into my life. Espoo, February 2010 Aleksanteri Ekrias
5
List of publications
I A. Ekrias, M. Eloholma, L. Halonen, “An advanced approach to road lighting
design, measurements and calculations,” Lighting Unit, Department of Electronics, Helsinki University of Technology, Espoo, Finland, Report 53, 2008.
II A. Ekrias, M. Eloholma, L. Halonen, X. Song, X. Zhang, Y. Wen, “Road lighting
and headlights: luminance measurements and automobile lighting simulations,” Building and Environment, vol. 43, pp. 530-536, 2008.
III A. Ekrias, M. Eloholma, L. Halonen, “Analysis of road lighting quantity and
quality in varying weather conditions,” Leukos, vol. 4, pp. 89-98, 2007. IV A. Ekrias, L. Guo, M. Eloholma, L. Halonen, “Intelligent road lighting control in
varying weather conditions,” Light & Engineering, vol. 16, pp. 72-78, 2008. V A. Ekrias, M. Eloholma, L. Halonen, “The contribution of vehicle headlights to
visibility of targets in road lighting environments,” International Review of Electrical Engineering (I.R.E.E.), vol. 3, pp. 208-217, 2008.
VI A. Ekrias, M. Eloholma, L. Halonen, “Effects of vehicle headlights on target
contrast in road lighting environments,” Journal of Light & Visual Environment, vol. 32, pp. 302-314, 2008.
VII A. Ekrias, M. Eloholma, L. Halonen, “The effects of colour contrast and
pavement aggregate type on road lighting performance,” Light & Engineering, vol. 17, pp. 76-91, 2009.
VIII A. Ekrias, A. Ylinen, M. Eloholma, L. Halonen, “Effects of pavement lightness
and colour on road lighting performance,” in Proceedings of the CIE International Symposium on Road Surface Photometric Characteristics – Torino, Italy, 2008.
The author played an active role in all the stages of the work reported in the publications. He was responsible for publications [I], [II], [III], [IV], [V], [VI], [VII], and [VIII] as the main author. The author also developed and designed version 2.0 of the Road LumiMeter program. In version 2.0 several different road lighting criteria and other custom methods were added to the program and some major improvements were made. The Road LumiMeter v2.0 program was used for the calculations made in publication [I].
6
Contents
Abstract ................................................................................................................................ 3
Preface .................................................................................................................................. 4
List of publications .............................................................................................................. 5
Contents ................................................................................................................................ 6
List of abbreviations and symbols ...................................................................................... 8
1 Introduction ................................................................................................................ 9 1.1 Background ......................................................................................................... 9 1.2 Aim of the work ................................................................................................ 11
2 State of the art .......................................................................................................... 12 2.1 Road lighting measurements and calculations .................................................. 12 2.2 Road lighting control and weather conditions .................................................. 13 2.3 The contribution of vehicle headlights to road lighting.................................... 13 2.4 Luminous and colour contrast........................................................................... 14 2.5 Reflection properties of road surfaces .............................................................. 14
3 Advanced approach to road lighting measurements and calculations and drivers' visual performance .................................................................................... 16 3.1 Road lighting measurements with an imaging luminance photometer ............. 16 3.2 Road lighting measurements and calculations using various road lighting
criteria ............................................................................................................... 18 3.2.1 Case studies.............................................................................................. 18 3.2.2 Results ..................................................................................................... 20 3.2.3 Discussion ............................................................................................... 22
3.3 Mesopic visual performance ............................................................................. 24 3.4 Spectral transmittance of vehicle windshields .................................................. 25 3.5 Conclusions ....................................................................................................... 27
4 Analysis of road lighting quantity and quality in varying weather conditions .. 28 4.1 Experimental set-up .......................................................................................... 28 4.2 Results of road surface luminance measurements ........................................... 28 4.3 Intelligent road lighting control in varying weather conditions ....................... 30 4.4 Conclusions ....................................................................................................... 31
5 Effects of vehicle headlights on target contrast in road lighting environments 32 5.1 Measurement set-up and equipment ................................................................. 32 5.2 The contribution of vehicle headlights to road lighting.................................... 34
5.2.1 Study I ...................................................................................................... 34 5.2.2 Study II .................................................................................................... 35 5.2.3 Study III ................................................................................................... 37 5.2.4 Study IV ................................................................................................... 38 5.2.5 Study V .................................................................................................... 39 5.2.6 Study VI ................................................................................................... 40 5.2.7 Study VII .................................................................................................. 41
5.3 Conclusions ....................................................................................................... 42
7
6 Visibility experiments with achromatic and coloured targets under MH lamp and HPS lamp illumination ..................................................................................... 43 6.1 Experimental set-up .......................................................................................... 43 6.2 Results ............................................................................................................... 45
6.2.1 Metal halide lamp installation .................................................................. 46 6.2.2 High pressure sodium lamp installation ................................................... 48
6.3 Conclusions ....................................................................................................... 50
7 Effects of pavement lightness and colour on road lighting performance ............ 51 7.1 Experimental set-up .......................................................................................... 51 7.2 Measurement results .......................................................................................... 52 7.3 Conclusions ....................................................................................................... 56
8 Conclusions ................................................................................................................ 58
References ........................................................................................................................... 62
8
List of abbreviations and symbols
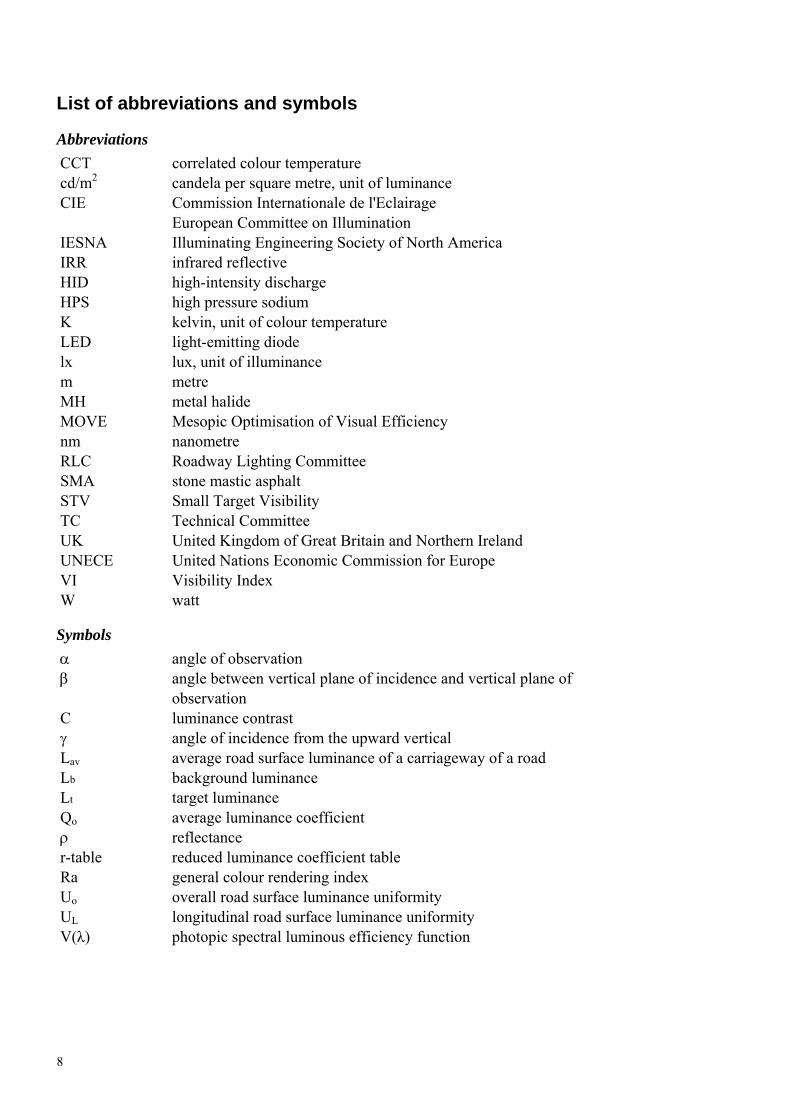
Abbreviations
CCT correlated colour temperature cd/m2 candela per square metre, unit of luminance CIE Commission Internationale de l'Eclairage European Committee on Illumination IESNA Illuminating Engineering Society of North America IRR infrared reflective HID high-intensity discharge HPS high pressure sodium K kelvin, unit of colour temperature LED light-emitting diode lx lux, unit of illuminance m metre MH metal halide MOVE Mesopic Optimisation of Visual Efficiency nm nanometre RLC Roadway Lighting Committee SMA stone mastic asphalt STV Small Target Visibility TC Technical Committee UK United Kingdom of Great Britain and Northern Ireland UNECE United Nations Economic Commission for Europe VI Visibility Index W watt
Symbols angle of observation angle between vertical plane of incidence and vertical plane of observation C luminance contrast angle of incidence from the upward vertical Lav average road surface luminance of a carriageway of a road Lb background luminance Lt target luminance Qo average luminance coefficient reflectance r-table reduced luminance coefficient table Ra general colour rendering index Uo overall road surface luminance uniformity UL longitudinal road surface luminance uniformity V(λ) photopic spectral luminous efficiency function
9
1 Introduction
1.1 Background
Historically, two complementary measures of road lighting system performance have been employed: illuminance, i.e. the amount of light from luminaires incident upon a given surface of interest, and luminance, i.e. the amount of reflected light returned to the driver’s eye from the surface of interest. Before about 1940, road lighting design criteria were based mainly upon lighting levels expressed in terms of illuminance units. Around 1940 design principles of photometry and geometry were followed by principles based on physiology. The design of road lighting installations was shifted towards the inclusion of visible quantities: target luminance, road surface luminance, road surface luminance uniformities, and glare [1]. There have been a lot of studies and research looking into the basic concepts of vision in road lighting; probably the most comprehensive work was by Waldram [2], by Weston [3], and by Blackwell [4]. The work of Waldram defined the “silhouette principle” of road lighting: most targets on illuminated roads are seen as dark silhouettes against the bright road surface. The work of Blackwell and Weston studied visual performance and discovered that the ability to perform a given visual task was based on target size, target luminance, and the luminance contrast of the target relative to its background. These basic ideas of visual performance were the key to the development of the luminance concept of road lighting which is still used today [5, 6]. Early experiments in road lighting (1940s and 1950s) used Landolt rings and various other stationary targets placed along the road surface as visual targets to evaluate the quality of the road lighting [7, 8]. After various different visual tasks had been tried out, the one adopted most widely by the road lighting research communities was a square target 20 cm x 20 cm, with a contrast of C = 0.33 with respect to the road surface, and placed on the road 100 m in front of the driver. This visual task was used in the development of recommendations for the current road lighting levels [6]. After the Second World War road lighting research no longer concentrated only on the visibility of targets on illuminated roads, but started also to include visual comfort aspects. In the 1950s and 1960s, de Boer was one of the first researchers to add visual comfort to the pure visibility aspect of road lighting [7]. This was considered to be important in view of the fact that high-speed road users preferred relatively comfortable motorways for relatively long drives. But it was also important because of traffic composition and density, which were already changing dramatically at that time [5]. In the 1960s, increases in the severity and frequency of traffic accidents led to interest in the statistical analysis of accident data. A lot of studies were conducted to find correlations between the number of accidents and road lighting quality. In the UK, in the late 1970s Green and Hargroves carried out a comprehensive study of the effects of lighting on traffic
10
accidents [9]. In the study, all the then-known road lighting quality parameters were taken into account. The parameter showing the strongest relationship with the night-time accident ratio was the average road surface luminance. [5] Studies have shown that, in general, the construction of the road lighting is found to reduce night-time accidents by 20...40%. The mean accident-reducing effect in darkness is found to be about 30% for all injury accidents, 60% for all fatal accidents, 45% for pedestrian accidents, 35% for injury accidents at rural junctions, and 50% for injury accidents on motorways. The accident-reducing effect of road lighting has been found to be significantly lower during snowy and rainy weather conditions compared to dry weather conditions. [10] Despite the significant effect of road lighting on traffic safety, the accident studies never played a deciding role in describing the quality parameters of road lighting (lighting level, luminance uniformities, disability glare), because of the weak correlation between changes in road lighting quality parameter values and accident rates. However, these studies played a role in decisions on whether or not to illuminate particular roads. In this context a comprehensive analysis of 62 studies from 15 countries published by CIE in 1992 [11] has much relevance for whether or not to illuminate roads today. In the 1970s, road lighting studies concentrated on the opportunities for anticipation of vehicle drivers. As a consequence, a more or less structural analysis of the task of driving began to play an important role in the road lighting research field. It was no longer sufficient to study only the visibility of targets located 100 m in front of the driver in the middle of a straight and more or less empty road. [5] In the 1970s Gallagher defined a measure for supra-threshold visibility, called the visibility index (VI), which can be defined from the lighting installation’s photometric data [12]. Since Gallagher’s introduction of the visibility index, many other researchers, especially in North America, have refined the concept. In the last 40 years a big effort has been made to add the visual performance of the critical targets on the road in road lighting design, in order to provide more suitable solutions for real visibility conditions on the road. As a result the Small Target Visibility (STV) concept was introduced in the American National Standard Practice for Roadway Lighting RP-8-00 [13] as one of the three criteria for designing continuous lighting systems for roads. However, in August 2006, the Roadway Lighting Committee (RLC) of the IESNA passed a motion to revise RP-8 by withdrawing the use of STV as a design metric. The decision was initiated on the basis of the continuing difficulty of correlating safety with the STV metric [5]. Until the late 1970s, road lighting was seen mostly in the context of motorised traffic. However, since the late 1970s, systematic approaches have been made to the lighting of streets and reduction of night-time crime. One of the first systematic studies of the needs of residential areas and pedestrians, with an emphasis on personal security, was carried out by
11
Caminada and van Bommel in 1980 [14]. The most important finding of the study was that semicylindrical illuminance was the measure best suited for use in achieving a specified recognition distance in residential areas [5]. Finally, in the 1990s, increases in traffic congestion directed the research towards an evaluation of how road lighting could facilitate traffic flow [5]. The current principles of road lighting design, measurements, and calculations are based to a great extent on knowledge, research, experience, and consensus among experts in international lighting communities. These principles are well established and have been adopted in a number of lighting design standards, reports, and recommendations. However, there are new trends and directions in road lighting research and practice, which offer new opportunities to develop and optimise road lighting principles. Recent developments of light sources, new equipment for road lighting measurements and road lighting control systems, as well as the development of mesopic photometry, are affecting the further development of road lighting. Directive No 2006/32/EC [15] of the European Parliament regarding energy efficiency amongst end users and energy suppliers, as well as Commission Regulation (EC) No. 245/2009 [16] of the Commission of the European Communities regarding lamp efficacy in public lighting, also have an important role in defining in which direction road lighting will change in the future.
1.2 Aim of the work
The overall aim of the work was to take road lighting development a few steps further by investigating the current basis of road lighting. The work consisted of several topics, which were; road lighting measurements and calculations, the spectral transmittance of vehicle windshields, road lighting luminances in different weather conditions, the contribution of vehicle headlights to road lighting, the reflection properties of road surfaces, and the effects of luminous and colour contrasts on target visibility. The topics under study were selected on the basis of the new trends and directions in road lighting research and practice. One objective of this work was to introduce an advanced approach to road lighting calculations and measurements based on the use of an imaging luminance photometer and a computer program, Road LumiMeter v2.0. Road lighting measurements were made in various weather conditions to study the effects of snowy and wet road surface conditions on road lighting performance. Road lighting and vehicle headlight measurements were made to investigate the use of road lighting and dipped vehicle headlights at the same time and whether this had a conflicting effect on the luminance contrasts of various targets located on the road or at the side of the road. Road lighting visibility experiments were made to study the visibility of achromatic and coloured targets in metal halide (MH) lamp and high pressure sodium (HPS) lamp installations. Finally, pavement sample measurements were made to study the effects of aggregate lightness and aggregate colour on the reflectance properties of pavements.
12
2 State of the art At present, the most common light source used in road lighting applications is HPS lamps. The use of MH lamps in outdoor lighting applications is becoming more common, and nowadays MH lamps are considered to be an alternative solution when good colour rendering properties are required. Because of the fast development of LEDs, these can also be considered to be a potential light source for outdoor lighting applications, especially in the near future. HPS lamps offer more economical (lamp cost, longer rated lamp life) and usually also more efficient (higher luminous efficacy, lower lumen depreciation) lighting solutions than MH lamps. The advantages of MH lamps, as well as other white light sources, are, however, their more natural and pleasant colour temperature and significantly better colour rendering properties compared to HPS lamps, as a result of their significantly different spectral power distributions. The advantages of white light have recently started to play a more important role in the outdoor lighting field because of the development of white light sources and mesopic photometry. A lot of research activity has been carried out in order to find out the real benefits of the usage of white light in outdoor lighting environments, and solutions to the problem of when and where to use white light instead of the conventionally used HPS lamp illumination. As well as the development of new lighting sources, the fast development of technology has also created new possibilities for the enhancement and optimisation of road lighting. The imaging luminance meter technique, more advanced computer programs, and new road lighting control systems are becoming more important as tools in the development and optimisation of road lighting practice.
2.1 Road lighting measurements and calculations
At present, road lighting design, calculations, and measurements in Europe follow the European standards EN 13201:2-4 [17-19]. The European standard EN 13201-2 introduces the ME/MEW series of lighting classes for motorised traffic. The ME/MEW classes are based on quality characteristics such as average road surface luminance, overall and longitudinal road surface luminance uniformities, disability glare, and surround ratio. The EN 13201-3 standard defines and describes the conventions and mathematical procedures to be adopted in calculating the photometric performance of road lighting installations designed in accordance with EN 13201-2. EN 13201-4 specifies the procedures for making photometric and related measurements of road lighting installations. The standards EN 13201:3-4 are based on the CIE publications No. 30-2 “Calculation and measurement of luminance and illuminance in road lighting” published in 1982 [20], and No. 140 “Road lighting calculations” published in 2000 [21]. [I] The Illuminating Engineering Society of North America (IESNA) have proposed their own luminance design criteria in the American National Standard Practice for Roadway
13
Lighting RP-8-00 (Reaffirmed 2005) [13]. In the American National Standard Practice for Roadway Lighting RP-8-00 the Small Target Visibility (STV) concept is also introduced. However, in the next publication of the RP-8 (2010) luminance will be the primary design method for road lighting systems. Road lighting luminance measurements are conventionally made with spot luminance meters, which measure the luminance value of one small area at a time. A new imaging luminance meter technique controlled by computer programs offers a more advanced and more extensive solution for road lighting measurements, especially from the research point of view. The utilisation of the imaging luminance photometer technique eases the luminance measurements and provides many new possibilities in analysing road lighting criteria and the visual conditions of drivers by gathering simultaneous luminance information from the whole visual field. [I, II]
2.2 Road lighting control and weather conditions
Road lighting intensity is usually defined on the basis of standardised road lighting classes, using certain static road surface luminance levels on certain road types [16]. In practice, however, the luminance levels of road surfaces are usually very dynamic and depend to a large extent on the weather conditions [22-24]. For example, in Finland, during wintertime the road surface luminance levels may often be excessive in relationship to the standard requirements because of the snow. It has been estimated, that in northern and in north-eastern Finland for 50%-75% of the total burning hours the road conditions are snowy or at least the road surroundings are covered with snow [25]. [III, IV] In Europe, Directive No 2006/32/EC [15] regarding energy efficiency has led to measures to minimise energy consumption and to increase the energy efficiency of road lighting installations. Dynamic road lighting is being introduced with the aim of saving electricity and, at the same time, maintaining the required lighting quality level. Studies have been carried out in order to find solutions and coherent guidelines for road lighting control systems [26].
2.3 The contribution of vehicle headlights to road lighting
In Finland, according to the road traffic legislation, motorised vehicles have to use full headlights or dipped headlights at night-time in traffic. The use of full headlights is forbidden when the road is illuminated with road lighting. The use of full headlights is also forbidden when oncoming traffic is present or when the vehicle is located behind others in traffic flow. The main reason for using vehicle headlights is to improve driving safety and the visibility conditions of the driver, other traffic users, and pedestrians [27]. Lately, several studies have investigated the relation between vehicle headlights and the visibility conditions of the driver [28-31].
14
Several studies indicate that in road lighting conditions targets located on the road mainly have lower luminances than the background [32-34]. Thus, increasing the luminance of the background against which a target is viewed increases the target contrast and its visibility. Under fixed road lighting conditions visual performance improves with an increase in road surface luminance and with a decrease in vertical illuminance [7, 8]. In night-time driving conditions the purpose of road lighting is mainly to illuminate the road surface, while the headlights provide illumination of vertical surfaces, i.e. targets on the road. When the impact of dipped headlights is added to the effects of road lighting, both the road surface and the target are illuminated. If the target is seen as being darker than the road surface, the vehicle headlights may result in a reduction in the visibility of the target and may have a negative effect on driving safety. The development of vehicle headlights has led to an increase in the luminous fluxes of headlights. High-intensity discharge (HID) headlamps with much greater intensity than halogen headlamps are becoming more common. It is argued, mostly by manufacturers, that HID headlights improve the driver’s visibility conditions if they are properly aligned. However, despite the regulatory constraints concerning beam patterns, there is a potential conflict between the need to increase the intensity of vehicle headlights in order to improve the driver’s visibility conditions and the use of dipped headlights in road lighting environments. [V, VI]
2.4 Luminous and colour contrast
The current basis of road lighting rests on the assumption that targets are visible to the driver only if they have an adequate luminance contrast to their background [7, 8]. However, it can be argued that colour contrast can also be effective in revealing a target from its background, especially in the case of road lighting installations with good colour rendering properties [6]. Furthermore, it can be argued that the visibility of a target located on the road or roadside is not only defined by its luminance contrast against the background but rather by the combination of its colour contrast and luminance contrast. [VII]
2.5 Reflection properties of road surfaces
The luminance of any point of the road surface is a function of the illuminance on the road and the reflection properties of the road surface. The reflection properties of the road surface are highly dependent on the aggregate type used. Again, the lightness and colour of the aggregate type used are highly dependent on the regional availability of the aggregate and aggregate quality requirements in different countries. [VIII] Road lighting luminance calculations are based on the average luminance coefficient Qo
and on a table of the reduced luminance coefficient (r-table). Each road surface has a unique r-table and average luminance coefficient Qo value, which change over time as
15
different parts of the road wear differently. In principle, these data can be measured for a real road; however, in practice this is very rarely done or is even impossible at the design stage. In order to simplify the design of road lighting systems, the CIE introduces different road surface classes to be used in road lighting design and calculations [20, 35]. The road surface classes are generalisations of various pavement materials that have similar reflection characteristics. In practice, the system [20, 35] requires the class and the Qo value of the road surface to be known at the design stage. The system further assumes that the road surface classes represent all road surfaces, irrespective of temporal and local variations resulting from the aggregate type used, ageing, and wear. The CIE publication No. 30-2 recommends incandescent lamps with a high colour temperature to be used for measuring most of the road surface samples [20]. For deeply coloured road surfaces the influence of different light sources with various light spectra should be tested separately. However, in road lighting design the same road surface standard classifications and the same Qo and r-table values are usually used for different roads, regardless of the light sources and the pavement materials. Thus, road lighting installations may result in different road surface luminance values compared to the calculated and the designed values. [VII, VIII]
16
3 Advanced approach to road lighting measurements and calculations and drivers’ visual performance
In this work an advanced approach to road lighting calculations and measurements based on the use of an imaging luminance photometer and a computer program, Road LumiMeter v2.0, is introduced. The work sets out to investigate the variations in the characteristics of the quality of the road lighting at the same pilot locations in relation to the calculation methods used and describes the advantages of an imaging luminance photometer technique compared with conventional spot luminance meters. Mesopic visual performance and the effects of the spectral transmittance of the vehicle windshield on the visibility conditions of the driver are also discussed, to show the complexity of the factors affecting the visibility conditions of drivers in road lighting environments.
3.1 Road lighting measurements with an imaging luminance photometer
Road lighting luminance measurements are conventionally made with spot luminance meters, which measure the luminances of one small area at a time. Measuring road surface luminances with spot meters is very time-consuming, because there are usually hundreds of measurement points to be measured [13, 18, 20, 21]. For example, in the case of the EN 13201-3 standard and a dual carriageway with a luminaire spacing of 54 m, altogether 216 points have to be measured, only for one luminaire spacing and for one traffic direction [18]. The accuracy of the measurements made with spot luminance meters is also highly dependent on the weather and other external conditions, as the measurement period can take several hours. During the measurements on roads the traffic has to be directed elsewhere. When a spot luminance meter is used some details can also escape from the analysis or positional errors can easily appear. Furthermore, the measurement results do not give any information about road surface luminances located close to the measurement points and the luminances of the road surroundings. [I, II] The measurement of road lighting luminance data with an imaging luminance photometer is significantly faster compared to that with luminance spot meters. The photometer captures the scene in few seconds and the captured image includes simultaneous measurement data from the whole area of interest. In the luminance scene captured by the imaging luminance photometer, not only are the luminances of discrete points given, but also the luminances for the whole road surface area, as well as those of the road surroundings. In evaluating the visual conditions of the driver, it is important that the luminances of the whole visual field are captured. The utilisation of an imaging luminance photometer instead of a spot meter is also more accurate and creates many new possibilities for analysing the luminance distributions. [II] A road surface luminance measurement system based on an imaging luminance photometer also creates new possibilities for analysing the visual conditions of driving in terms of visual targets in the field of view. The evaluation of target visibility levels over the roadway requires the measurement of the luminances of the target, its immediate
17
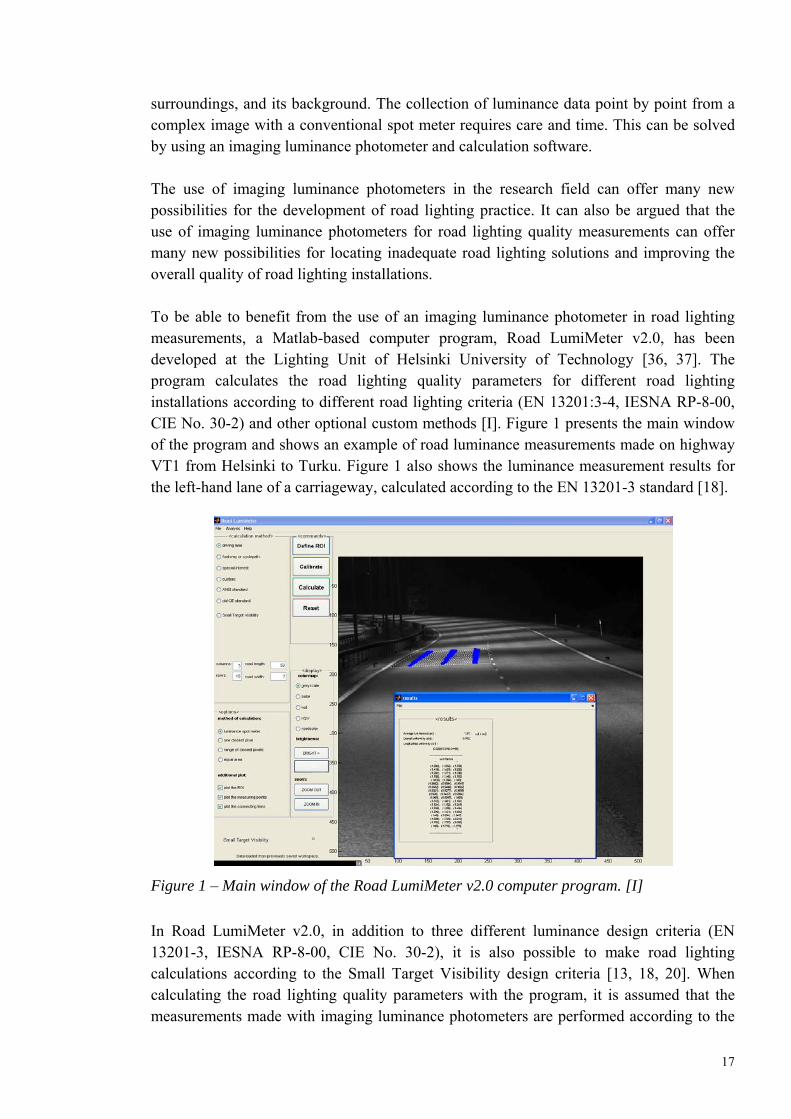
surroundings, and its background. The collection of luminance data point by point from a complex image with a conventional spot meter requires care and time. This can be solved by using an imaging luminance photometer and calculation software. The use of imaging luminance photometers in the research field can offer many new possibilities for the development of road lighting practice. It can also be argued that the use of imaging luminance photometers for road lighting quality measurements can offer many new possibilities for locating inadequate road lighting solutions and improving the overall quality of road lighting installations. To be able to benefit from the use of an imaging luminance photometer in road lighting measurements, a Matlab-based computer program, Road LumiMeter v2.0, has been developed at the Lighting Unit of Helsinki University of Technology [36, 37]. The program calculates the road lighting quality parameters for different road lighting installations according to different road lighting criteria (EN 13201:3-4, IESNA RP-8-00, CIE No. 30-2) and other optional custom methods [I]. Figure 1 presents the main window of the program and shows an example of road luminance measurements made on highway VT1 from Helsinki to Turku. Figure 1 also shows the luminance measurement results for the left-hand lane of a carriageway, calculated according to the EN 13201-3 standard [18].
Figure 1 – Main window of the Road LumiMeter v2.0 computer program. [I]
In Road LumiMeter v2.0, in addition to three different luminance design criteria (EN 13201-3, IESNA RP-8-00, CIE No. 30-2), it is also possible to make road lighting calculations according to the Small Target Visibility design criteria [13, 18, 20]. When calculating the road lighting quality parameters with the program, it is assumed that the measurements made with imaging luminance photometers are performed according to the
18
set-ups described in the criteria. In the case of the STV method the calculations of the program are based on the measurements of small targets located on the road at certain positions as defined in the IESNA RP-8-00 standard. The method also requires the veiling luminance levels of the road lighting installation to be known. In Road LumiMeter v2.0 a custom method in which the user specifies the number of measurement points in the transverse and longitudinal directions is also available for the road lighting calculations. Additionally, calculations for footways, cycleways, and other road areas lying separately or along the carriageway of a traffic route can be carried out. In the program different methods can be used for the calculation of the road surface luminance at each measurement point of the measurement area. In the case of the “Luminance spot meter” algorithm the program calculates the average luminance of a measurement point from a defined number of pixels on the basis of a model of a realistic measurement set-up in which the road lighting measurements are made with a spot meter. In the case of the “One closest pixel” algorithm the program assumes that the value of the luminance at a certain measurement point is the luminance value of the closest pixel. In the case of the “Range of closest pixels” algorithm the value of the luminance at a certain measurement point is the average luminance value of a range of the closest pixels. In this case the user has to enter the range of pixels used in the calculation. [37] In the case of the “Equal area” algorithm the program assumes that the value of the luminance at a certain measurement point is the average luminance value of all the pixels that are lying closest to the measurement point. Basically, this divides the measurement area into rectangles with measurement points in their centres. The main advantage of such a method is that all the road surface luminance values from the defined measurement area (one luminaire spacing) are included in the calculations. The number of pixels taken into account for each measurement point depends on the distance of the measurement point from the camera position. [37] In Road LumiMeter v2.0 the luminance image can be displayed by using (several different) colour maps. For luminance design criteria the program calculates the luminance of each measurement point, average road surface luminance Lav, overall luminance uniformity Uo, and longitudinal luminance uniformity UL. [18] For the STV design criteria the visibility level for each target and the STV value for a carriageway are calculated [13].
3.2 Road lighting measurements and calculations using various road lighting criteria
3.2.1 Case studies
Road lighting measurements and calculations were made for seven different pilot locations, using different road lighting criteria (EN 13201:3-4, IESNA RP-8-00, CIE No. 30-2, STV) and other alternative methods; see Table 1. The main purpose of the study was
19
to investigate how the quality characteristics of the same pilot locations vary in relation to the calculation methods used. The measurements and analysis were made using ProMetric 1400 and LMK Mobile Advanced luminance photometers and the Radiant Imaging ProMetric, LMK 2000 and Road LumiMeter v2.0 computer programs. [I] In this work, in the case of the IESNA RP-8-00 method the measurements were made by using the same observation positions as in the EN 13201-3 standard [13, 18]. In the Custom 1 method the number of measurement points in the longitudinal direction was the same as in EN 13201-3 and the number of measurement points in the transverse direction the same as in CIE No. 30-2 [18, 20]. Thus, instead of three points in the transverse direction, five points were used for each lane. As in CIE No. 30-2, the two outermost points were placed 1/10 of a lane width from the borderlines of the lane. At the same time the maximum spacing between points in the longitudinal direction was 3 m, as defined in EN 13201-3, and not 5 m, as defined in CIE No. 30-2. The positioning of the points in the longitudinal direction was consistent with EN 13201-3. Table 1 - Pilot locations of road lighting luminance measurements and calculations. [I]
Test road Lighting
class Lamp type
Road type
Calculation methods
VT1 AL3 HPS Highway EN 13201-3 (different variations), CIE No. 30-2, Custom 1, Custom 2, IESNA RP-8-00.
VT1 AL3 MH Highway EN 13201-3 (point meter, equal area), CIE No. 30-2, Custom 1, Custom 2, IESNA RP-8-00.
Ring Road III AL2 HPS Highway EN 13201-3 (point meter, equal area), CIE No. 30-2, Custom 1, Custom 2 (point meter, equal area), IESNA RP-8-00, STV.
Leppälinnun- rinne
AL4b HPS Local streetEN 13201-3 (point meter, equal area), CIE No. 30-2, Custom 1, Custom 2, IESNA RP-8-00.
Jakokunnantie AL4b HPS Local streetEN 13201-3 (point meter, equal area), CIE No. 30-2, Custom 1, Custom 2 (point meter, equal area).
VT3 AL3 MH Highway EN 13201-3 (point meter, equal area), CIE No. 30-2, Custom 1, Custom 2 (point meter, equal area).
VT3, wet road surface
AL3 HPS Highway EN 13201-3 (point meter, equal area), CIE No. 30-2, Custom 1, Custom 2 (point meter, equal area).
The Custom 2 method was also a variation of the EN 13201-3 standard [18]. In the Custom 2 method the number of measurement points in the longitudinal direction was reduced to 7 on major roads with a column spacing more than 30 m and to 5 on local roads with column spacing less that 30 m. The positioning of the points in the transverse direction was consistent with EN 13201-3. In calculating the road lighting quality characteristics with EN 13201-3, CIE No. 30-2, and IESNA RP-8-00 the default calculation algorithm used was “Luminance spot meter”. The measurement cone of the spot meter was restricted to be as defined in the EN 13201-4 standard [19]. In calculating the road lighting quality characteristics with the EN 13201-3 standard the “Equal area”, “Single pixel”, and “Range of pixels” algorithms were also used
20
to study how the results vary in relation to the measurement area used for defining the luminance value of each measurement point. In the Custom 1 and Custom 2 methods the luminances of the measurement points were defined by using the “Equal area” algorithm. In this way, all the road surface luminance values from the defined area were included in the calculations, while conventionally the road lighting measurements and calculations are performed by using only a certain part of the road surface luminance data. In calculating the quality characteristics with the Custom 2 method the “Luminance spot meter” algorithm was also used.
3.2.2 Results
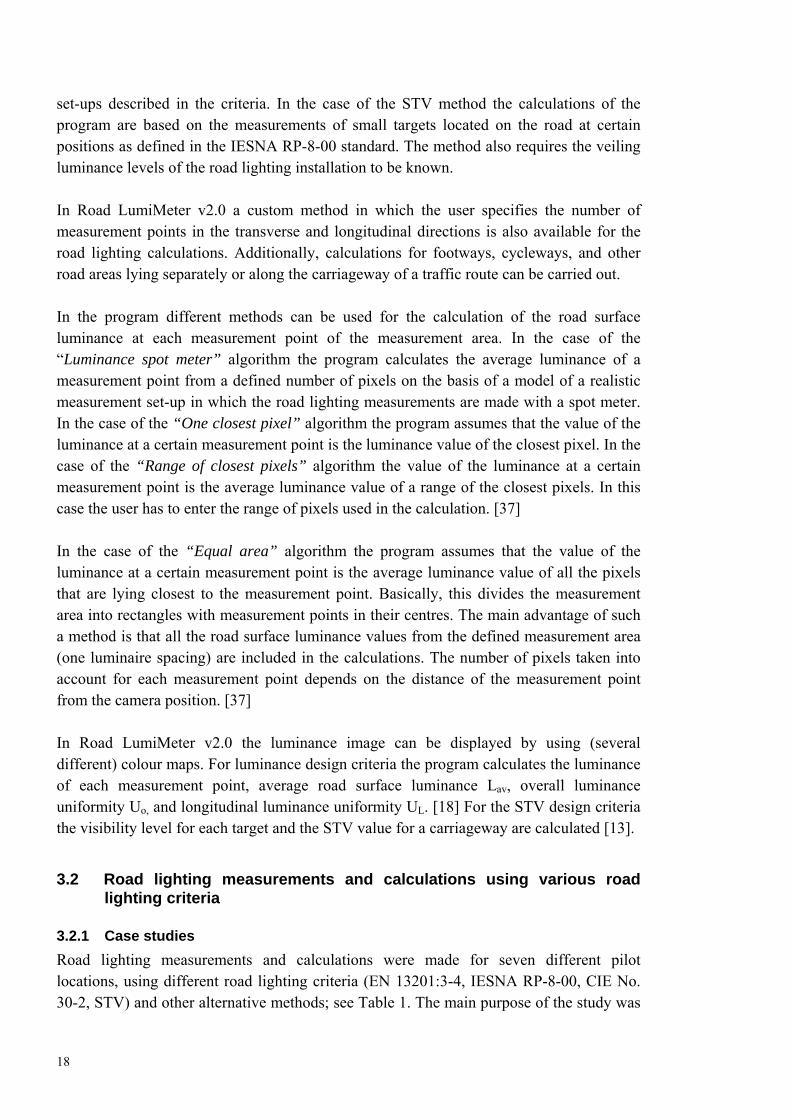
Figure 2 shows measurement examples of two pilot locations on VT1 illuminated with HPS and MH lamps. The lighting class for VT1 is AL3 (Lav = 1.0 cd/m2, Uo = 0.4, UL =
0.6). [I]
a) b)
Figure 2 – Pilot locations on VT1 illuminated with a) HPS lamps b) MH lamps. Luminances are shown in grey scale map. The a) Custom 1 (90 measurement points per lane) and b) Custom 2 (21 measurement points per lane) methods were used for the calculation of the average road surface luminance, overall luminance uniformity, and longitudinal luminance uniformity. For each point the luminance value was calculated by using the average luminance value of all the pixels that are located in the rectangle of the relevant point (“Equal area” algorithm). [I]
The results of the road lighting measurements and calculations conducted in this work indicate that absolutely the same road lighting installation may result in slightly different average road surface luminance and luminance uniformity values, depending on the method used for calculating the road lighting performance; see Tables 2 and 3. In general, greater differences between different methods were found when calculating the overall and longitudinal luminance uniformities than in calculating the average road surface luminance.
21
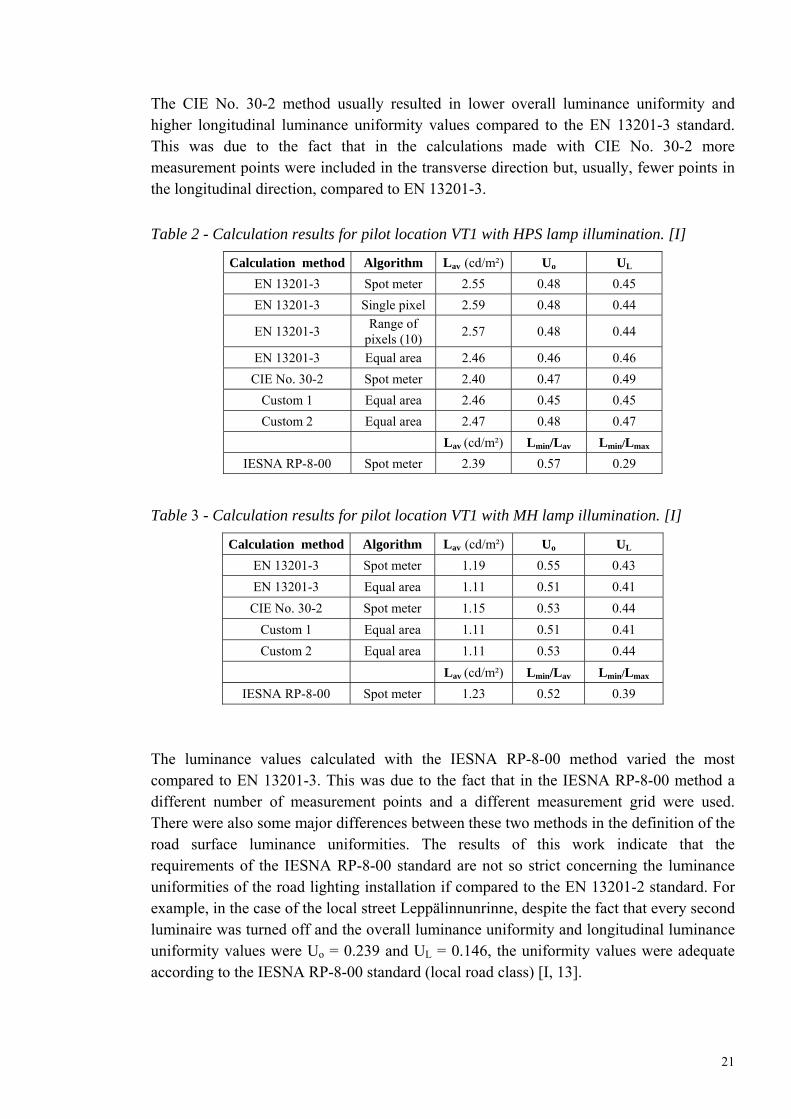
The CIE No. 30-2 method usually resulted in lower overall luminance uniformity and higher longitudinal luminance uniformity values compared to the EN 13201-3 standard. This was due to the fact that in the calculations made with CIE No. 30-2 more measurement points were included in the transverse direction but, usually, fewer points in the longitudinal direction, compared to EN 13201-3.
Table 2 - Calculation results for pilot location VT1 with HPS lamp illumination. [I]
Calculation method Algorithm Lav (cd/m²) Uo UL
EN 13201-3 Spot meter 2.55 0.48 0.45
EN 13201-3 Single pixel 2.59 0.48 0.44
EN 13201-3 Range of
pixels (10) 2.57 0.48 0.44
EN 13201-3 Equal area 2.46 0.46 0.46
CIE No. 30-2 Spot meter 2.40 0.47 0.49
Custom 1 Equal area 2.46 0.45 0.45
Custom 2 Equal area 2.47 0.48 0.47
Lav (cd/m²) Lmin/Lav Lmin/Lmax
IESNA RP-8-00 Spot meter 2.39 0.57 0.29
Table 3 - Calculation results for pilot location VT1 with MH lamp illumination. [I]
Calculation method Algorithm Lav (cd/m²) Uo UL
EN 13201-3 Spot meter 1.19 0.55 0.43
EN 13201-3 Equal area 1.11 0.51 0.41
CIE No. 30-2 Spot meter 1.15 0.53 0.44
Custom 1 Equal area 1.11 0.51 0.41
Custom 2 Equal area 1.11 0.53 0.44
Lav (cd/m²) Lmin/Lav Lmin/Lmax
IESNA RP-8-00 Spot meter 1.23 0.52 0.39
The luminance values calculated with the IESNA RP-8-00 method varied the most compared to EN 13201-3. This was due to the fact that in the IESNA RP-8-00 method a different number of measurement points and a different measurement grid were used. There were also some major differences between these two methods in the definition of the road surface luminance uniformities. The results of this work indicate that the requirements of the IESNA RP-8-00 standard are not so strict concerning the luminance uniformities of the road lighting installation if compared to the EN 13201-2 standard. For example, in the case of the local street Leppälinnunrinne, despite the fact that every second luminaire was turned off and the overall luminance uniformity and longitudinal luminance uniformity values were Uo = 0.239 and UL = 0.146, the uniformity values were adequate according to the IESNA RP-8-00 standard (local road class) [I, 13].
22
In the case of the Custom 1 method, the increase in the number of measurement points reduced the overall and the longitudinal luminance uniformity values when compared to EN 13201-3 and CIE No. 30-2. At the same time, including all the luminance values of the defined road surface area (“Equal area”) resulted in a slightly decreased average road surface luminance compared to EN 13201-3 (“Luminance spot meter”). The Custom 2 method (“Equal area”) usually resulted in slightly higher overall luminance uniformity and longitudinal luminance uniformity values compared to the other methods as a result of the reduced number of measurement points used for the calculations. The results show that there were only slight variations in the calculated values when the “Luminance spot meter”, “Single pixel”, and “Range of pixels” algorithms were used. Only the calculation results achieved with the “Equal area” algorithm varied from the results achieved with the “Luminance spot meter” algorithm. The calculated values of the different calculation algorithms are, however, dependent on the size of the luminance image captured with the imaging luminance photometer and the size of the pixels in the area of interest. The Custom 2 method (“Luminance spot meter”) resulted in very similar average road surface luminance values compared to the EN 13201-3 standard (“Luminance spot meter”), although in the case of the Custom 2 method the number of measurement points was much smaller than in the case of the EN 13201-3 standard. For example, on Ring Road III the Custom 2 method resulted in an average road surface luminance 1.2% lower compared to the EN 13201-3 standard, although the number of measurement points was reduced from 228 to 84 [I]. The results indicate that the number of measurement points has no significant effect on the calculated average road surface luminance value as long as the number of points used in the calculations is not very small (for example, more than 21 measurement points per lane). However, the number of points used in the measurement and calculations has an impact on the overall luminance uniformity and longitudinal luminance uniformity values. The higher the number of measurement points in the longitudinal direction, the lower the resultant longitudinal uniformity value. At the same time, the higher the number of total measurement points, the lower the overall luminance uniformity value.
3.2.3 Discussion
In the current European standard, EN 13201-3, three calculation/measurement points are used in the transverse direction for each driving lane. The two outermost points are placed 1/6 of a lane width from the borderlines of the lane and the third one in the middle of the lane. If it is assumed that the lane width is 3.5 m, the outermost points are placed 1.17 m from the centre line. At the same time, the typical width of a vehicle is about 1.6 m and if the vehicle is located in the middle of the lane the tyres are located 0.8 m from the centre line of the lane. In practice, this means that the centre line of the measurement points is located between the wheel tracks in the middle of the lane and the other two lines are located on the outer edges of the wheel tracks. In Finland, as a result of the use of studded tyres during wintertime, the wheel tracks are usually lighter than the borders and the central area of the driving lanes (the borders and the central area of the lane are usually
23
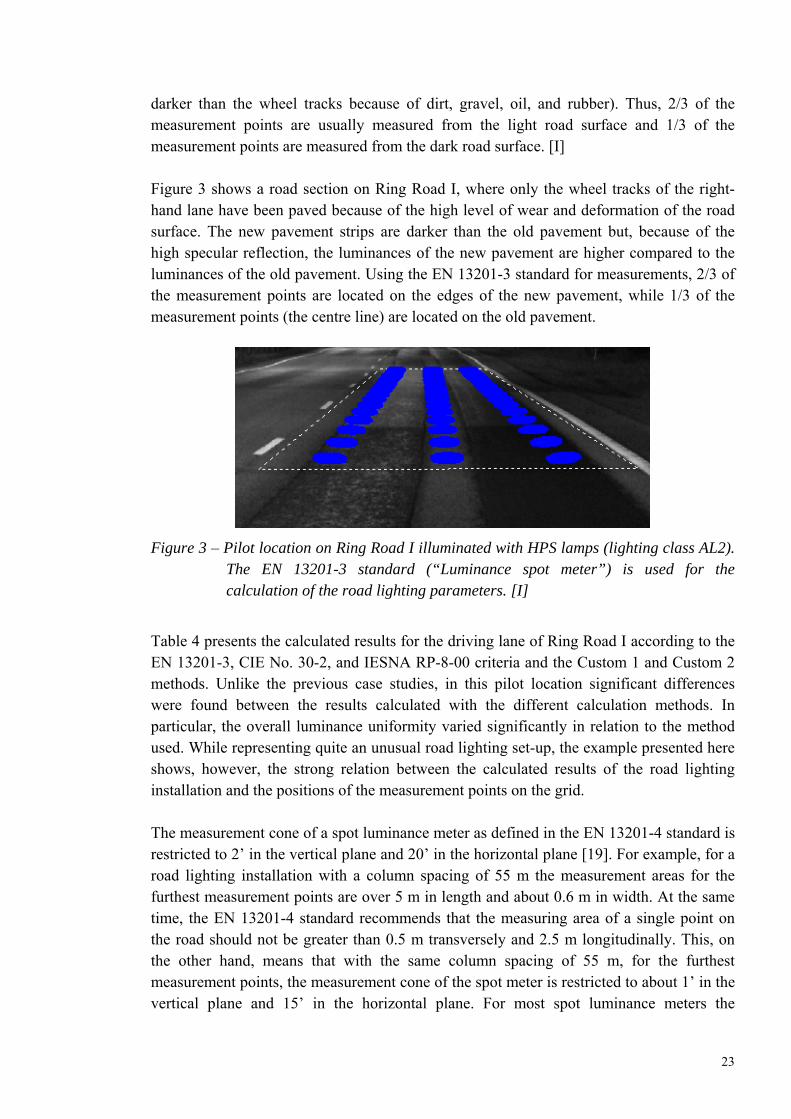
darker than the wheel tracks because of dirt, gravel, oil, and rubber). Thus, 2/3 of the measurement points are usually measured from the light road surface and 1/3 of the measurement points are measured from the dark road surface. [I] Figure 3 shows a road section on Ring Road I, where only the wheel tracks of the right-hand lane have been paved because of the high level of wear and deformation of the road surface. The new pavement strips are darker than the old pavement but, because of the high specular reflection, the luminances of the new pavement are higher compared to the luminances of the old pavement. Using the EN 13201-3 standard for measurements, 2/3 of the measurement points are located on the edges of the new pavement, while 1/3 of the measurement points (the centre line) are located on the old pavement.
Figure 3 – Pilot location on Ring Road I illuminated with HPS lamps (lighting class AL2). The EN 13201-3 standard (“Luminance spot meter”) is used for the calculation of the road lighting parameters. [I]
Table 4 presents the calculated results for the driving lane of Ring Road I according to the EN 13201-3, CIE No. 30-2, and IESNA RP-8-00 criteria and the Custom 1 and Custom 2 methods. Unlike the previous case studies, in this pilot location significant differences were found between the results calculated with the different calculation methods. In particular, the overall luminance uniformity varied significantly in relation to the method used. While representing quite an unusual road lighting set-up, the example presented here shows, however, the strong relation between the calculated results of the road lighting installation and the positions of the measurement points on the grid. The measurement cone of a spot luminance meter as defined in the EN 13201-4 standard is restricted to 2’ in the vertical plane and 20’ in the horizontal plane [19]. For example, for a road lighting installation with a column spacing of 55 m the measurement areas for the furthest measurement points are over 5 m in length and about 0.6 m in width. At the same time, the EN 13201-4 standard recommends that the measuring area of a single point on the road should not be greater than 0.5 m transversely and 2.5 m longitudinally. This, on the other hand, means that with the same column spacing of 55 m, for the furthest measurement points, the measurement cone of the spot meter is restricted to about 1’ in the vertical plane and 15’ in the horizontal plane. For most spot luminance meters the
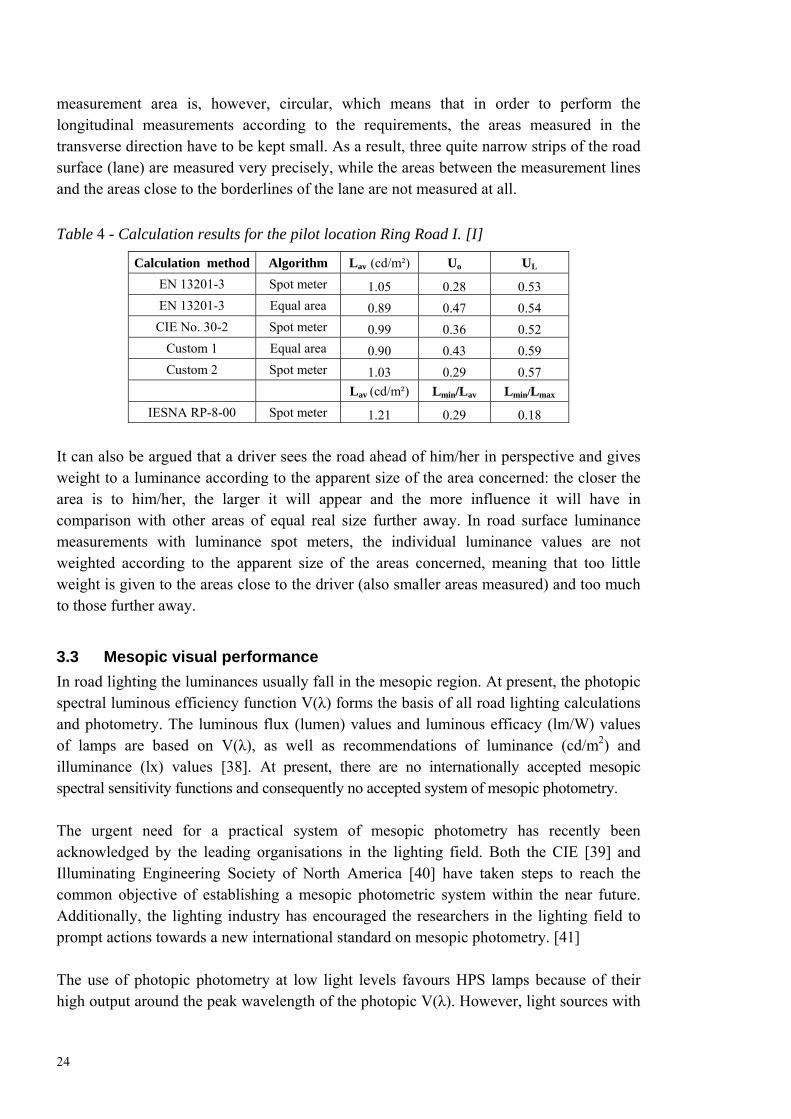
24
measurement area is, however, circular, which means that in order to perform the longitudinal measurements according to the requirements, the areas measured in the transverse direction have to be kept small. As a result, three quite narrow strips of the road surface (lane) are measured very precisely, while the areas between the measurement lines and the areas close to the borderlines of the lane are not measured at all.
Table 4 - Calculation results for the pilot location Ring Road I. [I]
Calculation method Algorithm Lav (cd/m²) Uo UL
EN 13201-3 Spot meter 1.05 0.28 0.53
EN 13201-3 Equal area 0.89 0.47 0.54
CIE No. 30-2 Spot meter 0.99 0.36 0.52
Custom 1 Equal area 0.90 0.43 0.59
Custom 2 Spot meter 1.03 0.29 0.57
Lav (cd/m²) Lmin/Lav Lmin/Lmax
IESNA RP-8-00 Spot meter 1.21 0.29 0.18
It can also be argued that a driver sees the road ahead of him/her in perspective and gives weight to a luminance according to the apparent size of the area concerned: the closer the area is to him/her, the larger it will appear and the more influence it will have in comparison with other areas of equal real size further away. In road surface luminance measurements with luminance spot meters, the individual luminance values are not weighted according to the apparent size of the areas concerned, meaning that too little weight is given to the areas close to the driver (also smaller areas measured) and too much to those further away.
3.3 Mesopic visual performance
In road lighting the luminances usually fall in the mesopic region. At present, the photopic spectral luminous efficiency function V(λ) forms the basis of all road lighting calculations and photometry. The luminous flux (lumen) values and luminous efficacy (lm/W) values of lamps are based on V(λ), as well as recommendations of luminance (cd/m2) and illuminance (lx) values [38]. At present, there are no internationally accepted mesopic spectral sensitivity functions and consequently no accepted system of mesopic photometry. The urgent need for a practical system of mesopic photometry has recently been acknowledged by the leading organisations in the lighting field. Both the CIE [39] and Illuminating Engineering Society of North America [40] have taken steps to reach the common objective of establishing a mesopic photometric system within the near future. Additionally, the lighting industry has encouraged the researchers in the lighting field to prompt actions towards a new international standard on mesopic photometry. [41] The use of photopic photometry at low light levels favours HPS lamps because of their high output around the peak wavelength of the photopic V(λ). However, light sources with
25
a high output in the short wavelength region have frequently been acknowledged to be visually more effective in peripheral vision at the mesopic light levels [38, 42-44]. The proposed MOVE model of the MOVE consortium [45] and the UPS system introduced by Rea et al. [46] have both met criticism, especially concerning the upper luminance limit of the mesopic region [47, 48]. The upper luminance limit of the MOVE model (10 cd/m2) is claimed to complicate practical photometry and lighting specifications for “high” light levels unnecessarily, whereas the upper mesopic luminance limit proposed by the UPS system (0.6 cd/m2) would make mesopic dimensioning concern only the roads in the lower lighting classes, of which, at least in European countries, there are very few. Viikari et al. [41] proposed a new modified MOVE model whose upper luminance limit is in between the limits of the previously proposed models. The CIE TC1-58 “Visual performance in the mesopic range” is currently working on an internationally accepted basis for mesopic photometry. The TC1-58 will complete its work in the near future and the outcome will be a model for the basis of visual performance-based mesopic photometry. The CIE Division 4 “Lighting and signalling for transport” has established a Technical Committee, TC4-48 “White light on road lighting”, to study the effects of white light under mesopic conditions for urban environments.
3.4 Spectral transmittance of vehicle windshields
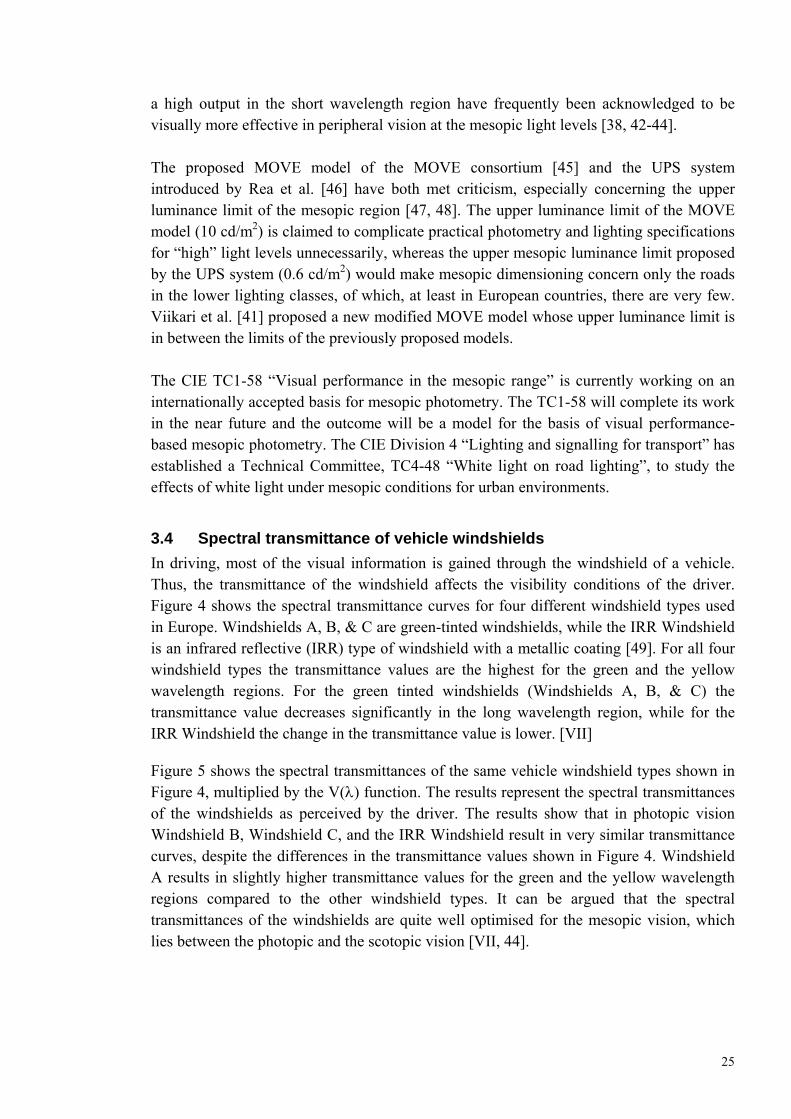
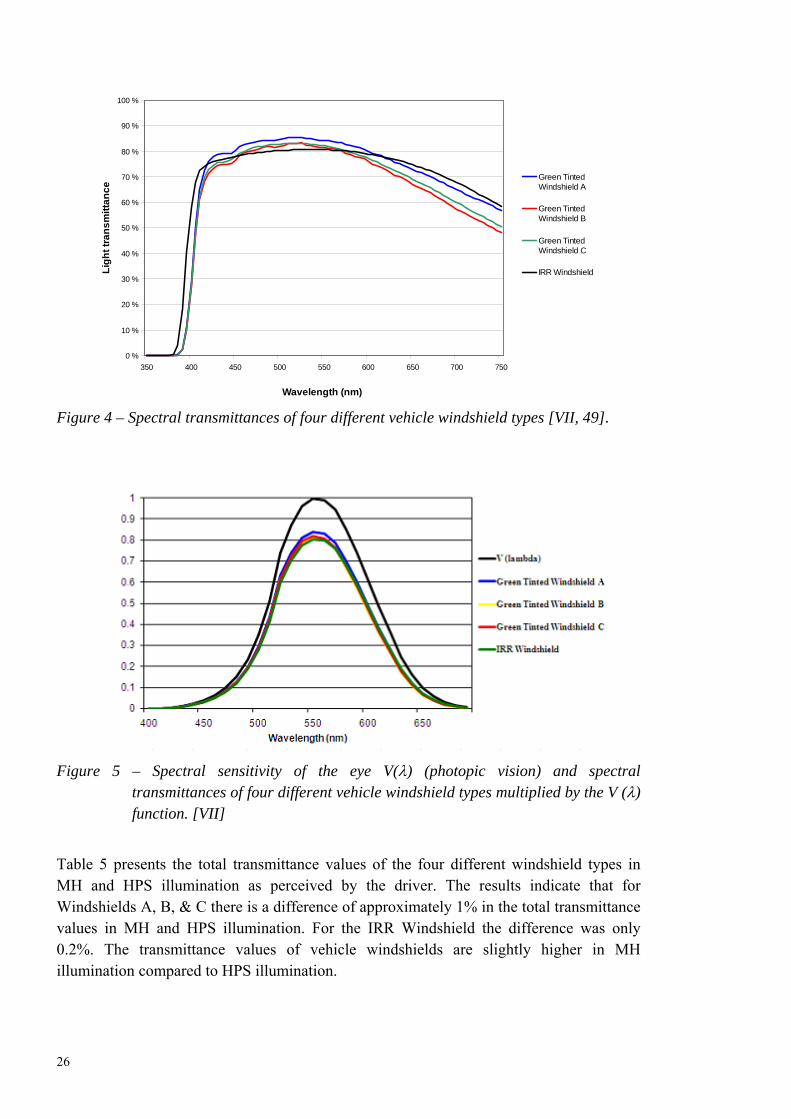
In driving, most of the visual information is gained through the windshield of a vehicle. Thus, the transmittance of the windshield affects the visibility conditions of the driver. Figure 4 shows the spectral transmittance curves for four different windshield types used in Europe. Windshields A, B, & C are green-tinted windshields, while the IRR Windshield is an infrared reflective (IRR) type of windshield with a metallic coating [49]. For all four windshield types the transmittance values are the highest for the green and the yellow wavelength regions. For the green tinted windshields (Windshields A, B, & C) the transmittance value decreases significantly in the long wavelength region, while for the IRR Windshield the change in the transmittance value is lower. [VII] Figure 5 shows the spectral transmittances of the same vehicle windshield types shown in Figure 4, multiplied by the V() function. The results represent the spectral transmittances of the windshields as perceived by the driver. The results show that in photopic vision Windshield B, Windshield C, and the IRR Windshield result in very similar transmittance curves, despite the differences in the transmittance values shown in Figure 4. Windshield A results in slightly higher transmittance values for the green and the yellow wavelength regions compared to the other windshield types. It can be argued that the spectral transmittances of the windshields are quite well optimised for the mesopic vision, which lies between the photopic and the scotopic vision [VII, 44].
26
0 %
10 %
20 %
30 %
40 %
50 %
60 %
70 %
80 %
90 %
100 %
350 400 450 500 550 600 650 700 750
Wavelength (nm)
Lig
ht
tra
ns
mit
tan
ce
Green TintedWindshield A
Green TintedWindshield B
Green TintedWindshield C
IRR Windshield
Figure 4 – Spectral transmittances of four different vehicle windshield types [VII, 49].
Figure 5 – Spectral sensitivity of the eye V() (photopic vision) and spectral transmittances of four different vehicle windshield types multiplied by the V () function. [VII]
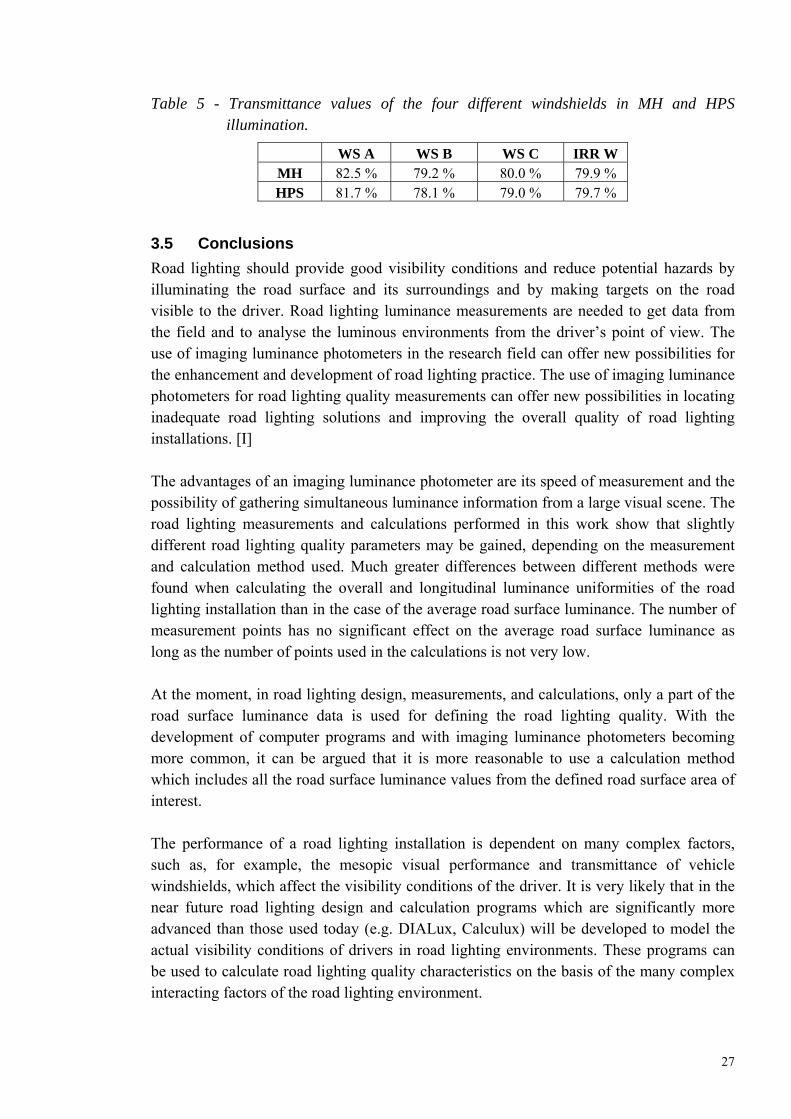
Table 5 presents the total transmittance values of the four different windshield types in MH and HPS illumination as perceived by the driver. The results indicate that for Windshields A, B, & C there is a difference of approximately 1% in the total transmittance values in MH and HPS illumination. For the IRR Windshield the difference was only 0.2%. The transmittance values of vehicle windshields are slightly higher in MH illumination compared to HPS illumination.
27
Table 5 - Transmittance values of the four different windshields in MH and HPS illumination.
WS A WS B WS C IRR W MH 82.5 % 79.2 % 80.0 % 79.9 % HPS 81.7 % 78.1 % 79.0 % 79.7 %
3.5 Conclusions
Road lighting should provide good visibility conditions and reduce potential hazards by illuminating the road surface and its surroundings and by making targets on the road visible to the driver. Road lighting luminance measurements are needed to get data from the field and to analyse the luminous environments from the driver’s point of view. The use of imaging luminance photometers in the research field can offer new possibilities for the enhancement and development of road lighting practice. The use of imaging luminance photometers for road lighting quality measurements can offer new possibilities in locating inadequate road lighting solutions and improving the overall quality of road lighting installations. [I] The advantages of an imaging luminance photometer are its speed of measurement and the possibility of gathering simultaneous luminance information from a large visual scene. The road lighting measurements and calculations performed in this work show that slightly different road lighting quality parameters may be gained, depending on the measurement and calculation method used. Much greater differences between different methods were found when calculating the overall and longitudinal luminance uniformities of the road lighting installation than in the case of the average road surface luminance. The number of measurement points has no significant effect on the average road surface luminance as long as the number of points used in the calculations is not very low. At the moment, in road lighting design, measurements, and calculations, only a part of the road surface luminance data is used for defining the road lighting quality. With the development of computer programs and with imaging luminance photometers becoming more common, it can be argued that it is more reasonable to use a calculation method which includes all the road surface luminance values from the defined road surface area of interest. The performance of a road lighting installation is dependent on many complex factors, such as, for example, the mesopic visual performance and transmittance of vehicle windshields, which affect the visibility conditions of the driver. It is very likely that in the near future road lighting design and calculation programs which are significantly more advanced than those used today (e.g. DIALux, Calculux) will be developed to model the actual visibility conditions of drivers in road lighting environments. These programs can be used to calculate road lighting quality characteristics on the basis of the many complex interacting factors of the road lighting environment.
28
4 Analysis of road lighting quantity and quality in varying weather conditions
Road lighting measurements were made to study road surface luminance levels in different weather conditions. The measurements took place in five pilot locations, where the effects of snowy and wet road surfaces on road lighting performance were examined [III]. The analysis of different weather conditions and their effects on visual conditions in driving may offer new opportunities to save energy and new ways to optimise intelligent road lighting control systems [IV]. With an effective road lighting control system electricity can be saved without adversely affecting either the safety of driving or the quality of the road lighting [IV, 26, 50, 51].
4.1 Experimental set-up
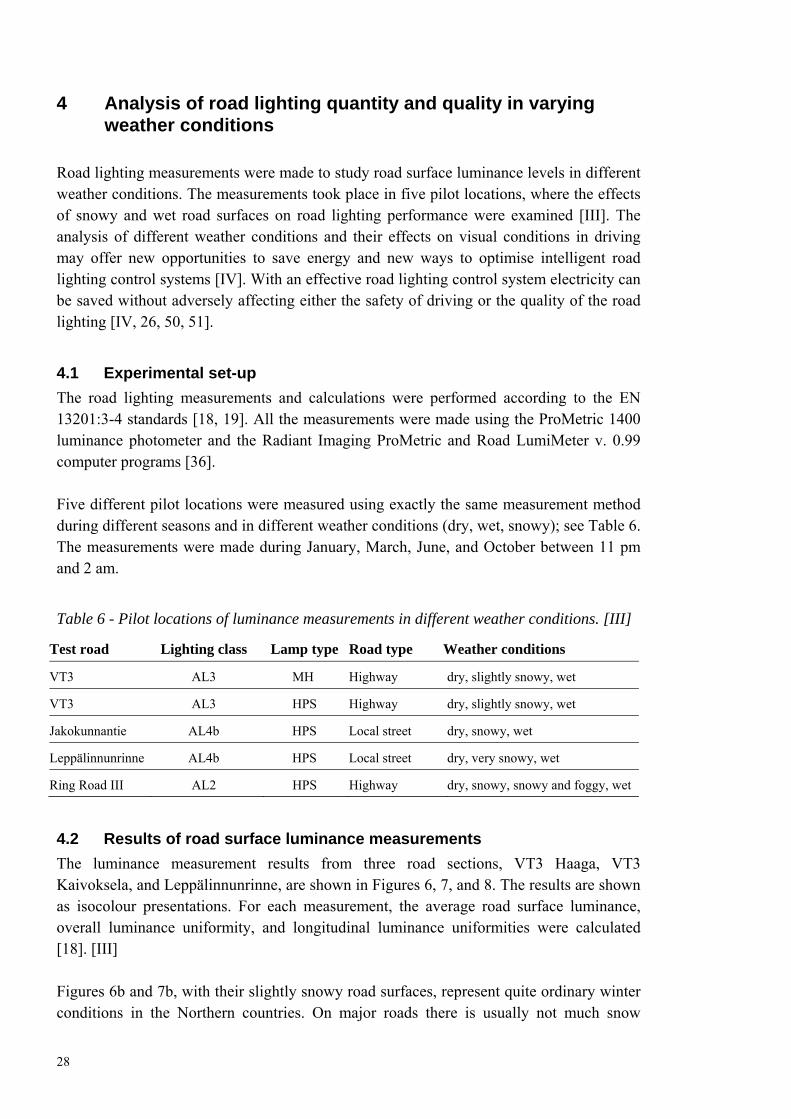
The road lighting measurements and calculations were performed according to the EN 13201:3-4 standards [18, 19]. All the measurements were made using the ProMetric 1400 luminance photometer and the Radiant Imaging ProMetric and Road LumiMeter v. 0.99 computer programs [36]. Five different pilot locations were measured using exactly the same measurement method during different seasons and in different weather conditions (dry, wet, snowy); see Table 6. The measurements were made during January, March, June, and October between 11 pm and 2 am.
Table 6 - Pilot locations of luminance measurements in different weather conditions. [III]
Test road Lighting class Lamp type Road type Weather conditions
VT3 AL3 MH Highway dry, slightly snowy, wet
VT3 AL3 HPS Highway dry, slightly snowy, wet
Jakokunnantie AL4b HPS Local street dry, snowy, wet
Leppälinnunrinne AL4b HPS Local street dry, very snowy, wet
Ring Road III AL2 HPS Highway dry, snowy, snowy and foggy, wet
4.2 Results of road surface luminance measurements
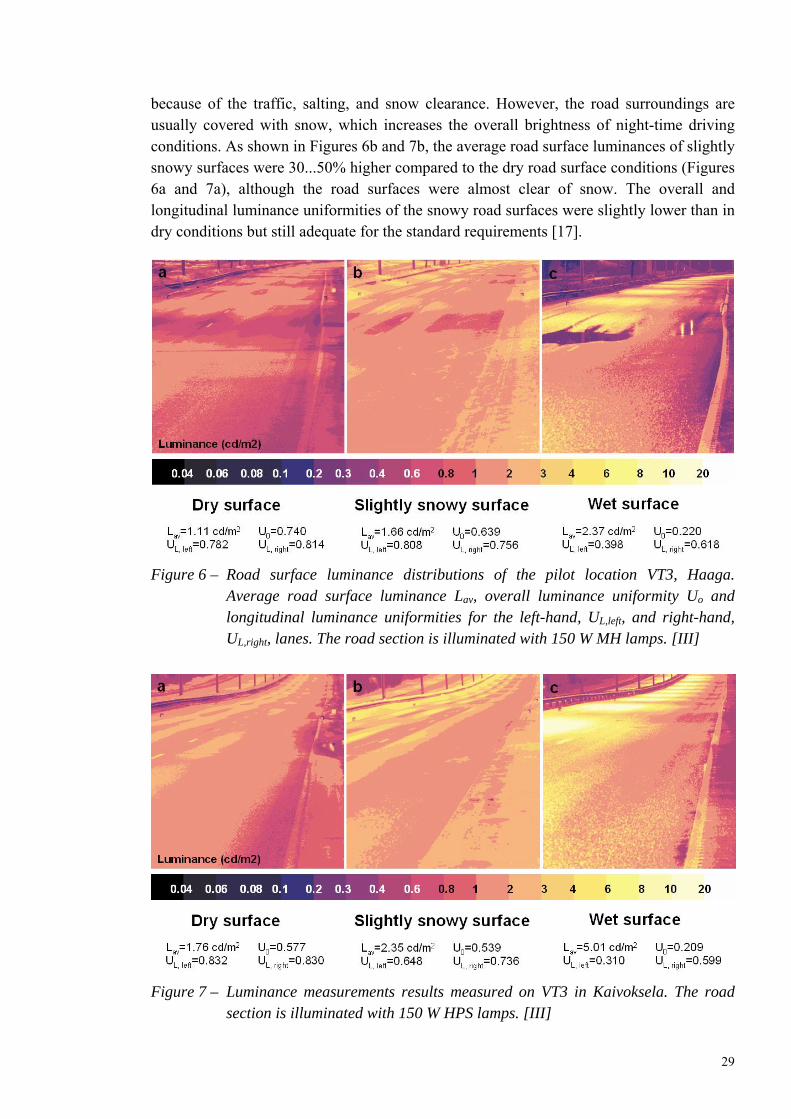
The luminance measurement results from three road sections, VT3 Haaga, VT3 Kaivoksela, and Leppälinnunrinne, are shown in Figures 6, 7, and 8. The results are shown as isocolour presentations. For each measurement, the average road surface luminance, overall luminance uniformity, and longitudinal luminance uniformities were calculated [18]. [III] Figures 6b and 7b, with their slightly snowy road surfaces, represent quite ordinary winter conditions in the Northern countries. On major roads there is usually not much snow
29
because of the traffic, salting, and snow clearance. However, the road surroundings are usually covered with snow, which increases the overall brightness of night-time driving conditions. As shown in Figures 6b and 7b, the average road surface luminances of slightly snowy surfaces were 30...50% higher compared to the dry road surface conditions (Figures 6a and 7a), although the road surfaces were almost clear of snow. The overall and longitudinal luminance uniformities of the snowy road surfaces were slightly lower than in dry conditions but still adequate for the standard requirements [17].
Figure 6 – Road surface luminance distributions of the pilot location VT3, Haaga. Average road surface luminance Lav, overall luminance uniformity Uo and longitudinal luminance uniformities for the left-hand, UL,left, and right-hand, UL,right, lanes. The road section is illuminated with 150 W MH lamps. [III]
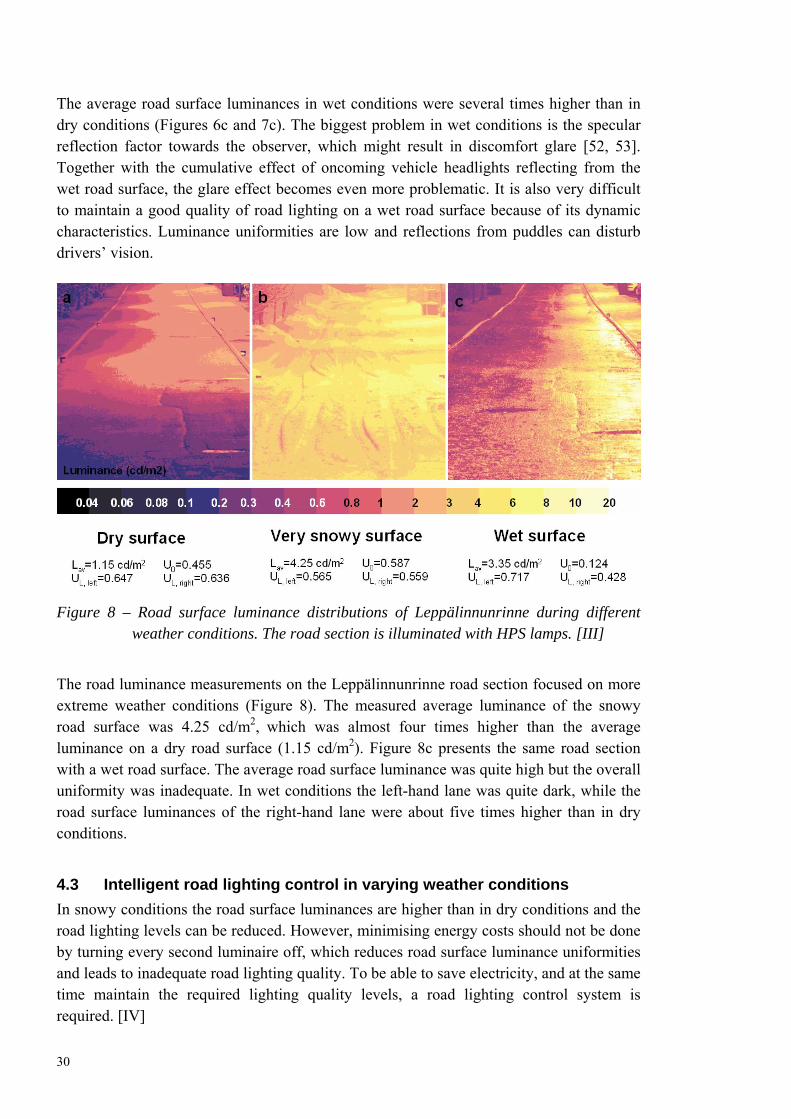
Figure 7 – Luminance measurements results measured on VT3 in Kaivoksela. The road section is illuminated with 150 W HPS lamps. [III]
30
The average road surface luminances in wet conditions were several times higher than in dry conditions (Figures 6c and 7c). The biggest problem in wet conditions is the specular reflection factor towards the observer, which might result in discomfort glare [52, 53]. Together with the cumulative effect of oncoming vehicle headlights reflecting from the wet road surface, the glare effect becomes even more problematic. It is also very difficult to maintain a good quality of road lighting on a wet road surface because of its dynamic characteristics. Luminance uniformities are low and reflections from puddles can disturb drivers’ vision.
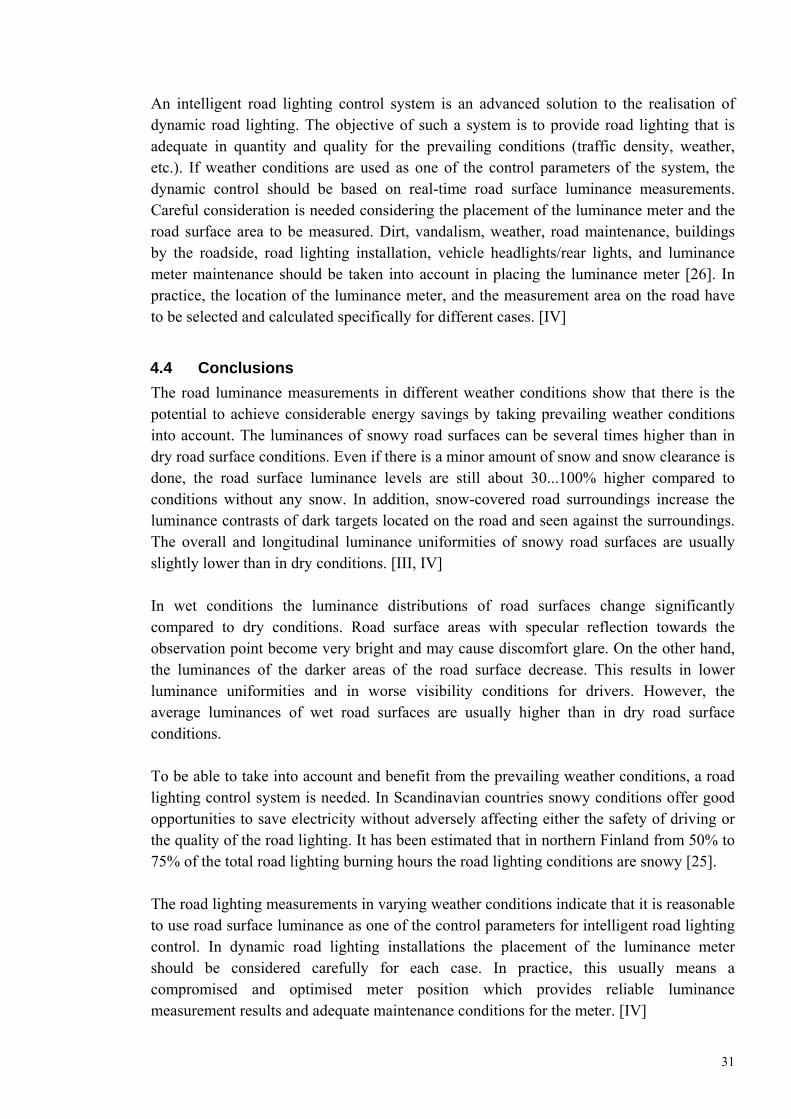
Figure 8 – Road surface luminance distributions of Leppälinnunrinne during different weather conditions. The road section is illuminated with HPS lamps. [III]
The road luminance measurements on the Leppälinnunrinne road section focused on more extreme weather conditions (Figure 8). The measured average luminance of the snowy road surface was 4.25 cd/m2, which was almost four times higher than the average luminance on a dry road surface (1.15 cd/m2). Figure 8c presents the same road section with a wet road surface. The average road surface luminance was quite high but the overall uniformity was inadequate. In wet conditions the left-hand lane was quite dark, while the road surface luminances of the right-hand lane were about five times higher than in dry conditions.
4.3 Intelligent road lighting control in varying weather conditions
In snowy conditions the road surface luminances are higher than in dry conditions and the road lighting levels can be reduced. However, minimising energy costs should not be done by turning every second luminaire off, which reduces road surface luminance uniformities and leads to inadequate road lighting quality. To be able to save electricity, and at the same time maintain the required lighting quality levels, a road lighting control system is required. [IV]
31
An intelligent road lighting control system is an advanced solution to the realisation of dynamic road lighting. The objective of such a system is to provide road lighting that is adequate in quantity and quality for the prevailing conditions (traffic density, weather, etc.). If weather conditions are used as one of the control parameters of the system, the dynamic control should be based on real-time road surface luminance measurements. Careful consideration is needed considering the placement of the luminance meter and the road surface area to be measured. Dirt, vandalism, weather, road maintenance, buildings by the roadside, road lighting installation, vehicle headlights/rear lights, and luminance meter maintenance should be taken into account in placing the luminance meter [26]. In practice, the location of the luminance meter, and the measurement area on the road have to be selected and calculated specifically for different cases. [IV]
4.4 Conclusions
The road luminance measurements in different weather conditions show that there is the potential to achieve considerable energy savings by taking prevailing weather conditions into account. The luminances of snowy road surfaces can be several times higher than in dry road surface conditions. Even if there is a minor amount of snow and snow clearance is done, the road surface luminance levels are still about 30...100% higher compared to conditions without any snow. In addition, snow-covered road surroundings increase the luminance contrasts of dark targets located on the road and seen against the surroundings. The overall and longitudinal luminance uniformities of snowy road surfaces are usually slightly lower than in dry conditions. [III, IV] In wet conditions the luminance distributions of road surfaces change significantly compared to dry conditions. Road surface areas with specular reflection towards the observation point become very bright and may cause discomfort glare. On the other hand, the luminances of the darker areas of the road surface decrease. This results in lower luminance uniformities and in worse visibility conditions for drivers. However, the average luminances of wet road surfaces are usually higher than in dry road surface conditions. To be able to take into account and benefit from the prevailing weather conditions, a road lighting control system is needed. In Scandinavian countries snowy conditions offer good opportunities to save electricity without adversely affecting either the safety of driving or the quality of the road lighting. It has been estimated that in northern Finland from 50% to 75% of the total road lighting burning hours the road lighting conditions are snowy [25]. The road lighting measurements in varying weather conditions indicate that it is reasonable to use road surface luminance as one of the control parameters for intelligent road lighting control. In dynamic road lighting installations the placement of the luminance meter should be considered carefully for each case. In practice, this usually means a compromised and optimised meter position which provides reliable luminance measurement results and adequate maintenance conditions for the meter. [IV]
32
5 Effects of vehicle headlights on target contrast in road lighting environments
Measurements were made to study the use of road lighting and dipped vehicle headlights at the same time and whether this may have a conflicting effect on the luminance contrasts of various targets located on the road or at the side of the road. Altogether, seven different studies were conducted to investigate the contribution of halogen and high-intensity discharge headlights to road lighting. [V, VI]
5.1 Measurement set-up and equipment
The luminance contrast measurements were made on a recently built extension section of the Ring Road III highway illuminated with 250W HPS lamps (lighting class AL2). The section consists of two carriageways separated by a central reservation. Each carriageway has two traffic lanes. The column spacing is 55 m and the mounting height is 12 m. The measured average road surface luminance was Lav = 1.85 cd/m2, the overall luminance uniformity Uo = 0.58, and the longitudinal luminance uniformity UL = 0.49. The road lighting installation was dimmable. The road pavement type was AB 22/150 asphalt concrete. [V, VI] The vehicles used were a Renault Laguna 2003 and Audi A6 Avant 2006 whose headlights had been verified according to the UNECE (United Nations Economic Commission for Europe) regulations 112 and 98 [54, 55]. The headlights of the Renault were halogen H1/H7 (55W) and the headlights of the Audi were high-intensity discharge (HID) Xenon Plus D2S (35W). Targets 20 cm x 20 cm in size (flat surfaces) were positioned perpendicular to the road surface. The size of the targets represents a critical object which is the most difficult to perceive but still dangerous for a normal-sized vehicle [32, 56]. In the American National Standard Practice for Roadway Lighting similar achromatic square targets are used for Small Target Visibility calculations [13]. Similar achromatic flat surface targets with different reflection factors were used as the basis for the present road lighting recommendations [7]. The reflection factors of the targets were 0.09, 0.20, and 0.50 (Lambertian surfaces). A wooden pedestrian dressed in a grey shirt and grey trousers with a reflection factor of 0.16 and a cylindrical target (0.20) with a height of 20 cm and a diameter of 20 cm were also used [VI]. Figure 9 shows the measurement area and the positioning of the vehicle and the various targets on the carriageway and at the roadside. The vehicle was always placed on the central axis of the right-hand or the left-hand lane. The targets were placed on the central axis of the right-hand and left-hand lanes, but the pedestrian target was also positioned at
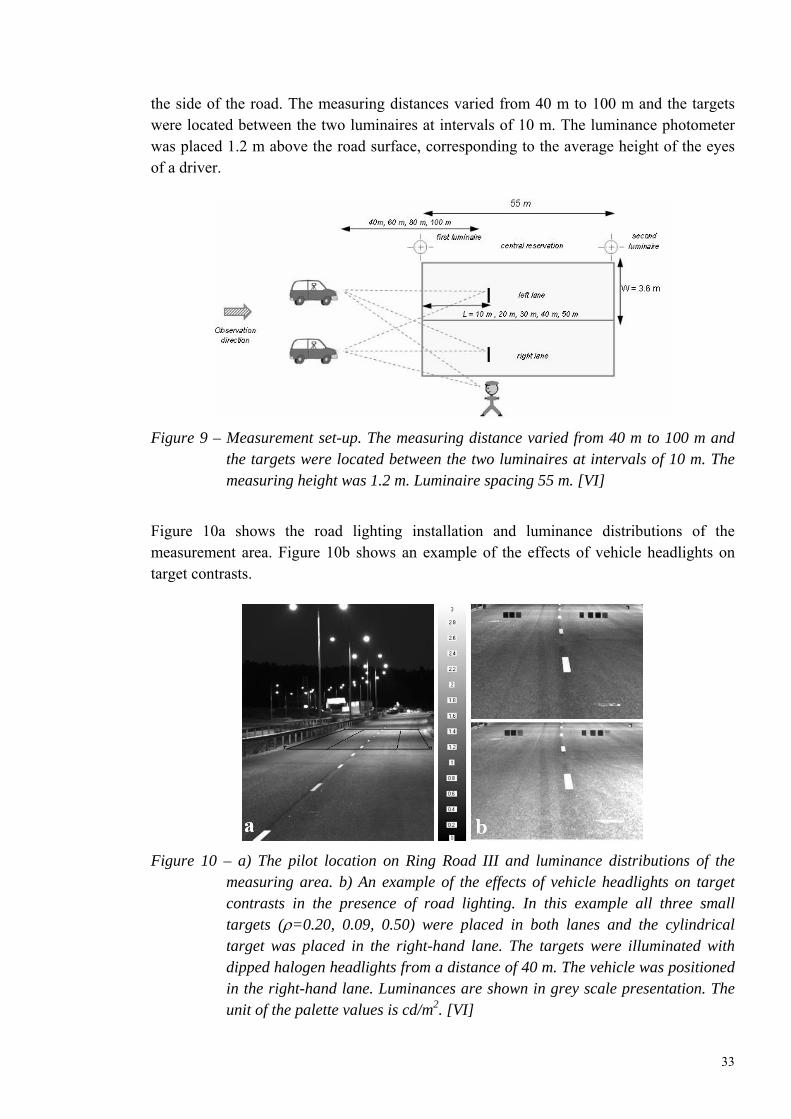
33
the side of the road. The measuring distances varied from 40 m to 100 m and the targets were located between the two luminaires at intervals of 10 m. The luminance photometer was placed 1.2 m above the road surface, corresponding to the average height of the eyes of a driver.
Figure 9 – Measurement set-up. The measuring distance varied from 40 m to 100 m and the targets were located between the two luminaires at intervals of 10 m. The measuring height was 1.2 m. Luminaire spacing 55 m. [VI]
Figure 10a shows the road lighting installation and luminance distributions of the measurement area. Figure 10b shows an example of the effects of vehicle headlights on target contrasts.
Figure 10 – a) The pilot location on Ring Road III and luminance distributions of the measuring area. b) An example of the effects of vehicle headlights on target contrasts in the presence of road lighting. In this example all three small targets (=0.20, 0.09, 0.50) were placed in both lanes and the cylindrical target was placed in the right-hand lane. The targets were illuminated with dipped halogen headlights from a distance of 40 m. The vehicle was positioned in the right-hand lane. Luminances are shown in grey scale presentation. The unit of the palette values is cd/m2. [VI]
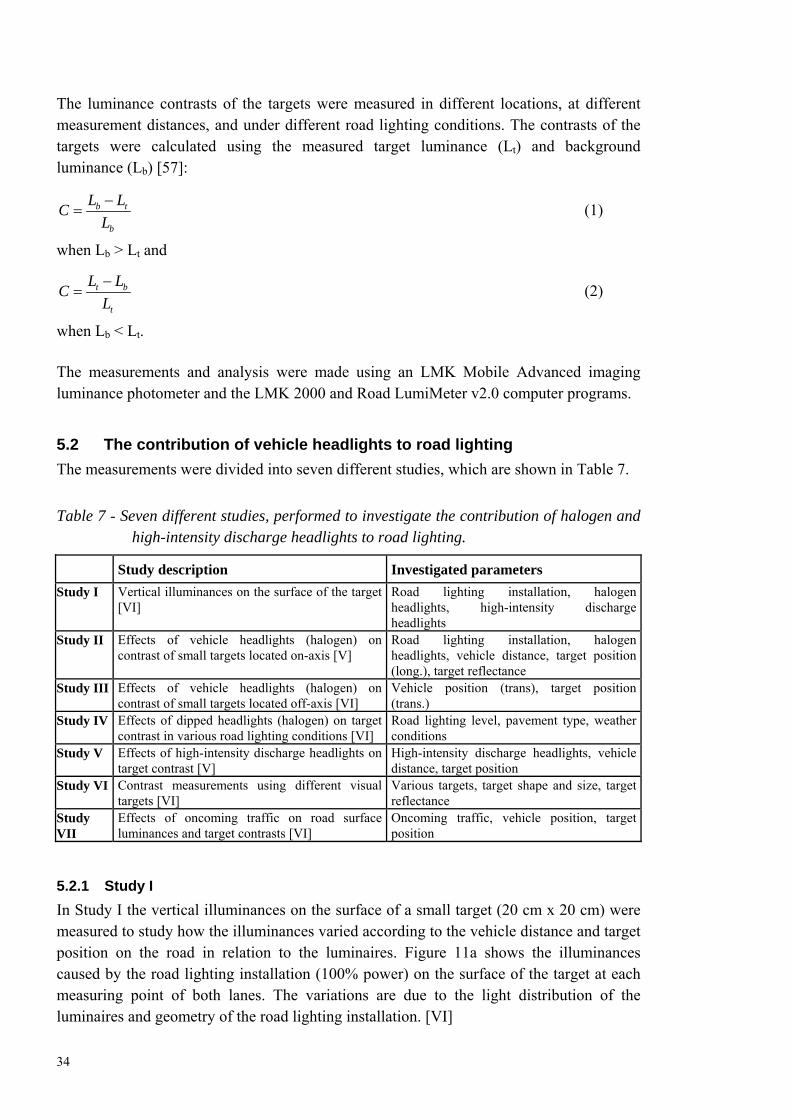
34
The luminance contrasts of the targets were measured in different locations, at different measurement distances, and under different road lighting conditions. The contrasts of the targets were calculated using the measured target luminance (Lt) and background luminance (Lb) [57]:
b t
b
L LC
L
(1)
when Lb > Lt and
t b
t
L LC
L
(2)
when Lb < Lt. The measurements and analysis were made using an LMK Mobile Advanced imaging luminance photometer and the LMK 2000 and Road LumiMeter v2.0 computer programs.
5.2 The contribution of vehicle headlights to road lighting
The measurements were divided into seven different studies, which are shown in Table 7.
Table 7 - Seven different studies, performed to investigate the contribution of halogen and high-intensity discharge headlights to road lighting.
Study description Investigated parameters
Study I Vertical illuminances on the surface of the target [VI]
Road lighting installation, halogen headlights, high-intensity discharge headlights
Study II Effects of vehicle headlights (halogen) on contrast of small targets located on-axis [V]
Road lighting installation, halogen headlights, vehicle distance, target position (long.), target reflectance
Study III Effects of vehicle headlights (halogen) on contrast of small targets located off-axis [VI]
Vehicle position (trans), target position (trans.)
Study IV Effects of dipped headlights (halogen) on target contrast in various road lighting conditions [VI]
Road lighting level, pavement type, weather conditions
Study V Effects of high-intensity discharge headlights on target contrast [V]
High-intensity discharge headlights, vehicle distance, target position
Study VI Contrast measurements using different visual targets [VI]
Various targets, target shape and size, target reflectance
Study VII
Effects of oncoming traffic on road surface luminances and target contrasts [VI]
Oncoming traffic, vehicle position, target position
5.2.1 Study I
In Study I the vertical illuminances on the surface of a small target (20 cm x 20 cm) were measured to study how the illuminances varied according to the vehicle distance and target position on the road in relation to the luminaires. Figure 11a shows the illuminances caused by the road lighting installation (100% power) on the surface of the target at each measuring point of both lanes. The variations are due to the light distribution of the luminaires and geometry of the road lighting installation. [VI]
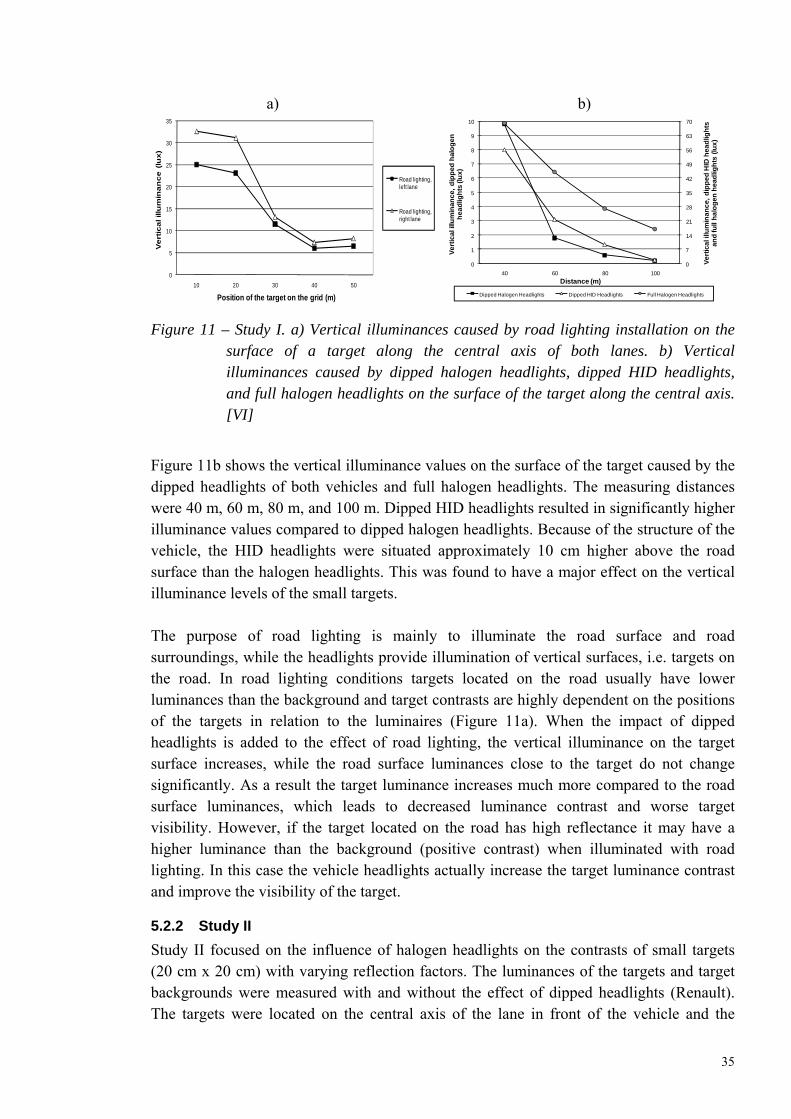
35
a) b)
0
5
10
15
20
25
30
35
10 20 30 40 50
Ve
rtic
al illu
min
an
ce
(lu
x)
Position of the target on the grid (m)
Road lighting, left lane
Road lighting, right lane
0
7
14
21
28
35
42
49
56
63
70
0
1
2
3
4
5
6
7
8
9
10
40 60 80 100
Ve
rtic
al i
llum
ina
nc
e,
dip
pe
d H
ID h
ea
dlig
hts
a
nd
full
ha
log
en
he
ad
ligh
ts (
lux
)
Ve
rtic
al i
llum
ina
nc
e,
dip
pe
d h
alo
ge
n
he
ad
ligh
ts (l
ux
)
Distance (m)
Dipped Halogen Headlights Dipped HID Headlights Full Halogen Headlights
Figure 11 – Study I. a) Vertical illuminances caused by road lighting installation on the surface of a target along the central axis of both lanes. b) Vertical illuminances caused by dipped halogen headlights, dipped HID headlights, and full halogen headlights on the surface of the target along the central axis. [VI]
Figure 11b shows the vertical illuminance values on the surface of the target caused by the dipped headlights of both vehicles and full halogen headlights. The measuring distances were 40 m, 60 m, 80 m, and 100 m. Dipped HID headlights resulted in significantly higher illuminance values compared to dipped halogen headlights. Because of the structure of the vehicle, the HID headlights were situated approximately 10 cm higher above the road surface than the halogen headlights. This was found to have a major effect on the vertical illuminance levels of the small targets. The purpose of road lighting is mainly to illuminate the road surface and road surroundings, while the headlights provide illumination of vertical surfaces, i.e. targets on the road. In road lighting conditions targets located on the road usually have lower luminances than the background and target contrasts are highly dependent on the positions of the targets in relation to the luminaires (Figure 11a). When the impact of dipped headlights is added to the effect of road lighting, the vertical illuminance on the target surface increases, while the road surface luminances close to the target do not change significantly. As a result the target luminance increases much more compared to the road surface luminances, which leads to decreased luminance contrast and worse target visibility. However, if the target located on the road has high reflectance it may have a higher luminance than the background (positive contrast) when illuminated with road lighting. In this case the vehicle headlights actually increase the target luminance contrast and improve the visibility of the target.
5.2.2 Study II
Study II focused on the influence of halogen headlights on the contrasts of small targets (20 cm x 20 cm) with varying reflection factors. The luminances of the targets and target backgrounds were measured with and without the effect of dipped headlights (Renault). The targets were located on the central axis of the lane in front of the vehicle and the
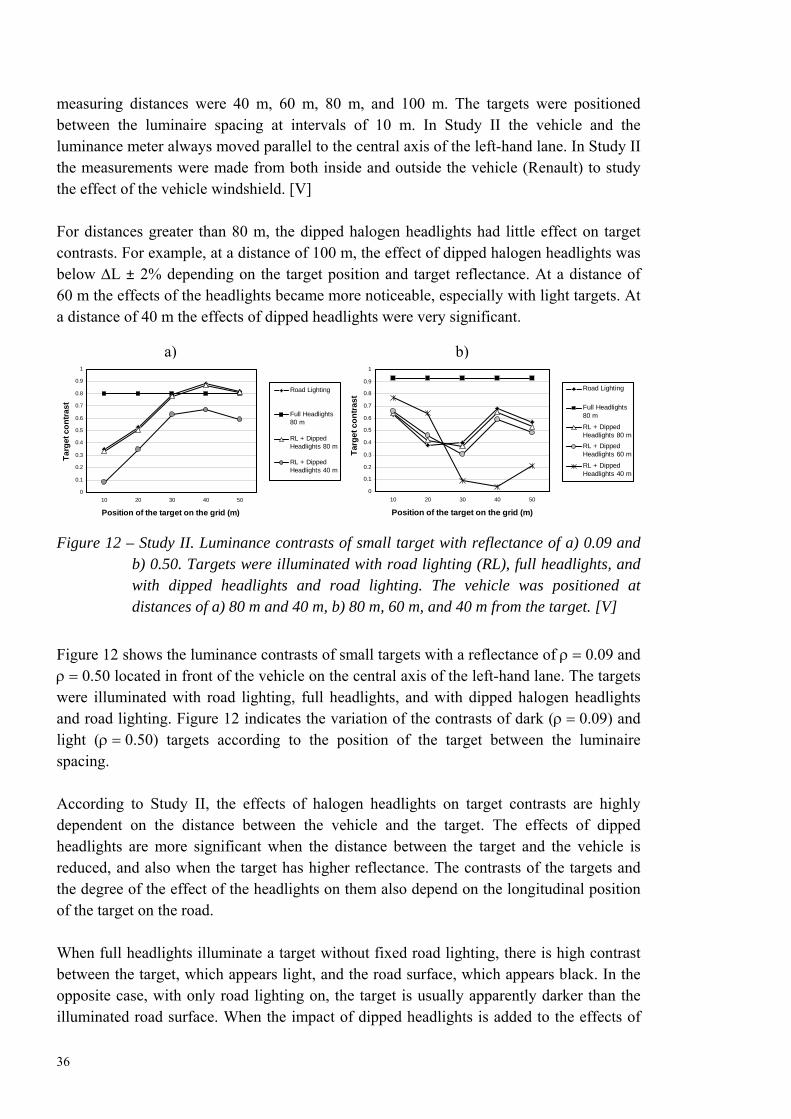
36
measuring distances were 40 m, 60 m, 80 m, and 100 m. The targets were positioned between the luminaire spacing at intervals of 10 m. In Study II the vehicle and the luminance meter always moved parallel to the central axis of the left-hand lane. In Study II the measurements were made from both inside and outside the vehicle (Renault) to study the effect of the vehicle windshield. [V] For distances greater than 80 m, the dipped halogen headlights had little effect on target contrasts. For example, at a distance of 100 m, the effect of dipped halogen headlights was below L ± 2% depending on the target position and target reflectance. At a distance of 60 m the effects of the headlights became more noticeable, especially with light targets. At a distance of 40 m the effects of dipped headlights were very significant.
a) b)
0
0.1
0.2
0.3
0.4
0.5
0.6
0.7
0.8
0.9
1
10 20 30 40 50
Position of the target on the grid (m)
Targ
et c
on
tras
t
Road Lighting
Full Headlights80 m
RL + DippedHeadlights 80 m
RL + DippedHeadlights 40 m
0
0.1
0.2
0.3
0.4
0.5
0.6
0.7
0.8
0.9
1
10 20 30 40 50
Position of the target on the grid (m)
Targ
et co
ntr
ast
Road Lighting
Full Headlights80 m
RL + DippedHeadlights 80 m
RL + DippedHeadlights 60 m
RL + DippedHeadlights 40 m
Figure 12 – Study II. Luminance contrasts of small target with reflectance of a) 0.09 and b) 0.50. Targets were illuminated with road lighting (RL), full headlights, and with dipped headlights and road lighting. The vehicle was positioned at distances of a) 80 m and 40 m, b) 80 m, 60 m, and 40 m from the target. [V]
Figure 12 shows the luminance contrasts of small targets with a reflectance of 0.09 and 0.50 located in front of the vehicle on the central axis of the left-hand lane. The targets were illuminated with road lighting, full headlights, and with dipped halogen headlights and road lighting. Figure 12 indicates the variation of the contrasts of dark (0.09) and light (0.50) targets according to the position of the target between the luminaire spacing. According to Study II, the effects of halogen headlights on target contrasts are highly dependent on the distance between the vehicle and the target. The effects of dipped headlights are more significant when the distance between the target and the vehicle is reduced, and also when the target has higher reflectance. The contrasts of the targets and the degree of the effect of the headlights on them also depend on the longitudinal position of the target on the road. When full headlights illuminate a target without fixed road lighting, there is high contrast between the target, which appears light, and the road surface, which appears black. In the opposite case, with only road lighting on, the target is usually apparently darker than the illuminated road surface. When the impact of dipped headlights is added to the effects of
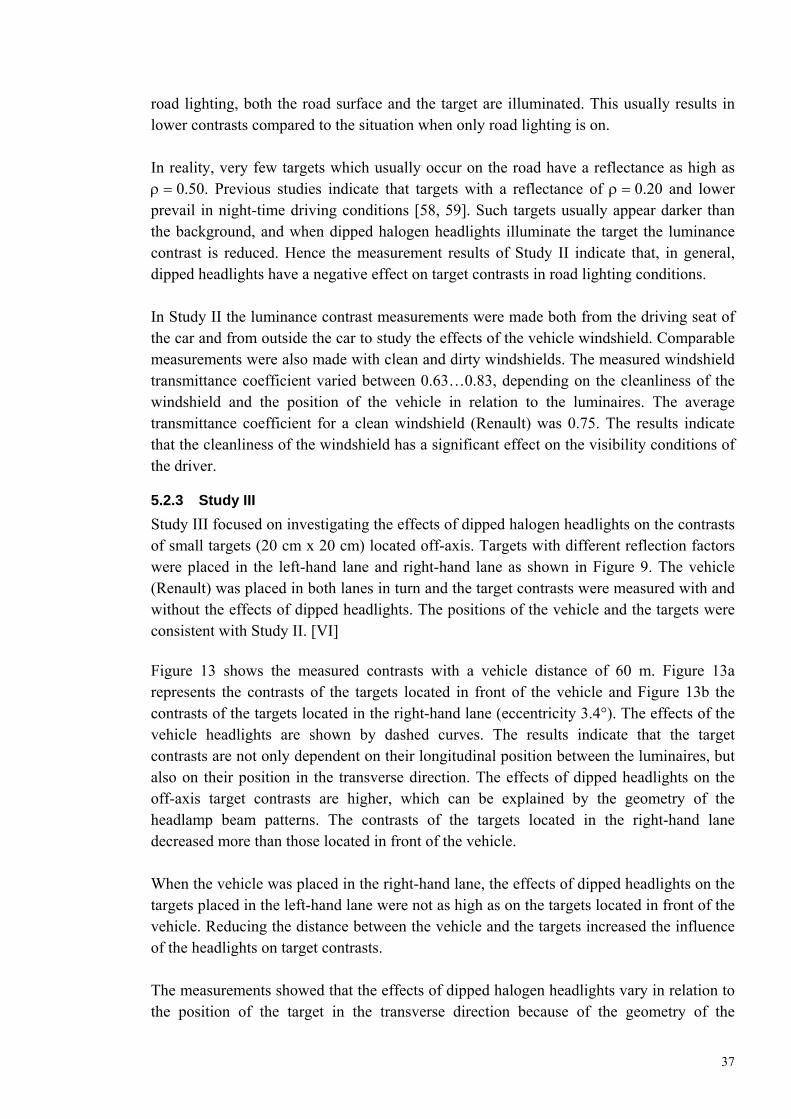
37
road lighting, both the road surface and the target are illuminated. This usually results in lower contrasts compared to the situation when only road lighting is on. In reality, very few targets which usually occur on the road have a reflectance as high as 0.50. Previous studies indicate that targets with a reflectance of 0.20 and lower prevail in night-time driving conditions [58, 59]. Such targets usually appear darker than the background, and when dipped halogen headlights illuminate the target the luminance contrast is reduced. Hence the measurement results of Study II indicate that, in general, dipped headlights have a negative effect on target contrasts in road lighting conditions. In Study II the luminance contrast measurements were made both from the driving seat of the car and from outside the car to study the effects of the vehicle windshield. Comparable measurements were also made with clean and dirty windshields. The measured windshield transmittance coefficient varied between 0.63…0.83, depending on the cleanliness of the windshield and the position of the vehicle in relation to the luminaires. The average transmittance coefficient for a clean windshield (Renault) was 0.75. The results indicate that the cleanliness of the windshield has a significant effect on the visibility conditions of the driver.
5.2.3 Study III
Study III focused on investigating the effects of dipped halogen headlights on the contrasts of small targets (20 cm x 20 cm) located off-axis. Targets with different reflection factors were placed in the left-hand lane and right-hand lane as shown in Figure 9. The vehicle (Renault) was placed in both lanes in turn and the target contrasts were measured with and without the effects of dipped headlights. The positions of the vehicle and the targets were consistent with Study II. [VI] Figure 13 shows the measured contrasts with a vehicle distance of 60 m. Figure 13a represents the contrasts of the targets located in front of the vehicle and Figure 13b the contrasts of the targets located in the right-hand lane (eccentricity 3.4°). The effects of the vehicle headlights are shown by dashed curves. The results indicate that the target contrasts are not only dependent on their longitudinal position between the luminaires, but also on their position in the transverse direction. The effects of dipped headlights on the off-axis target contrasts are higher, which can be explained by the geometry of the headlamp beam patterns. The contrasts of the targets located in the right-hand lane decreased more than those located in front of the vehicle. When the vehicle was placed in the right-hand lane, the effects of dipped headlights on the targets placed in the left-hand lane were not as high as on the targets located in front of the vehicle. Reducing the distance between the vehicle and the targets increased the influence of the headlights on target contrasts. The measurements showed that the effects of dipped halogen headlights vary in relation to the position of the target in the transverse direction because of the geometry of the
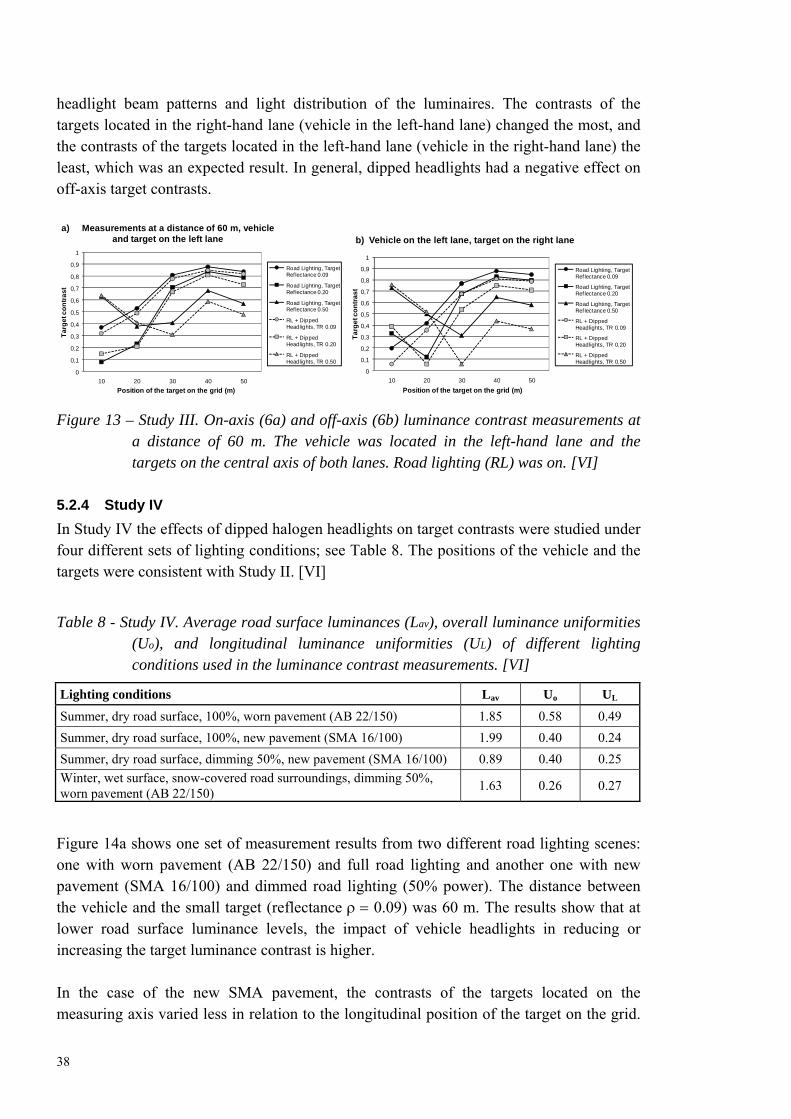
38
headlight beam patterns and light distribution of the luminaires. The contrasts of the targets located in the right-hand lane (vehicle in the left-hand lane) changed the most, and the contrasts of the targets located in the left-hand lane (vehicle in the right-hand lane) the least, which was an expected result. In general, dipped headlights had a negative effect on off-axis target contrasts.
0
0,1
0,2
0,3
0,4
0,5
0,6
0,7
0,8
0,9
1
10 20 30 40 50
Ta
rge
t co
ntr
as
t
Position of the target on the grid (m)
a) Measurements at a distance of 60 m, vehicle and target on the left lane
Road Lighting, Target Reflectance 0.09
Road Lighting, Target Reflectance 0.20
Road Lighting, Target Reflectance 0.50
RL + Dipped Headlights, TR 0.09
RL + Dipped Headlights, TR 0.20
RL + Dipped Headlights, TR 0.50
0
0,1
0,2
0,3
0,4
0,5
0,6
0,7
0,8
0,9
1
10 20 30 40 50
Ta
rge
t co
ntr
as
t
Position of the target on the grid (m)
b) Vehicle on the left lane, target on the right lane
Road Lighting, Target Ref lectance 0.09
Road Lighting, Target Ref lectance 0.20
Road Lighting, Target Ref lectance 0.50
RL + Dipped Headlights, TR 0.09
RL + Dipped Headlights, TR 0.20
RL + Dipped Headlights, TR 0.50
Figure 13 – Study III. On-axis (6a) and off-axis (6b) luminance contrast measurements at a distance of 60 m. The vehicle was located in the left-hand lane and the targets on the central axis of both lanes. Road lighting (RL) was on. [VI]
5.2.4 Study IV
In Study IV the effects of dipped halogen headlights on target contrasts were studied under four different sets of lighting conditions; see Table 8. The positions of the vehicle and the targets were consistent with Study II. [VI]
Table 8 - Study IV. Average road surface luminances (Lav), overall luminance uniformities (Uo), and longitudinal luminance uniformities (UL) of different lighting conditions used in the luminance contrast measurements. [VI]
Lighting conditions Lav Uo UL
Summer, dry road surface, 100%, worn pavement (AB 22/150) 1.85 0.58 0.49
Summer, dry road surface, 100%, new pavement (SMA 16/100) 1.99 0.40 0.24
Summer, dry road surface, dimming 50%, new pavement (SMA 16/100) 0.89 0.40 0.25
Winter, wet surface, snow-covered road surroundings, dimming 50%, worn pavement (AB 22/150)
1.63 0.26 0.27
Figure 14a shows one set of measurement results from two different road lighting scenes: one with worn pavement (AB 22/150) and full road lighting and another one with new pavement (SMA 16/100) and dimmed road lighting (50% power). The distance between the vehicle and the small target (reflectance 0.09) was 60 m. The results show that at lower road surface luminance levels, the impact of vehicle headlights in reducing or increasing the target luminance contrast is higher. In the case of the new SMA pavement, the contrasts of the targets located on the measuring axis varied less in relation to the longitudinal position of the target on the grid.
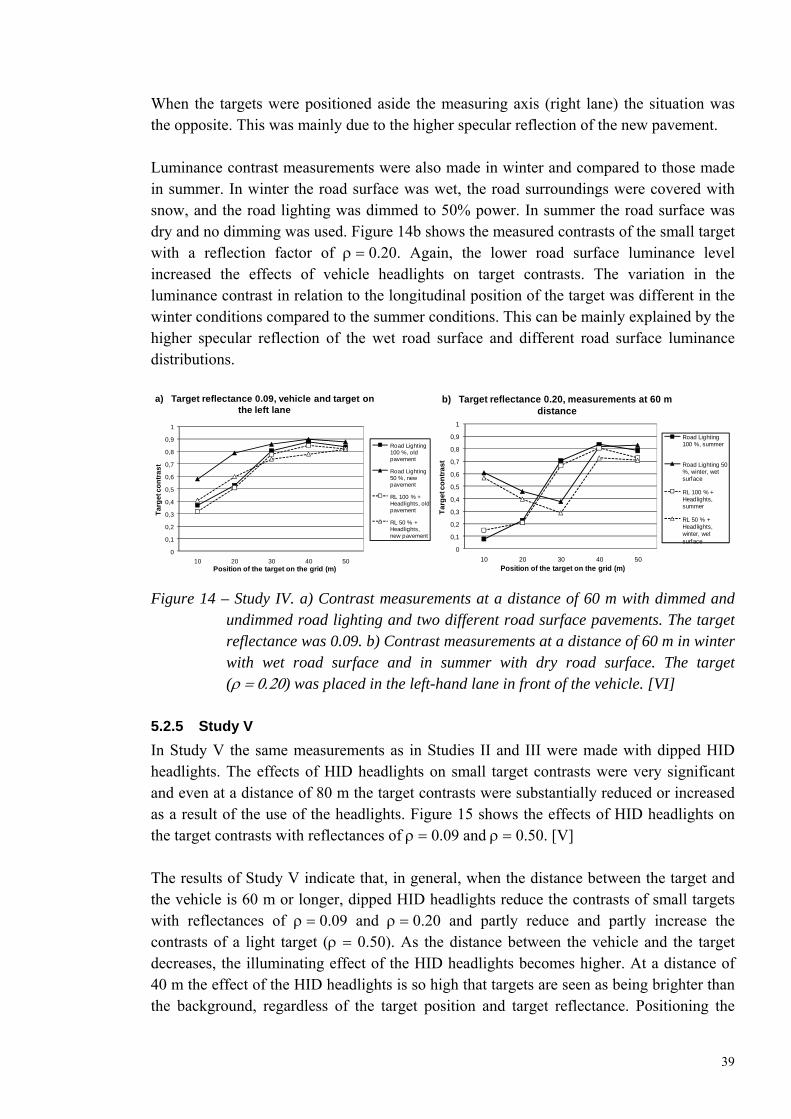
39
When the targets were positioned aside the measuring axis (right lane) the situation was the opposite. This was mainly due to the higher specular reflection of the new pavement. Luminance contrast measurements were also made in winter and compared to those made in summer. In winter the road surface was wet, the road surroundings were covered with snow, and the road lighting was dimmed to 50% power. In summer the road surface was dry and no dimming was used. Figure 14b shows the measured contrasts of the small target with a reflection factor of 0.20. Again, the lower road surface luminance level increased the effects of vehicle headlights on target contrasts. The variation in the luminance contrast in relation to the longitudinal position of the target was different in the winter conditions compared to the summer conditions. This can be mainly explained by the higher specular reflection of the wet road surface and different road surface luminance distributions.
0
0,1
0,2
0,3
0,4
0,5
0,6
0,7
0,8
0,9
1
10 20 30 40 50
Ta
rge
t co
ntr
as
t
Position of the target on the grid (m)
a) Target reflectance 0.09, vehicle and target on the left lane
Road Lighting 100 %, old pavement
Road Lighting 50 %, new pavement
RL 100 % + Headlights, old pavement
RL 50 % + Headlights, new pavement
0
0,1
0,2
0,3
0,4
0,5
0,6
0,7
0,8
0,9
1
10 20 30 40 50
Ta
rget c
on
tra
st
Position of the target on the grid (m)
b) Target reflectance 0.20, measurements at 60 m distance
Road Lighting 100 %, summer
Road Lighting 50 %, winter, wet surface
RL 100 % + Headlights, summer
RL 50 % + Headlights, winter, wet surface
Figure 14 – Study IV. a) Contrast measurements at a distance of 60 m with dimmed and undimmed road lighting and two different road surface pavements. The target reflectance was 0.09. b) Contrast measurements at a distance of 60 m in winter with wet road surface and in summer with dry road surface. The target () was placed in the left-hand lane in front of the vehicle. [VI]
5.2.5 Study V
In Study V the same measurements as in Studies II and III were made with dipped HID headlights. The effects of HID headlights on small target contrasts were very significant and even at a distance of 80 m the target contrasts were substantially reduced or increased as a result of the use of the headlights. Figure 15 shows the effects of HID headlights on the target contrasts with reflectances of 0.09 and 0.50. [V] The results of Study V indicate that, in general, when the distance between the target and the vehicle is 60 m or longer, dipped HID headlights reduce the contrasts of small targets with reflectances of 0.09 and 0.20 and partly reduce and partly increase the contrasts of a light target ( 0.50). As the distance between the vehicle and the target decreases, the illuminating effect of the HID headlights becomes higher. At a distance of 40 m the effect of the HID headlights is so high that targets are seen as being brighter than the background, regardless of the target position and target reflectance. Positioning the
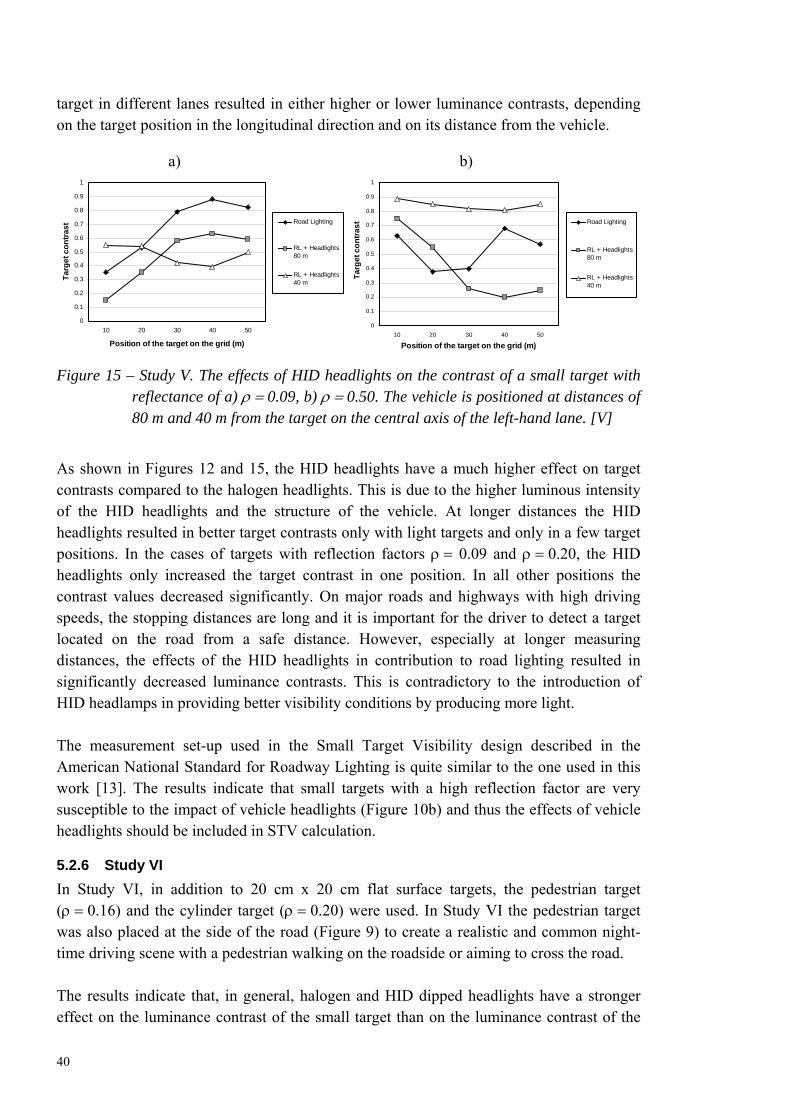
40
target in different lanes resulted in either higher or lower luminance contrasts, depending on the target position in the longitudinal direction and on its distance from the vehicle.
a) b)
0
0.1
0.2
0.3
0.4
0.5
0.6
0.7
0.8
0.9
1
10 20 30 40 50
Position of the target on the grid (m)
Ta
rge
t c
on
tras
t Road Lighting
RL + Headlights80 m
RL + Headlights40 m
0
0.1
0.2
0.3
0.4
0.5
0.6
0.7
0.8
0.9
1
10 20 30 40 50
Position of the target on the grid (m)T
arg
et
co
ntr
as
t Road Lighting
RL + Headlights80 m
RL + Headlights40 m
Figure 15 – Study V. The effects of HID headlights on the contrast of a small target with reflectance of a) 0.09, b) 0.50. The vehicle is positioned at distances of 80 m and 40 m from the target on the central axis of the left-hand lane. [V]
As shown in Figures 12 and 15, the HID headlights have a much higher effect on target contrasts compared to the halogen headlights. This is due to the higher luminous intensity of the HID headlights and the structure of the vehicle. At longer distances the HID headlights resulted in better target contrasts only with light targets and only in a few target positions. In the cases of targets with reflection factors 0.09 and 0.20, the HID headlights only increased the target contrast in one position. In all other positions the contrast values decreased significantly. On major roads and highways with high driving speeds, the stopping distances are long and it is important for the driver to detect a target located on the road from a safe distance. However, especially at longer measuring distances, the effects of the HID headlights in contribution to road lighting resulted in significantly decreased luminance contrasts. This is contradictory to the introduction of HID headlamps in providing better visibility conditions by producing more light. The measurement set-up used in the Small Target Visibility design described in the American National Standard for Roadway Lighting is quite similar to the one used in this work [13]. The results indicate that small targets with a high reflection factor are very susceptible to the impact of vehicle headlights (Figure 10b) and thus the effects of vehicle headlights should be included in STV calculation.
5.2.6 Study VI
In Study VI, in addition to 20 cm x 20 cm flat surface targets, the pedestrian target (0.16) and the cylinder target (0.20) were used. In Study VI the pedestrian target was also placed at the side of the road (Figure 9) to create a realistic and common night-time driving scene with a pedestrian walking on the roadside or aiming to cross the road. The results indicate that, in general, halogen and HID dipped headlights have a stronger effect on the luminance contrast of the small target than on the luminance contrast of the
41
pedestrian target. This can be partly explained by the lower reflection factor of the pedestrian target used in the measurements, but mainly this was due to the different sizes of the targets and the geometry of the beam patterns of the headlights. [VI] When the pedestrian target is illuminated with headlights, the luminances of the lower part of the target change more compared to those of the upper parts of the target. This is because headlight beam patterns have strict regulations concerning the light output above the horizontal plane. The small target creates only one luminance contrast with the background, while large targets like pedestrians usually have different luminance contrasts in different parts of their bodies as a result of the non-uniform target and background luminance distributions. The pedestrian target may also be seen partly against the road surface and partly against the roadside. Thus, despite the reduction of the contrast caused by the vehicle headlights, the pedestrian target may still remain visible because of the certain parts of the pedestrian target which may have an adequate enough luminance contrast. Luminance contrast measurements with the cylindrical target showed that the effects of vehicle headlights are also dependent on the shape of the target. Although the cylindrical target and the small target had the same reflection factors and were about the same size, the effects of the vehicle headlights on the contrasts of the cylinder were somewhat smaller. Also, the luminance contrasts of the cylindrical target were not as highly dependent on the target position on the road in relation to the luminaires as in the case of the small target.
5.2.7 Study VII
In actual traffic conditions oncoming traffic is also usually present. The headlights of oncoming vehicles illuminate the road surface and the target from behind, and thus also have an effect on target luminance contrasts. Study VII focused on investigating how road surface luminances and the luminance contrasts of small targets change when the headlights of an oncoming vehicle illuminate the road surface and the target. The oncoming vehicle (Renault) was placed at different distances from the targets in the longitudinal and in the transverse directions. The results showed that when the headlights illuminate the road surface, the contrasts of the targets which appear darker than the background increase to some extent. If the targets appear light against the background the effects are reversed. The effects of the headlights of an oncoming vehicle were highly dependent on the position of the targets and the vehicle. [VI] The results indicate that the headlights of an oncoming vehicle have, in general, a positive effect on the target luminance contrast. This follows the assumption that in road lighting conditions targets located on the road usually appear darker than the background [32-34]. However, this positive effect on the target luminance contrast caused by the headlights of an oncoming vehicle is significant only when the oncoming vehicle is located close to the target. In addition, the headlights of an oncoming vehicle may also result in substantially reduced driver visibility conditions because of glare.
42
5.3 Conclusions
The measurements indicate that, in general, the use of dipped vehicle headlights in the presence of road lighting does not improve the visibility of various targets located on the road. In fact, in most cases when the targets appeared darker than the background dipped headlights reduced target contrasts and in some cases they made the target merge into the background. The effects of dipped headlights were highly dependent on the position of the vehicle, location of the target in relation to the luminaires, target reflectance, target shape and size, vehicle type and headlight type, road lighting installation, road characteristics, and weather conditions. [V, VI] The dipped halogen headlights had little effect on target contrasts when the distance between the target and the vehicle was more than 80 m. However, with decreasing distance, the effect of the headlights became more significant. Road lighting usually resulted in lower target luminance contrasts compared to the situation when only the full headlights were on. However, in the case of the full headlights, the target contrasts were positive and the target appeared substantially lighter than the background, while in the case of the road lighting the target appeared darker than the road surface and the contrasts were negative. When the road lighting and dipped headlights were both on, the luminance contrasts were usually lower compared to the situation with only the road lighting on. The dipped HID headlights had more significant effects on target contrasts than the dipped halogen headlights. At longer distances (≥60 m) the negative impact of the dipped HID headlights on target visibility was significantly higher compared to that of the halogen headlights. At a short distance (40 m) the effects of the HID headlights were so strong that even dark targets usually appeared lighter than the background and in most cases the HID headlights increased the luminance contrasts of the targets. The dipped headlights had quite marginal effects on road surface luminances when the distance between the vehicle and the measurement area was more than 60 m. Only the HID headlights at a distance of 40 m had a significant effect on road surface luminances. It can be argued that there is an obvious conflicting effect in the use of vehicle headlights in road lighting environments. One scenario for avoiding this effect could be the use of parking lights instead of dipped headlights in the presence of road lighting. This may, however, result in other unwanted effects concerning traffic safety. The use of parking lights may reduce the visibility of other vehicles in traffic and also the illumination of the road surroundings will become completely dependent on the road lighting installed. Furthermore, the visibility of traffic signs would be reduced. Another and perhaps more realistic scenario could be the use of LED headlights in the presence of road lighting. The LED headlights would not particularly illuminate the road surface ahead or vertical surfaces on the road but make the vehicle visible to other drivers and also provide the required illumination for traffic signs. Switching the headlights on and off would have to be done automatically on the basis of the prevailing lighting conditions.
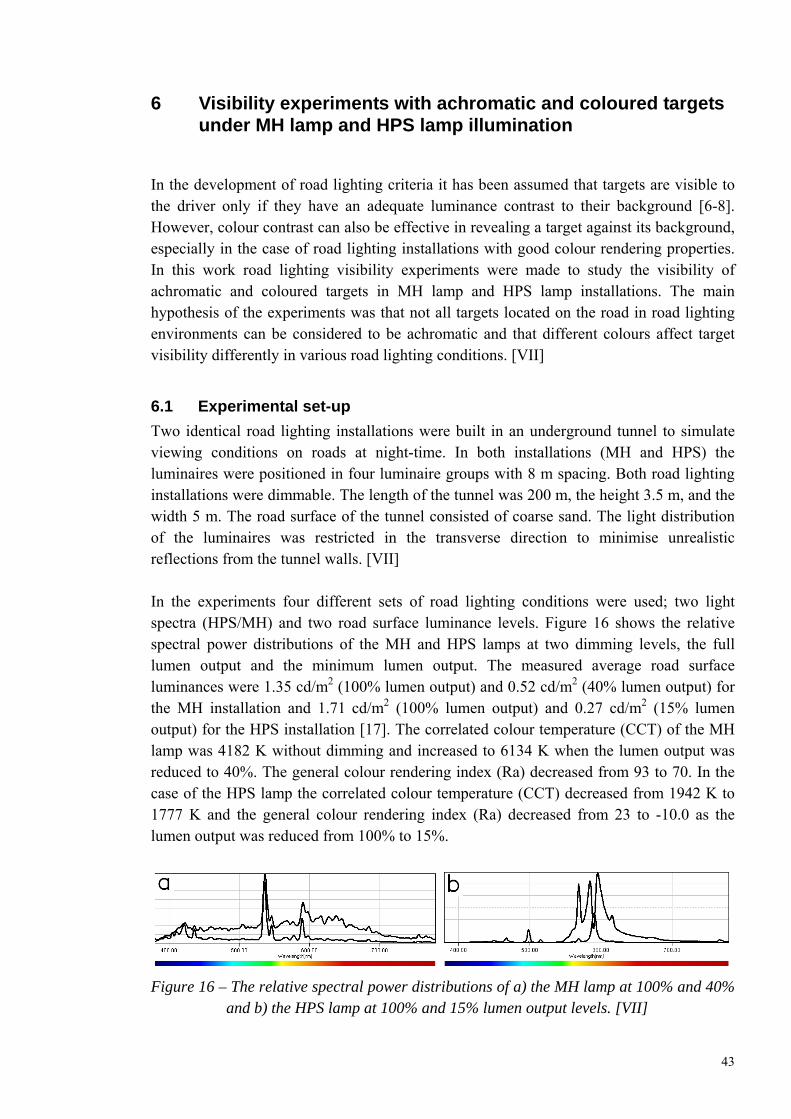
43
6 Visibility experiments with achromatic and coloured targets under MH lamp and HPS lamp illumination
In the development of road lighting criteria it has been assumed that targets are visible to the driver only if they have an adequate luminance contrast to their background [6-8]. However, colour contrast can also be effective in revealing a target against its background, especially in the case of road lighting installations with good colour rendering properties. In this work road lighting visibility experiments were made to study the visibility of achromatic and coloured targets in MH lamp and HPS lamp installations. The main hypothesis of the experiments was that not all targets located on the road in road lighting environments can be considered to be achromatic and that different colours affect target visibility differently in various road lighting conditions. [VII]
6.1 Experimental set-up
Two identical road lighting installations were built in an underground tunnel to simulate viewing conditions on roads at night-time. In both installations (MH and HPS) the luminaires were positioned in four luminaire groups with 8 m spacing. Both road lighting installations were dimmable. The length of the tunnel was 200 m, the height 3.5 m, and the width 5 m. The road surface of the tunnel consisted of coarse sand. The light distribution of the luminaires was restricted in the transverse direction to minimise unrealistic reflections from the tunnel walls. [VII] In the experiments four different sets of road lighting conditions were used; two light spectra (HPS/MH) and two road surface luminance levels. Figure 16 shows the relative spectral power distributions of the MH and HPS lamps at two dimming levels, the full lumen output and the minimum lumen output. The measured average road surface luminances were 1.35 cd/m2 (100% lumen output) and 0.52 cd/m2 (40% lumen output) for the MH installation and 1.71 cd/m2 (100% lumen output) and 0.27 cd/m2 (15% lumen output) for the HPS installation [17]. The correlated colour temperature (CCT) of the MH lamp was 4182 K without dimming and increased to 6134 K when the lumen output was reduced to 40%. The general colour rendering index (Ra) decreased from 93 to 70. In the case of the HPS lamp the correlated colour temperature (CCT) decreased from 1942 K to 1777 K and the general colour rendering index (Ra) decreased from 23 to -10.0 as the lumen output was reduced from 100% to 15%.
Figure 16 – The relative spectral power distributions of a) the MH lamp at 100% and 40% and b) the HPS lamp at 100% and 15% lumen output levels. [VII]
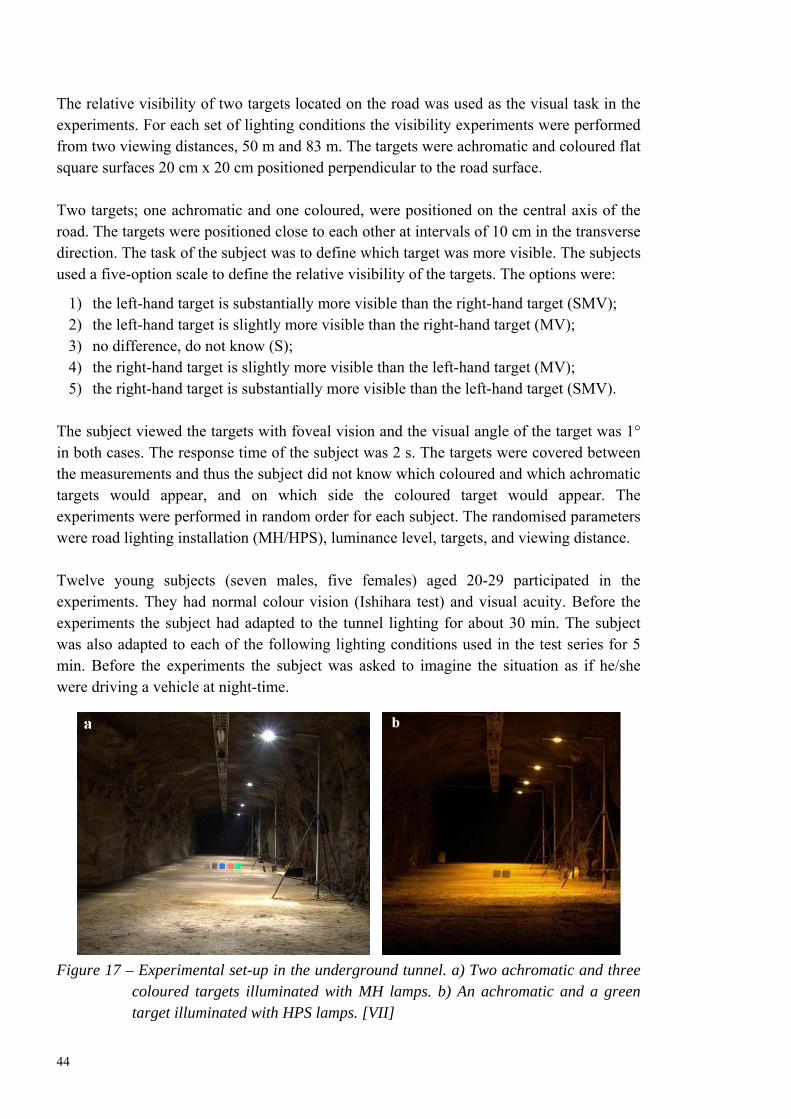
44
The relative visibility of two targets located on the road was used as the visual task in the experiments. For each set of lighting conditions the visibility experiments were performed from two viewing distances, 50 m and 83 m. The targets were achromatic and coloured flat square surfaces 20 cm x 20 cm positioned perpendicular to the road surface. Two targets; one achromatic and one coloured, were positioned on the central axis of the road. The targets were positioned close to each other at intervals of 10 cm in the transverse direction. The task of the subject was to define which target was more visible. The subjects used a five-option scale to define the relative visibility of the targets. The options were:
1) the left-hand target is substantially more visible than the right-hand target (SMV); 2) the left-hand target is slightly more visible than the right-hand target (MV); 3) no difference, do not know (S); 4) the right-hand target is slightly more visible than the left-hand target (MV); 5) the right-hand target is substantially more visible than the left-hand target (SMV).
The subject viewed the targets with foveal vision and the visual angle of the target was 1° in both cases. The response time of the subject was 2 s. The targets were covered between the measurements and thus the subject did not know which coloured and which achromatic targets would appear, and on which side the coloured target would appear. The experiments were performed in random order for each subject. The randomised parameters were road lighting installation (MH/HPS), luminance level, targets, and viewing distance. Twelve young subjects (seven males, five females) aged 20-29 participated in the experiments. They had normal colour vision (Ishihara test) and visual acuity. Before the experiments the subject had adapted to the tunnel lighting for about 30 min. The subject was also adapted to each of the following lighting conditions used in the test series for 5 min. Before the experiments the subject was asked to imagine the situation as if he/she were driving a vehicle at night-time.
Figure 17 – Experimental set-up in the underground tunnel. a) Two achromatic and three coloured targets illuminated with MH lamps. b) An achromatic and a green target illuminated with HPS lamps. [VII]
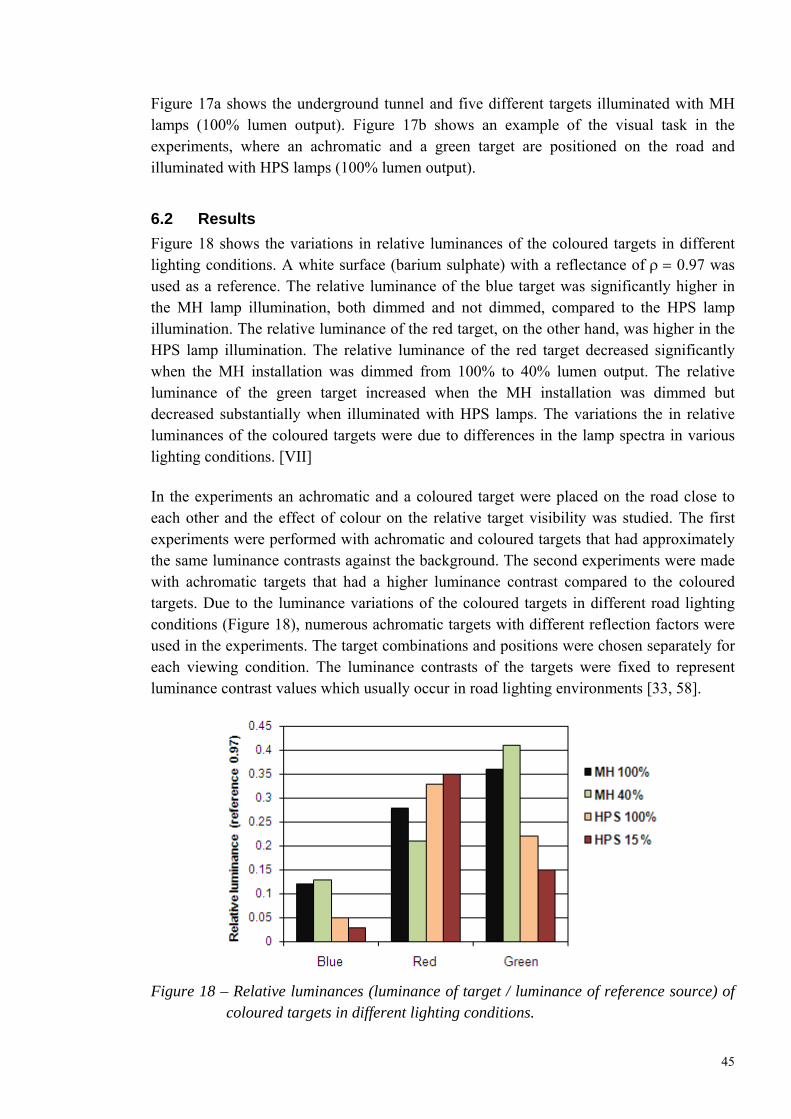
45
Figure 17a shows the underground tunnel and five different targets illuminated with MH lamps (100% lumen output). Figure 17b shows an example of the visual task in the experiments, where an achromatic and a green target are positioned on the road and illuminated with HPS lamps (100% lumen output).
6.2 Results
Figure 18 shows the variations in relative luminances of the coloured targets in different lighting conditions. A white surface (barium sulphate) with a reflectance of 0.97 was used as a reference. The relative luminance of the blue target was significantly higher in the MH lamp illumination, both dimmed and not dimmed, compared to the HPS lamp illumination. The relative luminance of the red target, on the other hand, was higher in the HPS lamp illumination. The relative luminance of the red target decreased significantly when the MH installation was dimmed from 100% to 40% lumen output. The relative luminance of the green target increased when the MH installation was dimmed but decreased substantially when illuminated with HPS lamps. The variations the in relative luminances of the coloured targets were due to differences in the lamp spectra in various lighting conditions. [VII] In the experiments an achromatic and a coloured target were placed on the road close to each other and the effect of colour on the relative target visibility was studied. The first experiments were performed with achromatic and coloured targets that had approximately the same luminance contrasts against the background. The second experiments were made with achromatic targets that had a higher luminance contrast compared to the coloured targets. Due to the luminance variations of the coloured targets in different road lighting conditions (Figure 18), numerous achromatic targets with different reflection factors were used in the experiments. The target combinations and positions were chosen separately for each viewing condition. The luminance contrasts of the targets were fixed to represent luminance contrast values which usually occur in road lighting environments [33, 58].
Figure 18 – Relative luminances (luminance of target / luminance of reference source) of coloured targets in different lighting conditions.
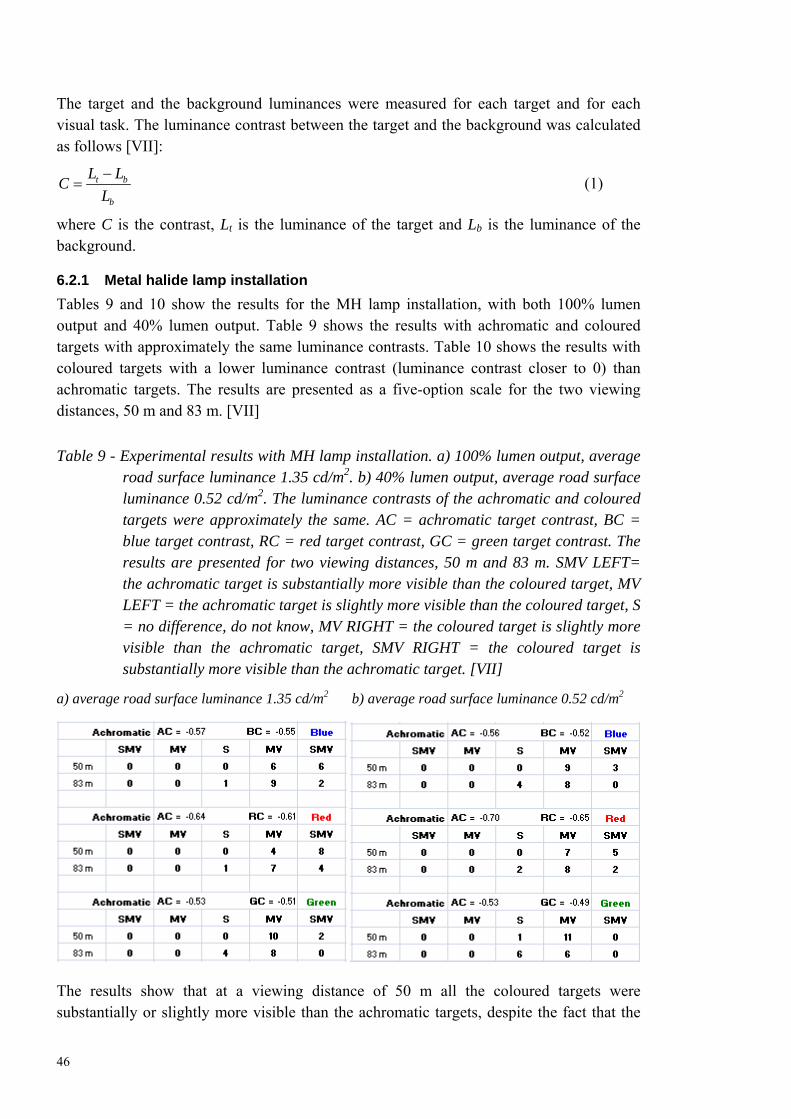
46
The target and the background luminances were measured for each target and for each visual task. The luminance contrast between the target and the background was calculated as follows [VII]:
t b
b
L LC
L
(1)
where C is the contrast, Lt is the luminance of the target and Lb is the luminance of the background.
6.2.1 Metal halide lamp installation
Tables 9 and 10 show the results for the MH lamp installation, with both 100% lumen output and 40% lumen output. Table 9 shows the results with achromatic and coloured targets with approximately the same luminance contrasts. Table 10 shows the results with coloured targets with a lower luminance contrast (luminance contrast closer to 0) than achromatic targets. The results are presented as a five-option scale for the two viewing distances, 50 m and 83 m. [VII]
Table 9 - Experimental results with MH lamp installation. a) 100% lumen output, average road surface luminance 1.35 cd/m2. b) 40% lumen output, average road surface luminance 0.52 cd/m2. The luminance contrasts of the achromatic and coloured targets were approximately the same. AC = achromatic target contrast, BC = blue target contrast, RC = red target contrast, GC = green target contrast. The results are presented for two viewing distances, 50 m and 83 m. SMV LEFT= the achromatic target is substantially more visible than the coloured target, MV LEFT = the achromatic target is slightly more visible than the coloured target, S = no difference, do not know, MV RIGHT = the coloured target is slightly more visible than the achromatic target, SMV RIGHT = the coloured target is substantially more visible than the achromatic target. [VII]
a) average road surface luminance 1.35 cd/m2 b) average road surface luminance 0.52 cd/m2
The results show that at a viewing distance of 50 m all the coloured targets were substantially or slightly more visible than the achromatic targets, despite the fact that the
47
luminance contrasts of both targets were approximately the same (Table 9a). The colour red had the highest effect on the relative visibility of the targets. The differences in the visibility ratings between the achromatic and coloured target were the smallest for the green target. The effects of colour on the visibility of the targets decreased when the viewing distance was increased to 83 m. The differences in the visibility ratings between an achromatic and coloured target were lower compared to the results at the viewing distance of 50 m. Even so, the coloured targets were mostly rated as more visible than the achromatic targets. Also for the 83 m distance, the colour red had the highest effect on the relative visibility of the targets. Colour discrimination is best in the fovea and decreases toward the periphery, where there are fewer cones. However, colour discrimination for very small fields (1/3º or less) presented to the fovea is not so good, because there are very few short wavelength cones in the middle of the fovea [60]. With increasing viewing distance the visual size of the target decreases and this might be one possible explanation of why the increase of the viewing distance reduced the effects of colours (especially blue) on the visibility of the target. The effects of target colour on target visibility decreased when the MH installation was dimmed to 40% of the total lumen output (Table 9b). The changes can mainly be explained by the different light spectra, lower general colour rendering index (Ra), and lower luminance level. The coloured targets were mainly rated as slightly more visible than the achromatic targets. Table 10 shows experimental results for the same MH lighting conditions and with the same coloured targets as in Table 9. However, in these experiments the luminance contrasts of the achromatic targets were higher (closer to -1) compared to the luminance contrasts of the coloured targets. While the luminance contrasts of the coloured targets were slightly lower compared to those of the achromatic targets, the coloured targets were still rated as substantially or slightly more visible than the achromatic targets. When the absolute luminance contrast values of the targets were reduced to closer to 0, the red target still remained substantially more visible than the achromatic target despite the large difference in the luminance contrasts (Table 10a). Although the luminance contrast of the red target was very low, the target luminance was high and the red colour was clearly visible. Hence, the red target resulted mostly in better relative visibility compared to the achromatic target. Similar results were found for the green target. When the luminance contrast value of the green target was close to 0 and the target was visible only because of the colour contrast, the green target was rated as substantially more visible or as slightly more visible than the achromatic target, although the luminance contrast of the achromatic target was C = -0.32
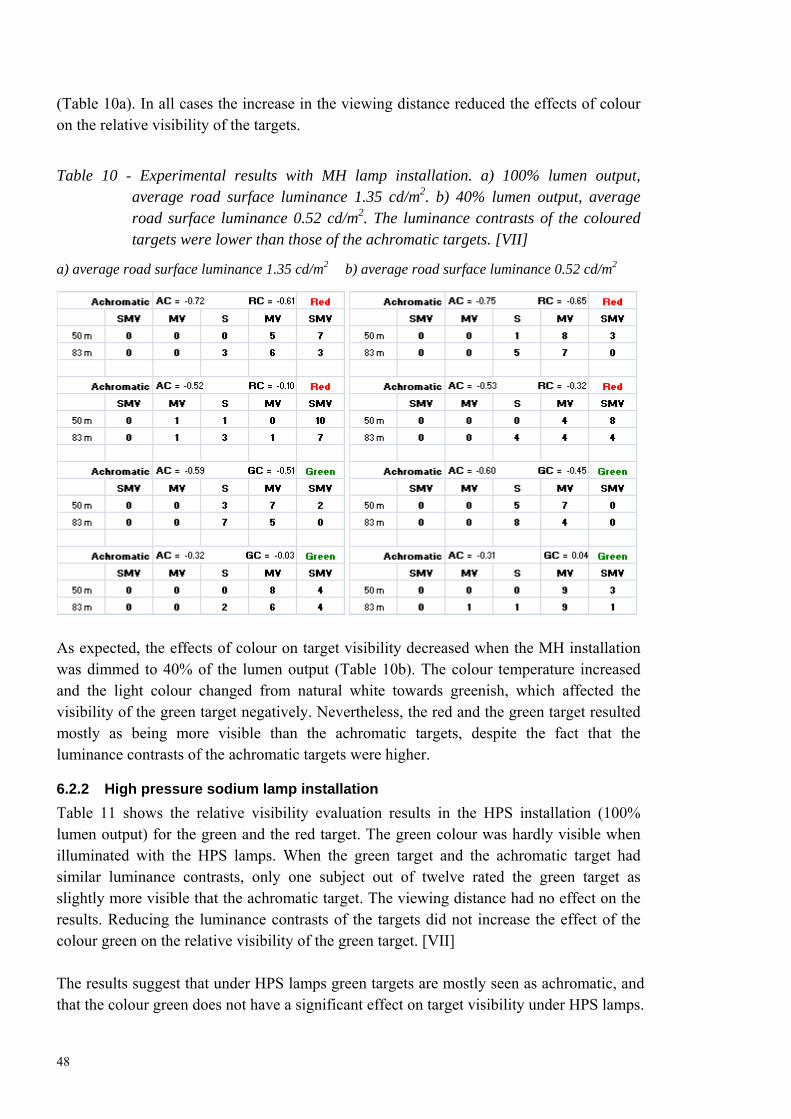
48
(Table 10a). In all cases the increase in the viewing distance reduced the effects of colour on the relative visibility of the targets.
Table 10 - Experimental results with MH lamp installation. a) 100% lumen output, average road surface luminance 1.35 cd/m2. b) 40% lumen output, average road surface luminance 0.52 cd/m2. The luminance contrasts of the coloured targets were lower than those of the achromatic targets. [VII]
a) average road surface luminance 1.35 cd/m2 b) average road surface luminance 0.52 cd/m2
As expected, the effects of colour on target visibility decreased when the MH installation was dimmed to 40% of the lumen output (Table 10b). The colour temperature increased and the light colour changed from natural white towards greenish, which affected the visibility of the green target negatively. Nevertheless, the red and the green target resulted mostly as being more visible than the achromatic targets, despite the fact that the luminance contrasts of the achromatic targets were higher.
6.2.2 High pressure sodium lamp installation
Table 11 shows the relative visibility evaluation results in the HPS installation (100% lumen output) for the green and the red target. The green colour was hardly visible when illuminated with the HPS lamps. When the green target and the achromatic target had similar luminance contrasts, only one subject out of twelve rated the green target as slightly more visible that the achromatic target. The viewing distance had no effect on the results. Reducing the luminance contrasts of the targets did not increase the effect of the colour green on the relative visibility of the green target. [VII] The results suggest that under HPS lamps green targets are mostly seen as achromatic, and that the colour green does not have a significant effect on target visibility under HPS lamps.
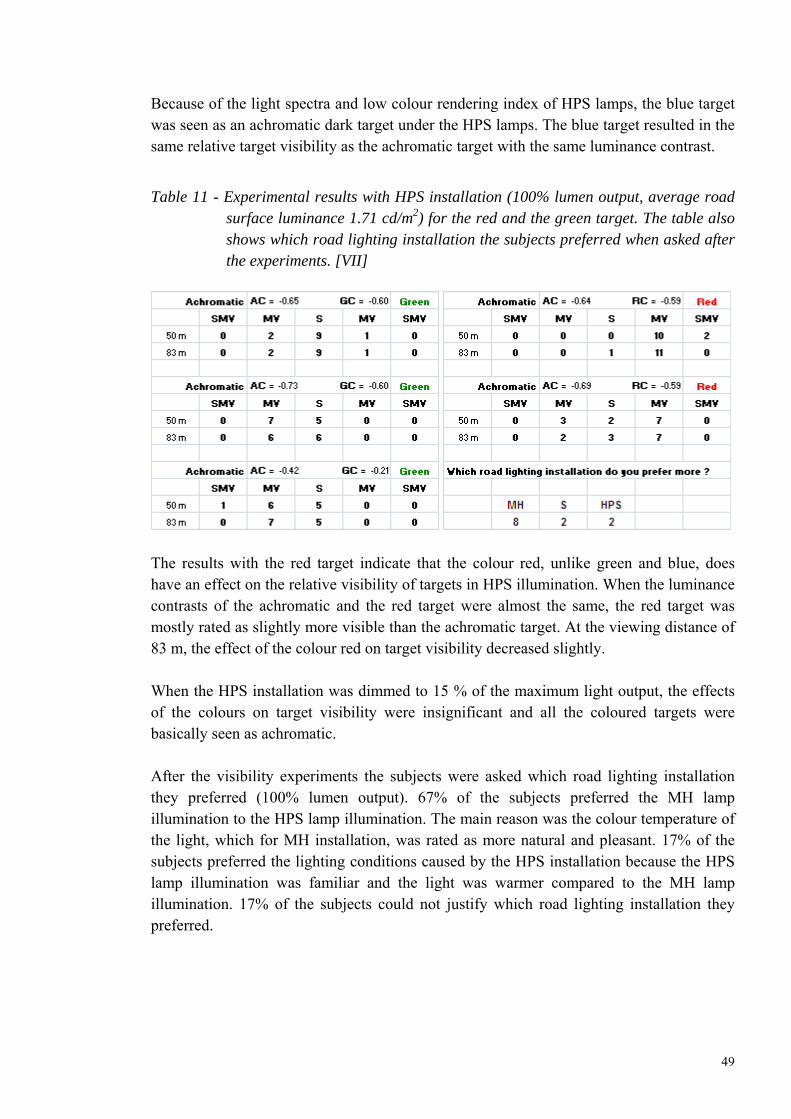
49
Because of the light spectra and low colour rendering index of HPS lamps, the blue target was seen as an achromatic dark target under the HPS lamps. The blue target resulted in the same relative target visibility as the achromatic target with the same luminance contrast.
Table 11 - Experimental results with HPS installation (100% lumen output, average road surface luminance 1.71 cd/m2) for the red and the green target. The table also shows which road lighting installation the subjects preferred when asked after the experiments. [VII]
The results with the red target indicate that the colour red, unlike green and blue, does have an effect on the relative visibility of targets in HPS illumination. When the luminance contrasts of the achromatic and the red target were almost the same, the red target was mostly rated as slightly more visible than the achromatic target. At the viewing distance of 83 m, the effect of the colour red on target visibility decreased slightly. When the HPS installation was dimmed to 15 % of the maximum light output, the effects of the colours on target visibility were insignificant and all the coloured targets were basically seen as achromatic. After the visibility experiments the subjects were asked which road lighting installation they preferred (100% lumen output). 67% of the subjects preferred the MH lamp illumination to the HPS lamp illumination. The main reason was the colour temperature of the light, which for MH installation, was rated as more natural and pleasant. 17% of the subjects preferred the lighting conditions caused by the HPS installation because the HPS lamp illumination was familiar and the light was warmer compared to the MH lamp illumination. 17% of the subjects could not justify which road lighting installation they preferred.
50
6.3 Conclusions
The results of the visibility experiments show that colours have a major effect on target visibility if the road is illuminated with a light source with adequate colour rendering properties. The results indicate that in MH lamp illumination the target visibility is not only defined by the luminance contrast but rather by the combination of colour contrast and luminance contrast. It can also be argued that the combination of colour and luminance contrast seems to be a good way of revealing targets on a road. [VII] Under MH lamp illumination, at a viewing distance of 50 m, all the coloured targets were substantially or slightly more visible than the achromatic targets despite the fact that the luminance contrasts of both targets were approximately the same. When the luminance contrasts of the achromatic targets were higher compared to the luminance contrasts of the coloured targets, the coloured targets were still rated as more visible than the achromatic targets. Under HPS lamp illumination only the colour red had an influence on the visibility of the target. The results suggest that especially the colour red has a significant effect on target visibility. One explanation for this might be that the colour red is usually experienced as a strong stimulus and also because it is commonly used as a negative colour for traffic signs and traffic lights. The colour green had the lowest effect on relative target visibility, which might be partly due to its use as a positive colour for traffic lights. Colours had a more significant effect on target visibility when illuminated with the MH lamps, compared to the HPS lamps. Dimming and an increase in the viewing distance reduced the effects of colour on relative target visibility. In practice, it is very difficult to determine how the effects of colour contrast relate to the safety of the driver in various traffic conditions. It is not known if the use of light sources with good colour rendering properties can actually reduce traffic accident rates by improving the visibility of coloured targets. A number of extended field measurements and traffic statistics are needed to determine the overall effects of colours and colour contrasts on target visibility in road lighting environments. The visibility experiments indicate that in road lighting conditions, when a coloured target is placed on the road, the visibility of such a target is not necessarily the same compared to a similar achromatic target with the same luminance contrast. In the experiments the colours seemed to have only positive effects on relative target visibility. If this is also true for other colours than those used in the experiments, then it can be concluded that if the road lighting conditions are adequate for the driver to see an achromatic target, one will also be able to see a coloured target. In consequence, if light sources with adequate colour rendering properties are used to illuminate roads and, especially, footways and cycleways, lighting levels can be reduced to some extent on the basis of the idea of better target visibility as a result of colour contrasts and facial recognition.
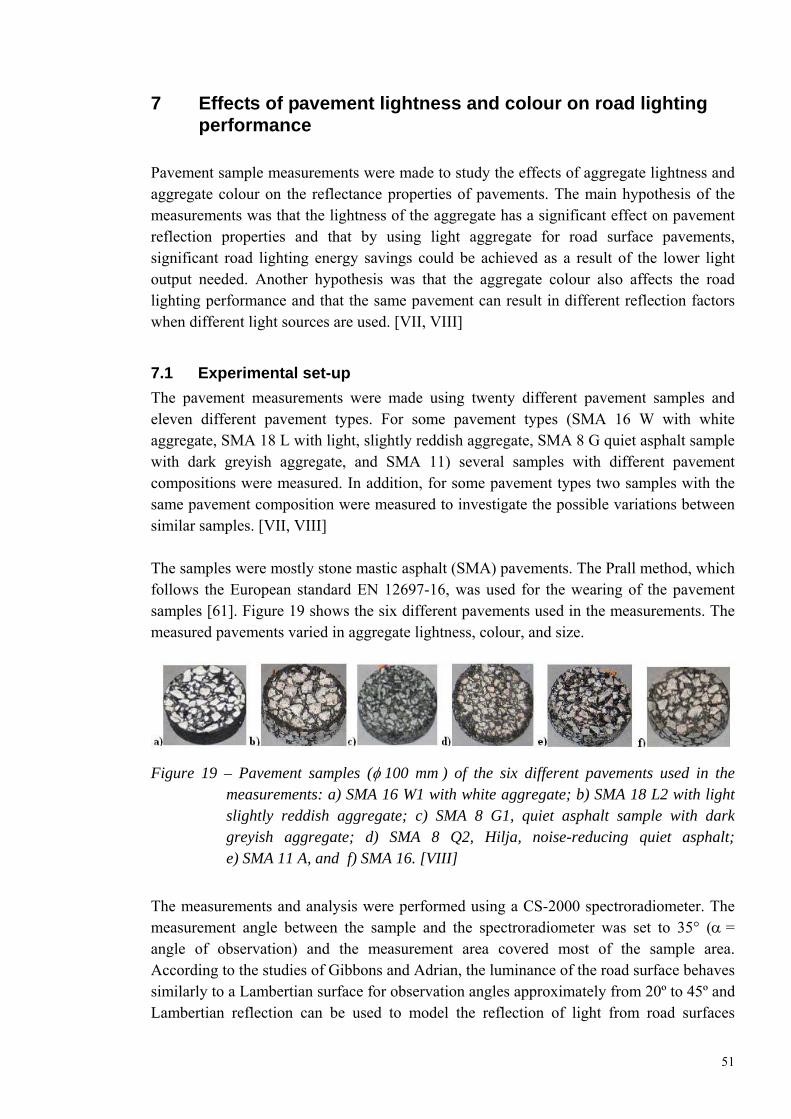
51
7 Effects of pavement lightness and colour on road lighting performance
Pavement sample measurements were made to study the effects of aggregate lightness and aggregate colour on the reflectance properties of pavements. The main hypothesis of the measurements was that the lightness of the aggregate has a significant effect on pavement reflection properties and that by using light aggregate for road surface pavements, significant road lighting energy savings could be achieved as a result of the lower light output needed. Another hypothesis was that the aggregate colour also affects the road lighting performance and that the same pavement can result in different reflection factors when different light sources are used. [VII, VIII]
7.1 Experimental set-up
The pavement measurements were made using twenty different pavement samples and eleven different pavement types. For some pavement types (SMA 16 W with white aggregate, SMA 18 L with light, slightly reddish aggregate, SMA 8 G quiet asphalt sample with dark greyish aggregate, and SMA 11) several samples with different pavement compositions were measured. In addition, for some pavement types two samples with the same pavement composition were measured to investigate the possible variations between similar samples. [VII, VIII] The samples were mostly stone mastic asphalt (SMA) pavements. The Prall method, which follows the European standard EN 12697-16, was used for the wearing of the pavement samples [61]. Figure 19 shows the six different pavements used in the measurements. The measured pavements varied in aggregate lightness, colour, and size.
Figure 19 – Pavement samples (100 mm) of the six different pavements used in the measurements: a) SMA 16 W1 with white aggregate; b) SMA 18 L2 with light slightly reddish aggregate; c) SMA 8 G1, quiet asphalt sample with dark greyish aggregate; d) SMA 8 Q2, Hilja, noise-reducing quiet asphalt; e) SMA 11 A, and f) SMA 16. [VIII]
The measurements and analysis were performed using a CS-2000 spectroradiometer. The measurement angle between the sample and the spectroradiometer was set to 35° (= angle of observation) and the measurement area covered most of the sample area. According to the studies of Gibbons and Adrian, the luminance of the road surface behaves similarly to a Lambertian surface for observation angles approximately from 20º to 45º and Lambertian reflection can be used to model the reflection of light from road surfaces
52
within these limits [62]. The spectroradiometer was placed on the same longitudinal axis as the pavement samples. The measurement accuracy of the CS-2000 spectroradiometer is ± 2% [63]. A white barium sulphate surface ( = 0.97) with homogeneous spectral reflectance was used as a reference. The angle (angle between the vertical plane of incidence and vertical plane of observation) and the angle (angle of incidence from the upward vertical) were set to 20º and 35º. For part of the pavement samples the measurements were made using several different 90º, 55º, 35º, 25º, 20º, 13º and 50º, 46º, 40º, 35º, 30º, 25º, 20º, 13º)values to study the variations of pavement spectral reflectances in relation to the parameters and [35, 64]. For part of the pavement samples the measurements were also made with the angle (angle of observation) set to 30º. The measurements were also made using wet road surface samples to study the changes in the reflection properties of wet pavement samples compared to dry ones. In addition to the relative spectral reflectances of the pavements, the relative luminances of the pavement samples in different lighting conditions were also investigated. Two different light sources and four different sets of lighting conditions were used in the measurements, two light spectra HPS/MH and two dimming levels of the lamps.
7.2 Measurement results
Figures 20 and 21 show the measured relative spectral reflectances of 17 pavement samples under MH lamp. For most of the measured pavements the relative reflectances were higher for the long wavelength region. The results indicate that light sources with high output in the long wavelength region (for example HPS lamps) are more effective compared to ones with high output in the short wavelength region. [VII, VIII] According to the results most of the measured pavements would result in different average luminance coefficient Qo values and r-table values, depending on the light source used for the road surface reflectance measurement. This means that in road lighting conditions the same road surface would result in various road surface luminance values under different light sources. Thus, it can be argued that the aggregate colour is an important factor in road lighting optimisation and should be taken into consideration in road lighting design. As shown in Figure 20, three different samples of SMA 16 W with white aggregate resulted in the highest relative spectral reflectance values. When compared to SMA 16 with the same aggregate size, the SMA 16 W1, W2, and W3 samples resulted in significantly higher spectral reflectance values as a result of differences in the lightness of the aggregate. The SMA 18 L samples with a light, slightly reddish aggregate also resulted in relatively high reflectance values compared to the SMA 16 sample and most of the pavement samples shown in Figure 21. [VIII]
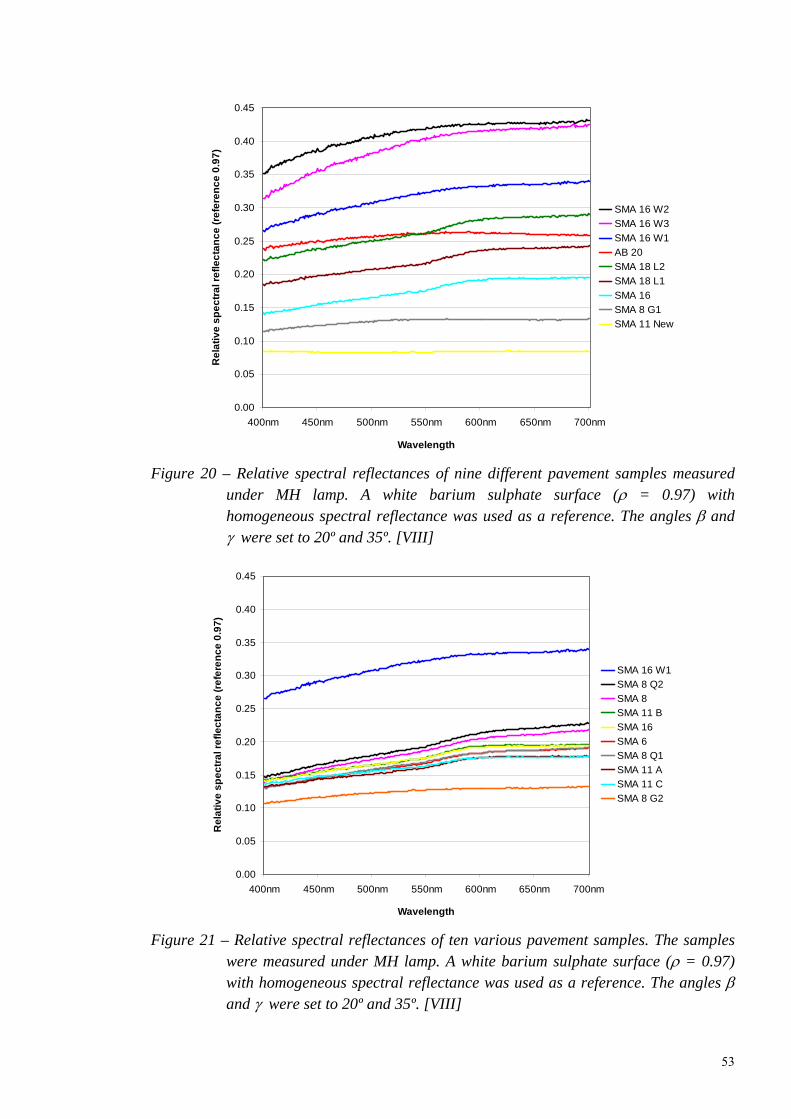
53
0.00
0.05
0.10
0.15
0.20
0.25
0.30
0.35
0.40
0.45
400nm 450nm 500nm 550nm 600nm 650nm 700nm
Wavelength
Re
lati
ve
sp
ec
tra
l re
fle
cta
nc
e (
refe
ren
ce
0.9
7)
SMA 16 W2
SMA 16 W3
SMA 16 W1
AB 20
SMA 18 L2
SMA 18 L1
SMA 16
SMA 8 G1
SMA 11 New
Figure 20 – Relative spectral reflectances of nine different pavement samples measured under MH lamp. A white barium sulphate surface ( = 0.97) with homogeneous spectral reflectance was used as a reference. The angles and were set to 20º and 35º. [VIII]
0.00
0.05
0.10
0.15
0.20
0.25
0.30
0.35
0.40
0.45
400nm 450nm 500nm 550nm 600nm 650nm 700nm
Wavelength
Re
lati
ve
sp
ec
tra
l re
fle
cta
nc
e (
refe
ren
ce
0.9
7)
SMA 16 W1
SMA 8 Q2
SMA 8
SMA 11 B
SMA 16
SMA 6
SMA 8 Q1
SMA 11 A
SMA 11 C
SMA 8 G2
Figure 21 – Relative spectral reflectances of ten various pavement samples. The samples were measured under MH lamp. A white barium sulphate surface ( = 0.97) with homogeneous spectral reflectance was used as a reference. The angles and were set to 20º and 35º. [VIII]
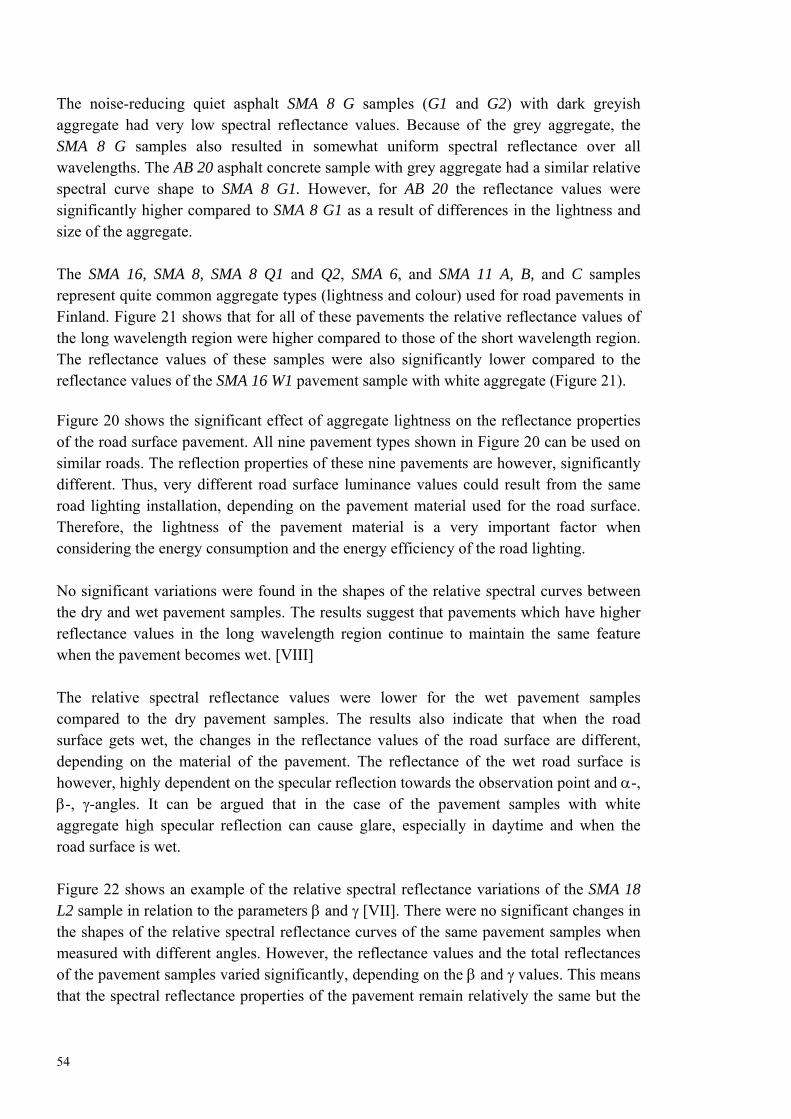
54
The noise-reducing quiet asphalt SMA 8 G samples (G1 and G2) with dark greyish aggregate had very low spectral reflectance values. Because of the grey aggregate, the SMA 8 G samples also resulted in somewhat uniform spectral reflectance over all wavelengths. The AB 20 asphalt concrete sample with grey aggregate had a similar relative spectral curve shape to SMA 8 G1. However, for AB 20 the reflectance values were significantly higher compared to SMA 8 G1 as a result of differences in the lightness and size of the aggregate. The SMA 16, SMA 8, SMA 8 Q1 and Q2, SMA 6, and SMA 11 A, B, and C samples represent quite common aggregate types (lightness and colour) used for road pavements in Finland. Figure 21 shows that for all of these pavements the relative reflectance values of the long wavelength region were higher compared to those of the short wavelength region. The reflectance values of these samples were also significantly lower compared to the reflectance values of the SMA 16 W1 pavement sample with white aggregate (Figure 21).
Figure 20 shows the significant effect of aggregate lightness on the reflectance properties of the road surface pavement. All nine pavement types shown in Figure 20 can be used on similar roads. The reflection properties of these nine pavements are however, significantly different. Thus, very different road surface luminance values could result from the same road lighting installation, depending on the pavement material used for the road surface. Therefore, the lightness of the pavement material is a very important factor when considering the energy consumption and the energy efficiency of the road lighting. No significant variations were found in the shapes of the relative spectral curves between the dry and wet pavement samples. The results suggest that pavements which have higher reflectance values in the long wavelength region continue to maintain the same feature when the pavement becomes wet. [VIII] The relative spectral reflectance values were lower for the wet pavement samples compared to the dry pavement samples. The results also indicate that when the road surface gets wet, the changes in the reflectance values of the road surface are different, depending on the material of the pavement. The reflectance of the wet road surface is however, highly dependent on the specular reflection towards the observation point and -, -, -angles. It can be argued that in the case of the pavement samples with white aggregate high specular reflection can cause glare, especially in daytime and when the road surface is wet. Figure 22 shows an example of the relative spectral reflectance variations of the SMA 18 L2 sample in relation to the parameters and [VII]. There were no significant changes in the shapes of the relative spectral reflectance curves of the same pavement samples when measured with different angles. However, the reflectance values and the total reflectances of the pavement samples varied significantly, depending on the and values. This means that the spectral reflectance properties of the pavement remain relatively the same but the
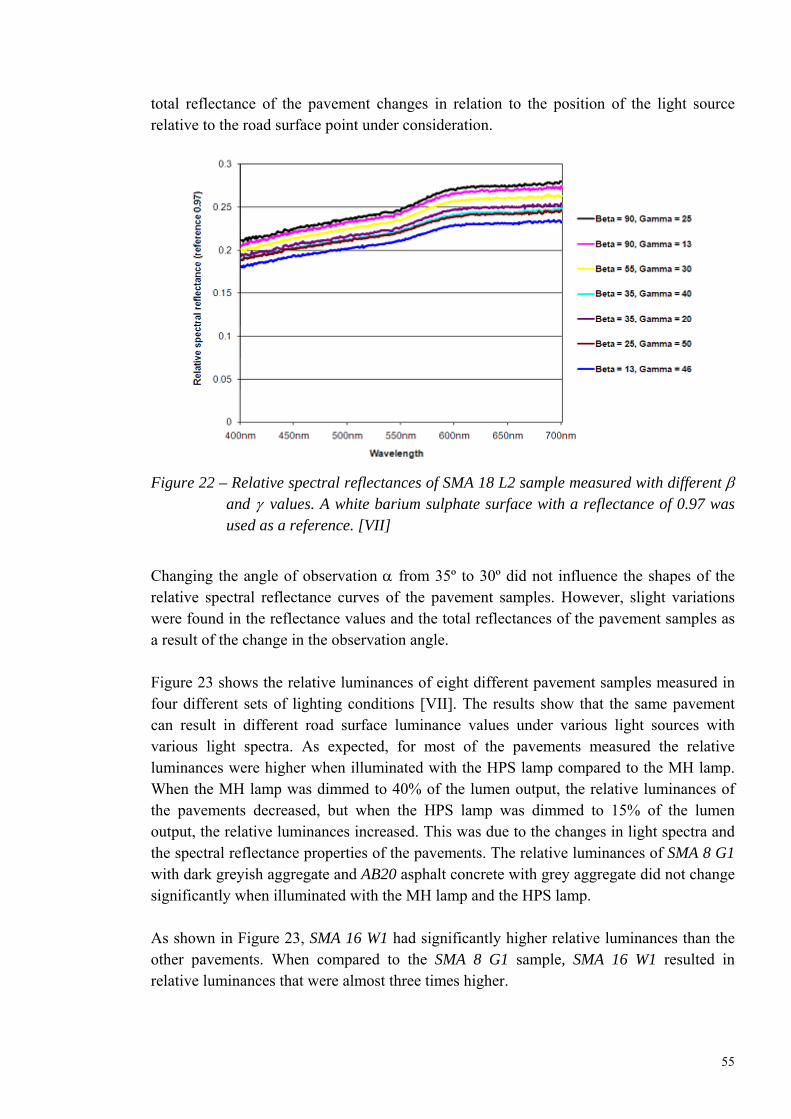
55
total reflectance of the pavement changes in relation to the position of the light source relative to the road surface point under consideration.
Figure 22 – Relative spectral reflectances of SMA 18 L2 sample measured with different and values. A white barium sulphate surface with a reflectance of 0.97 was used as a reference. [VII]
Changing the angle of observation from 35º to 30º did not influence the shapes of the relative spectral reflectance curves of the pavement samples. However, slight variations were found in the reflectance values and the total reflectances of the pavement samples as a result of the change in the observation angle. Figure 23 shows the relative luminances of eight different pavement samples measured in four different sets of lighting conditions [VII]. The results show that the same pavement can result in different road surface luminance values under various light sources with various light spectra. As expected, for most of the pavements measured the relative luminances were higher when illuminated with the HPS lamp compared to the MH lamp. When the MH lamp was dimmed to 40% of the lumen output, the relative luminances of the pavements decreased, but when the HPS lamp was dimmed to 15% of the lumen output, the relative luminances increased. This was due to the changes in light spectra and the spectral reflectance properties of the pavements. The relative luminances of SMA 8 G1 with dark greyish aggregate and AB20 asphalt concrete with grey aggregate did not change significantly when illuminated with the MH lamp and the HPS lamp. As shown in Figure 23, SMA 16 W1 had significantly higher relative luminances than the other pavements. When compared to the SMA 8 G1 sample, SMA 16 W1 resulted in relative luminances that were almost three times higher.
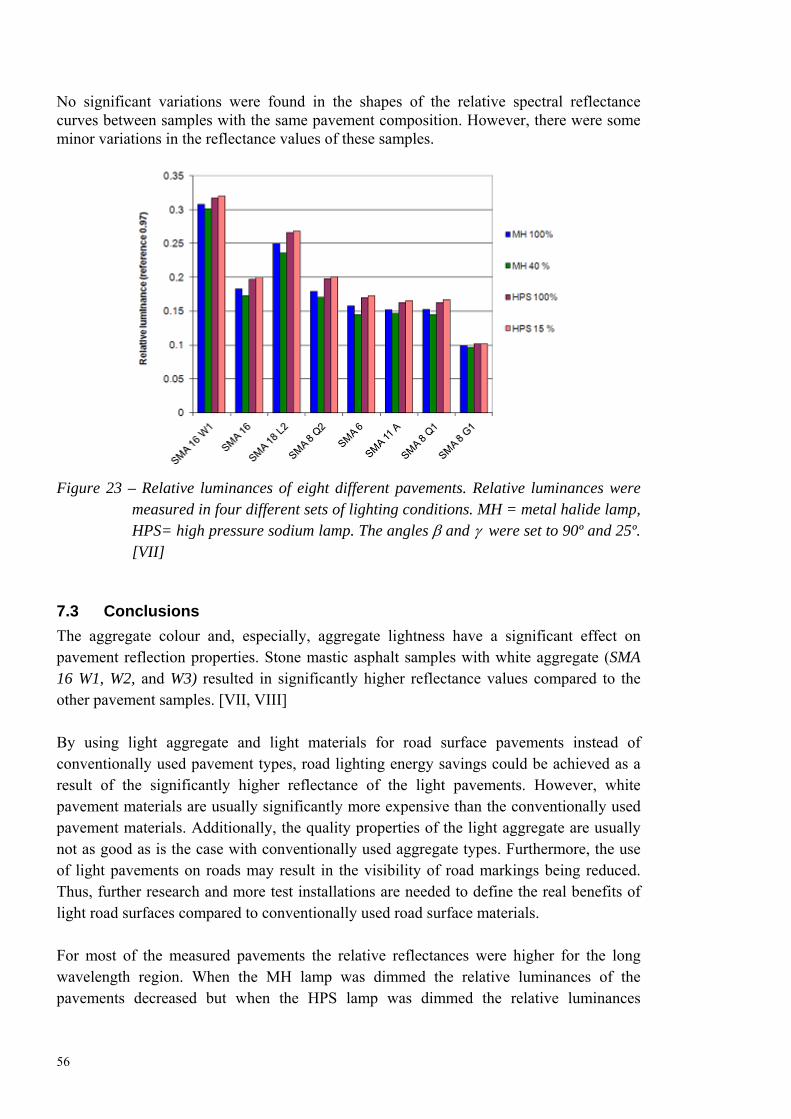
56
No significant variations were found in the shapes of the relative spectral reflectance curves between samples with the same pavement composition. However, there were some minor variations in the reflectance values of these samples.
Figure 23 – Relative luminances of eight different pavements. Relative luminances were measured in four different sets of lighting conditions. MH = metal halide lamp, HPS= high pressure sodium lamp. The angles and were set to 90º and 25º. [VII]
7.3 Conclusions
The aggregate colour and, especially, aggregate lightness have a significant effect on pavement reflection properties. Stone mastic asphalt samples with white aggregate (SMA 16 W1, W2, and W3) resulted in significantly higher reflectance values compared to the other pavement samples. [VII, VIII] By using light aggregate and light materials for road surface pavements instead of conventionally used pavement types, road lighting energy savings could be achieved as a result of the significantly higher reflectance of the light pavements. However, white pavement materials are usually significantly more expensive than the conventionally used pavement materials. Additionally, the quality properties of the light aggregate are usually not as good as is the case with conventionally used aggregate types. Furthermore, the use of light pavements on roads may result in the visibility of road markings being reduced. Thus, further research and more test installations are needed to define the real benefits of light road surfaces compared to conventionally used road surface materials. For most of the measured pavements the relative reflectances were higher for the long wavelength region. When the MH lamp was dimmed the relative luminances of the pavements decreased but when the HPS lamp was dimmed the relative luminances

57
increased. The results suggest that as a result of the higher content in the long wavelength region HPS lamps are more effective than MH lamps in terms of light reflected from pavements. No significant variations were found in the shapes of the relative spectral curves between the dry and wet pavement samples. It can be concluded that the road pavement is a very important parameter in the optimisation and development of road lighting energy efficiency. Thus, more extensive cooperation between the road administration authorities and the road lighting experts is needed in order to be able to efficiently optimise road lighting performance.
58
8 Conclusions In this work an advanced approach to road lighting measurements and calculations, based on the use of an imaging luminance photometer and a computer program, Road LumiMeter v2.0, was introduced. Road lighting measurements and calculations were made for several pilot locations, using different road lighting criteria and other alternative methods. The main purpose of the study was to investigate how the quality characteristics of the installations vary in relation to the calculation methods used. The road lighting measurements and calculations showed that the same road lighting installation may result in slightly different road lighting quality parameter values depending on the measurement and calculation method used for calculating the road lighting performance. Greater differences between different methods were found for luminance uniformity values than for average road surface luminance values. It can be argued, that it is better to use a calculation method, which includes all road surface luminance values from the area of interest for defining the road lighting quality, instead of using only a part of the luminance data, as is done at the moment. The results of this work also indicate that the number of measurement points used for road luminance calculations has no significant effect on the average road surface luminance, as long as the number of points used in calculations is not very low. [I, II] In driving, most of the visual information is gained through the windshield of a vehicle. The spectral transmittances of different windshields are not homogeneous for various wavelengths, which consequently affects the visibility conditions of the driver. The calculation results of this work indicate that the transmittance values of vehicle windshields are slightly higher in MH illumination compared to HPS illumination. This is due to the fact that the spectral transmittance values of vehicle windshields are the highest for the green and the yellow wavelength regions. [VII] The CIE TC1-58 “Visual performance in the mesopic range” is currently working on an internationally accepted basis for mesopic photometry. The TC1-58 will complete its work in the near future and the outcome will be a model for the basis of visual performance based mesopic photometry. [41] At present, there is a growing demand for energy savings and cost reductions in road lighting at the same time as new equipment for road lighting measurements and road lighting control systems, new light sources, and new knowledge are making energy savings more possible than before without adversely affecting the quality of road lighting. In the Scandinavian countries snowy conditions offer very good opportunities to save electricity by using dynamic road lighting control systems. In this work, road lighting measurements in various types of weather conditions were made in order to study the effects of snowy and wet road surface conditions on road lighting luminances. It was found that there is potential to achieve considerable energy savings by taking snowy conditions into account.
59
The luminances of snowy road surfaces were several times higher than in dry road surface conditions. In the cases when the road surface was partly snowy or only the road surroundings were covered with snow, road surface luminance levels were 30...100% higher compared to conditions without any snow. The luminance uniformities of snowy road surfaces were usually slightly lower than in dry conditions. Despite the energy-saving potential of snowy road surfaces, more studies, experience, and knowledge are needed to provide practical guidelines on how to design and operate dynamic road lighting installations. Wet road surface conditions resulted in higher average road surface luminance values and in significantly lower luminance uniformity values compared to dry road surface conditions. Wet road surface conditions were found to be too unstable for usage as a control parameter for dimming road lighting. More measurements and studies on the visibility conditions of the driver are needed to find solutions to the safety problems of illuminated wet road surfaces. [III, IV] Improvements in vehicle headlights have led to an increase in the luminous fluxes of headlights and HID headlamps with a much greater intensity than halogen headlamps have became more common. Road lighting and vehicle headlight measurements were made to study the use of road lighting and dipped vehicle headlights at the same time and whether this had a conflicting effect on the luminance contrasts of various targets located on the road or at the side of the road. In general, the use of dipped vehicle headlights in the presence of road lighting did not improve the visibility of various targets located on the road. In fact, in most cases dipped headlights reduced target contrasts and, thus, had a negative effect on target visibility. The effects of dipped headlights were highly dependent on the position of the vehicle, location of the target in relation to the luminaires, target reflectance, target shape and size, vehicle type and headlight type, road lighting installation, road characteristics, and weather conditions. Dipped HID headlights had more significant effects on target contrasts than dipped halogen headlights. It can be argued that there is an obvious conflicting effect in the use of vehicle headlights in road lighting environments. Furthermore, it can be argued that while in reality, both road lighting and vehicle headlights affect the visibility of various targets located on the road, road lighting criteria do not take the total effect into consideration. More measurements and studies are also needed to investigate the effects of vehicle headlights on the visibility of pedestrians at pedestrian crossings and in urban areas. [V, VI] Road lighting visibility experiments were made to study the visibility of achromatic and coloured visibility targets in MH lamp and HPS lamp installations. It was found that colours have a major effect on target visibility if the road is illuminated with a light source with adequate colour rendering properties. Under MH lamp illumination all the coloured targets were rated as more visible than the achromatic targets, despite the fact that the luminance contrasts of both targets were approximately the same. When the luminance
60
contrasts of the achromatic targets were higher compared to the luminance contrasts of the coloured targets, the coloured targets were still usually rated as more visible than the achromatic targets. Under HPS lamp illumination only the colour red had an influence on the visibility of the target. Dimming and an increase in the viewing distance reduced the effects of colour on relative target visibility. The experiment results indicate that in MH illumination the target visibility is defined not only by luminance contrast but rather by the combination of colour contrast and luminance contrast. It can be argued that a combination of colour and luminance contrast seems to be a good way of revealing targets on a road. The findings of the visibility experiments offer new opportunities to improve traffic safety and to optimise road lighting control systems and the energy consumption of road lighting installations. [VII] Pavement sample measurements were made to study the effects of aggregate lightness and aggregate colour on the reflectance properties of pavements. The results showed that aggregate colour and, especially, aggregate lightness have a significant effect on pavement reflection properties. Stone mastic asphalt samples with white aggregate resulted in significantly higher reflectance values compared to the other pavement samples. For most of the measured pavements the relative reflectances were higher for the long wavelength region. The results suggest that HPS lamps are more effective than MH lamps in terms of light reflected from pavements. When the MH lamp was dimmed the relative luminances of most pavements decreased but when the HPS lamp was dimmed the relative luminances increased to some extent. [VII, VIII] The CIE introduces different road surface classes to be used in calculating road lighting performance [20, 35]. On the basis of these classes road lighting design and calculations are made in different European countries. There are, however, reasons to assume that pavement materials and pavement reflection characteristics differ from one country to another. Thus, studies and extensive measurements of the typical pavement materials used in different countries are needed to define if there is a need for national road surface standards and if different countries should have their own road surface classes (e.g. modified CIE classes) [65]. Furthermore, it can be argued that some information regarding the use of different light sources with different pavement materials should be added to road lighting guidelines. It can be concluded that MH lamps perform better in revealing coloured targets on the road compared to HPS lamps. The transmittance values of vehicle windshields are slightly higher in MH illumination than in HPS illumination. MH lamps are also more effective at mesopic light levels. HPS lamps, on the other hand, are usually more effective than MH lamps as a result of pavements’ higher reflectance for the long wavelength region. At present, HPS lamps also offer more economical (lamp cost, longer rated lamp life) and usually also more efficient (higher luminous efficacy, lower lumen depreciation) lighting solutions than MH lamps.
61
There is a very complex interaction between the light sources used in road lighting applications, the visibility of targets, road surface reflection properties, the transmittances of vehicle windshields, weather conditions, the illuminating effects of vehicle headlights, and, finally, the visual performance at mesopic light levels. All these parameters have their own effects on road lighting performance. The colour and the lightness of road surfaces affect luminance and the colour contrasts of targets and thus affect the target visibility. The transmittance of the vehicle windshield and changes in the spectrum of the transmitted light, have an effect on the visual performance of the driver. Vehicle headlights affect target visibility and the spectrum of light reflected from targets. Mesopic vision, on the other hand, affects the visual performance of the driver and the visibility of targets located on the road or at the roadside. Finally, all these factors are highly dependent on road lighting luminance levels, which are dependent on the light sources used and the prevailing weather conditions. Furthermore, if all the parameters and interaction effects already mentioned are combined with such parameters as drivers’ behaviour, drivers’ physical and mental condition, and all the road lighting installation parameters and prevailing road and environment conditions, the result is a very complicated equation to be solved. This is why there is a need for more advanced computer programs, road lighting simulations, and more research into road lighting performance and analysis of what the driver needs to be able to see in order to be safe.
62
References
[1] J. B. De Boer, "Developments in illuminating engineering in the 20th century,"
Lighting Res. Technol. vol. 14, pp. 207-217, 1982.
[2] J. M. Waldram, "The revealing power of street lighting installations," Trans. Illum.
Eng. Soc. vol. 3, pp. 173-186, 1938.
[3] H. C. Weston, "The relation between illumination and visual performance," Industrial
Health Research Board, London HMSO, Report 87, 1945.
[4] H. R. Blackwell, "Specification of interior illumination levels," Illumination
Engineering, vol. 54, pp. 317-353, 1959.
[5] CIE (Commission Internationale de l'Eclairage), "TC 4-36. Visibility design for
roadway lighting," Report draft, 2008.
[6] P. Raynham, "An examination of the fundamentals of road lighting for pedestrians and
drivers," Lighting Res. Technol. vol. 36, pp. 307-316, 2004.
[7] J. B. De Boer, Ed., Public lighting. Eindhoven, Philips Technical Library, 1967.
[8] W. J. M. Van Bommel, J. B. De Boer, Road Lighting. Eindhoven, Philips Technical
Library, 1980.
[9] J. Green, R. Hargroves, "A mobile laboratory for dynamic road lighting measurement,"
Lighting Res. Technol. vol. 11, pp. 197-203, 1979.
[10] P. O. Wanvik, "Effects of road lighting: An analysis based on Dutch accident statistics
1987-2006," Accident Analysis and Prevention, vol. 41, pp. 133-128, 2009.
[11] CIE (Commission Internationale de l'Eclairage), "Road lighting as an accident
countermeasure," Publication No. 93, 1992.
[12] V. P. Gallagher, "A visibility matrix for safety lighting of city street," Journal of the
Illuminating Engineering Society, pp. 85-91, 1976.
[13] IESNA (Illuminating Engineering Society of North America), "Roadway Lighting,"
American National Standard Practice for Roadway Lighting, New York, United States of
America, Publication No. RP-8-00, 2005.
[14] J. F. Caminada, W. J. M. Van Bommel, "New considerations for residential areas,"
International Lighting Review, pp. 69-75, 1980.
[15] European Union, "Directive 2006/32/EC of the European Parliament and of the
Council," Official Journal of the European Union, L 114/64, 2006.
63
[16] European Union, "Commission Regulation (EC) No. 245/2009," Official Journal of
the European Union, L76/17, 2009.
[17] European standard EN 13201-2, "Road lighting – Part 2: Performance requirements,"
vol. publication 269, 2003.
[18] European standard EN 13201-3, "Road lighting – Part 3: Calculation of performance,"
vol. publication 270, 2003.
[19] European standard EN 13201-4, "Road Lighting - Part 4: Methods of measuring
lighting performance," vol. publication 271, 2003.
[20] CIE (Commission Internationale de l'Eclairage), "Calculation and measurement of
luminance and illuminance in road lighting," Publication No. 30-2, 1982.
[21] CIE (Commission Internationale de l'Eclairage), "Road lighting calculations,"
Publication No. 140, 2000.
[22] M. G. Bassett, D. Dmitrevsky, P. C. Kremer, "Measurement of reflection properties of
wet pavement samples," Journal of the Illuminating Engineering Society, pp. 99-104,
1988.
[23] CIE (Commission Internationale de l'Eclairage), "Road lighting for wet conditions,"
Publication No. 47, 1979.
[24] D. McNair, "Lighting wet roads," Lighting Journal, pp. 163-169, June/July 1997.
[25] R. Teppo, J. Kekkonen, J. Pirinen, Finnish Road Administration, (private
communication), 2009.
[26] L. Guo, "Intelligent road lighting control systems – experiences, measurements, and
lighting control strategies," Ph.D. dissertation, Lighting Unit, Department of Electronics,
Helsinki University of Technology, Espoo, Finland, 2008.
[27] J. Bullough, J. Van Derlofske, "Vehicle forward lighting: optimizing for visibility and
comfort," Lighting Research Center Rensselear, Polytechnic Institute Troy, NY, Report
TLA 2004-01, 2004.
[28] Y. Akashi, M. Rea, "The effect of oncoming headlight glare on peripheral detection
under a mesopic light level," Proceedings PAL Symposium, Darmstadt University of
Technology, Germany, pp. 1: 9-22, 2001.
[29] M. Sivak, M. J. Flannagan, B. Schoettle, Y. Nakata, "Field measurements of direct
and rearview-mirror glare from low-beam headlamps," Lighting Res. Technol. vol. 34, pp.
101-110, 2002.
64
[30] M. Sivak, M. J. Flannagan, T. Miyokawa, "Quantitative comparisons of factors
influencing the performance of low-beam headlamps," Lighting Res. Technol. vol. 31, pp.
145-153, 2000.
[31] A. Bacelar, "The contribution of vehicle lights in urban and peripheral urban
environments," Lighting Res. Technol. vol. 36, pp. 69-78, 2004.
[32] K. Narisada, Y. Karasawa, "New method of road lighting design based on revealing
power," Proceedings of 26th session of the CIE, Beijing, China, pp. D4:10-13, 2007.
[33] F. Smith, "Reflection factors and revealing power," Trans. Illum. Eng. Soc., vol. 3, pp.
196-206, 1938.
[34] W. Van Bommel, Polarised light and its application for vehicle lighting. University
of Technology, Eindhoven, 1970.
[35] CIE (Commission Internationale de l'Eclairage), "Road surfaces and lighting," vol.
publication 66, 1984.
[36] M. Kolbe, "Road LumiMeter," Lighting Laboratory, Helsinki University of
Technology, Espoo, Finland, Project Final Report, 2004.
[37] A.-M. Ylinen, "Development of road lighting calculation program by applying
imaging luminance photometer technique," M.Sc. thesis, Lighting Laboratory, Helsinki
University of Technology, Espoo, Finland, 2007.
[38] M. Eloholma, "Development of visual performance based mesopic photometry,"
Ph.D. dissertation, Lighting Laboratory, Helsinki University of Technology, Espoo,
Finland, 2005.
[39] P. Orreveteläinen, M. Eloholma, L. Halonen, "Mesopic spectral sensitivity and related
CIE standardisation work," Proceedings of 26th session of the CIE, Beijing, China, pp.
D1:34-37, 2007.
[40] IESNA (Illuminating Engineering Society of North America), "Spectral effects of
lighting on visual performance at mesopic light levels," New York, United States of
America, Technical memorandum 12-06, 2006.
[41] M. Viikari, A. Ekrias, M. Eloholma, L. Halonen, “Modelling spectral sensitivity at
low light levels based on mesopic visual performance,” Clinical Ophthalmology, vol. 2,
pp. 173-185, 2008.
[42] Y. Akashi M. S. Rea, J. D. Bullough, "Driver decision making in response to
peripheral moving targets under mesopic light levels," Lighting Res. Technol. vol. 39, pp.
53-67, 2007.
65
[43] J. Ketomäki, "Effects of lighting parameters on contrast threshold in the mesopic and
photopic luminance ranges," Ph.D. dissertation, Lighting Laboratory, Helsinki University
of Technology, Espoo, Finland, 2006.
[44] M. Viikari, "Analysis of the existing visual performance based mesopic models and a
proposal for a model for the basis of mesopic photometry," Ph.D. dissertation, Lighting
Laboratory, Helsinki University of Technology, Espoo, Finland, 2007.
[45] T. Goodman, A. Forbes, H. Walkey, et al, "Mesopic visual efficiency IV: A model
with relevance to night-time driving and other applications," Lighting Res. Technol. vol.
39, pp. 365-392, 2007.
[46] M. S. Rea, J. D. Bullough, J. P. Freyssinier-Nova, et al, "A proposed unified system of
photometry," Lighting Res. Technol. vol. 36, pp. 85-111, 2004.
[47] M. Eloholma, L. Halonen, "New model for mesopic photometry and its application to
road lighting," Leukos, vol. 2, pp. 263-293, 2006.
[48] M. S. Rea, J. D. Bullough, "Making the move to a unified system of photometry,"
Lighting Res. Technol. vol. 39, pp. 393-408, 2007.
[49] C. Bolton, Pilkington Automotive, (private communication), 2008.
[50] E. Bjelland, T. Mjos, "Intelligent road lighting," Proceedings of 26th session of the
CIE, Beijing, China, pp. D4:18-21, 2007.
[51] N. Van Tien, Y. Unhavaithaya, N. Nang Dinh, "Lighting control in street lighting –
An overview of the state of the art in technology and application," Proceedings of 6th
international conference on energy-efficient lighting, Paper ID 035, 2005.
[52] M. Eloholma, J. Ketomäki, L. Halonen, "Luminances and visibility in road lighting –
conditions, measurements and analysis," Lighting Laboratory, Helsinki University of
Technology, Espoo, Finland, Report 30, 2004.
[53] M. Eloholma, J. Ketomäki, L. Halonen, "Road lighting – luminance and visibility
measurements," Lighting Laboratory, Helsinki University of Technology, Espoo, Finland,
Report 29, 2001.
[54] United Nations Economic Commission for Europe, "Uniform provisions concerning
the approval of motor vehicle headlamps emitting an asymmetrical passing beam or a
driving beam or both and equipped with filament lamps," Regulation vol. 112,
Rev.2/Add.111/Rev.1, 2006.
[55] United Nations Economic Commission for Europe, "Uniform provisions concerning
the approval of motor vehicle headlamps equipped with gas-discharge light sources,"
Regulation vol. 98, Rev.1/Add.97/Rev.1, 2005.
66
[56] Ö. Güler, S. Onaygil, "The effect of luminance uniformity on visibility level in road
lighting," Lighting Res. Technol. vol. 35, pp. 199-215, 2003.
[57] M. Janoff, "Toward development of a visibility model for roadway lighting design,"
IESNA Annual Conference, San Diego, California, United States of America, pp. 149-171,
1992.
[58] E. Hansen, J. Larsen, "Reflection factors for pedestrian’s clothing," Lighting Res.
Technol. vol. 11, pp. 154-157, 1979.
[59] K. Narisada, Y. Karasawa, "Re-consideration of the revealing power on the basis of
visibility level," International Lighting Congress, Istanbul, Turkey, pp. 473-480, 2001.
[60] M. S. Rea, The IESNA Lighting Handbook: Reference & Application. New York:
Illuminating Engineering Society of North America, 2000, pp. 1000.
[61] European standard EN 12697-16, "Bituminous mixtures. Test methods for hot mix
asphalt. Abrasion by studded tyres," vol. EN 12697-16:2004, 2004.
[62] R. B. Gibbons, W. K. Adrian, "Influence of Observation Angle on Road Surface
Reflection Characteristics," Journal of the Illuminating Engineering Society, vol. 26, pp.
139-149, 1997.
[63] Catalog, Spectroradiometer CS-2000, Konica Minolta, 2008.
[64] G. I. Crabb, R. J. Beaumont, D. P. Steele, P. Darley, M. H. Burtwell, "Visual
performance under CMH and HPS lighting systems," NumeLiTe project final report,
PPR043, 2005.
[65] H. W. Bodmann, H. J. Schmidt, "Road surface reflection and road lighting: Field
investigations," Lighting Res. Technol. vol. 21, pp. 159-170, 1989.

![Low-Cost Imaging Photometer and Calibration Method … · Low-Cost Imaging Photometer and Calibration Method for Road Tunnel Lighting ... In accordance with CIE 88-1990 [6], ... can](https://img.pdfslide.us/doc/110x75/5adcbeac7f8b9a9d4d8c35be/low-cost-imaging-photometer-and-calibration-method-imaging-photometer-and-calibration.jpg)