Embed Size (px)
Citation preview
Global and China Tire Industry
Report, 2014-2015
Apr. 2015
METHODOLOGY
Both primary and secondary research methodologies were used
in preparing this study. Initially, a comprehensive and exhaustive
search of the literature on this industry was conducted. These
sources included related books and journals, trade literature,
marketing literature, other product/promotional literature, annual
reports, security analyst reports, and other publications.
Subsequently, telephone interviews or email correspondence
was conducted with marketing executives etc. Other sources
included related magazines, academics, and consulting
companies.
INFORMATION SOURCES
The primary information sources include Company Reports,
and National Bureau of Statistics of China etc.
STUDY GOAL AND OBJECTIVES
This report provides the industry executives with strategically significant
competitor information, analysis, insight and projection on the
competitive pattern and key companies in the industry, crucial to the
development and implementation of effective business, marketing and
R&D programs.
REPORT OBJECTIVES
To establish a comprehensive, factual, annually updated and cost-
effective information base on market size, competition patterns,
market segments, goals and strategies of the leading players in the
market, reviews and forecasts.
To assist potential market entrants in evaluating prospective
acquisition and joint venture candidates.
To complement the organizations’ internal competitor information
gathering efforts with strategic analysis, data interpretation and
insight.
To suggest for concerned investors in line with the current
development of this industry as well as the development tendency.
To help company to succeed in a competitive market, and
understand the size and growth rate of any opportunity.
Room 502, Block 3, Tower C, Changyuan Tiandi Building, No. 18, Suzhou Street, Haidian District, Beijing, China 100080 Phone: +86 10 82600828 ● Fax: +86 10 82601570 ● www.researchinchina.com ● [email protected]
Copyright 2012 ResearchInChina
Abstract
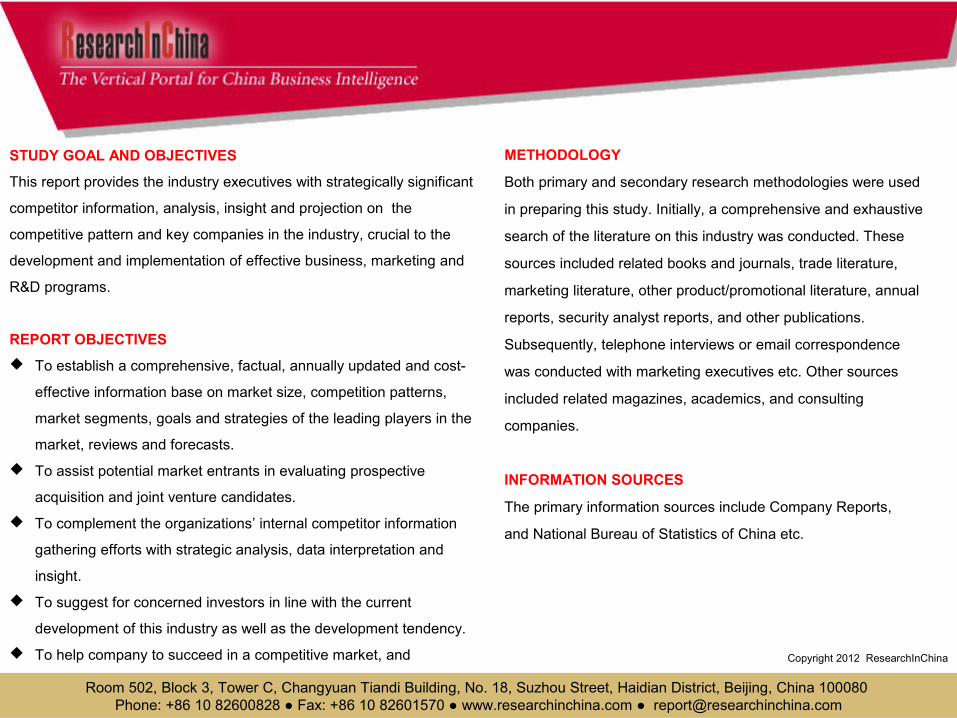
The report highlights: 1. Global Automobile Industry and Market;2. China Automobile Industry and Market; 3. Global Tire Industry and Market;4. Tire Industry and Market in China and the United States;5. 26 Typical Tire Vendors.
2014 marked a bumper year for the tire industry. The declining price of natural rubber helped substantial cost reduction of tire vendors; the tire price performed more stably than the costs although it dropped as well. Despite the shrunk revenue in 2014, almost all tire producers saw higher profit margins. This situation continues in 2015, reflected in the falling price of natural rubber and the slight decline in the tire price.
What comes to the momentous event in the tire industry in 2015 is that the state-owned Sinochem is probable to acquire the shares of the world's fifth largest tire company -- Pirelli to demonstrate the strength of China in the capital field, which is a blockbuster in the tire industry. For a long time, Chinese tire makers have not found a way into the field of sedan OE Tires, so they primarily target RT and truck tire markets. Pirelli is the most important tire supplier for BMW, and the second largest supplier for Mercedes-Benz, also one of Ford's main suppliers. Through the acquisition of Pirelli, Chinese vendors have begun to supply OE Tires for luxury cars.
Room 502, Block 3, Tower C, Changyuan Tiandi Building, No. 18, Suzhou Street, Haidian District, Beijing, China 100080 Phone: +86 10 82600828 ● Fax: +86 10 82601570 ● www.researchinchina.com ● [email protected]
Copyright 2012ResearchInChina
In future, Chinese companies may make more acquisitions to expand the market, obtain technologies and avoid the anti-dumping
investigation of the United States. Finland-based Nokian, America-based Titan and CTP, Russia-based Nizhnekamskshina and OJSC, as
well as Belarus-based JSC Belshina Belarus are likely to be potentially taken over. If Chinese companies take over Nokian, they will seize
the excellent winter tire technology.
Chinese tire enterprises, especially private ones, have a high debt ratio and high financial leverage, which are vulnerable to be in bankruptcy
in case of a slight decline in the market. For example, Deruibao Tire earned the revenue of close to USD1 billion with the 35th ranking
worldwide in 2013, but it suddenly announced bankruptcy in February 2015.
China tire industry, especially the truck tire field, is facing serious overcapacity. Along with the decline in China's fixed investments and real
estate, the demand for trucks contracts sharply, the highly competitive highway logistics industry sees low profits and minimizes the
changes of tires. The US’s anti-dumping investigation is almost a fatal blow on Chinese tire companies, but China still releases more truck
tire capacity. In 2015, the new tire capacity hits up to 120 million and the overcapacity rate is 20%-25%.
In Chinese OE tire market, the market share of South Korean giants Hankook and Kumho Tire slumped because of consecutive quality
problems. By contrast, the market share of Japan-based Dunlop and the US-based Goodyear soared, particularly Dunlop’s market share
almost doubled in 2014. China-based Triangle Tire and Giti Tire also witnessed significant growth.
Room 502, Block 3, Tower C, Changyuan Tiandi Building, No. 18, Suzhou Street, Haidian District, Beijing, China 100080 Phone: +86 10 82600828 ● Fax: +86 10 82601570 ● www.researchinchina.com ● [email protected]
Copyright 2012ResearchInChina
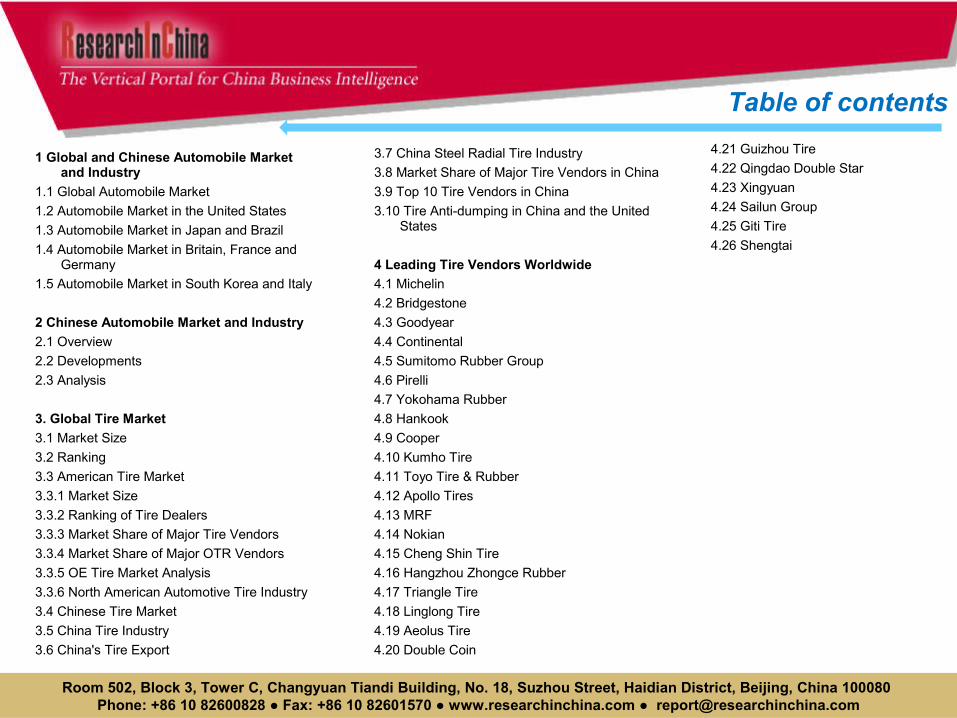
1 Global and Chinese Automobile Market and Industry
1.1 Global Automobile Market
1.2 Automobile Market in the United States
1.3 Automobile Market in Japan and Brazil
1.4 Automobile Market in Britain, France and Germany
1.5 Automobile Market in South Korea and Italy
2 Chinese Automobile Market and Industry
2.1 Overview
2.2 Developments
2.3 Analysis
3. Global Tire Market
3.1 Market Size
3.2 Ranking
3.3 American Tire Market
3.3.1 Market Size
3.3.2 Ranking of Tire Dealers
3.3.3 Market Share of Major Tire Vendors
3.3.4 Market Share of Major OTR Vendors
3.3.5 OE Tire Market Analysis
3.3.6 North American Automotive Tire Industry
3.4 Chinese Tire Market
3.5 China Tire Industry
3.6 China's Tire Export
Table of contents
Room 502, Block 3, Tower C, Changyuan Tiandi Building, No. 18, Suzhou Street, Haidian District, Beijing, China 100080 Phone: +86 10 82600828 ● Fax: +86 10 82601570 ● www.researchinchina.com ● [email protected]
3.7 China Steel Radial Tire Industry
3.8 Market Share of Major Tire Vendors in China
3.9 Top 10 Tire Vendors in China
3.10 Tire Anti-dumping in China and the United States
4 Leading Tire Vendors Worldwide
4.1 Michelin
4.2 Bridgestone
4.3 Goodyear
4.4 Continental
4.5 Sumitomo Rubber Group
4.6 Pirelli
4.7 Yokohama Rubber
4.8 Hankook
4.9 Cooper
4.10 Kumho Tire
4.11 Toyo Tire & Rubber
4.12 Apollo Tires
4.13 MRF
4.14 Nokian
4.15 Cheng Shin Tire
4.16 Hangzhou Zhongce Rubber
4.17 Triangle Tire
4.18 Linglong Tire
4.19 Aeolus Tire
4.20 Double Coin
4.21 Guizhou Tire
4.22 Qingdao Double Star
4.23 Xingyuan
4.24 Sailun Group
4.25 Giti Tire
4.26 Shengtai
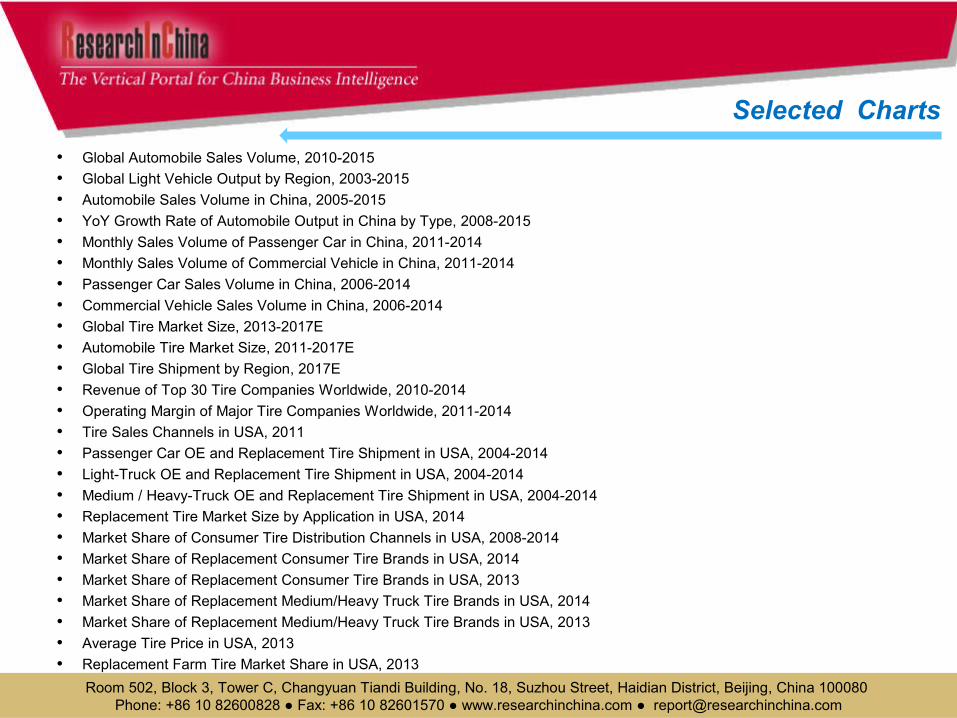
• Global Automobile Sales Volume, 2010-2015
• Global Light Vehicle Output by Region, 2003-2015
• Automobile Sales Volume in China, 2005-2015
• YoY Growth Rate of Automobile Output in China by Type, 2008-2015
• Monthly Sales Volume of Passenger Car in China, 2011-2014
• Monthly Sales Volume of Commercial Vehicle in China, 2011-2014
• Passenger Car Sales Volume in China, 2006-2014
• Commercial Vehicle Sales Volume in China, 2006-2014
• Global Tire Market Size, 2013-2017E
• Automobile Tire Market Size, 2011-2017E
• Global Tire Shipment by Region, 2017E
• Revenue of Top 30 Tire Companies Worldwide, 2010-2014
• Operating Margin of Major Tire Companies Worldwide, 2011-2014
• Tire Sales Channels in USA, 2011
• Passenger Car OE and Replacement Tire Shipment in USA, 2004-2014
• Light-Truck OE and Replacement Tire Shipment in USA, 2004-2014
• Medium / Heavy-Truck OE and Replacement Tire Shipment in USA, 2004-2014
• Replacement Tire Market Size by Application in USA, 2014
• Market Share of Consumer Tire Distribution Channels in USA, 2008-2014
• Market Share of Replacement Consumer Tire Brands in USA, 2014
• Market Share of Replacement Consumer Tire Brands in USA, 2013
• Market Share of Replacement Medium/Heavy Truck Tire Brands in USA, 2014
• Market Share of Replacement Medium/Heavy Truck Tire Brands in USA, 2013
• Average Tire Price in USA, 2013
• Replacement Farm Tire Market Share in USA, 2013
Selected Charts
Room 502, Block 3, Tower C, Changyuan Tiandi Building, No. 18, Suzhou Street, Haidian District, Beijing, China 100080 Phone: +86 10 82600828 ● Fax: +86 10 82601570 ● www.researchinchina.com ● [email protected]
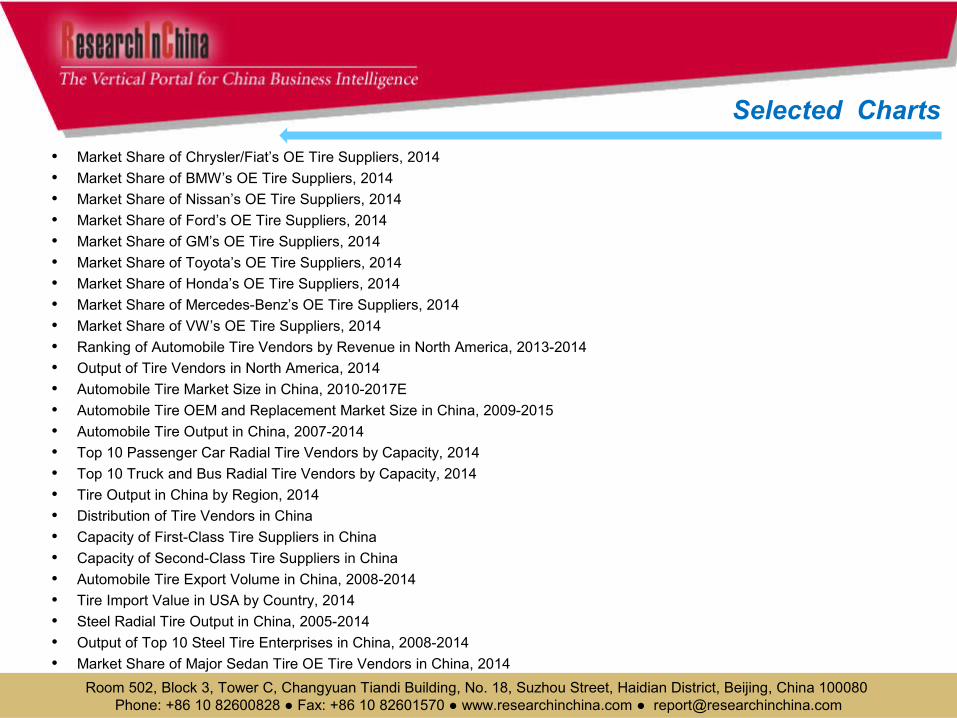
• Market Share of Chrysler/Fiat’s OE Tire Suppliers, 2014
• Market Share of BMW’s OE Tire Suppliers, 2014
• Market Share of Nissan’s OE Tire Suppliers, 2014
• Market Share of Ford’s OE Tire Suppliers, 2014
• Market Share of GM’s OE Tire Suppliers, 2014
• Market Share of Toyota’s OE Tire Suppliers, 2014
• Market Share of Honda’s OE Tire Suppliers, 2014
• Market Share of Mercedes-Benz’s OE Tire Suppliers, 2014
• Market Share of VW’s OE Tire Suppliers, 2014
• Ranking of Automobile Tire Vendors by Revenue in North America, 2013-2014
• Output of Tire Vendors in North America, 2014
• Automobile Tire Market Size in China, 2010-2017E
• Automobile Tire OEM and Replacement Market Size in China, 2009-2015
• Automobile Tire Output in China, 2007-2014
• Top 10 Passenger Car Radial Tire Vendors by Capacity, 2014
• Top 10 Truck and Bus Radial Tire Vendors by Capacity, 2014
• Tire Output in China by Region, 2014
• Distribution of Tire Vendors in China
• Capacity of First-Class Tire Suppliers in China
• Capacity of Second-Class Tire Suppliers in China
• Automobile Tire Export Volume in China, 2008-2014
• Tire Import Value in USA by Country, 2014
• Steel Radial Tire Output in China, 2005-2014
• Output of Top 10 Steel Tire Enterprises in China, 2008-2014
• Market Share of Major Sedan Tire OE Tire Vendors in China, 2014
Selected Charts
Room 502, Block 3, Tower C, Changyuan Tiandi Building, No. 18, Suzhou Street, Haidian District, Beijing, China 100080 Phone: +86 10 82600828 ● Fax: +86 10 82601570 ● www.researchinchina.com ● [email protected]
• Market Share of Major Cross-type Passenger Car Tire Vendors in China, 2014
• Market Share of Major Truck Tire Vendors in China, 2014
• Revenue of Top 10 Tire Vendors in China, 2013-2014
• Revenue and Operating Margin of Michelin, 2004-2014
• Net Sales of Michelin, 2013-2014
• Operating Income of Michelin, 2013-2014
• Tire Shipment of Michelin by Size, 2013
• Average Tire Weight Produced by Each Worker of Michelin, 2006-2013
• Capital Expenditure and Depreciation of Michelin, 2011-2017E
• Quarterly Output of Michelin, Q1 2013-Q4 2014
• Revenue of Michelin by Division, 2009-2014
• Operating Margin of Michelin by Division, 2009-2014
• Business Model of TIREPLUS
• Co-partners of TIREPLUS
• Number of TIREPLUS Stores Worldwide, 2014
• Number of TIREPLUS Stores in China, 2003-2014
• Revenue of Michelin China by Region
• Distribution of Michelin in China
• Distribution of Michelin’s Dealers in China
• Cumulative Investment of Shenyang Michelin, 2009-2019E
• Ramp-up of Shenyang Michelin, 2009-2019E
• Revenue and Operating Margin of Bridgestone, 2007-2015
• Revenue of Bridgestone by Region, 2004-2014
• Operating Income of Bridgestone, 2013
• Operating Income of Bridgestone, 2014
Selected Charts
Room 502, Block 3, Tower C, Changyuan Tiandi Building, No. 18, Suzhou Street, Haidian District, Beijing, China 100080 Phone: +86 10 82600828 ● Fax: +86 10 82601570 ● www.researchinchina.com ● [email protected]
• Operating Income of Bridgestone, 2015
• Distribution of Global Factories of Bridgestone, 2011
• Distribution of Global Factories of Bridgestone, Apr 2014
• Distribution of Bridgestone in China
• Revenue and Operating Margin of Goodyear, 2004-2014
• Sales Volume of Goodyear, 2007-2014
• Sales Volume of Goodyear by Application, 2016-2014
• Revenue of Goodyear by Business, 2014
• Revenue of Goodyear by Region, 2008-2014
• Operating Margin of Goodyear by Region, 2008-2014
• Sales Ratio of Replacement Tires of Goodyear by Region, 2006-2013
• Sales Volume of Goodyear by Region, 2006-2014
• Raw Material Cost Structure of Goodyear, 2014
• Raw Materials Modeling Assumptions of Goodyear, 2014
• Debt of Goodyear, 2013-2014
• Revenue of Continental by Region and Business, 2010-2014
• Operating Data of Continental Tire Business, 2012-2014
• Tire Brands of Continental
• Tire Revenue of Continental by Region, 2011 2014
• Additional PLT Tire Capacity of Continental by Region, 2018E
• PLT Tire Capacity of Continental by Region (excluding Europe), 2013
• PLT Tire Capacity of Continental by Region (excluding Europe), 2014
• PLT Tire Capacity of Continental in Europe by Region, 2013
• PLT Tire Capacity of Continental in Europe by Region, 2014
• CV Tire Capacity of Continental by Region, 2013
Selected Charts
Room 502, Block 3, Tower C, Changyuan Tiandi Building, No. 18, Suzhou Street, Haidian District, Beijing, China 100080 Phone: +86 10 82600828 ● Fax: +86 10 82601570 ● www.researchinchina.com ● [email protected]
• CV Tire Capacity of Continental by Region, 2014
• PLT Tire Sales Volume of Continental, 2009-2014
• CV Tire Sales Volume of Continental, 2009-2014
• Revenue and Operating Margin of Sumitomo Rubber, 2004-2014
• Operating Income of Sumitomo Rubber, 2013-2014
• Operating Income of Sumitomo Rubber, 2014-2015
• Revenue of Sumitomo Rubber by Region, 2007-2014
• Revenue of Sumitomo Rubber by Product, 2007-2014
• Operating Income of Sumitomo Rubber by Product, 2007-2014
• Sales Volume of Sumitomo Rubber outside Japan by Region, 2010-2015
• Tire Output and Capacity Utilization of Sumitomo Rubber, 2009-2015
• Output and Capacity Utilization of Sumitomo Rubber, 2006-2015
• Revenue and Operating Margin of Pirelli, 2006-2014
• EBIT Bridge of Pirelli, 2012-2013
• EBIT Bridge of Pirelli, 2013-2014
• Revenue of Pirelli by Business, 2006-2014
• Raw Material Costs of Pirelli, 2013
• Raw Material Costs of Pirelli, 2014
• Revenue of Pirelli by Product, 2013
• Revenue of Pirelli by Product, 2014
• Revenue of Pirelli by Region, 2012
• Revenue of Pirelli by Region, 2013
• Revenue of Pirelli by Region, 2014
• Headcount of Pirelli by Region, 2014
• Global Presence of Pirelli
Selected Charts
Room 502, Block 3, Tower C, Changyuan Tiandi Building, No. 18, Suzhou Street, Haidian District, Beijing, China 100080 Phone: +86 10 82600828 ● Fax: +86 10 82601570 ● www.researchinchina.com ● [email protected]
• Revenue and Operating Margin of Yokohama Rubber, 2006-2014
• Tire Revenue of Yokohama Rubber by Region, 2006-2013
• Capacity of Global Factories of Yokohama Rubber, 2011-2014
• Global Distribution of Yokohama Rubber
• Expansion Plan of Yokohama Rubber, 2014-2020E
• Revenue and Operating Margin of Hankook, 2003-2014
• Revenue and Operating Margin of Hankook, Q1 2012-Q4 2014
• Revenue of Hankook by Region, Q4 2013-Q4 2014
• Output of Hankook by Region, 2005-2014
• Prices of Natural Rubber and Synthetic Rubber, Q4 2012-Q4 2014
• Quarterly Revenue and Gross Margin of Hankook China, 2014
• Balance Sheet of Hankook China, 2013-2014
• Revenue and Operating Margin of Cooper, 2004-2014
• Revenue of Cooper by Region, 2006-2014
• Revenue of Cooper by Product, 2012
• Revenue and Operating Margin of Kumho Tire, 2005-2013
• Quarterly Revenue and Operating Income of Kumho Tire, Q2 2013-Q3 2014
• Capacity Distribution of Kumho Tire
• Revenue of Kumho Tire by Region, Q3 2014
• Shipment and ASP of Kumho Tire, 2009-2013
• Capacity Utilization of Kumho Tire by Factory, Q1 2012-Q3 2014
• Output of Kumho Tire by Region, 2012-2013
• Revenue and Operating Margin of Kumho Tire China, Q2 2013-Q4 2014
• Revenue and Operating Margin of Toyo Tire & Rubber, 2007-2015
• Operating Income of Toyo Tire & Rubber, 2013-2014
Selected Charts
Room 502, Block 3, Tower C, Changyuan Tiandi Building, No. 18, Suzhou Street, Haidian District, Beijing, China 100080 Phone: +86 10 82600828 ● Fax: +86 10 82601570 ● www.researchinchina.com ● [email protected]
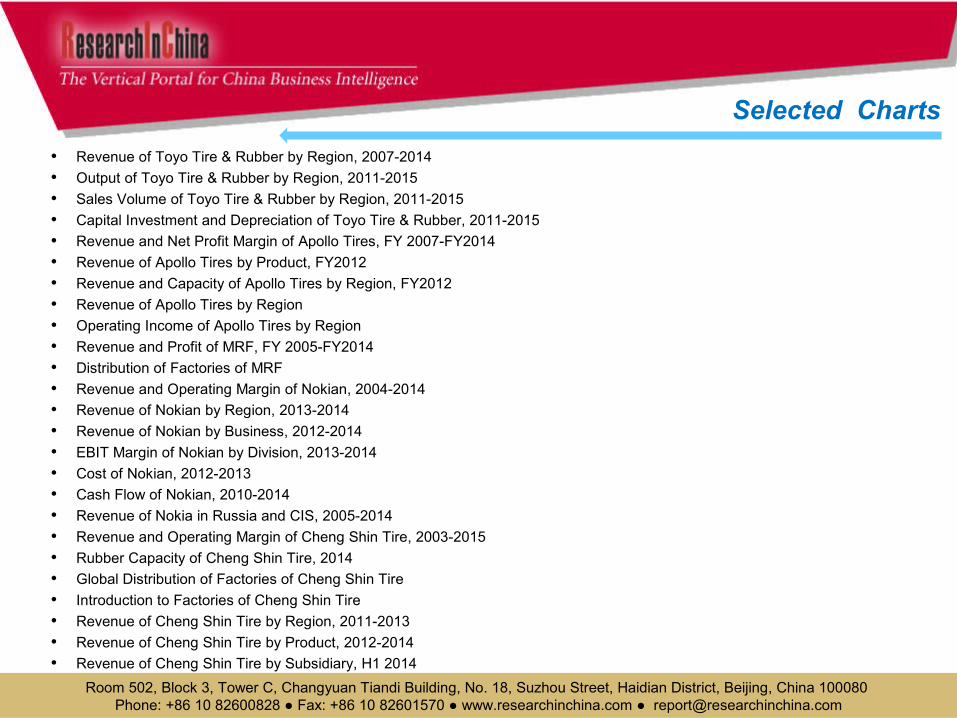
• Revenue of Toyo Tire & Rubber by Region, 2007-2014
• Output of Toyo Tire & Rubber by Region, 2011-2015
• Sales Volume of Toyo Tire & Rubber by Region, 2011-2015
• Capital Investment and Depreciation of Toyo Tire & Rubber, 2011-2015
• Revenue and Net Profit Margin of Apollo Tires, FY 2007-FY2014
• Revenue of Apollo Tires by Product, FY2012
• Revenue and Capacity of Apollo Tires by Region, FY2012
• Revenue of Apollo Tires by Region
• Operating Income of Apollo Tires by Region
• Revenue and Profit of MRF, FY 2005-FY2014
• Distribution of Factories of MRF
• Revenue and Operating Margin of Nokian, 2004-2014
• Revenue of Nokian by Region, 2013-2014
• Revenue of Nokian by Business, 2012-2014
• EBIT Margin of Nokian by Division, 2013-2014
• Cost of Nokian, 2012-2013
• Cash Flow of Nokian, 2010-2014
• Revenue of Nokia in Russia and CIS, 2005-2014
• Revenue and Operating Margin of Cheng Shin Tire, 2003-2015
• Rubber Capacity of Cheng Shin Tire, 2014
• Global Distribution of Factories of Cheng Shin Tire
• Introduction to Factories of Cheng Shin Tire
• Revenue of Cheng Shin Tire by Region, 2011-2013
• Revenue of Cheng Shin Tire by Product, 2012-2014
• Revenue of Cheng Shin Tire by Subsidiary, H1 2014
Selected Charts
Room 502, Block 3, Tower C, Changyuan Tiandi Building, No. 18, Suzhou Street, Haidian District, Beijing, China 100080 Phone: +86 10 82600828 ● Fax: +86 10 82601570 ● www.researchinchina.com ● [email protected]
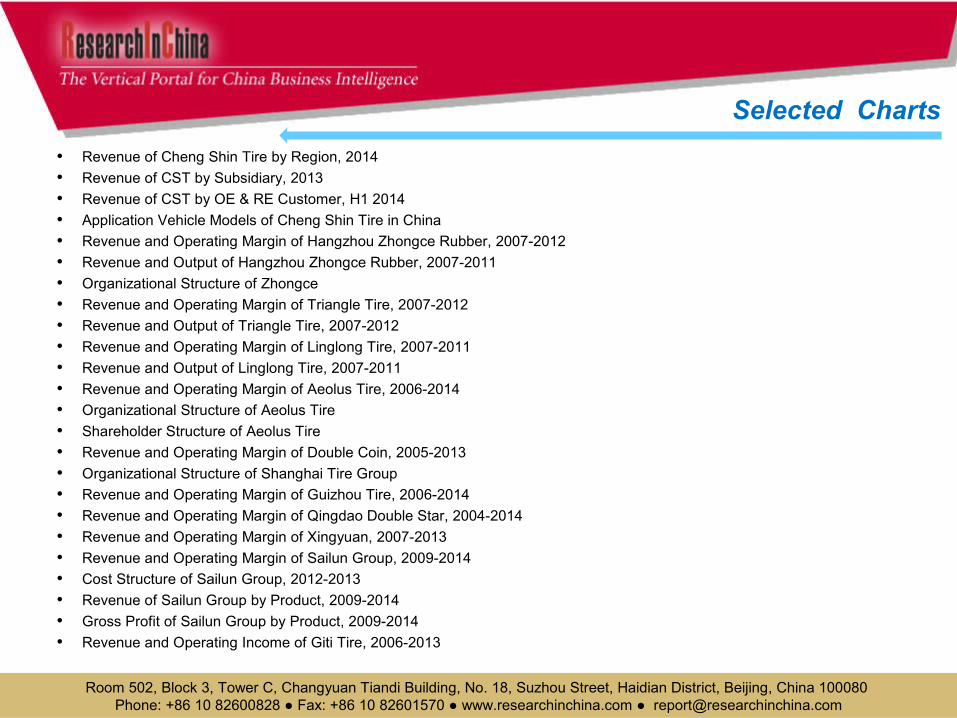
• Revenue of Cheng Shin Tire by Region, 2014
• Revenue of CST by Subsidiary, 2013
• Revenue of CST by OE & RE Customer, H1 2014
• Application Vehicle Models of Cheng Shin Tire in China
• Revenue and Operating Margin of Hangzhou Zhongce Rubber, 2007-2012
• Revenue and Output of Hangzhou Zhongce Rubber, 2007-2011
• Organizational Structure of Zhongce
• Revenue and Operating Margin of Triangle Tire, 2007-2012
• Revenue and Output of Triangle Tire, 2007-2012
• Revenue and Operating Margin of Linglong Tire, 2007-2011
• Revenue and Output of Linglong Tire, 2007-2011
• Revenue and Operating Margin of Aeolus Tire, 2006-2014
• Organizational Structure of Aeolus Tire
• Shareholder Structure of Aeolus Tire
• Revenue and Operating Margin of Double Coin, 2005-2013
• Organizational Structure of Shanghai Tire Group
• Revenue and Operating Margin of Guizhou Tire, 2006-2014
• Revenue and Operating Margin of Qingdao Double Star, 2004-2014
• Revenue and Operating Margin of Xingyuan, 2007-2013
• Revenue and Operating Margin of Sailun Group, 2009-2014
• Cost Structure of Sailun Group, 2012-2013
• Revenue of Sailun Group by Product, 2009-2014
• Gross Profit of Sailun Group by Product, 2009-2014
• Revenue and Operating Income of Giti Tire, 2006-2013
Selected Charts
Room 502, Block 3, Tower C, Changyuan Tiandi Building, No. 18, Suzhou Street, Haidian District, Beijing, China 100080 Phone: +86 10 82600828 ● Fax: +86 10 82601570 ● www.researchinchina.com ● [email protected]
You can place your order in the following alternative ways:
1.Order online at www.researchinchina.com
2.Fax order sheet to us at fax number:+86 10 82601570
3. Email your order to: [email protected]
4. Phone us at +86 10 82600828/ 82601561
Party A:Name:Address:Contact Person: TelE-mail: Fax
Party B:Name: Beijing Waterwood Technologies Co., Ltd (ResearchInChina)Address: Room 502, Block 3, Tower C, Changyuan Tiandi Building, No. 18,
Suzhou Street, Haidian District, Beijing, China 100080Contact Person:
Liao Yan Phone:
86-10-82600828
E-mail: [email protected] Fax: 86-10-82601570Bank details:
Beneficial Name: Beijing Waterwood Technologies Co., LtdBank Name: Bank of Communications, Beijing BranchBank Address: NO.1 jinxiyuan shijicheng,Landianchang,Haidian District,BeijingBank Account No #: 110060668012015061217Routing No # : 332906Bank SWIFT Code: COMMCNSHBJG
Title Format Cost
Total
Choose type of format
PDF (Single user license) …………..2,500 USD
Hard copy ………………….……. 2,700 USD
PDF (Enterprisewide license)…....... 3,950 USD
※ Reports will be dispatched immediately
once full payment has been received.
Payment may be made by wire transfer or
credit card via PayPal.
How to Buy
Room 502, Block 3, Tower C, Changyuan Tiandi Building, No. 18, Suzhou Street, Haidian District, Beijing, China 100080 Phone: +86 10 82600828 ● Fax: +86 10 82601570 ● www.researchinchina.com ● [email protected]
About ResearchInChina
ResearchInChina (www.researchinchina.com) is a leading independent provider of China business intelligence. Our research is designed to meet the diverse planning and information needs of businesses, institutions, and professional investors worldwide. Our services are used in a variety of ways, including strategic planning, product and sales forecasting, risk and sensitivity management, and as investment research.
Our Major Activities
Multi-users market reports
Database-RICDB
Custom Research
Company Search
RICDB (http://www.researchinchina.com/data/database.html ), is a visible financial data base presented by map and graph covering global and China macroeconomic data, industry data, and company data. It has included nearly 500,000 indices (based on time series), and is continuing to update and increase. The most significant feature of this base is that the vast majority of indices (about 400,000) can be displayed in map.
After purchase of our report, you will be automatically granted to enjoy 2 weeks trial service of RICDB for free.
After trial, you can decide to become our formal member or not. We will try our best to meet your demand. For more information, please find at www.researchinchina.com
For any problems, please contact our service team at:
Room 502, Block 3, Tower C, Changyuan Tiandi Building, No. 18, Suzhou Street, Haidian District, Beijing, China 100080 Phone: +86 10 82600828 ● Fax: +86 10 82601570 ● www.researchinchina.com ● [email protected]
RICDB service


![Systems for the Rubber Tire Industry GB[1]](https://img.pdfslide.us/doc/110x75/547af145b47959a4098b4ca7/systems-for-the-rubber-tire-industry-gb1.jpg)