Embed Size (px)
Citation preview
What is a typical y7
student? What house spent the most
money? By Jade Kashemsant 7A
Quantitative
Question
-How much
money do
you spend
for food in
school? (Per
Money spend (B.)
Centre
(x)
Tally Frequency
(f)
Total event
(fx)
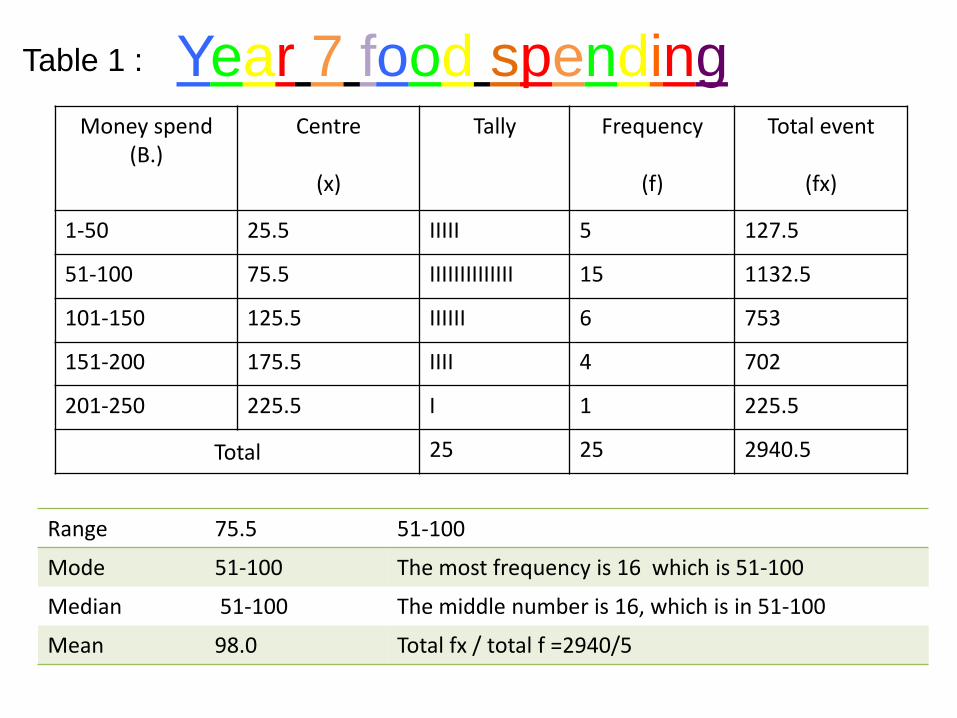
1-50 25.5 IIIII 5 127.5
51-100 75.5 IIIIIIIIIIIIII 15 1132.5
101-150 125.5 IIIIII 6 753
151-200 175.5 IIII 4 702
201-250 225.5 I 1 225.5
Total 25 25 2940.5
Year 7 food spending
Range 75.5 51-100
Mode 51-100 The most frequency is 16 which is 51-100
Median 51-100 The middle number is 16, which is in 51-100
Mean 98.0 Total fx / total f =2940/5
Table 1 :
Money spend (B.)
Centre
(x)
Tally Frequency
(f)
Total event
(fx)
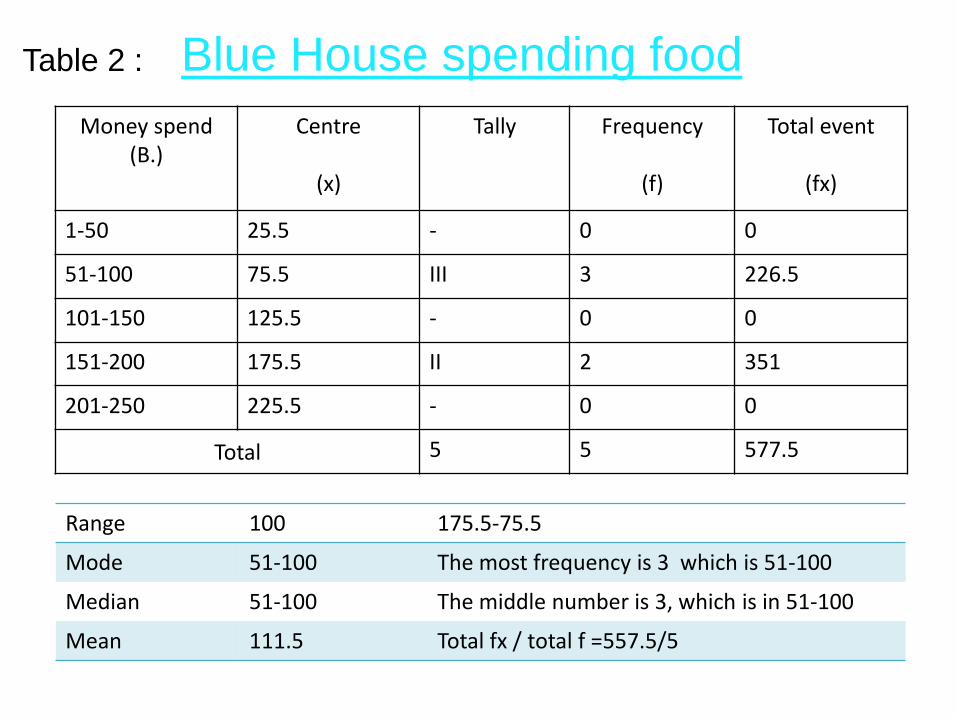
1-50 25.5 - 0 0
51-100 75.5 III 3 226.5
101-150 125.5 - 0 0
151-200 175.5 II 2 351
201-250 225.5 - 0 0
Total 5 5 577.5
Blue House spending food
Range 100 175.5-75.5
Mode 51-100 The most frequency is 3 which is 51-100
Median 51-100 The middle number is 3, which is in 51-100
Mean 111.5 Total fx / total f =557.5/5
Table 2 :
Money spend (B.)
Centre
(x)
Tally Frequency
(f)
Total event
(fx)
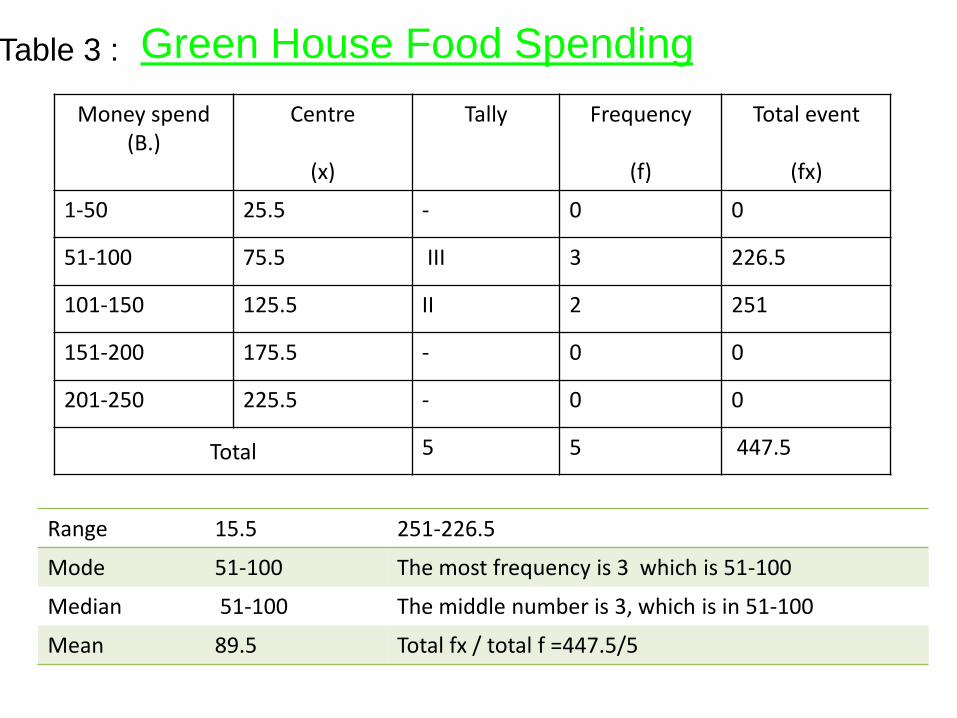
1-50 25.5 - 0 0
51-100 75.5 III 3 226.5
101-150 125.5 II 2 251
151-200 175.5 - 0 0
201-250 225.5 - 0 0
Total 5 5 447.5
Range 15.5 251-226.5
Mode 51-100 The most frequency is 3 which is 51-100
Median 51-100 The middle number is 3, which is in 51-100
Mean 89.5 Total fx / total f =447.5/5
Green House Food Spending Table 3 :
Money spend (B.)
Centre
(x)
Tally Frequency
(f)
Total event
(fx)
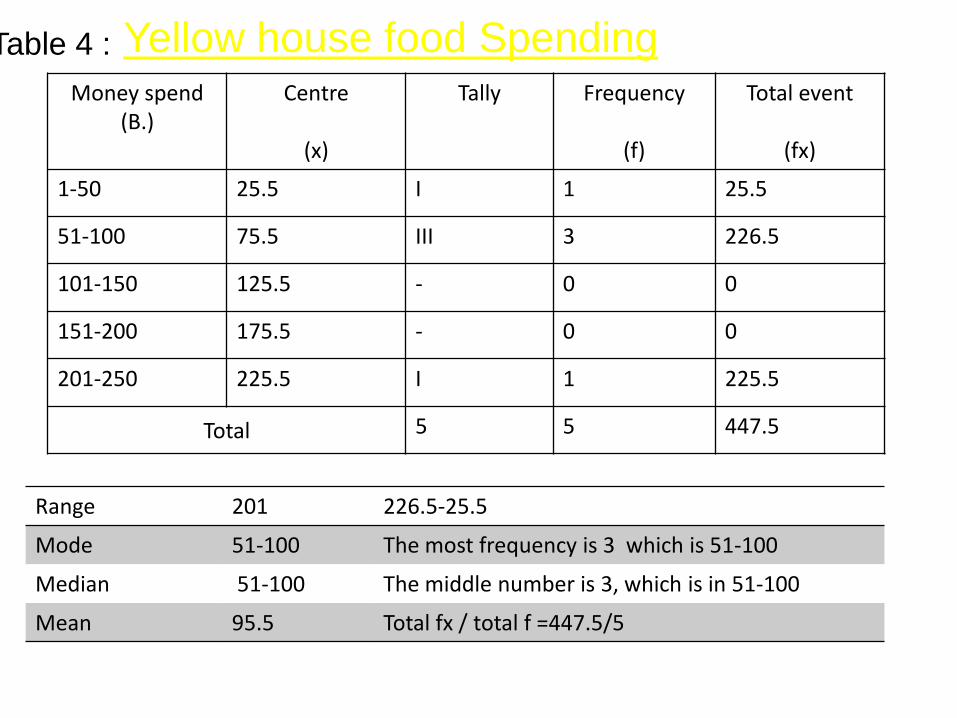
1-50 25.5 I 1 25.5
51-100 75.5 III 3 226.5
101-150 125.5 - 0 0
151-200 175.5 - 0 0
201-250 225.5 I 1 225.5
Total 5 5 447.5
Range 201 226.5-25.5
Mode 51-100 The most frequency is 3 which is 51-100
Median 51-100 The middle number is 3, which is in 51-100
Mean 95.5 Total fx / total f =447.5/5
Yellow house food Spending Table 4 :
Money spend (B.)
Centre
(x)
Tally Frequency
(f)
Total event
(fx)
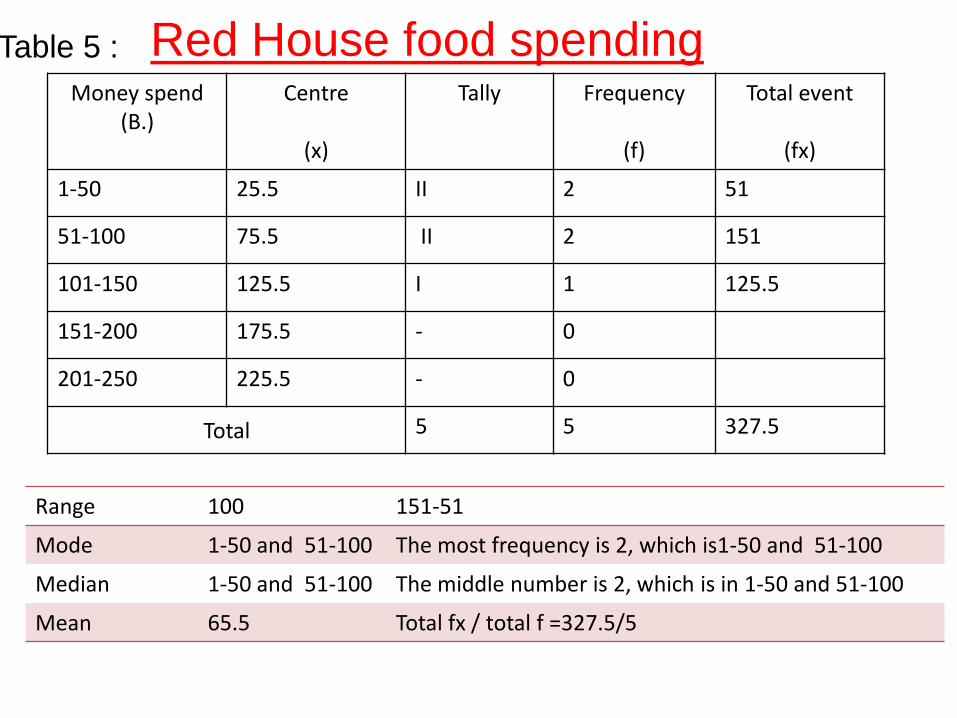
1-50 25.5 II 2 51
51-100 75.5 II 2 151
101-150 125.5 I 1 125.5
151-200 175.5 - 0
201-250 225.5 - 0
Total 5 5 327.5
Range 100 151-51
Mode 1-50 and 51-100 The most frequency is 2, which is1-50 and 51-100
Median 1-50 and 51-100 The middle number is 2, which is in 1-50 and 51-100
Mean 65.5 Total fx / total f =327.5/5
Red House food spending Table 5 :
Money spend (B.)
Centre
(x)
Tally Frequency
(f)
Total event
(fx)
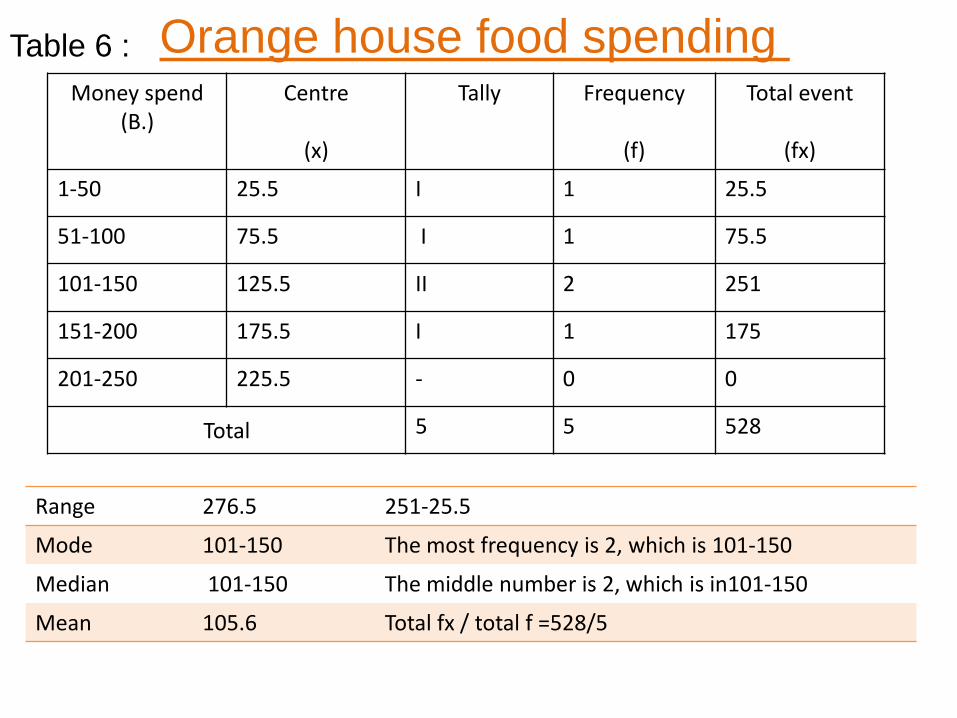
1-50 25.5 I 1 25.5
51-100 75.5 I 1 75.5
101-150 125.5 II 2 251
151-200 175.5 I 1 175
201-250 225.5 - 0 0
Total 5 5 528
Range 276.5 251-25.5
Mode 101-150 The most frequency is 2, which is 101-150
Median 101-150 The middle number is 2, which is in101-150
Mean 105.6 Total fx / total f =528/5
Orange house food spending Table 6 :
Money spend (B.)
Centre
(x)
Tally Frequency
(f)
Total event
(fx)
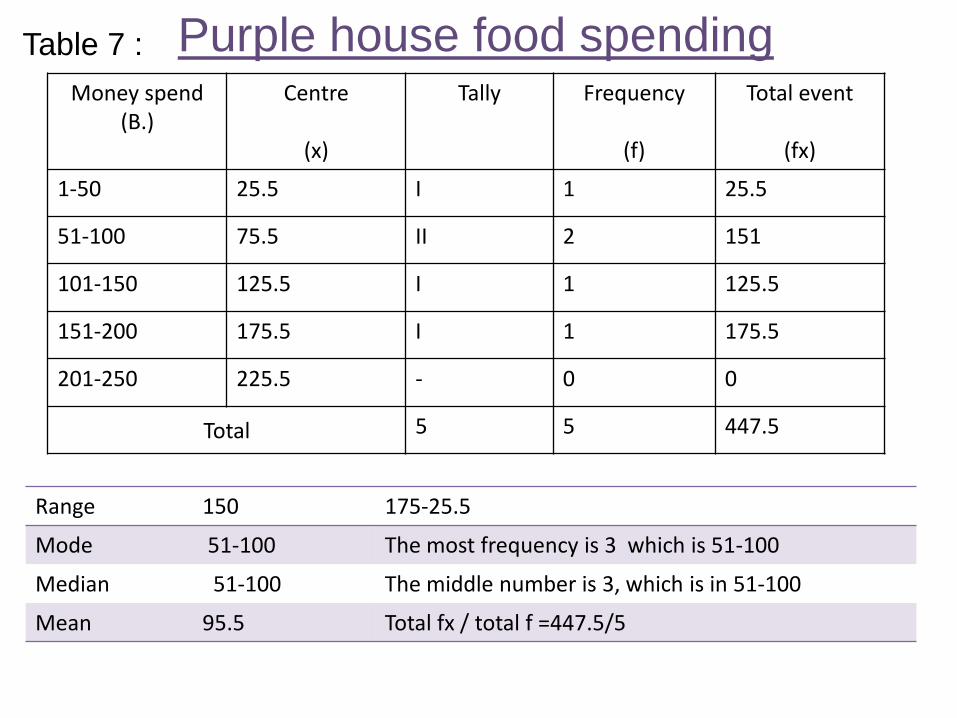
1-50 25.5 I 1 25.5
51-100 75.5 II 2 151
101-150 125.5 I 1 125.5
151-200 175.5 I 1 175.5
201-250 225.5 - 0 0
Total 5 5 447.5
Range 150 175-25.5
Mode 51-100 The most frequency is 3 which is 51-100
Median 51-100 The middle number is 3, which is in 51-100
Mean 95.5 Total fx / total f =447.5/5
Purple house food spending Table 7 :
0
20
40
60
80
100
120
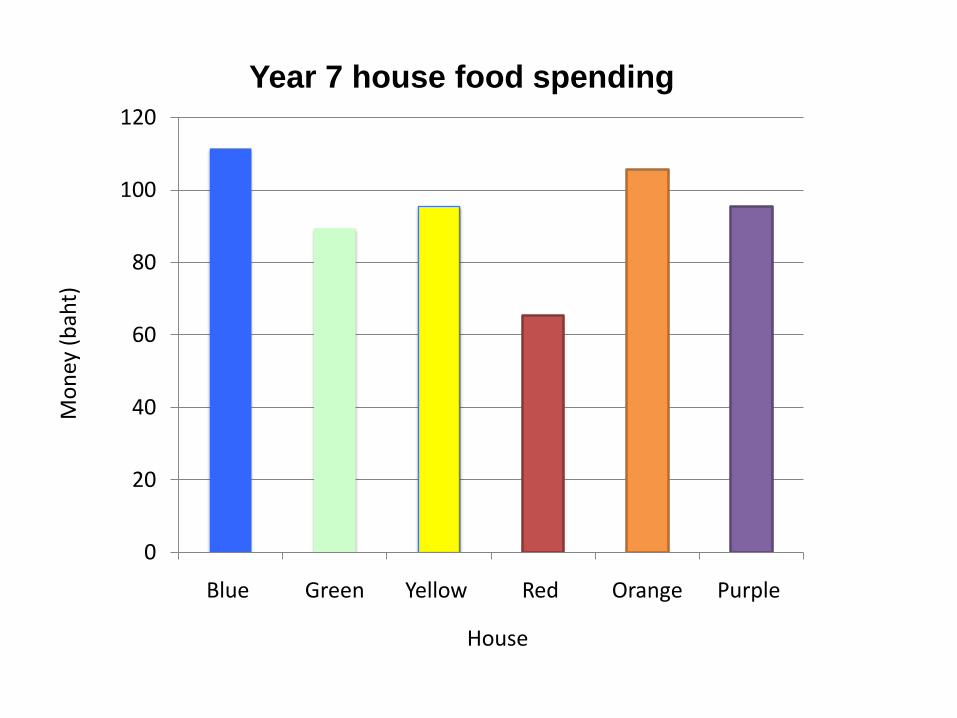
Blue Green Yellow Red Orange Purple
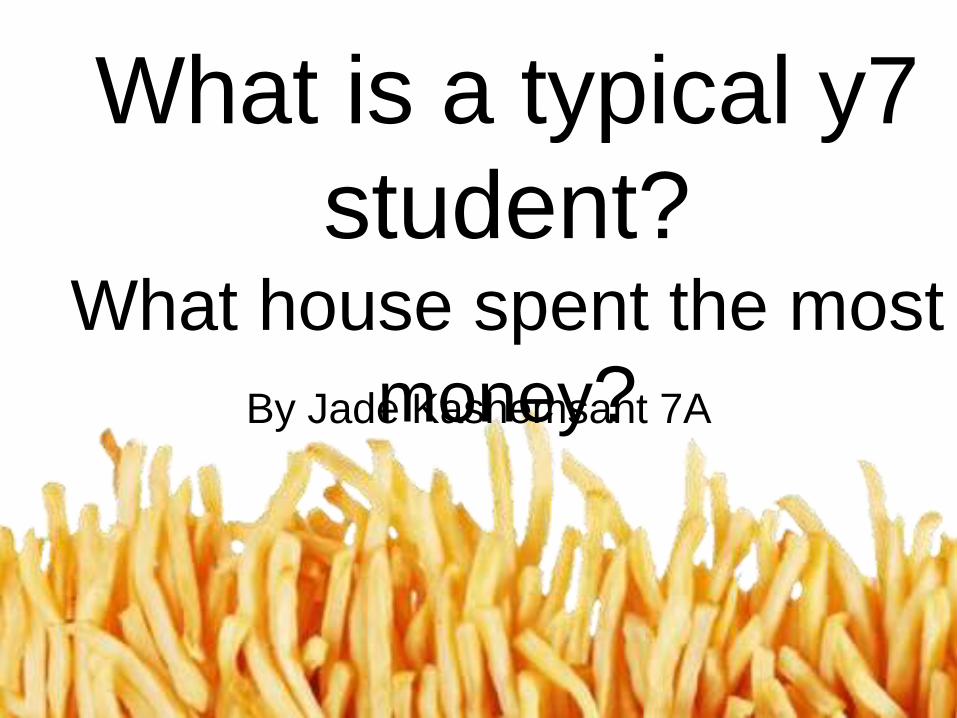
Year 7 house food spending M
on
ey (
bah
t)
House

I used column chart because it see the different easy . It very to explain by chart . It colorful.
The graph show that blue spent money the most, Red house use lower money. The mean is the best useful for average because it tell the average for the money spending.
The average of the house that use money the most to lower Blue, Orange, Yellow, Purple, Green and Red
Qualitative Question
What type do you
usually eat at
school?
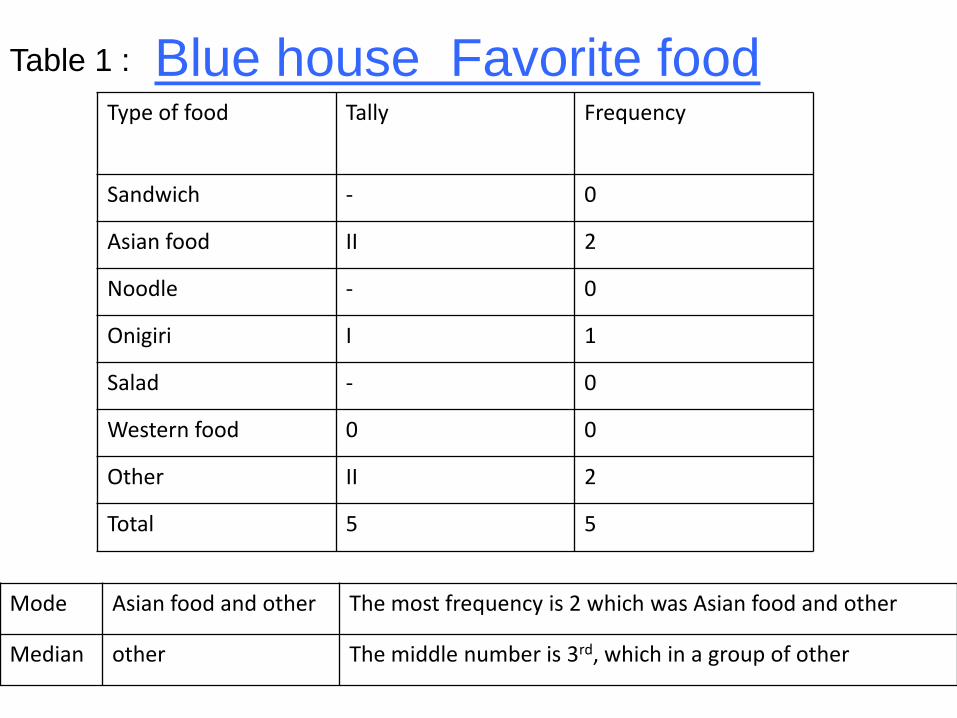
Type of food Tally Frequency
Sandwich - 0
Asian food II 2
Noodle - 0
Onigiri I 1
Salad - 0
Western food 0 0
Other II 2
Total 5 5
Mode Asian food and other The most frequency is 2 which was Asian food and other
Median other The middle number is 3rd, which in a group of other
Blue house Favorite food Table 1 :
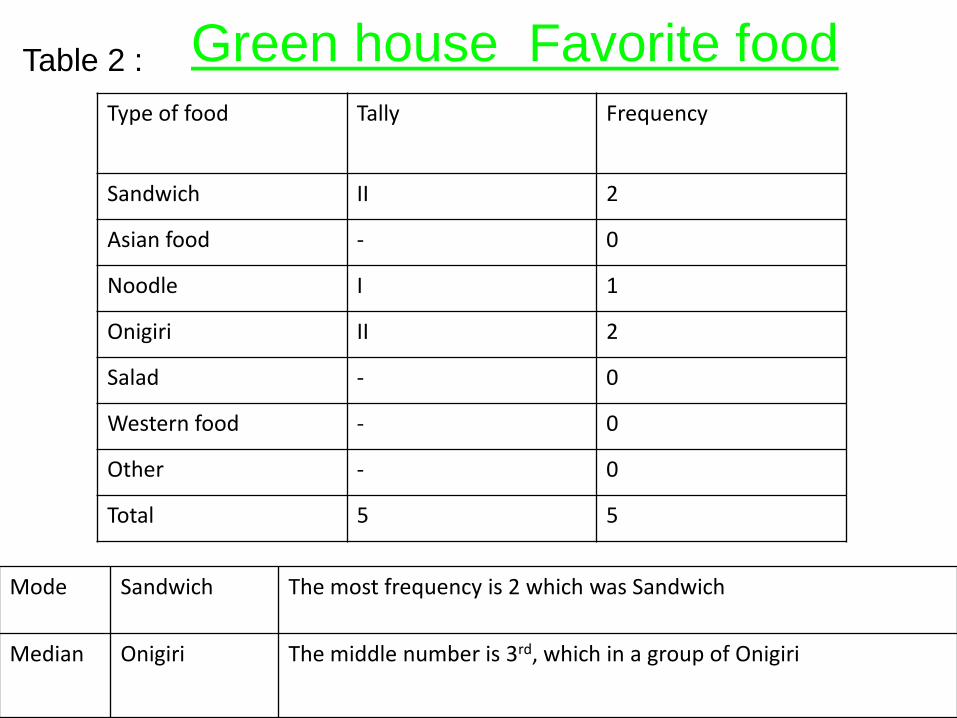
Type of food Tally Frequency
Sandwich II 2
Asian food - 0
Noodle I 1
Onigiri II 2
Salad - 0
Western food - 0
Other - 0
Total 5 5
Mode Sandwich The most frequency is 2 which was Sandwich
Median Onigiri The middle number is 3rd, which in a group of Onigiri
Green house Favorite food Table 2 :
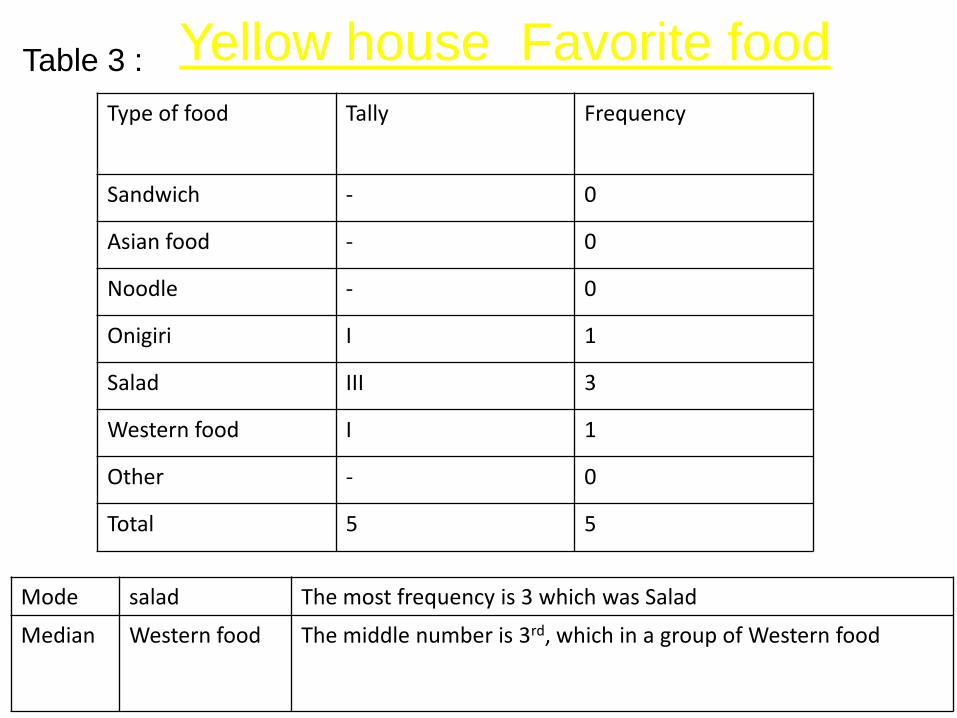
Type of food Tally Frequency
Sandwich - 0
Asian food - 0
Noodle - 0
Onigiri I 1
Salad III 3
Western food I 1
Other - 0
Total 5 5
Mode salad The most frequency is 3 which was Salad
Median Western food The middle number is 3rd, which in a group of Western food
Yellow house Favorite food Table 3 :
Type of food Tally Frequency
Sandwich I 1
Asian food I 1
Noodle - 0
Onigiri - 0
Salad I 1
Western food II 2
Ohter - 0
Total 5 5
Mode Western food The most frequency is 2 which was Western food
Median salad The middle number is 3rd, which in a group of Salad
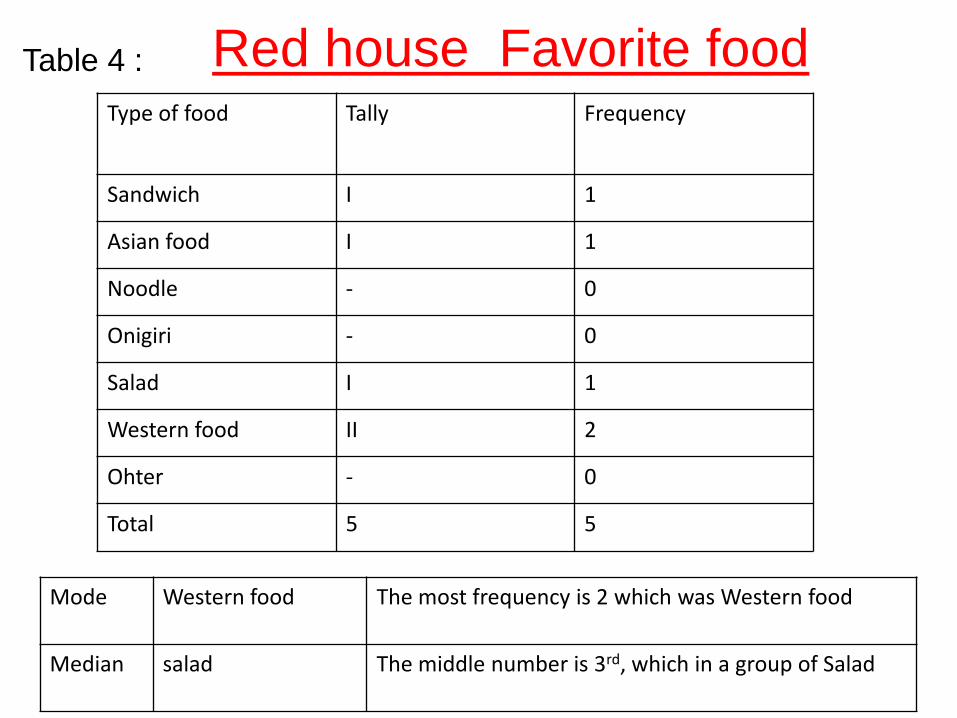
Red house Favorite food Table 4 :
Type of food Tally Frequency
Sandwich I 1
Asian food I 1
Noodle 0
Onigiri 0
Salad I 1
Western food II 2
Other - 0
Total 5 5
Mode western food The most frequency is 2 which was western food
Median Salad The middle number is 3rd, which in a group of salad
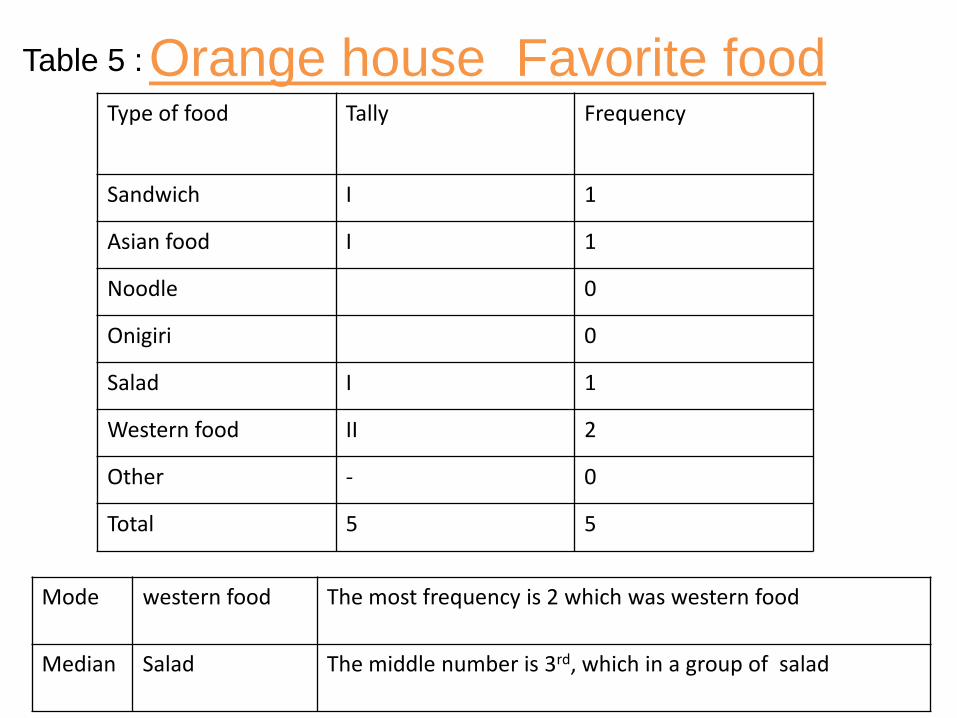
Orange house Favorite food Table 5 :

Type of food Tally Frequency
Sandwich II 2
Asian food 0 0
Noodle 0 0
Onigiri I 1
Salad II 2
Western food 0 0
Other
Total 5 5
Mode Salad and Sandwich The most frequency is 2 which was Salad and Sandwich
Median Onigiri The middle number is 3rd, which in a group of Onigiri
Purple house Favorite food Table 6 :
Sandwich13%
Asia food20%
Noodele3%Onigiri
17%
Salad23%
Wester food 17%
other7%
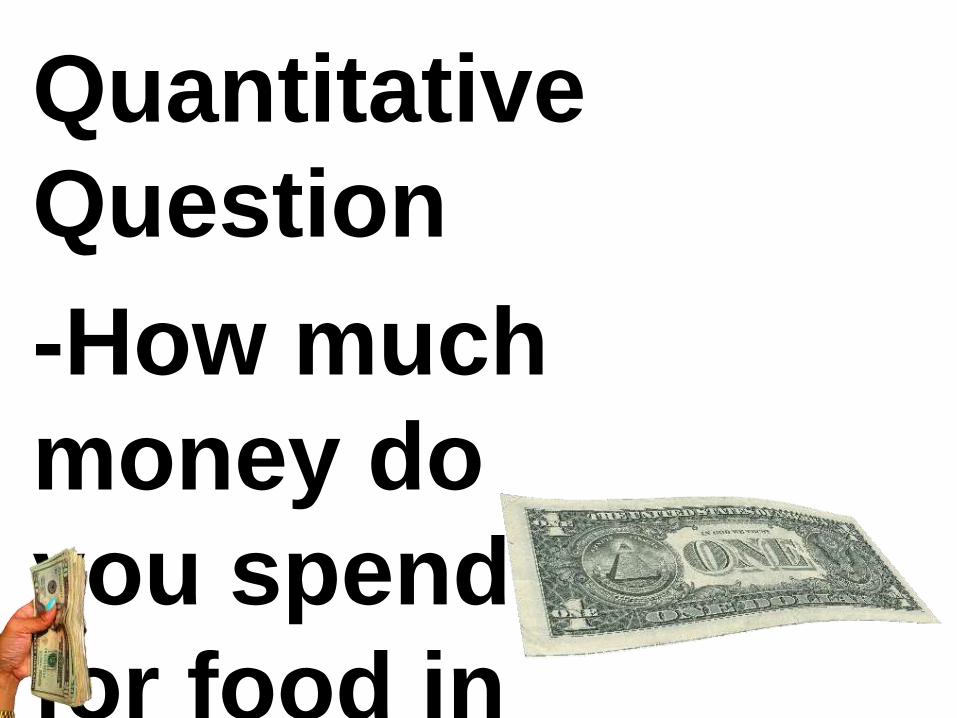
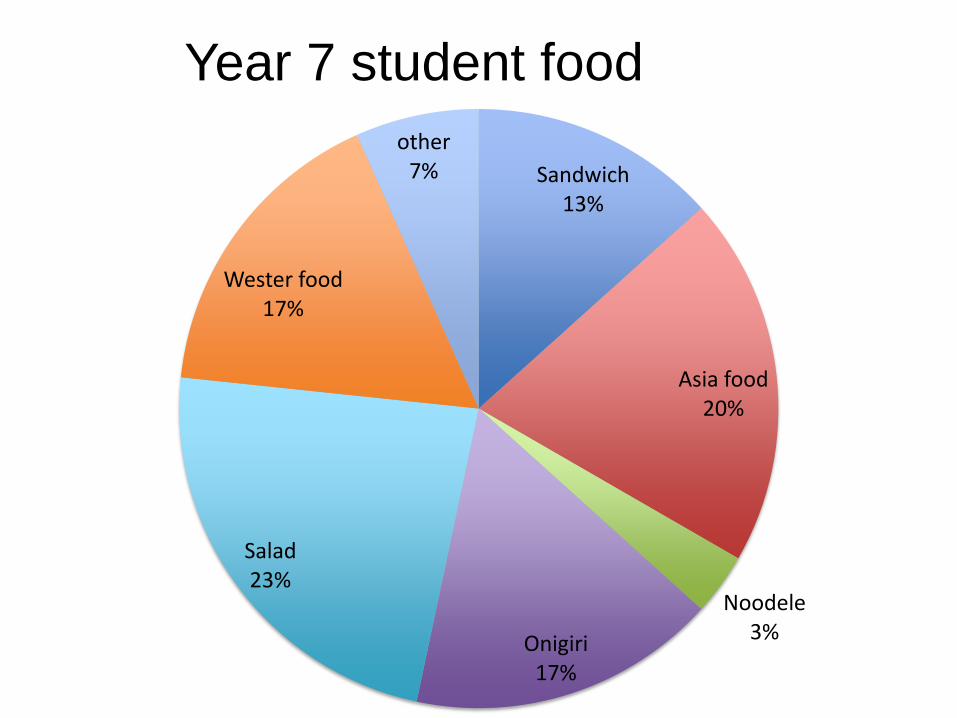
Year 7 student food
Sandwich13%
Asian food20%
Noodle3%
Onigiri17%
Salad23%
Western food 17%
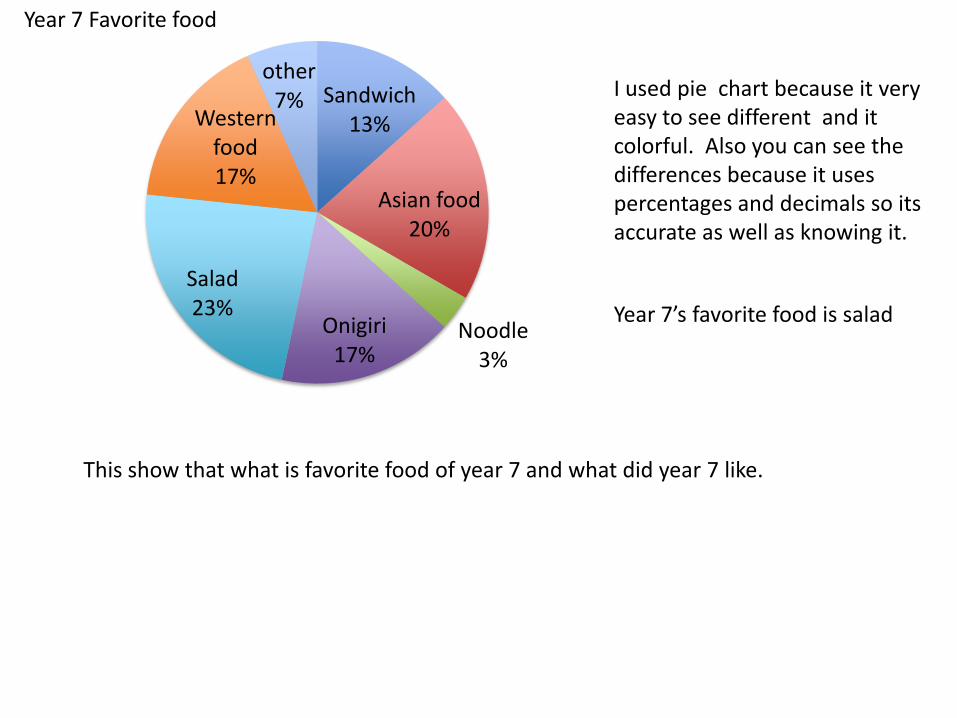
other7% I used pie chart because it very
easy to see different and it colorful. Also you can see the differences because it uses percentages and decimals so its accurate as well as knowing it.
Year 7’s favorite food is salad
This show that what is favorite food of year 7 and what did year 7 like.
Year 7 Favorite food
THANK
YOU !How could I improve next time ? I would prepare time better.Explain a bit more .