Embed Size (px)
Citation preview

NORTH AMERICA OFFICE STRATEGY FOR 2015

Key Data and Trends North America
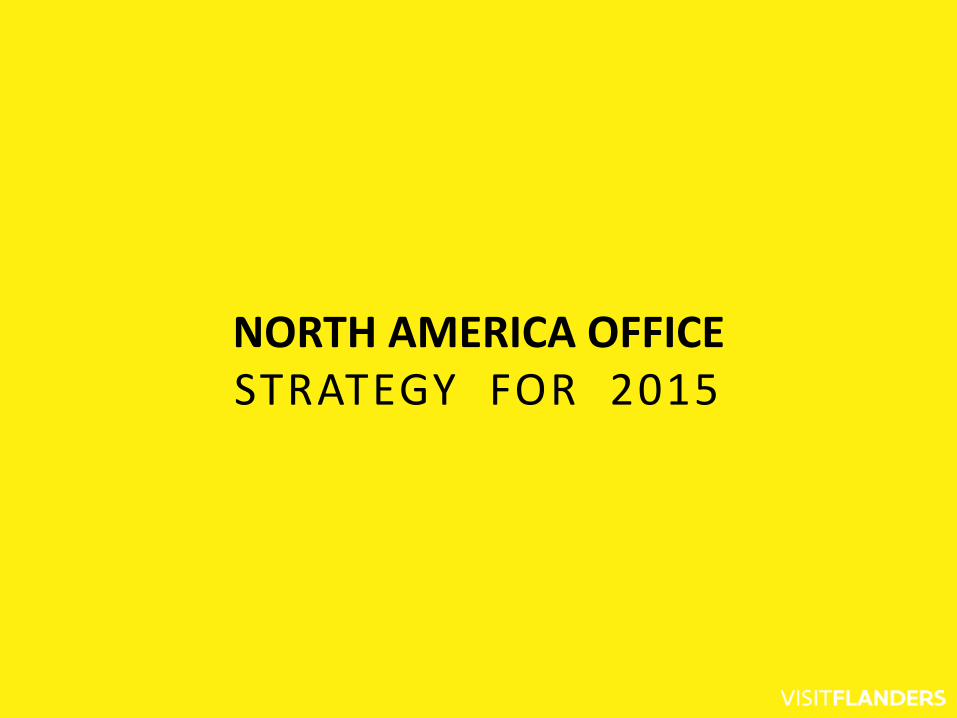
Norht American economic indicators
GDP per capita USA (2013): 52.989 dollar
GDP per capita Canada (2013): 51.717 dollar
Source: Oxford Economics, TDM
GDP year on year change, real, local currency
3,4%
2,5%
1,7% 2,0%
2,5%
1,8%
2,8%
1,9%
0,0%
0,5%
1,0%
1,5%
2,0%
2,5%
3,0%
3,5%
4,0%
2010 2011 2012 2013
Canada USA
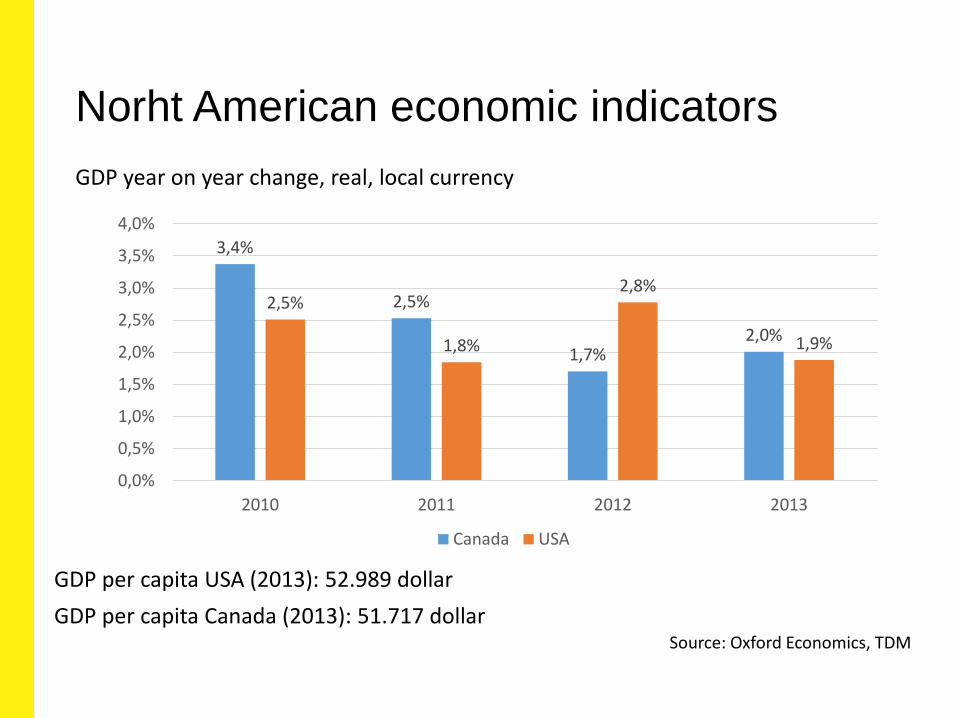
The North American market
Ranking of markets in terms of total outbound travel expenditure (excl transport)
Ranking 2009 Ranking 2013
1 Germany 1 China
2 United States of America 2 United States of America
3 United Kingdom 3 Germany
4 China 4 Russian Federation
5 France 5 United Kingdom
8 Canada 7 Canada
Source: UNWTO
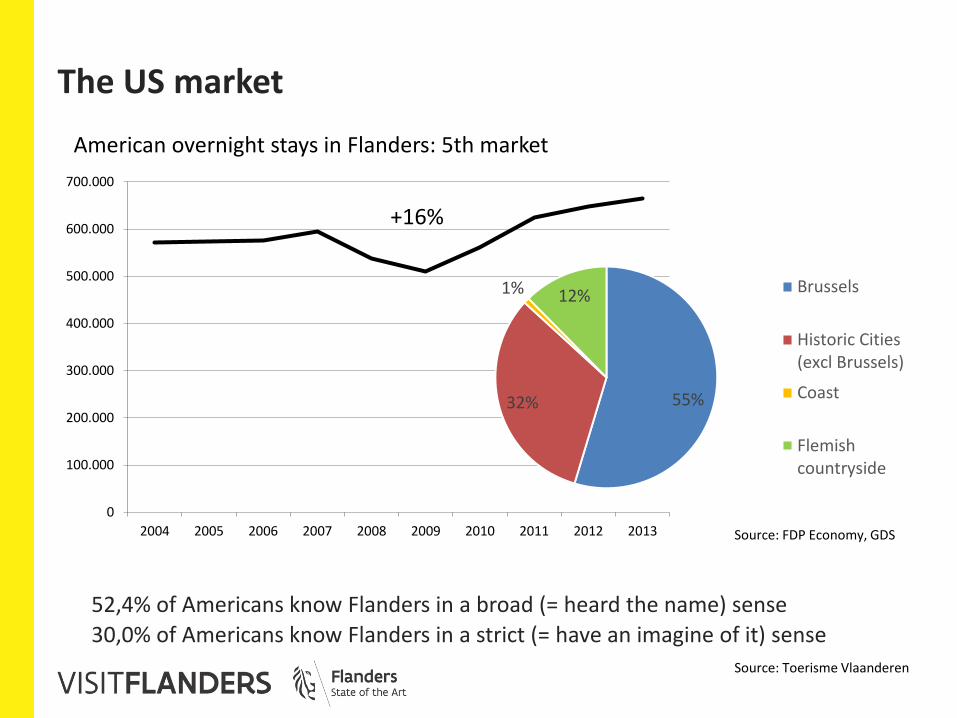
The US market
52,4% of Americans know Flanders in a broad (= heard the name) sense
30,0% of Americans know Flanders in a strict (= have an imagine of it) sense
American overnight stays in Flanders: 5th market
Source: FDP Economy, GDS
Source: Toerisme Vlaanderen
0
100.000
200.000
300.000
400.000
500.000
600.000
700.000
2004 2005 2006 2007 2008 2009 2010 2011 2012 2013
+16%
55% 32%
1% 12% Brussels
Historic Cities(excl Brussels)
Coast
Flemishcountryside
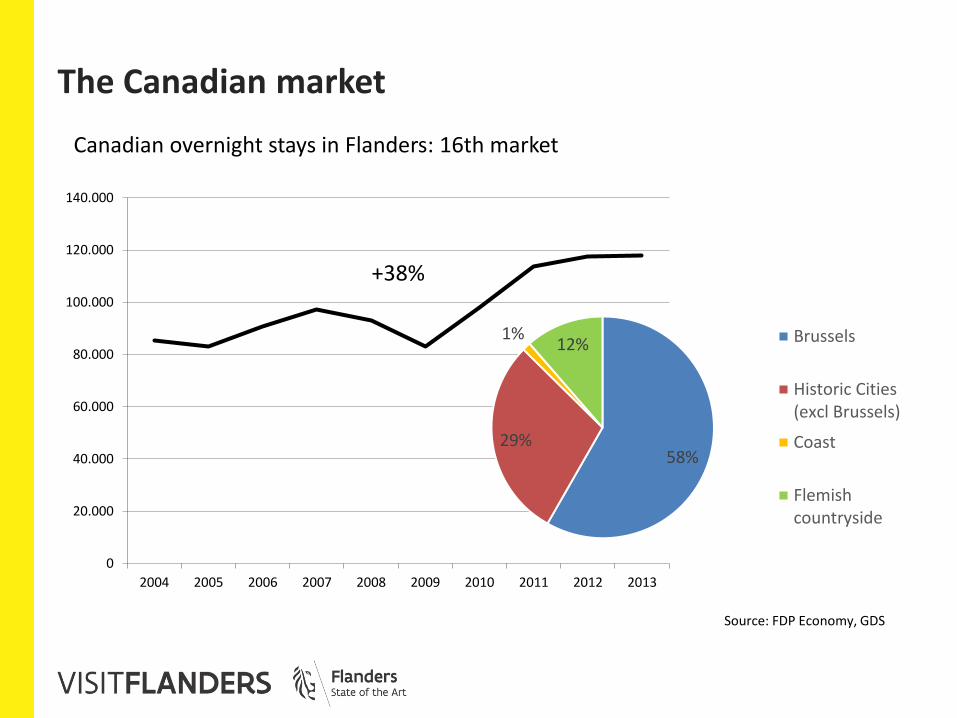
The Canadian market
Canadian overnight stays in Flanders: 16th market
Source: FDP Economy, GDS
0
20.000
40.000
60.000
80.000
100.000
120.000
140.000
2004 2005 2006 2007 2008 2009 2010 2011 2012 2013
+38%
58% 29%
1% 12% Brussels
Historic Cities(excl Brussels)
Coast
Flemishcountryside
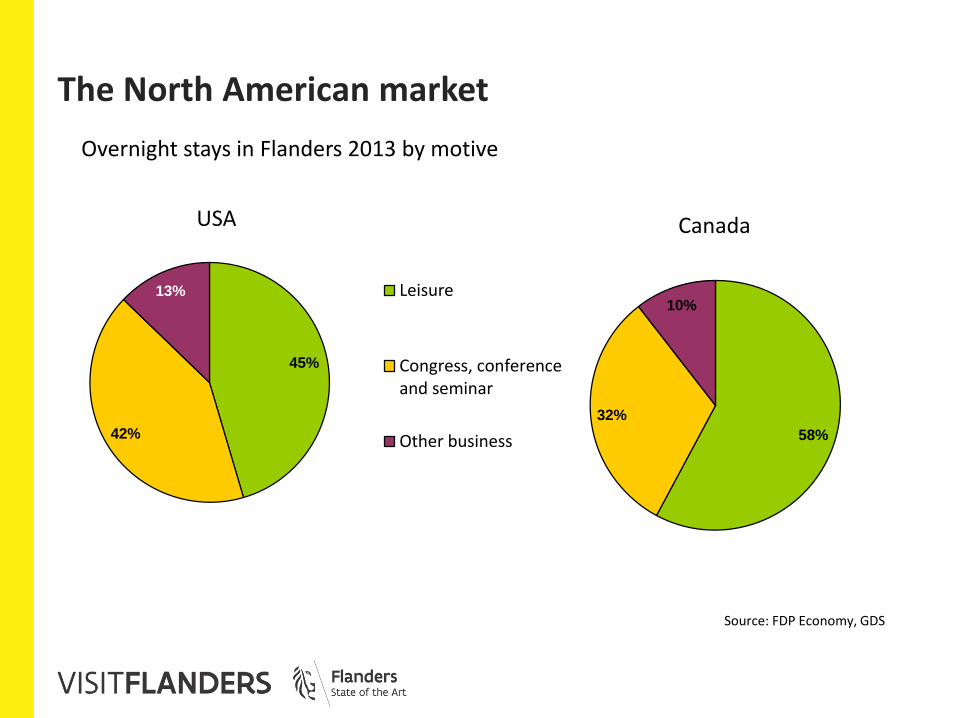
The North American market
45%
42%
13%
USA
Leisure
Congress, conferenceand seminar
Other business
Overnight stays in Flanders 2013 by motive
Source: FDP Economy, GDS
58%
32%
10%
Canada
NORTH AMERICA OFFICE ACTION PLAN
# We Are State of the Art Magic...
Marketing Strategy on a shoe string budget
Maximum ROI
Limited Investment
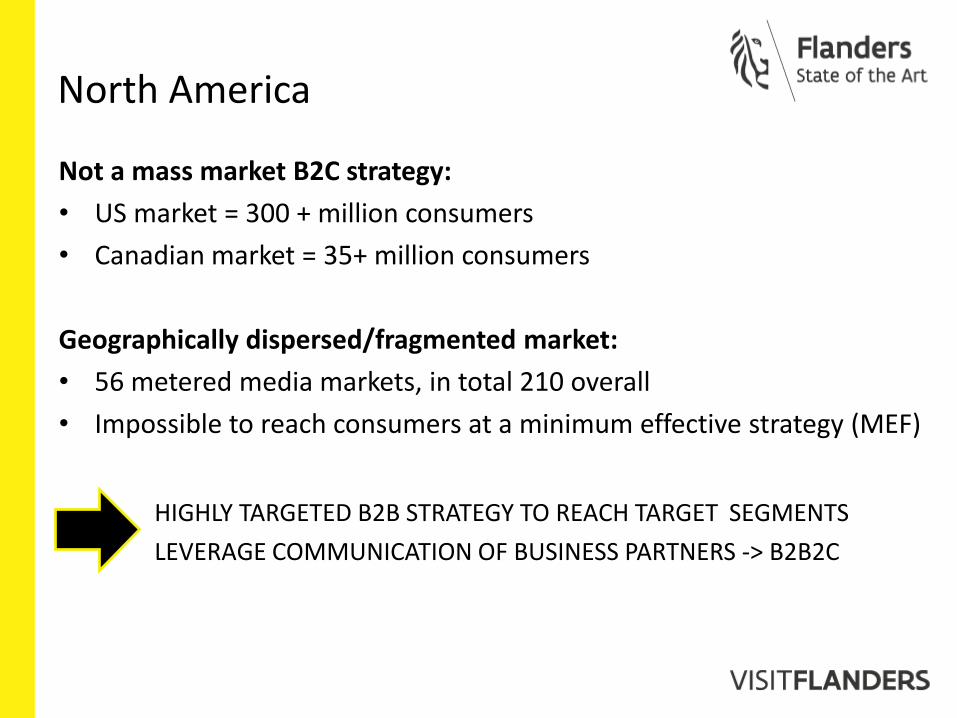
North America
Not a mass market B2C strategy:
• US market = 300 + million consumers
• Canadian market = 35+ million consumers
Geographically dispersed/fragmented market:
• 56 metered media markets, in total 210 overall
• Impossible to reach consumers at a minimum effective strategy (MEF)
HIGHLY TARGETED B2B STRATEGY TO REACH TARGET SEGMENTS
LEVERAGE COMMUNICATION OF BUSINESS PARTNERS -> B2B2C
Traveler profile and action for North America
• Seeking more authentic and self-fulfilling experience.
• Aspirational destination.
• Set of tourism products/experiences.
• Online/digital and mobile technology, online advertising and social media marketing.
• Availability of different components of the destination.
Flanders
State of the Art
Focus: Gastronomy Art & Architecture Cycling Fashion WWI

WWI Event Canada TORONTO 4TH AUGUST 2014
Target
Markets
USA:
English
Spanish
Canada:
English
French
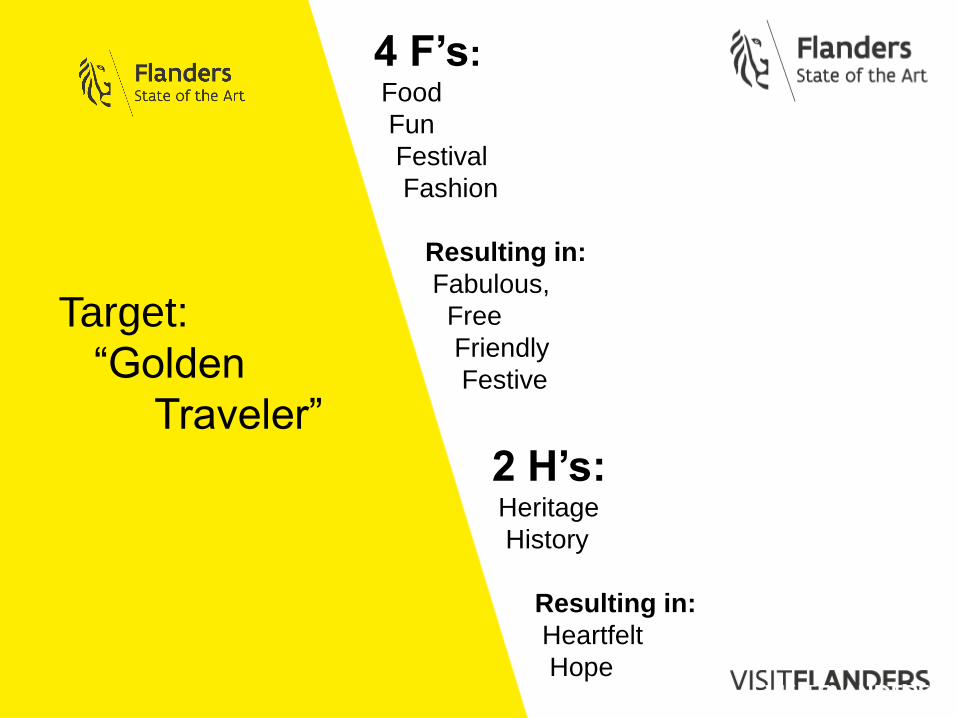
Target:
“Golden
Traveler”
4 F’s: Food
Fun
Festival
Fashion
Resulting in:
Fabulous,
Free
Friendly
Festive
2 H’s: Heritage
History
Resulting in:
Heartfelt
Hope
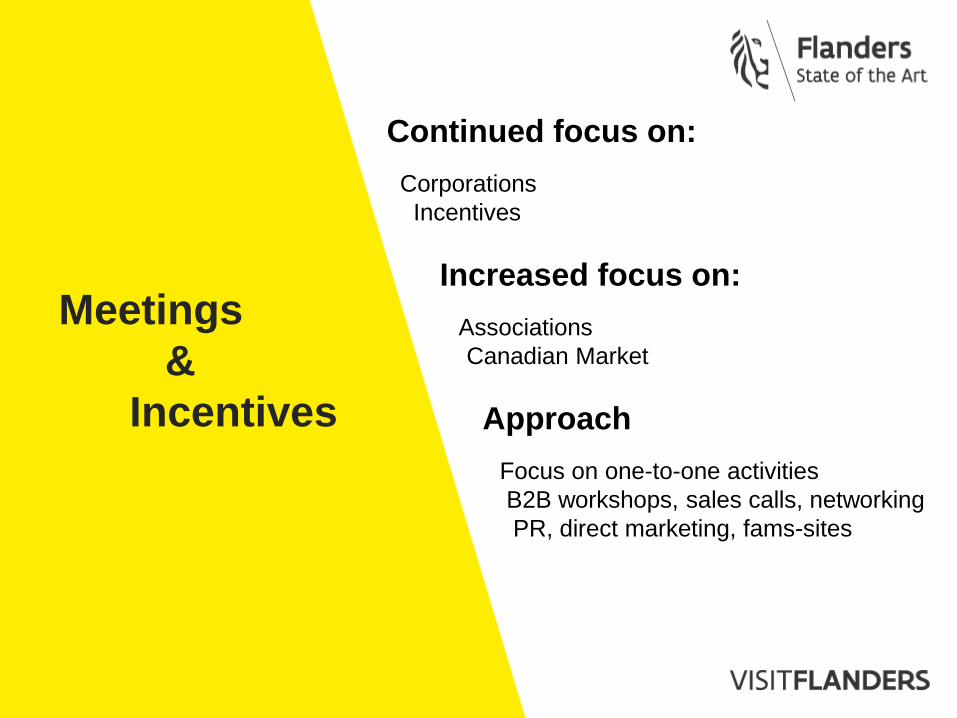
Meetings
&
Incentives
Continued focus on:
Corporations
Incentives
Increased focus on:
Associations
Canadian Market
Approach
Focus on one-to-one activities
B2B workshops, sales calls, networking
PR, direct marketing, fams-sites
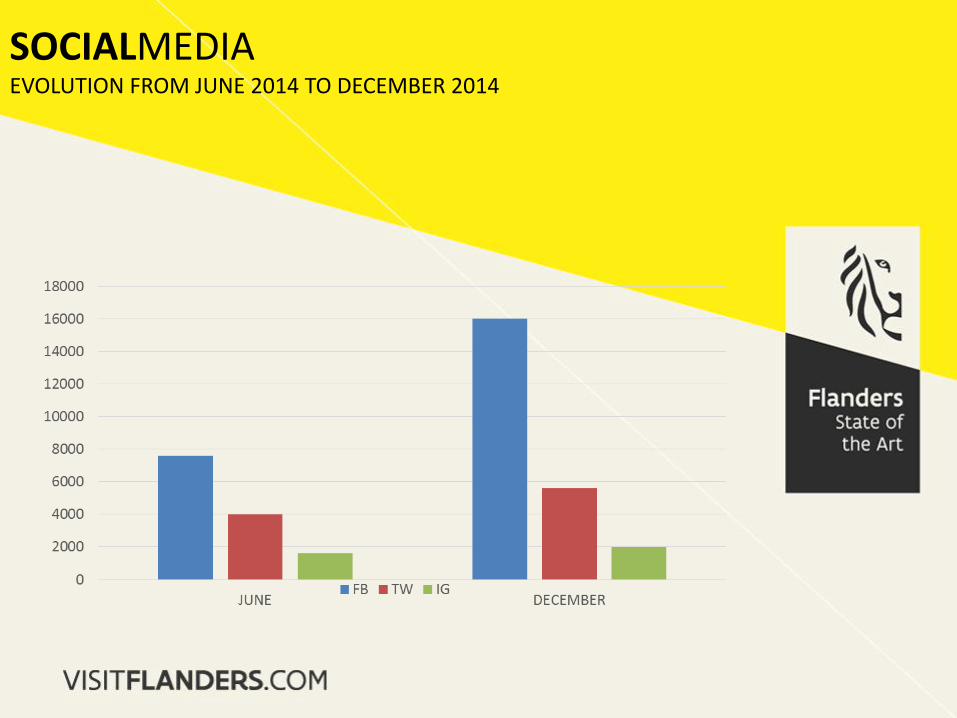
SOCIALMEDIA EVOLUTION FROM JUNE 2014 TO DECEMBER 2014
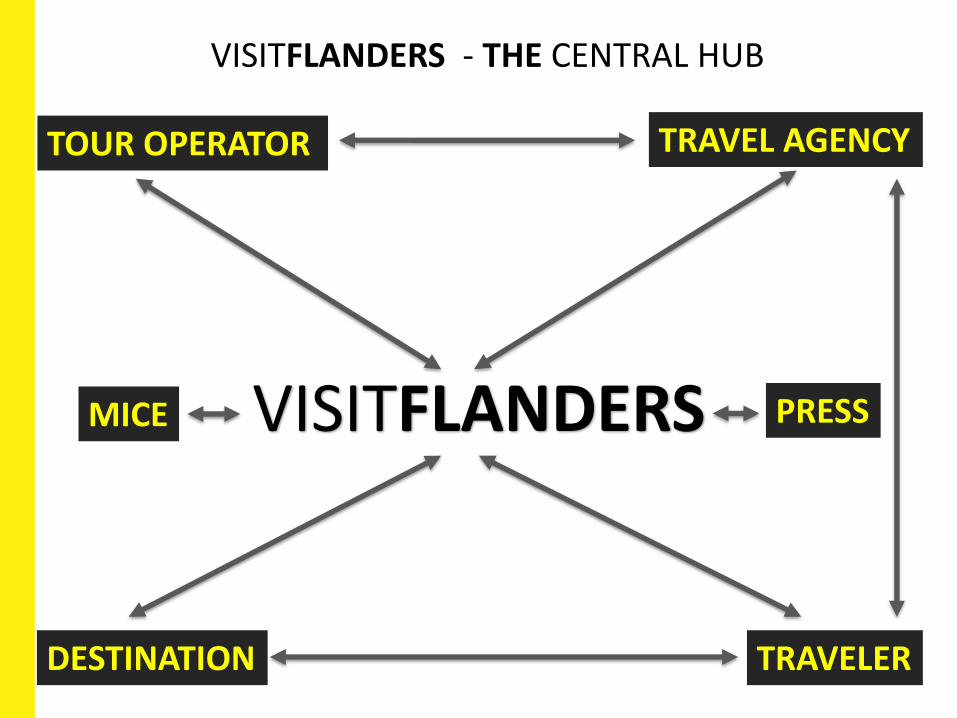
VISITFLANDERS
TRAVELER DESTINATION
TOUR OPERATOR TRAVEL AGENCY
MICE PRESS
VISITFLANDERS - THE CENTRAL HUB
THANK YOU
Line Vreven Director, Regional Manager
Brecht Putman, MICE Manager Marcos Stupenengo, Press Manager
Marco Frank, Trade Manager Wimke Nijs, Office and Project Manager
North America Office
VISITFLANDERS