Embed Size (px)
Citation preview

Telling better stories with data at the Tour de France 2016
Here’s what you can look forward to.

About this year’s race
Grand Départ date Saturday 2 July
Longer distance 3,535 km versus 3,360 km in 2015
Route La Manche to Paris, visiting 16 new places along the route
Border crossings Visiting 3 neighbouring countries: Spain, Principality of Andorra, Switzerland
Stages 9 flat stages, 1 hilly stage, 9 mountain stages, 4 summit finishes: Andorre Arcalis, Mont Ventoux, Finhaut-Emosson and Saint-Gervais Mont Blanc, 2 individual time trial stages, 2 rest days
Finish date Sunday 24 July
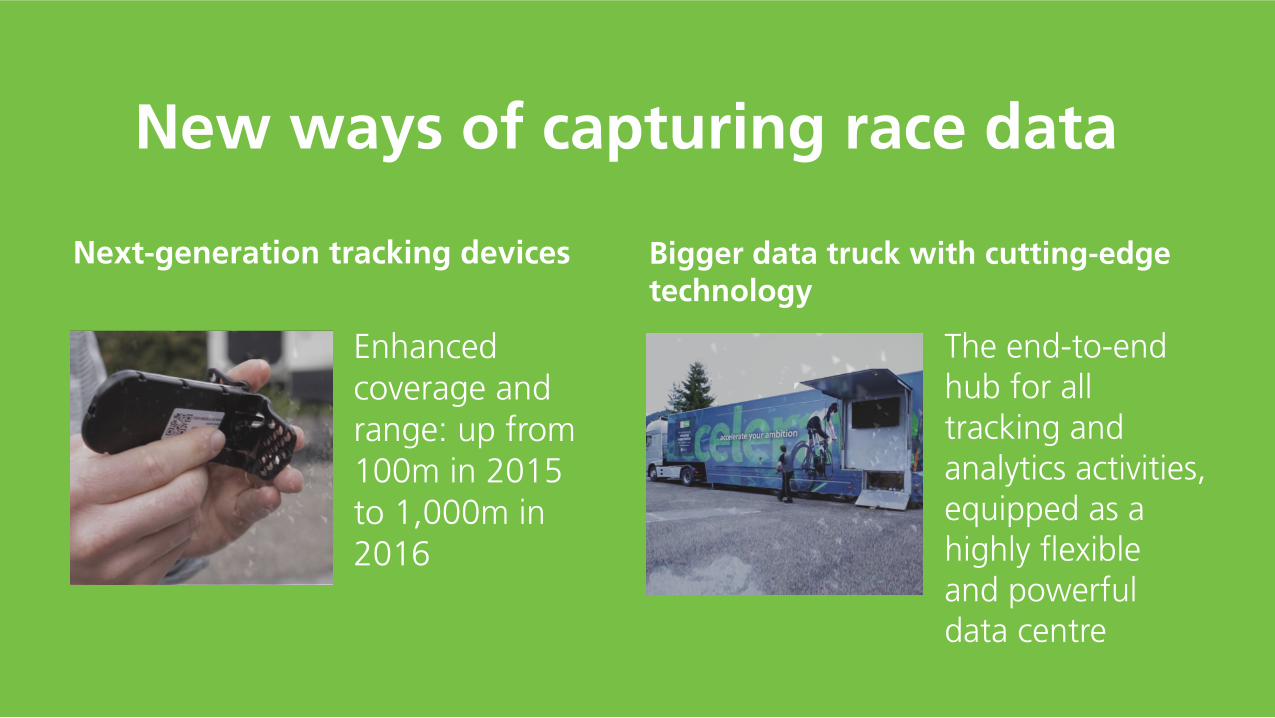
New ways of capturing race data
Next-generation tracking devices
Enhanced coverage and range: up from 100m in 2015 to 1,000m in 2016
Bigger data truck with cutting-edge technology
The end-to-end hub for all tracking and analytics activities, equipped as a highly flexible and powerful data centre

New insights into race tactics and more dataIn addition to live speed, distances between groups of riders, and
position in the peloton, we also track …
Live gradient for every rider The higher the gradient, the steeper the hill,
the harder the rider must work
Live wind speed and direction Strong headwinds cause lower speed; strong
crosswinds eliminate slipstreams

New ways of analysing race data
Increased processing power and performance
improvements Handling even more data,
even faster
This year’s analytics platform delivers…
Intelligent data handling
Improved handling of real-world
data challenges, automatically bridging
transmission gaps
Time trial functionality New features to
provide insights into time trial stages
Even more accurate gaps and groups
calculations A detailed view of the
race in action
Intelligent data handling
Improved handling of real-world
data challenges, automatically bridging
transmission gaps
Time trial functionality New features to
provide insights into time trial stages
Even more accurate gaps and groups
calculations A detailed view of the
race in action
Increased processing power and performance
improvements Handling even more data,
even faster

New ways of displaying
and publishing race data
Professional cycling insights Adding strategy commentary from a cycling journalist
New commentator’s appPuts race data at the fingertips of accredited media
New television graphics Giving broadcasters more options to display live data during broadcasts
New Tour de France Race Center website A second-screen hub integrating all live content during the race
Updated live-tracking websiteFollow your favourite riders on a website that’s easy to navigate and incorporates a range of new features
New commentator’s
New television graphics
New Tour de France Race Center website
Updated live-tracking website
Professional cycling insights

We’re telling better stories through data!How does the solution work?
Each rider is fitted with a GPS tracker.
The trackers communicate with each other as well as with sensors in the race and team vehicles to create a mesh network.
The data is relayed to the Dimension Data big data truck.
Inside the data truck the data is captured and analysed using an advanced digital analytics platform, powered by our cloud.
The data is streamed from the race vehicles to the aircraft.
Upload of data from the Dimension Data truck to the Dimension Data cloud.

Visit dimensiondata.com/tourdefrance
for more about how we’re revolutionising the viewing experience of the Tour de France.