Embed Size (px)
Citation preview
EPM Technologies: Energy and Carbon savings, 23 Jan. 2013, Webinar, E. Baake
1
Electromagnetic Processing of Materials in European Industry
Webinar 23 January, 2013
Technologies for the Electromagnetic Processing of Materials - Energy and Carbon savings
E. Baake, B. Ubbenjans,
Institute of Electrotechnology, Leibniz University of Hanover, Hanover, Germany
EPM Technologies: Energy and Carbon savings, 23 Jan. 2013, Webinar, E. Baake
2
Outline
Introduction, content and aim Primary energy factors & CO2-emission factors Energy consumption of the European industry (EU27) Three different transition scenarios Iron & steel industry Non-ferrous metal industry Chemical industry Glass, pottery & building materials industry Paper & printing industry Summary
EPM Technologies: Energy and Carbon savings, 23 Jan. 2013, Webinar, E. Baake
3
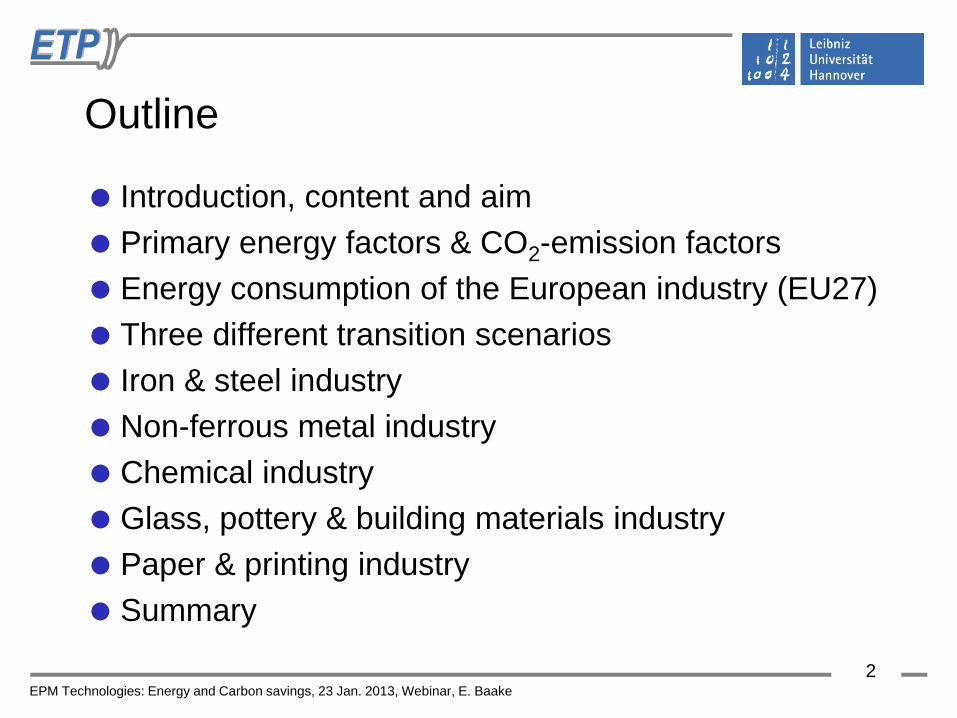
Electromagnetic Processing of Materials (EPM)
- examples -
EPM Technologies: Energy and Carbon savings, 23 Jan. 2013, Webinar, E. Baake
4
Introduction and background
Electromagnetic processing of materials (EPM) provides
significant opportunities for saving primary energy and reducing carbon emissions in industrial processes.
The use of electricity for industrial thermal processes has a final energy share in average of around 10% in Europe (EU-27).
Electricity has the potential to replace up to 100% of other energy carriers used for process heat.
The average primary energy factor gradually decreases from 2.5 currently, to a value between 0 and 1 for a 100% renewable electricity system.
EPM Technologies: Energy and Carbon savings, 23 Jan. 2013, Webinar, E. Baake
5
Content and aim Aim of this work is the demonstration of the scope for energy &
carbon saving in the EU through the use of electromagnetic processing of materials (EPM).
The primary energy factor and CO2-emission factor for electricity has to be estimated year by year till 2050.
From now to the year 2050 transition scenarios should be investigated and compared.
The most energy intensive production processes are switched
from the actual situation to a situation with up to 100% electrically operated industrial processes.
EPM Technologies: Energy and Carbon savings, 23 Jan. 2013, Webinar, E. Baake
6
Primary energy factors (PEF)
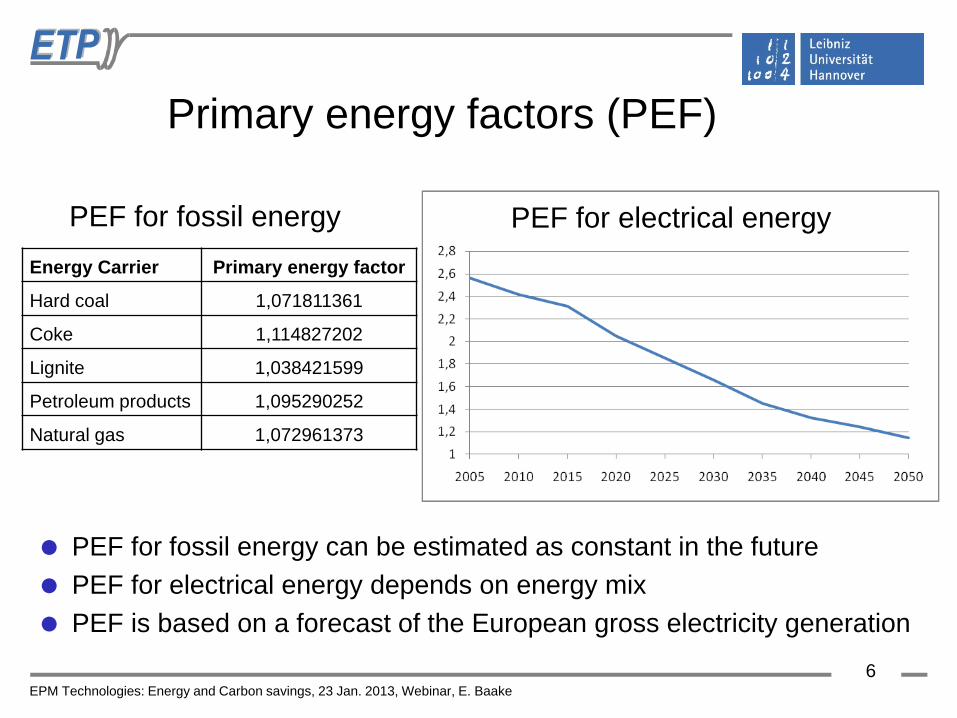
PEF for fossil energy can be estimated as constant in the future PEF for electrical energy depends on energy mix PEF is based on a forecast of the European gross electricity generation
Energy Carrier Primary energy factor
Hard coal 1,071811361
Coke 1,114827202
Lignite 1,038421599
Petroleum products 1,095290252
Natural gas 1,072961373
PEF for electrical energy PEF for fossil energy
EPM Technologies: Energy and Carbon savings, 23 Jan. 2013, Webinar, E. Baake
7
CO2-emission factors
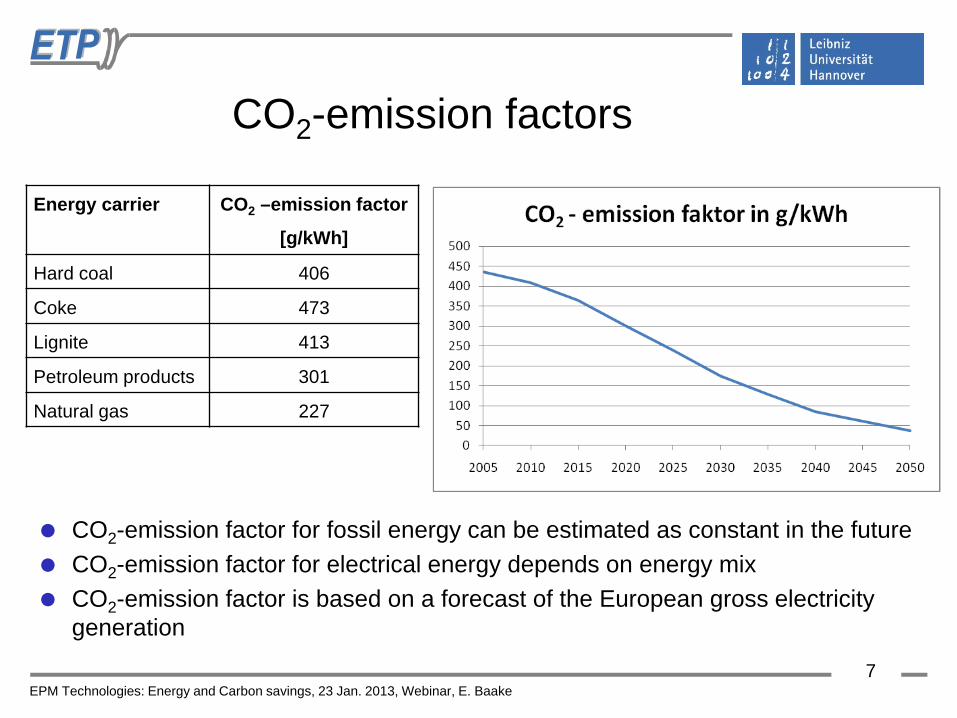
Energy carrier CO2 –emission factor
[g/kWh]
Hard coal 406
Coke 473
Lignite 413
Petroleum products 301
Natural gas 227
CO2-emission factor for fossil energy can be estimated as constant in the future CO2-emission factor for electrical energy depends on energy mix CO2-emission factor is based on a forecast of the European gross electricity
generation
EPM Technologies: Energy and Carbon savings, 23 Jan. 2013, Webinar, E. Baake
8
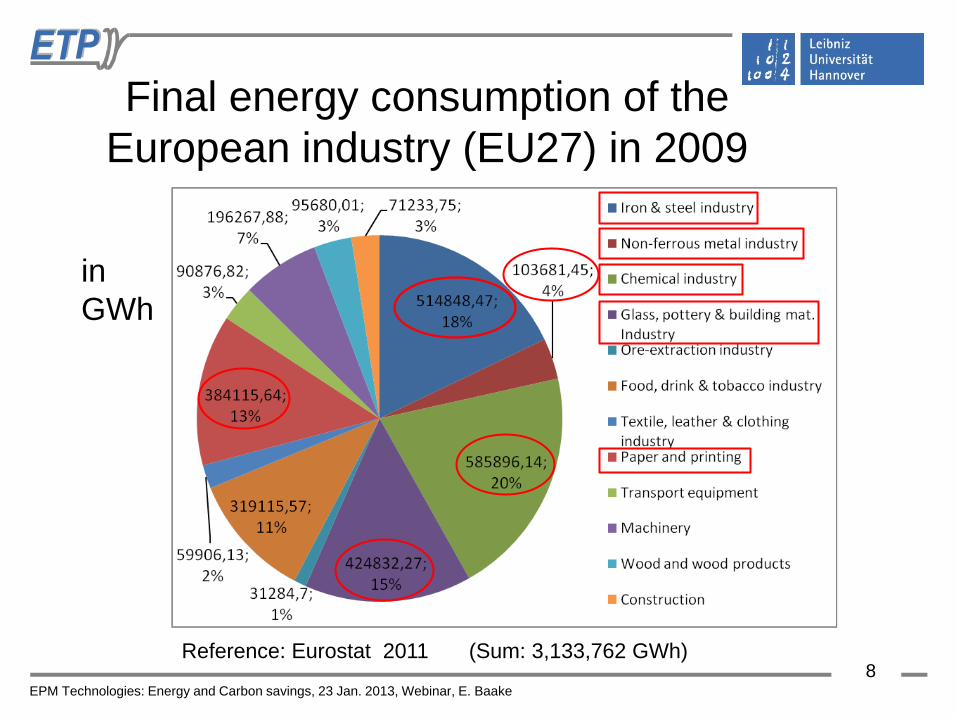
Final energy consumption of the European industry (EU27) in 2009
Reference: Eurostat 2011 (Sum: 3,133,762 GWh)
in GWh
EPM Technologies: Energy and Carbon savings, 23 Jan. 2013, Webinar, E. Baake
9
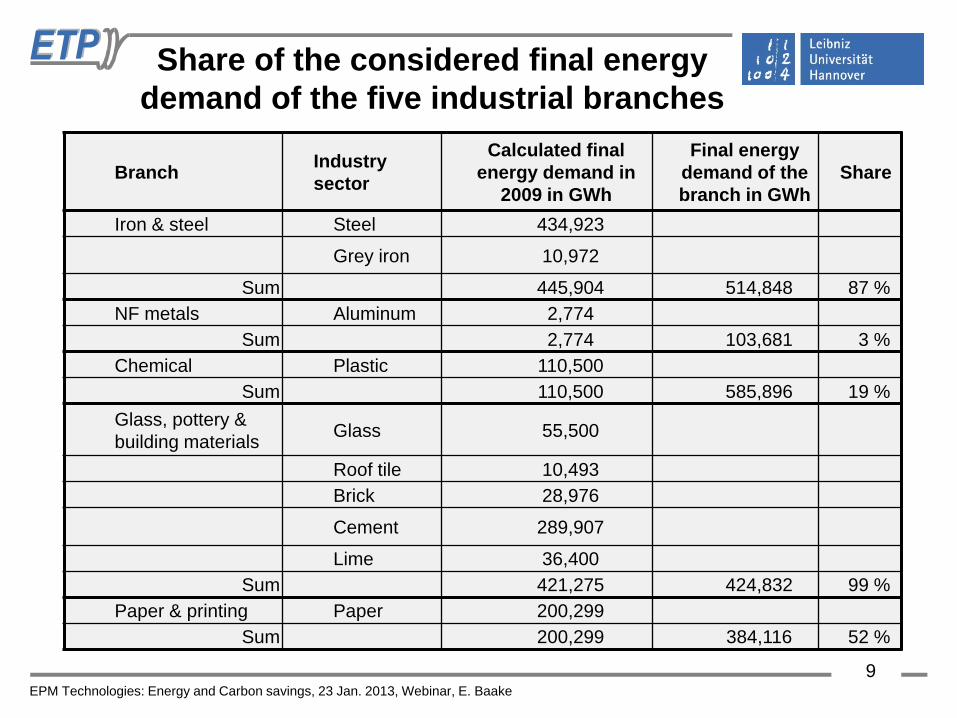
Branch Industry sector
Calculated final energy demand in
2009 in GWh
Final energy demand of the branch in GWh
Share
Iron & steel Steel 434,923
Grey iron 10,972
Sum 445,904 514,848 87 % NF metals Aluminum 2,774
Sum 2,774 103,681 3 % Chemical Plastic 110,500
Sum 110,500 585,896 19 % Glass, pottery & building materials Glass 55,500
Roof tile 10,493 Brick 28,976
Cement 289,907
Lime 36,400 Sum 421,275 424,832 99 %
Paper & printing Paper 200,299 Sum 200,299 384,116 52 %
Share of the considered final energy demand of the five industrial branches
EPM Technologies: Energy and Carbon savings, 23 Jan. 2013, Webinar, E. Baake
10
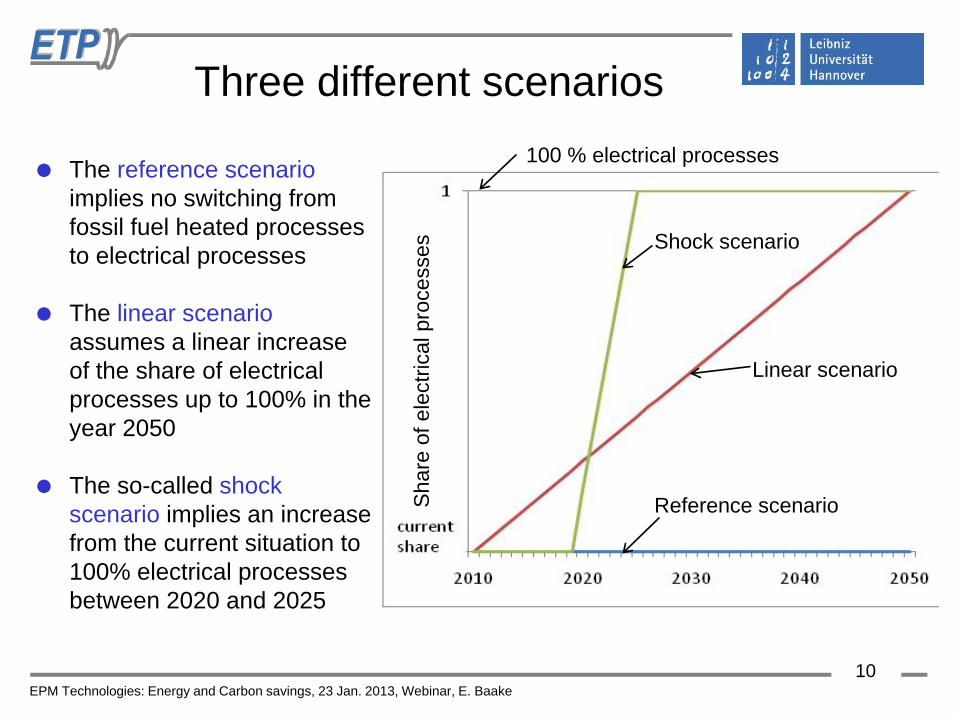
Three different scenarios
The reference scenario implies no switching from fossil fuel heated processes to electrical processes
The linear scenario
assumes a linear increase of the share of electrical processes up to 100% in the year 2050
The so-called shock scenario implies an increase from the current situation to 100% electrical processes between 2020 and 2025
100 % electrical processes
Sha
re o
f ele
ctric
al p
roce
sses
Linear scenario
Shock scenario
Reference scenario
EPM Technologies: Energy and Carbon savings, 23 Jan. 2013, Webinar, E. Baake
11
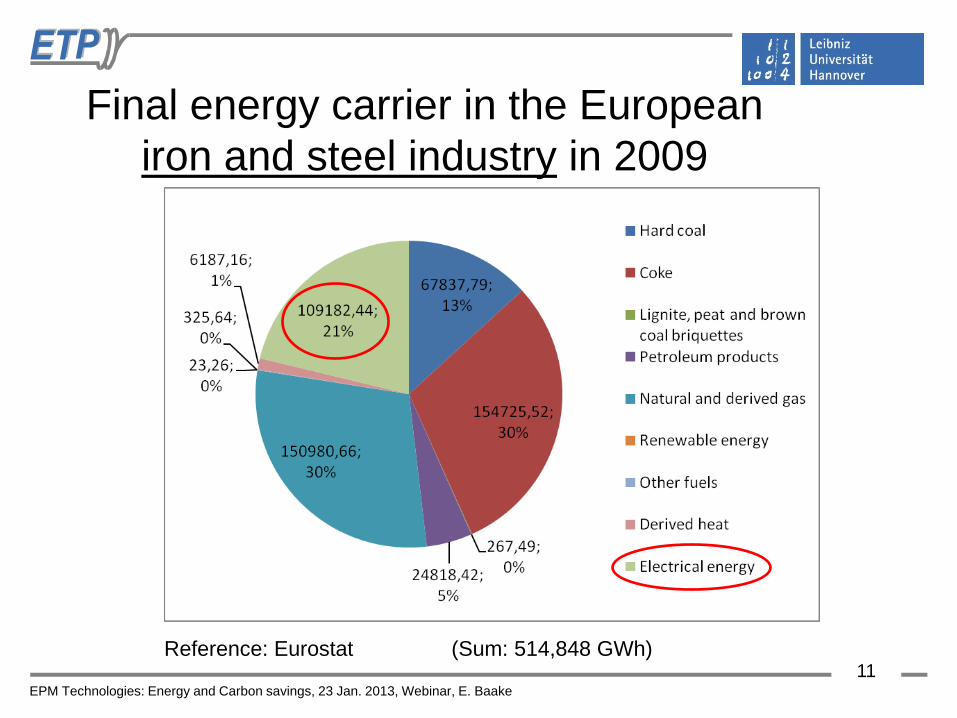
Final energy carrier in the European iron and steel industry in 2009
Reference: Eurostat (Sum: 514,848 GWh)
EPM Technologies: Energy and Carbon savings, 23 Jan. 2013, Webinar, E. Baake
12
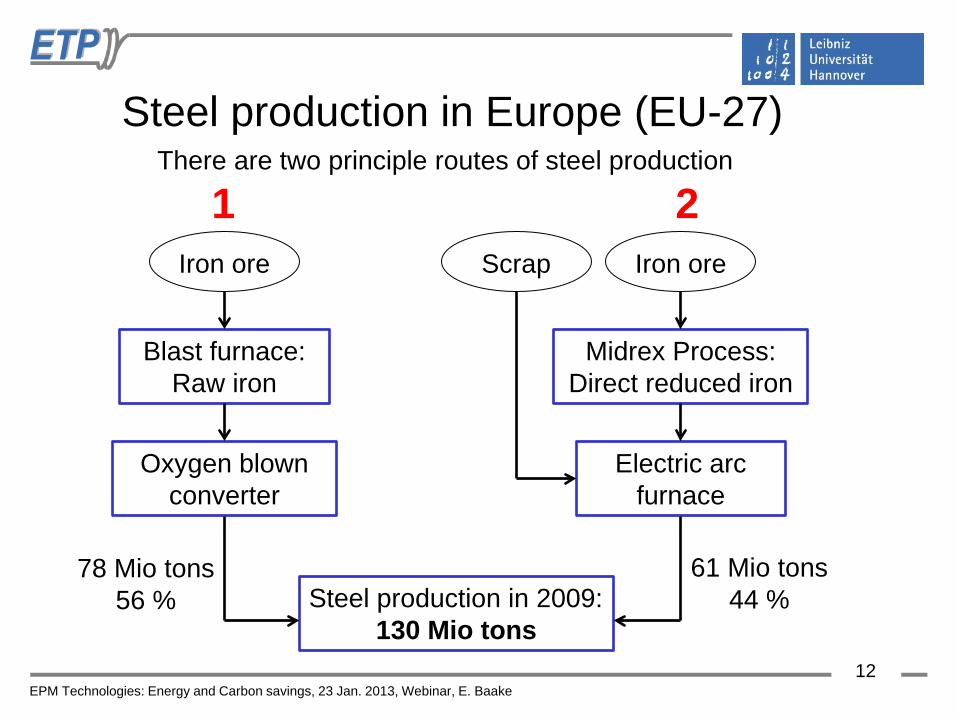
Steel production in Europe (EU-27)
Steel production in 2009: 130 Mio tons
Blast furnace: Raw iron
Midrex Process: Direct reduced iron
Oxygen blown converter
Electric arc furnace
There are two principle routes of steel production
Iron ore Iron ore Scrap
78 Mio tons 56 %
61 Mio tons 44 %
1 2
EPM Technologies: Energy and Carbon savings, 23 Jan. 2013, Webinar, E. Baake
13
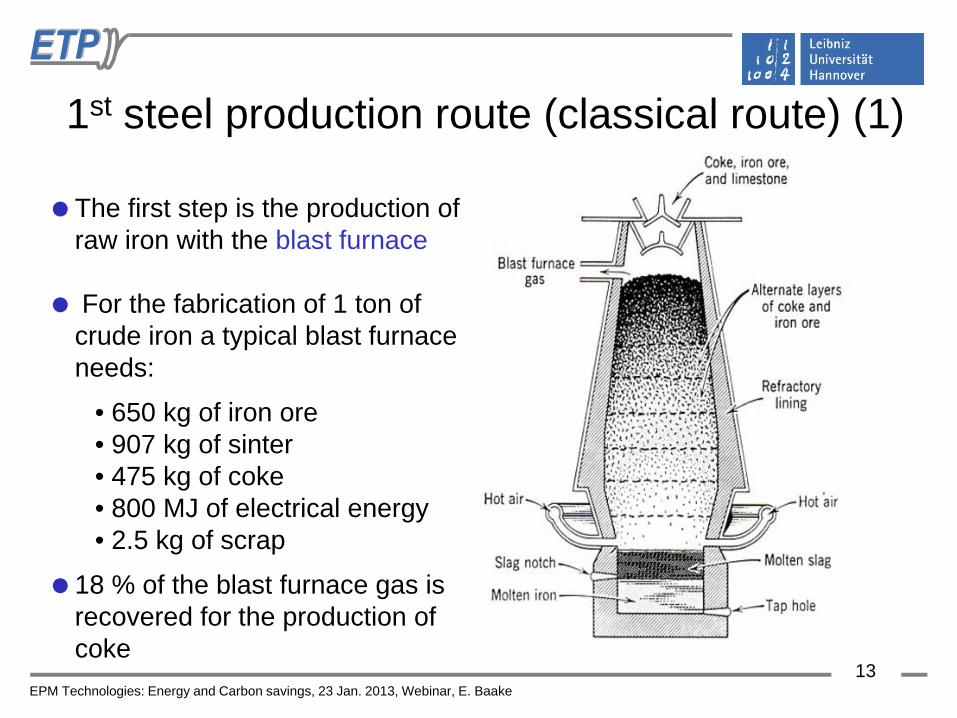
1st steel production route (classical route) (1) The first step is the production of
raw iron with the blast furnace For the fabrication of 1 ton of
crude iron a typical blast furnace needs:
• 650 kg of iron ore • 907 kg of sinter • 475 kg of coke • 800 MJ of electrical energy • 2.5 kg of scrap
18 % of the blast furnace gas is recovered for the production of coke
EPM Technologies: Energy and Carbon savings, 23 Jan. 2013, Webinar, E. Baake
14
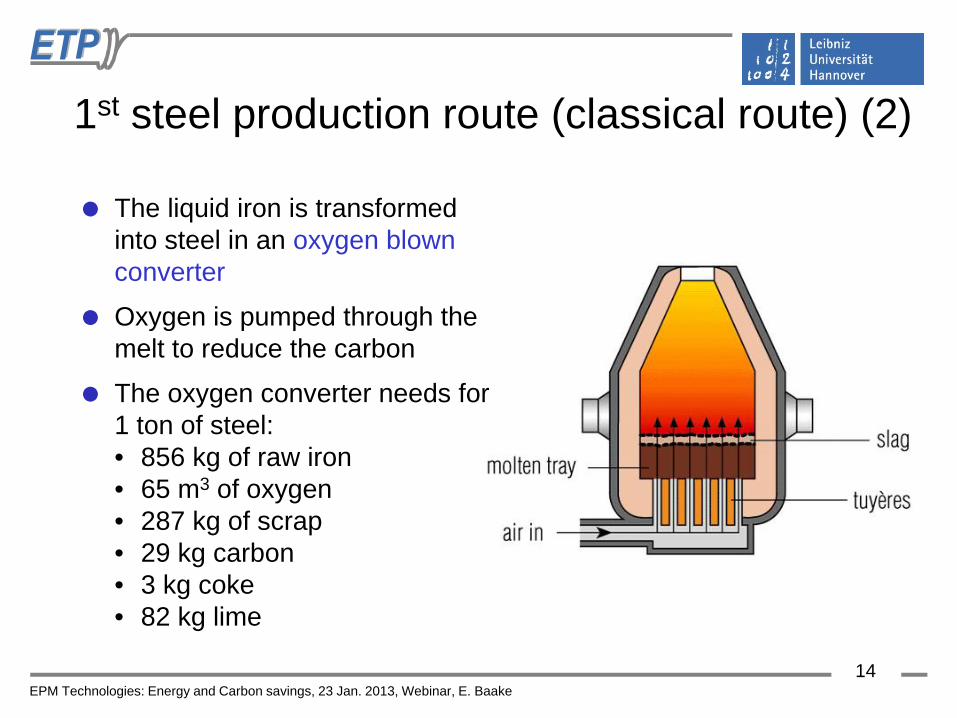
1st steel production route (classical route) (2) The liquid iron is transformed
into steel in an oxygen blown converter
Oxygen is pumped through the melt to reduce the carbon
The oxygen converter needs for 1 ton of steel: • 856 kg of raw iron • 65 m3 of oxygen • 287 kg of scrap • 29 kg carbon • 3 kg coke • 82 kg lime
EPM Technologies: Energy and Carbon savings, 23 Jan. 2013, Webinar, E. Baake
15
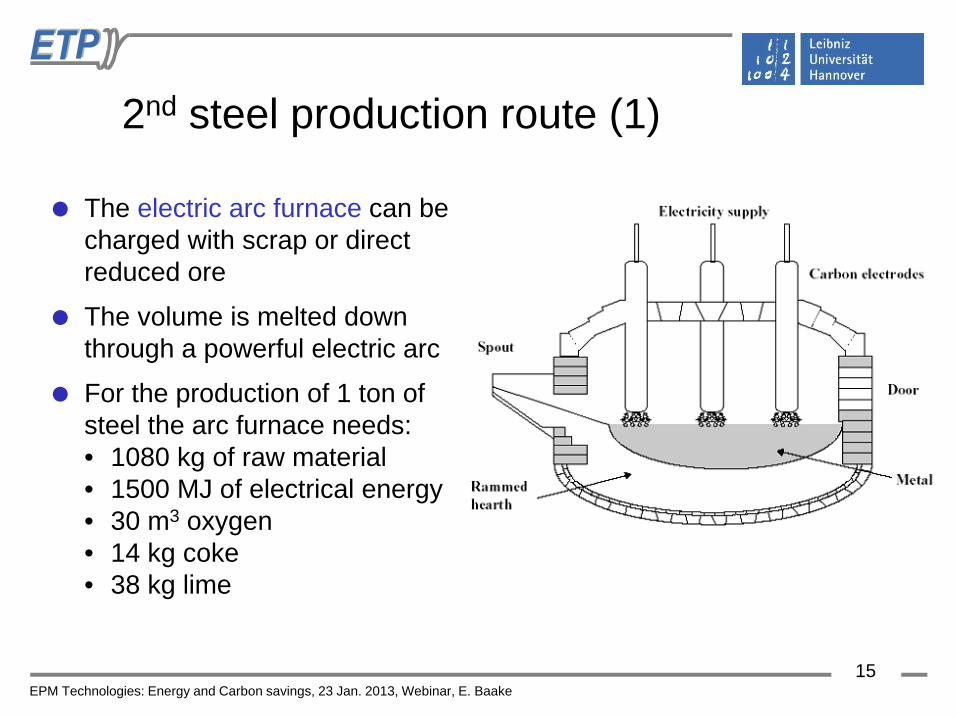
2nd steel production route (1) The electric arc furnace can be
charged with scrap or direct reduced ore
The volume is melted down through a powerful electric arc
For the production of 1 ton of steel the arc furnace needs: • 1080 kg of raw material • 1500 MJ of electrical energy • 30 m3 oxygen • 14 kg coke • 38 kg lime
EPM Technologies: Energy and Carbon savings, 23 Jan. 2013, Webinar, E. Baake
16
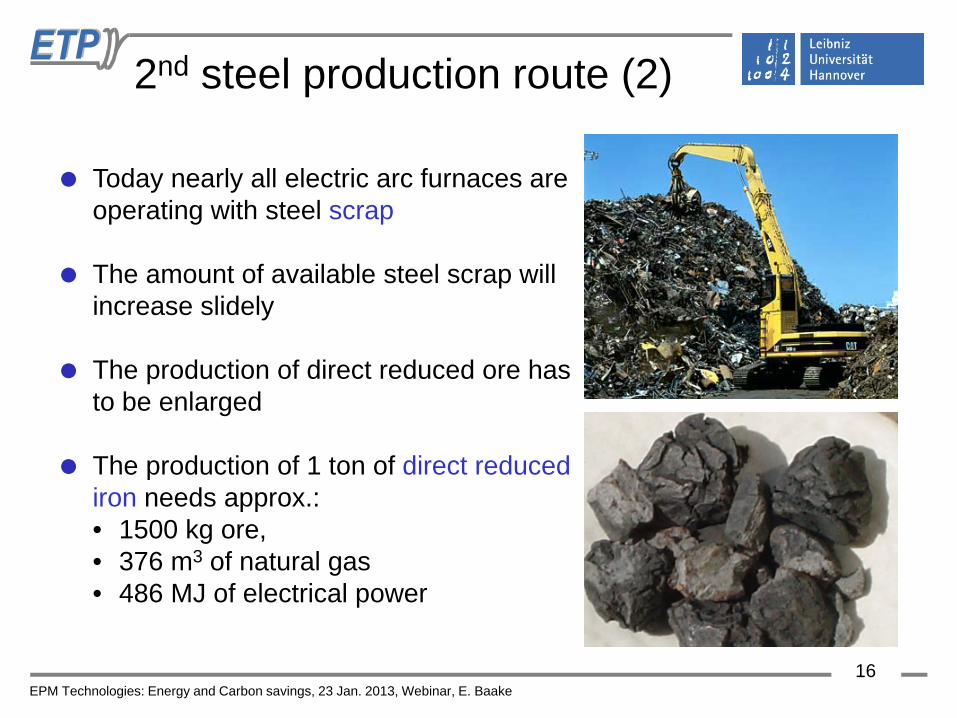
Today nearly all electric arc furnaces are operating with steel scrap
The amount of available steel scrap will
increase slidely The production of direct reduced ore has
to be enlarged The production of 1 ton of direct reduced
iron needs approx.: • 1500 kg ore, • 376 m3 of natural gas • 486 MJ of electrical power
2nd steel production route (2)
EPM Technologies: Energy and Carbon savings, 23 Jan. 2013, Webinar, E. Baake
17
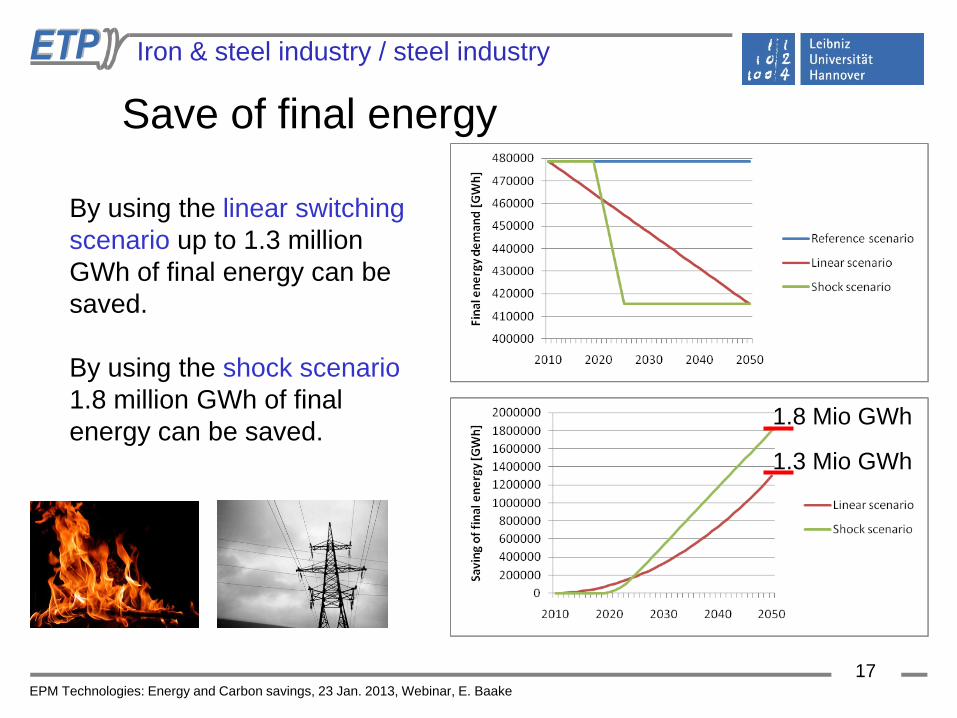
Save of final energy
1.8 Mio GWh
1.3 Mio GWh
By using the linear switching scenario up to 1.3 million GWh of final energy can be saved. By using the shock scenario 1.8 million GWh of final energy can be saved.
Iron & steel industry / steel industry
EPM Technologies: Energy and Carbon savings, 23 Jan. 2013, Webinar, E. Baake
18
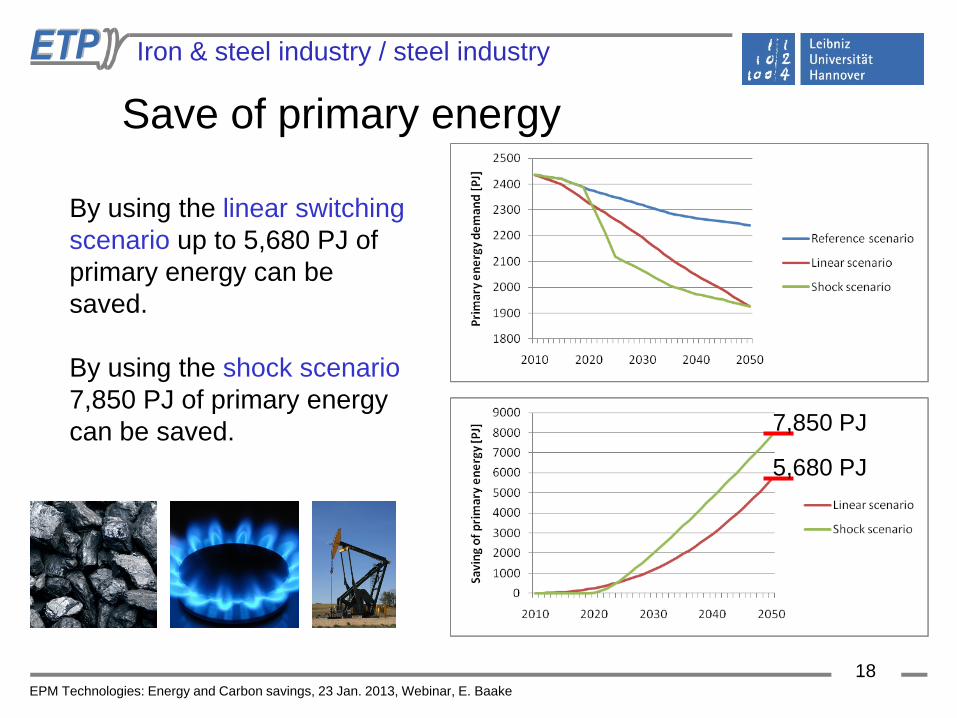
Save of primary energy
7,850 PJ
5,680 PJ
By using the linear switching scenario up to 5,680 PJ of primary energy can be saved. By using the shock scenario 7,850 PJ of primary energy can be saved.
Iron & steel industry / steel industry
EPM Technologies: Energy and Carbon savings, 23 Jan. 2013, Webinar, E. Baake
19
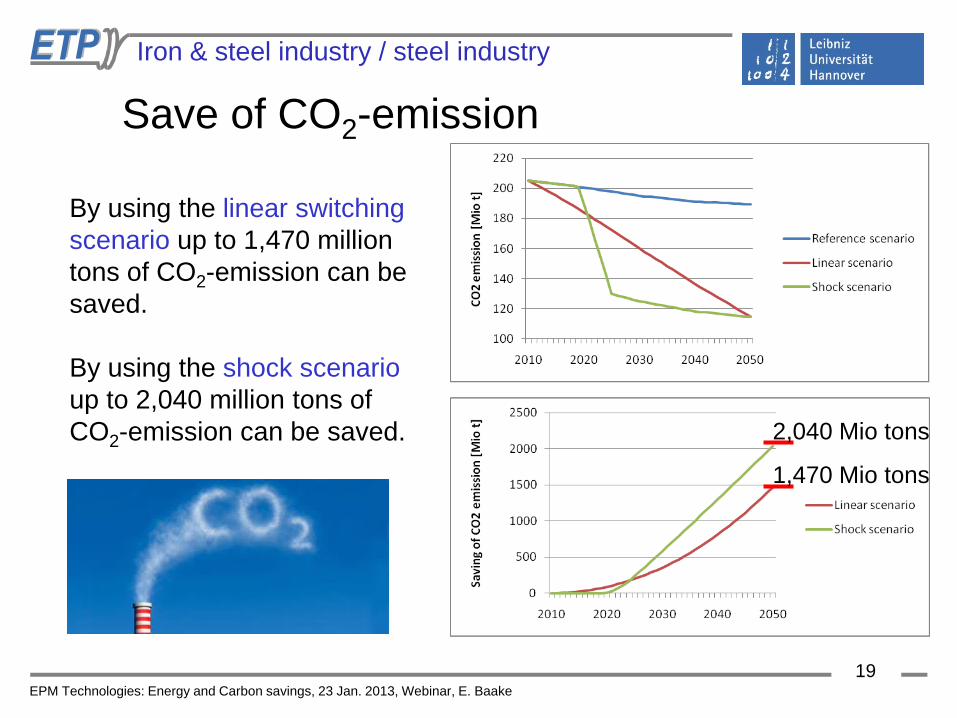
Save of CO2-emission By using the linear switching scenario up to 1,470 million tons of CO2-emission can be saved. By using the shock scenario up to 2,040 million tons of CO2-emission can be saved. 2,040 Mio tons
1,470 Mio tons
Iron & steel industry / steel industry
EPM Technologies: Energy and Carbon savings, 23 Jan. 2013, Webinar, E. Baake
20
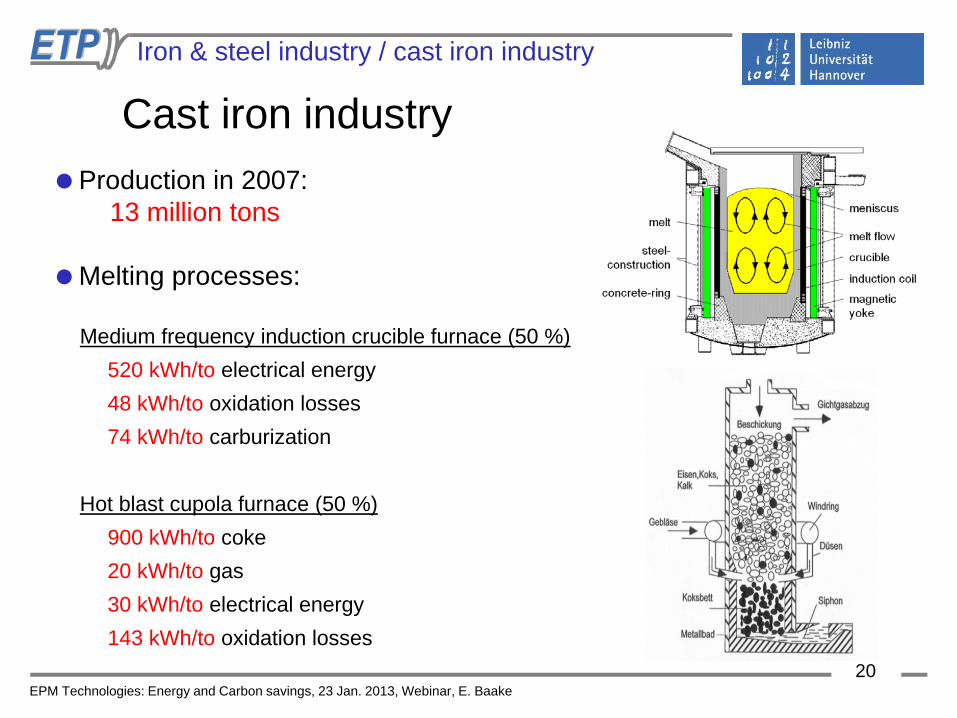
Cast iron industry Iron & steel industry / cast iron industry
Production in 2007: 13 million tons Melting processes:
Medium frequency induction crucible furnace (50 %) 520 kWh/to electrical energy 48 kWh/to oxidation losses 74 kWh/to carburization
Hot blast cupola furnace (50 %) 900 kWh/to coke 20 kWh/to gas 30 kWh/to electrical energy 143 kWh/to oxidation losses

EPM Technologies: Energy and Carbon savings, 23 Jan. 2013, Webinar, E. Baake
21
Save of final energy
By using the linear switching scenario up to 53,833 GWh of final energy can be saved. By using the shock scenario 74,841 GWh of final energy can be saved.
Iron & steel industry / cast iron industry
74,841 GWh
53,833 GWh
EPM Technologies: Energy and Carbon savings, 23 Jan. 2013, Webinar, E. Baake
22
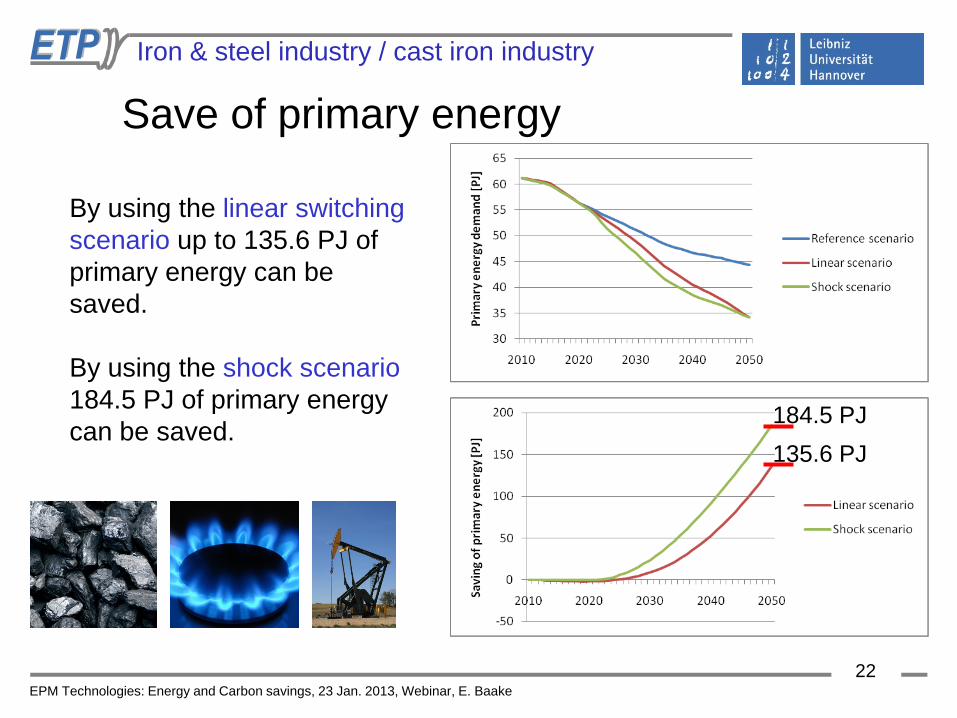
Save of primary energy
By using the linear switching scenario up to 135.6 PJ of primary energy can be saved. By using the shock scenario 184.5 PJ of primary energy can be saved.
Iron & steel industry / cast iron industry
184.5 PJ 135.6 PJ

EPM Technologies: Energy and Carbon savings, 23 Jan. 2013, Webinar, E. Baake
23
Save of CO2-emission By using the linear switching scenario up to 48.1 million tons of CO2-emission can be saved. By using the shock scenario up to 66.6 million tons of CO2-emission can be saved.
Iron & steel industry / cast iron industry
66.6 Mio tons
48.1 Mio tons
EPM Technologies: Energy and Carbon savings, 23 Jan. 2013, Webinar, E. Baake
24
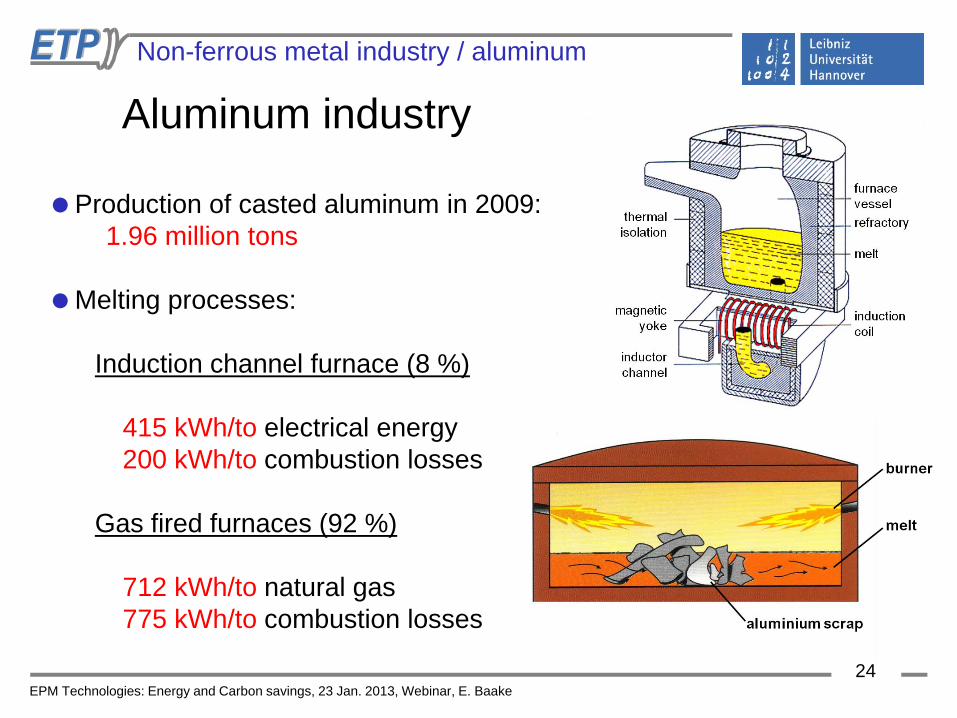
Production of casted aluminum in 2009: 1.96 million tons
Melting processes:
Induction channel furnace (8 %)
415 kWh/to electrical energy 200 kWh/to combustion losses
Gas fired furnaces (92 %)
712 kWh/to natural gas 775 kWh/to combustion losses
Aluminum industry Non-ferrous metal industry / aluminum
EPM Technologies: Energy and Carbon savings, 23 Jan. 2013, Webinar, E. Baake
25
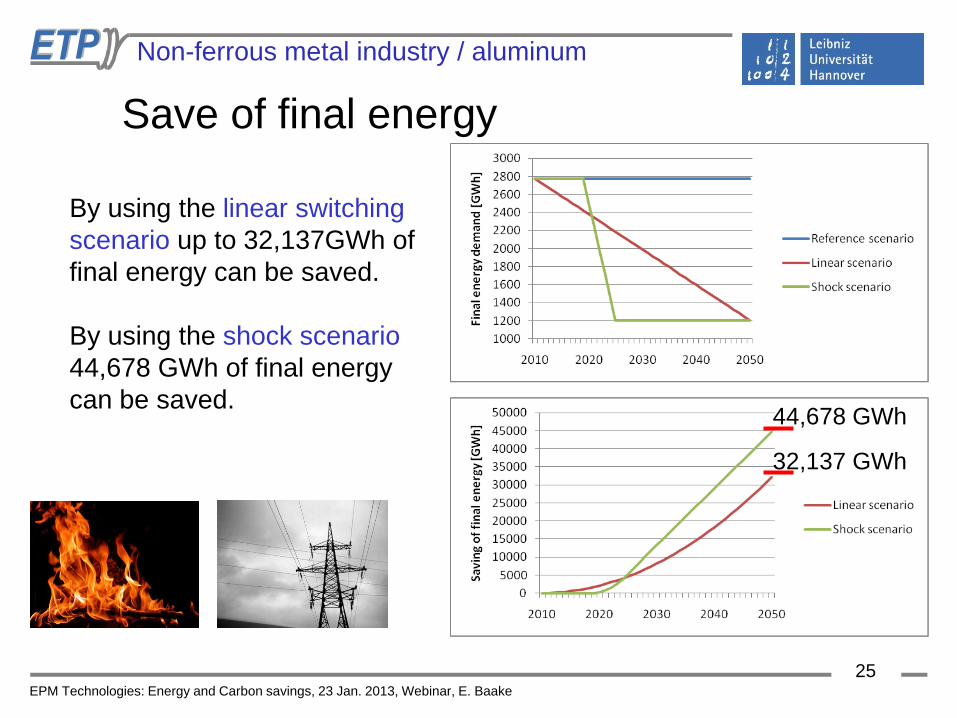
Save of final energy
By using the linear switching scenario up to 32,137GWh of final energy can be saved. By using the shock scenario 44,678 GWh of final energy can be saved.
Non-ferrous metal industry / aluminum
44,678 GWh
32,137 GWh

EPM Technologies: Energy and Carbon savings, 23 Jan. 2013, Webinar, E. Baake
26
Save of primary energy
By using the linear switching scenario up to 105 PJ of primary energy can be saved. By using the shock scenario 155 PJ of primary energy can be saved.
Non-ferrous metal industry / aluminum
145 PJ
105 PJ
EPM Technologies: Energy and Carbon savings, 23 Jan. 2013, Webinar, E. Baake
27
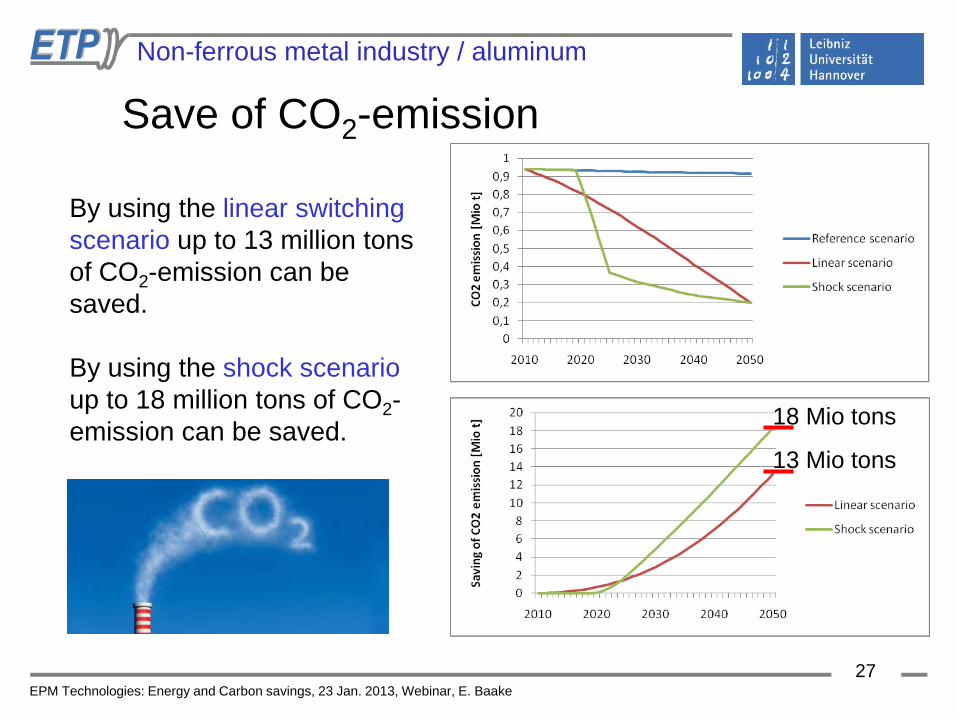
Save of CO2-emission By using the linear switching scenario up to 13 million tons of CO2-emission can be saved. By using the shock scenario up to 18 million tons of CO2-emission can be saved.
Non-ferrous metal industry / aluminum
18 Mio tons
13 Mio tons
EPM Technologies: Energy and Carbon savings, 23 Jan. 2013, Webinar, E. Baake
28
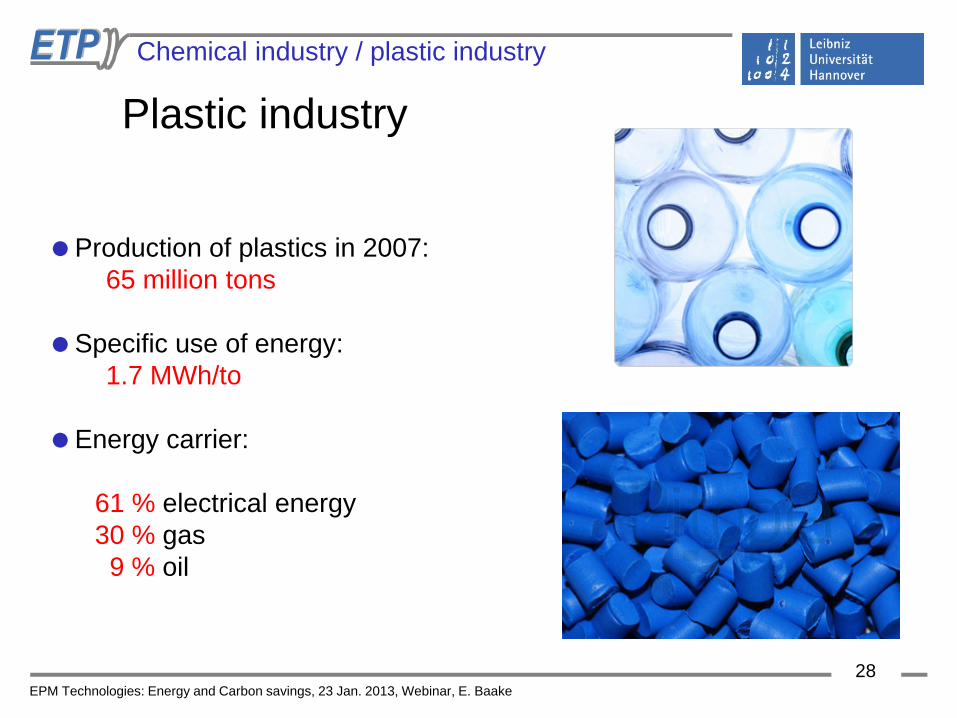
Production of plastics in 2007: 65 million tons
Specific use of energy: 1.7 MWh/to
Energy carrier:
61 % electrical energy 30 % gas 9 % oil
Plastic industry Chemical industry / plastic industry
EPM Technologies: Energy and Carbon savings, 23 Jan. 2013, Webinar, E. Baake
29
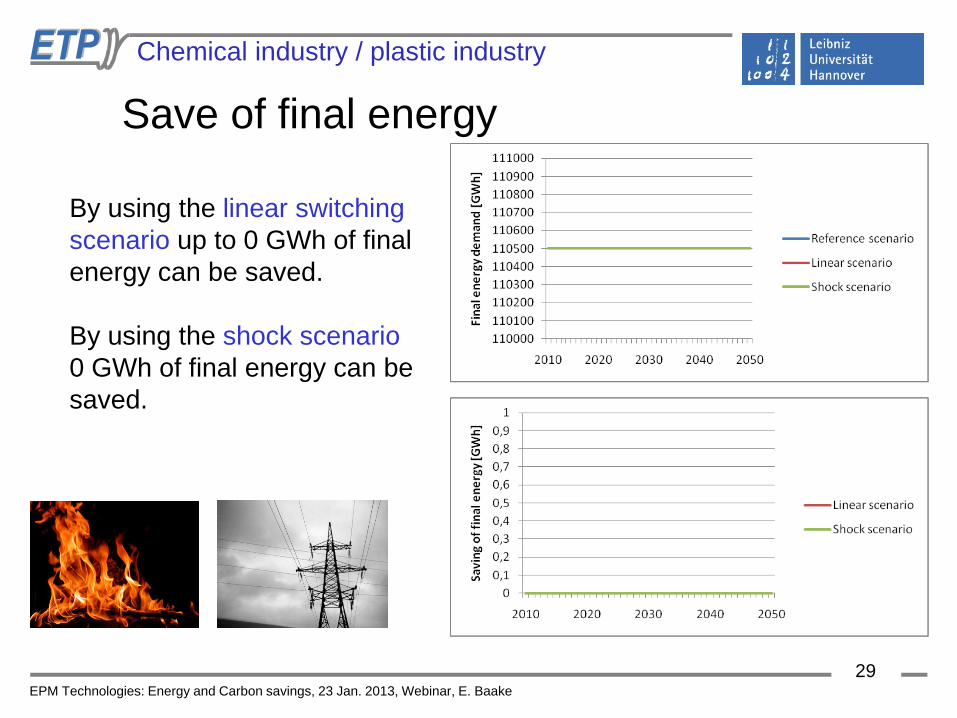
Save of final energy
By using the linear switching scenario up to 0 GWh of final energy can be saved. By using the shock scenario 0 GWh of final energy can be saved.
Chemical industry / plastic industry
EPM Technologies: Energy and Carbon savings, 23 Jan. 2013, Webinar, E. Baake
30
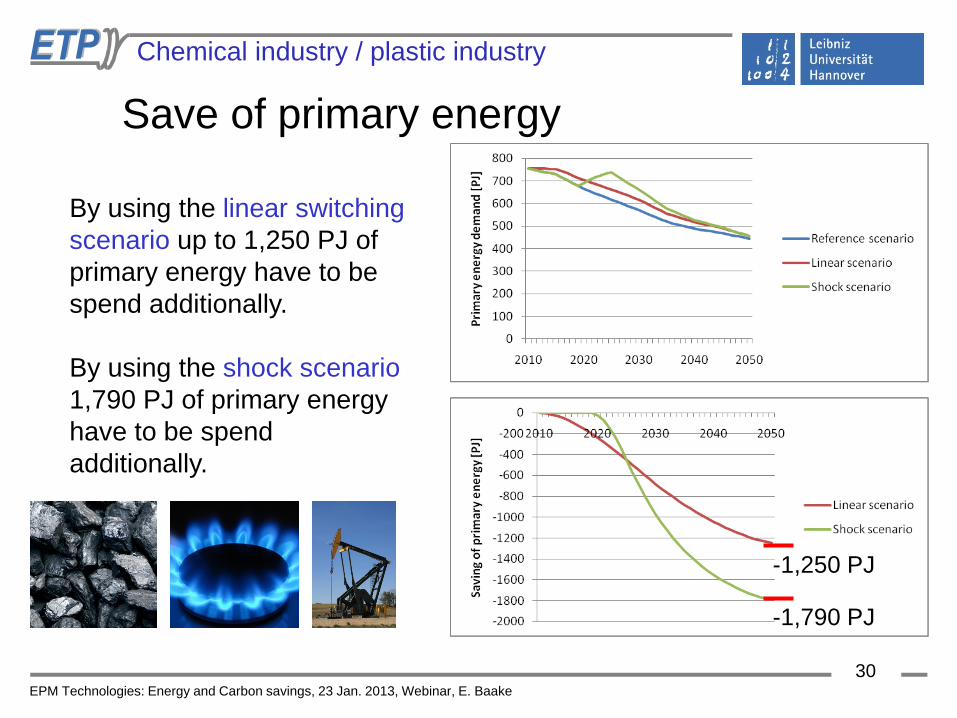
Save of primary energy
-1,250 PJ
-1,790 PJ
By using the linear switching scenario up to 1,250 PJ of primary energy have to be spend additionally. By using the shock scenario 1,790 PJ of primary energy have to be spend additionally.
Chemical industry / plastic industry
EPM Technologies: Energy and Carbon savings, 23 Jan. 2013, Webinar, E. Baake
31
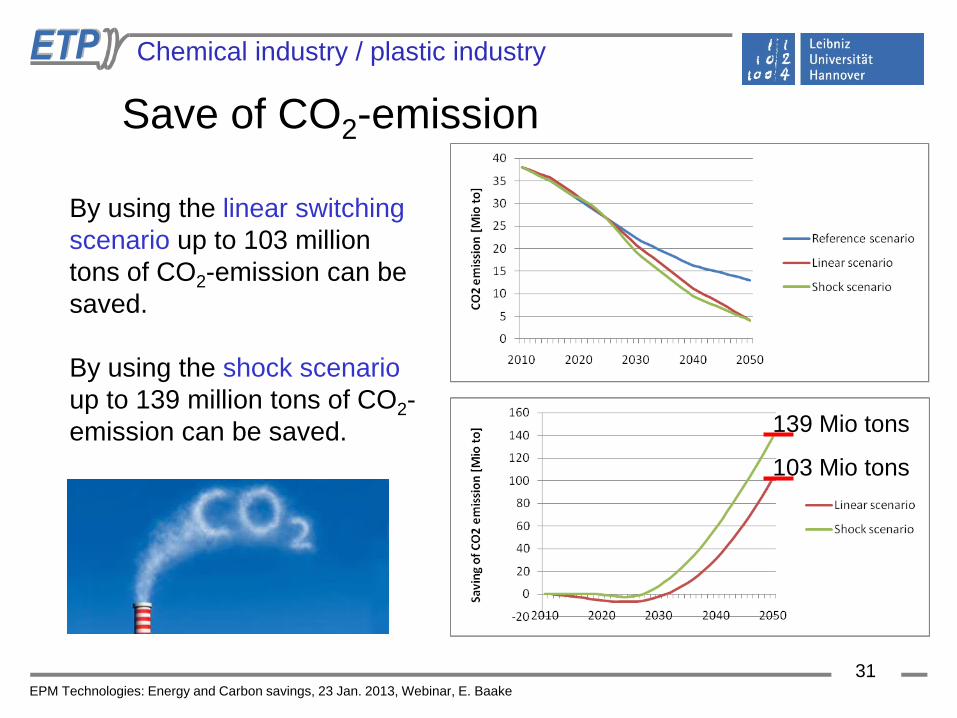
Save of CO2-emission By using the linear switching scenario up to 103 million tons of CO2-emission can be saved. By using the shock scenario up to 139 million tons of CO2-emission can be saved. 139 Mio tons
103 Mio tons
Chemical industry / plastic industry
EPM Technologies: Energy and Carbon savings, 23 Jan. 2013, Webinar, E. Baake
32
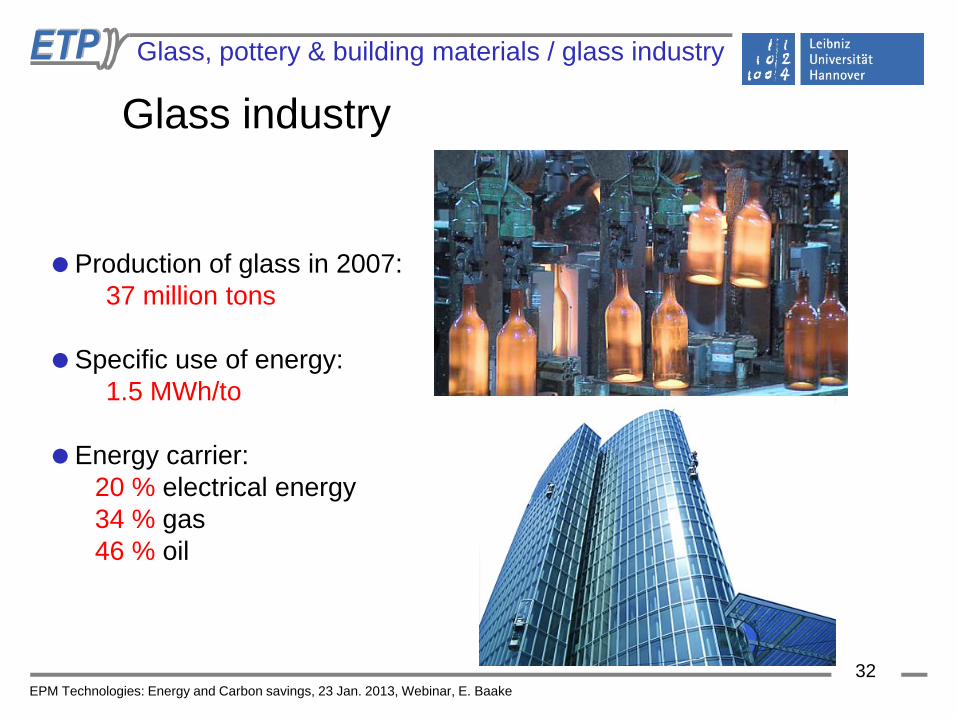
Production of glass in 2007: 37 million tons
Specific use of energy: 1.5 MWh/to
Energy carrier:
20 % electrical energy 34 % gas 46 % oil
Glass industry Glass, pottery & building materials / glass industry
EPM Technologies: Energy and Carbon savings, 23 Jan. 2013, Webinar, E. Baake
33
Save of final energy
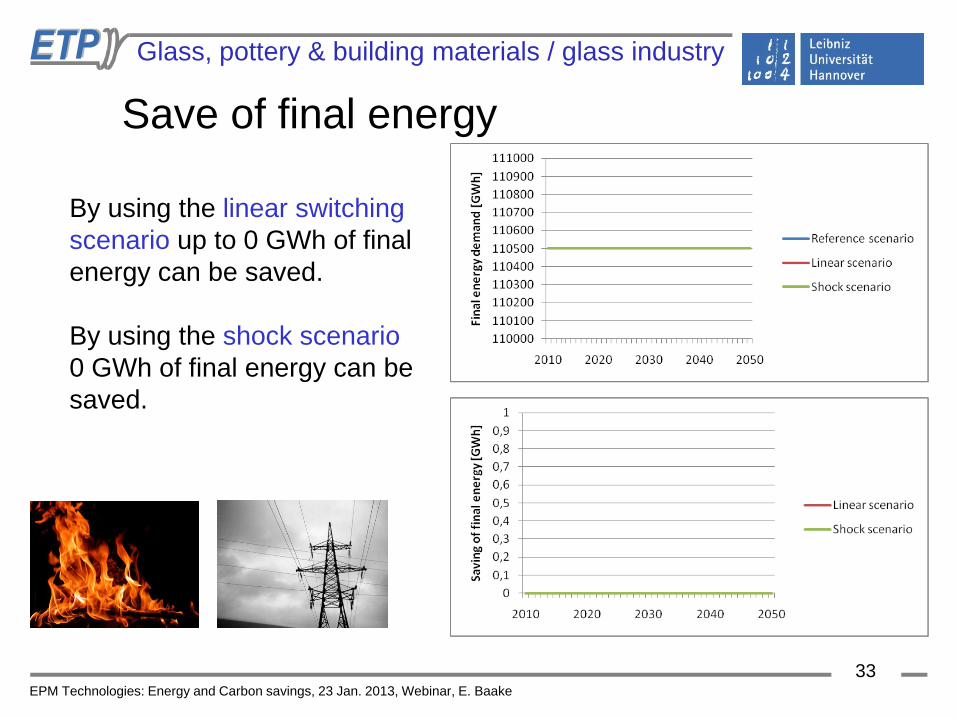
By using the linear switching scenario up to 0 GWh of final energy can be saved. By using the shock scenario 0 GWh of final energy can be saved.
Glass, pottery & building materials / glass industry
EPM Technologies: Energy and Carbon savings, 23 Jan. 2013, Webinar, E. Baake
34
Save of primary energy
Glass, pottery & building materials / glass industry
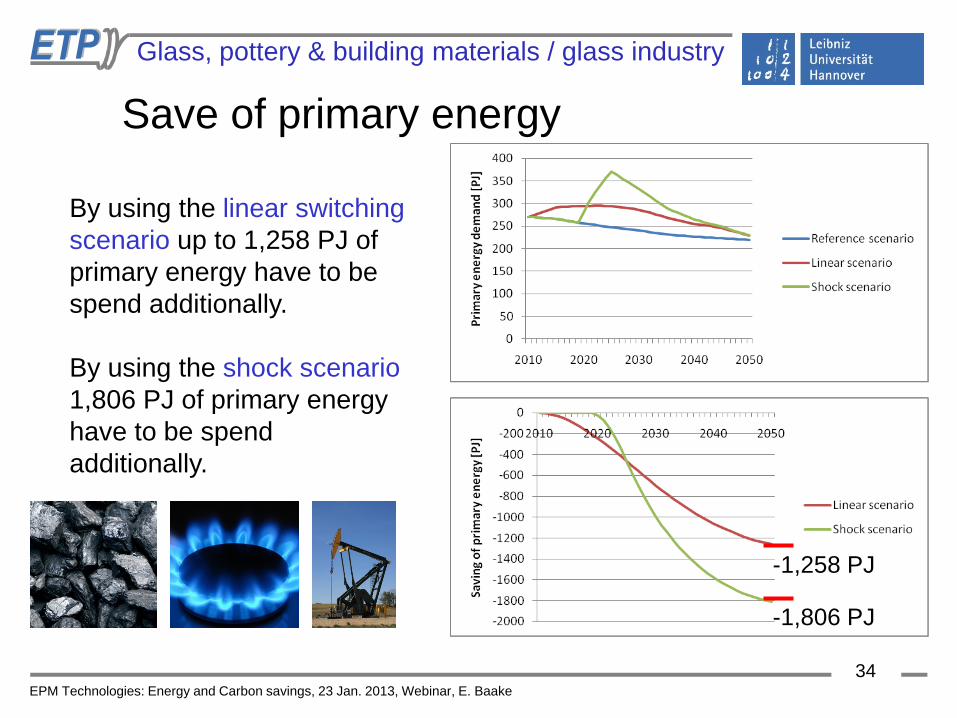
-1,258 PJ
-1,806 PJ
By using the linear switching scenario up to 1,258 PJ of primary energy have to be spend additionally. By using the shock scenario 1,806 PJ of primary energy have to be spend additionally.

EPM Technologies: Energy and Carbon savings, 23 Jan. 2013, Webinar, E. Baake
35
Save of CO2-emission By using the linear switching scenario up to 129 million tons of CO2-emission can be saved. By using the shock scenario up to 175 million tons of CO2-emission can be saved.
Glass, pottery & building materials / glass industry
175 Mio tons 129 Mio tons
EPM Technologies: Energy and Carbon savings, 23 Jan. 2013, Webinar, E. Baake
36
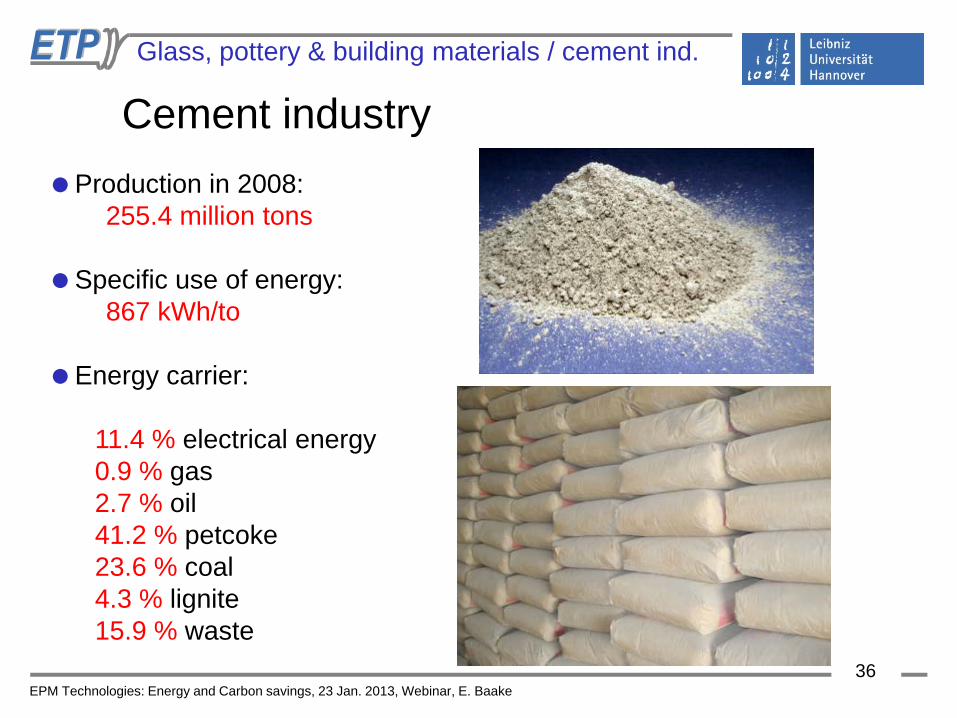
Production in 2008: 255.4 million tons
Specific use of energy: 867 kWh/to
Energy carrier:
11.4 % electrical energy 0.9 % gas 2.7 % oil 41.2 % petcoke 23.6 % coal 4.3 % lignite 15.9 % waste
Cement industry Glass, pottery & building materials / cement ind.

EPM Technologies: Energy and Carbon savings, 23 Jan. 2013, Webinar, E. Baake
37
Save of final energy
By using the linear switching scenario up to 0 GWh of final energy can be saved. By using the shock scenario 0 GWh of final energy can be saved.
Glass, pottery & building materials / cement ind.
EPM Technologies: Energy and Carbon savings, 23 Jan. 2013, Webinar, E. Baake
38
Save of primary energy
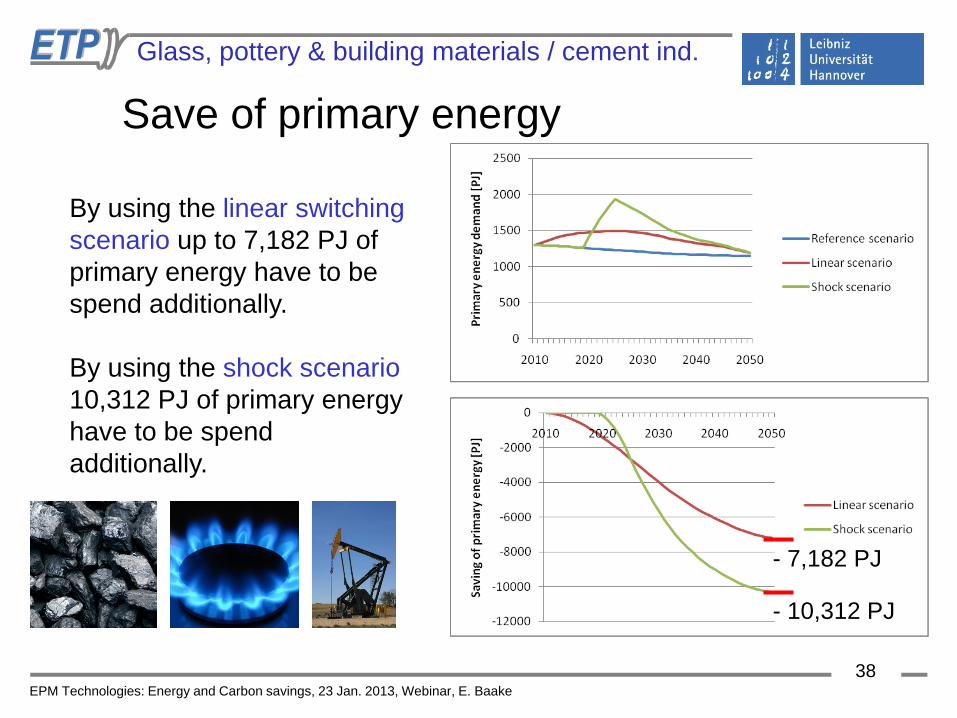
By using the linear switching scenario up to 7,182 PJ of primary energy have to be spend additionally. By using the shock scenario 10,312 PJ of primary energy have to be spend additionally.
Glass, pottery & building materials / cement ind.
- 7,182 PJ
- 10,312 PJ

EPM Technologies: Energy and Carbon savings, 23 Jan. 2013, Webinar, E. Baake
39
Save of CO2-emission By using the linear switching scenario up to 1,604 million tons of CO2-emission can be saved. By using the shock scenario up to 2,205 million tons of CO2-emission can be saved.
Glass, pottery & building materials / cement ind.
1,604 Mio tons 2,205 Mio tons
EPM Technologies: Energy and Carbon savings, 23 Jan. 2013, Webinar, E. Baake
40
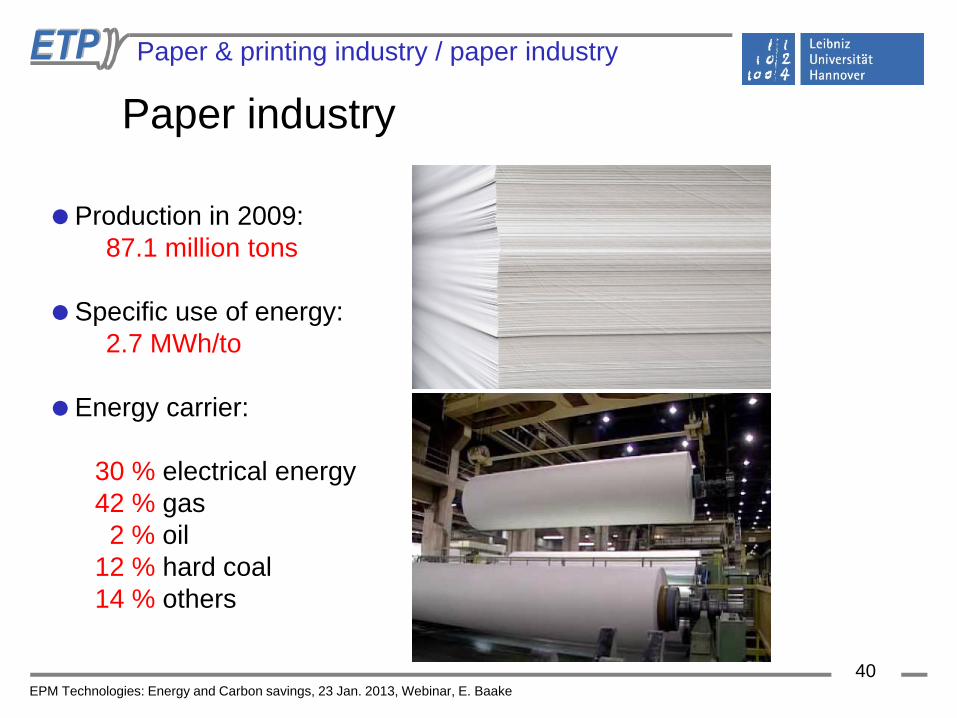
Production in 2009: 87.1 million tons
Specific use of energy: 2.7 MWh/to
Energy carrier:
30 % electrical energy 42 % gas 2 % oil 12 % hard coal 14 % others
Paper industry Paper & printing industry / paper industry

EPM Technologies: Energy and Carbon savings, 23 Jan. 2013, Webinar, E. Baake
41
Save of final energy
By using the linear switching scenario up to 0 GWh of final energy can be saved. By using the shock scenario 0 GWh of final energy can be saved.
Paper & printing industry / paper industry

EPM Technologies: Energy and Carbon savings, 23 Jan. 2013, Webinar, E. Baake
42
Save of primary energy
By using the linear switching scenario up to 3,815 PJ of primary energy have to be spend additionally. By using the shock scenario 5,470 PJ of primary energy have to be spend additionally.
Paper & printing industry / paper industry
- 3,815 PJ
- 5,470 PJ
EPM Technologies: Energy and Carbon savings, 23 Jan. 2013, Webinar, E. Baake
43
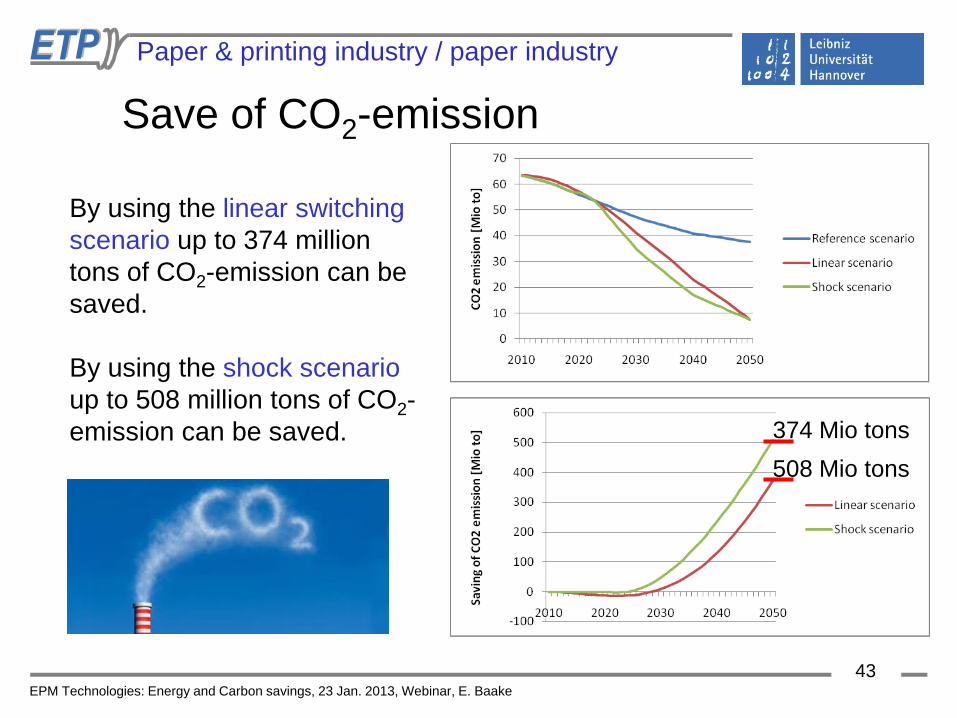
Save of CO2-emission By using the linear switching scenario up to 374 million tons of CO2-emission can be saved. By using the shock scenario up to 508 million tons of CO2-emission can be saved.
Paper & printing industry / paper industry
374 Mio tons 508 Mio tons
EPM Technologies: Energy and Carbon savings, 23 Jan. 2013, Webinar, E. Baake
44
A switching from fuel operated processes to a production applying mainly electrical operated processes offers big potentials for saving CO2-emission. But for saving of energy it is necessary to improve or change the process not only the energy carrier. By using the linear switching scenario in all the presented case studies
• 1.38 million GWh of final energy, • - 9690 PJ of primary energy and • 3.97 billion tons of CO2-emission can be saved in sum. By using the shock scenario it is possible to save
• 1.92 million GWh of final energy, • -14210 PJ of primary energy and • 5.46 billion tons of CO2-emission.
Summary I
EPM Technologies: Energy and Carbon savings, 23 Jan. 2013, Webinar, E. Baake
45
The primary energy factor and CO2-emission factor for
electricity are analyzed and estimated year by year till 2050. From now to the year 2050 transition scenarios are developed, where three transition scenarios are compared in detail.
Part of the most energy intensive production processes are
switched from the actual situation to a situation with 100% electrically operated industrial processes.
A switching from fuel operated industrial thermal processes to a production applying mainly EPM technologies offers big potentials for saving of energy and CO2-emission.
For saving of energy it is necessary to increase the efficiency of the production process not only to change the energy carrier.
Summary II
EPM Technologies: Energy and Carbon savings, 23 Jan. 2013, Webinar, E. Baake
46
Thank you for your attention!