Embed Size (px)
Citation preview
BlueBRIDGE receives funding from the European Union’s Horizon 2020 research and innovation programme under grant agreement No. 675680 www.bluebridge-vres.eu
Using e-Infrastructures for Biodiversity Conservation Gianpaolo Coro National Research Council (CNR), Pisa, Italy
This work is licensed under the Creative Commons CC-BY 4.0 licence
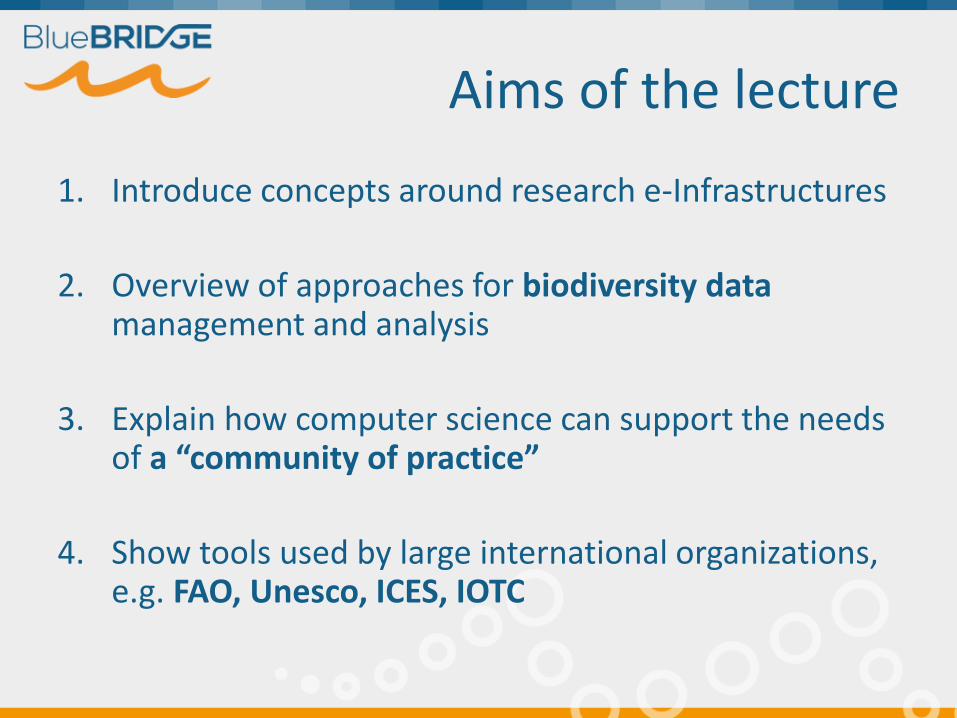
Aims of the lecture
1. Introduce concepts around research e-Infrastructures
2. Overview of approaches for biodiversity data management and analysis
3. Explain how computer science can support the needs of a “community of practice”
4. Show tools used by large international organizations, e.g. FAO, Unesco, ICES, IOTC
Outline
• E-Infrastructures
• i-Marine
• Biodiversity data
• Geospatial data
• Data processing
• Examples
Outline
• E-Infrastructures
• i-Marine
• Biodiversity data
• Geospatial data
• Data processing
• Examples
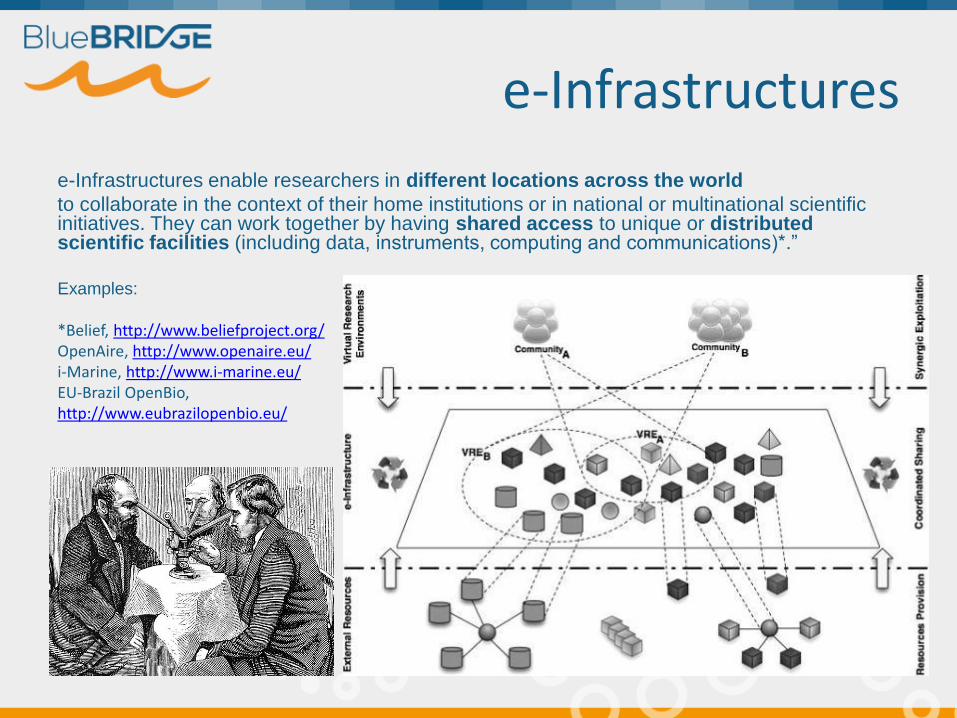
e-Infrastructures
e-Infrastructures enable researchers in different locations across the world
to collaborate in the context of their home institutions or in national or multinational scientific initiatives. They can work together by having shared access to unique or distributed scientific facilities (including data, instruments, computing and communications)*.”
Examples:
*Belief, http://www.beliefproject.org/ OpenAire, http://www.openaire.eu/ i-Marine, http://www.i-marine.eu/ EU-Brazil OpenBio, http://www.eubrazilopenbio.eu/
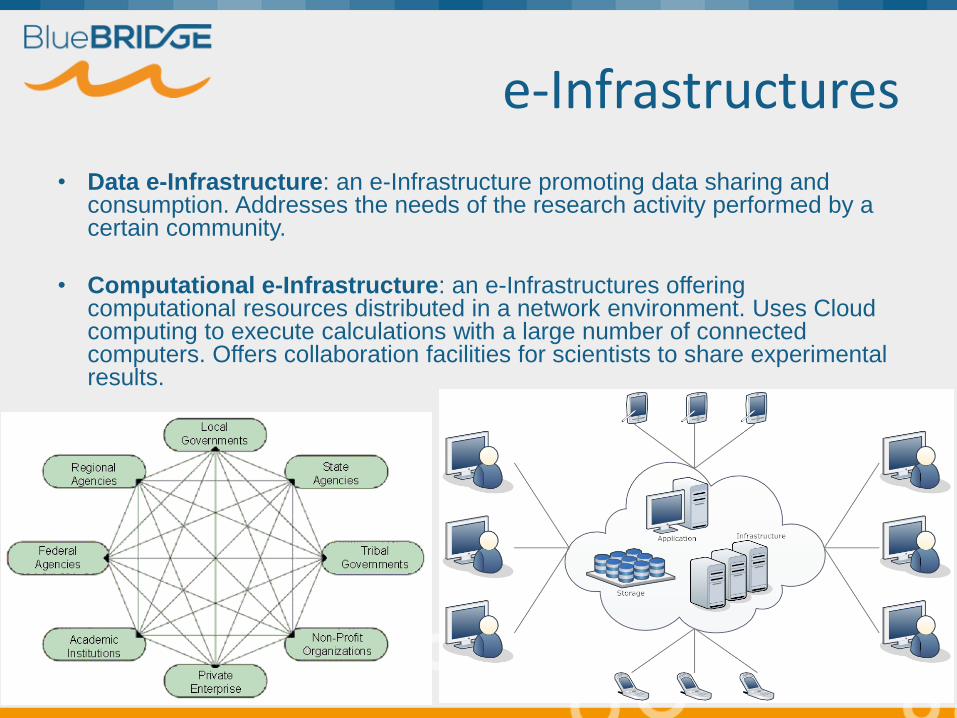
e-Infrastructures
• Data e-Infrastructure: an e-Infrastructure promoting data sharing and consumption. Addresses the needs of the research activity performed by a certain community.
• Computational e-Infrastructure: an e-Infrastructures offering computational resources distributed in a network environment. Uses Cloud computing to execute calculations with a large number of connected computers. Offers collaboration facilities for scientists to share experimental results.
Virtual Research Environments
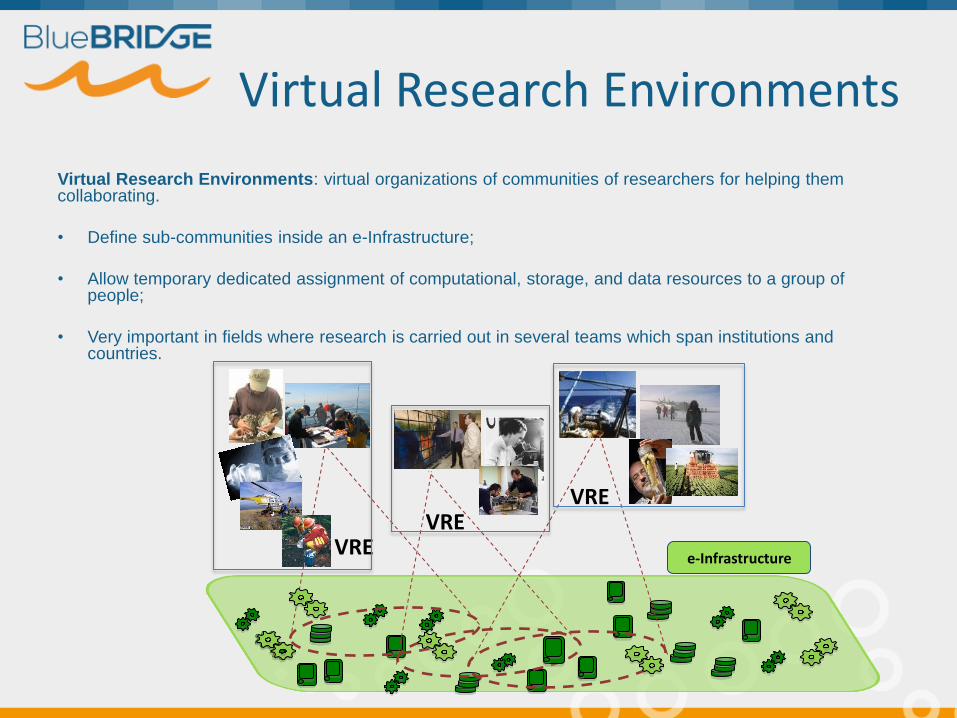
Virtual Research Environments: virtual organizations of communities of researchers for helping them collaborating.
• Define sub-communities inside an e-Infrastructure;
• Allow temporary dedicated assignment of computational, storage, and data resources to a group of people;
• Very important in fields where research is carried out in several teams which span institutions and countries.
e-Infrastructure VRE
VRE VRE
Outline
• E-Infrastructures
• i-Marine
• Biodiversity data
• Geospatial data
• Data processing
• Examples
Outline
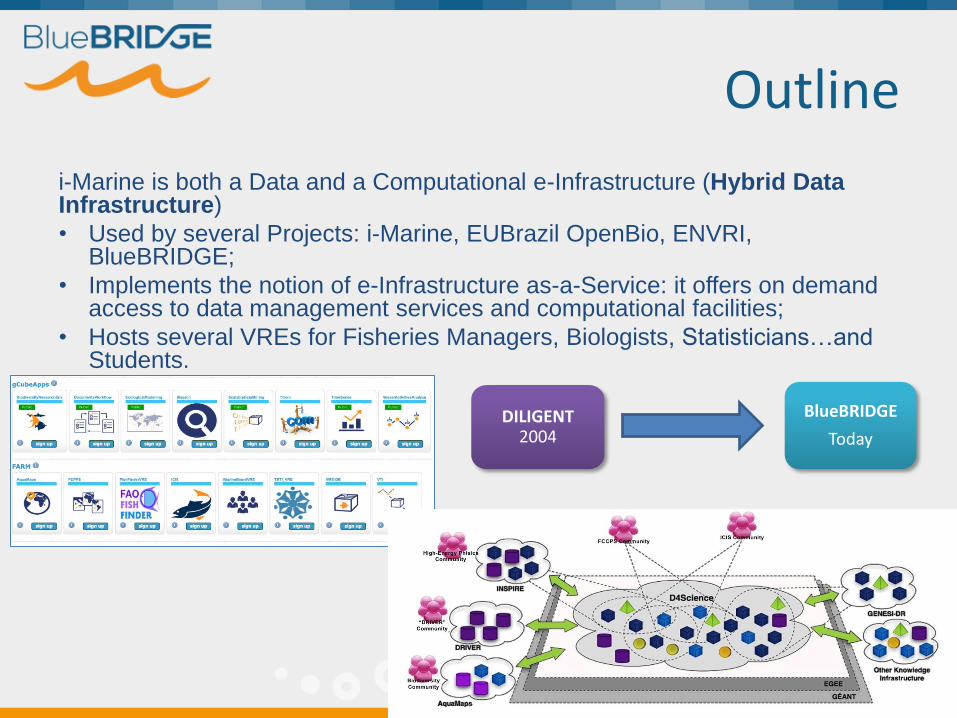
i-Marine is both a Data and a Computational e-Infrastructure (Hybrid Data Infrastructure)
• Used by several Projects: i-Marine, EUBrazil OpenBio, ENVRI, BlueBRIDGE;
• Implements the notion of e-Infrastructure as-a-Service: it offers on demand access to data management services and computational facilities;
• Hosts several VREs for Fisheries Managers, Biologists, Statisticians…and Students.
DILIGENT 2004
BlueBRIDGE
Today
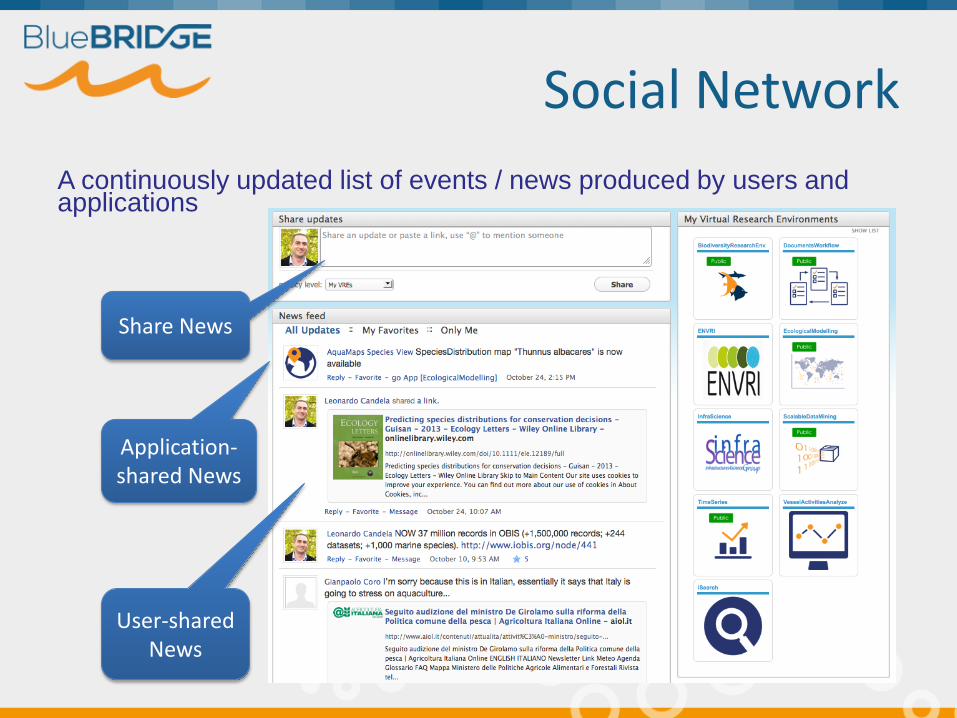
Social Network
A continuously updated list of events / news produced by users and applications
Share News
Application-shared News
User-shared News
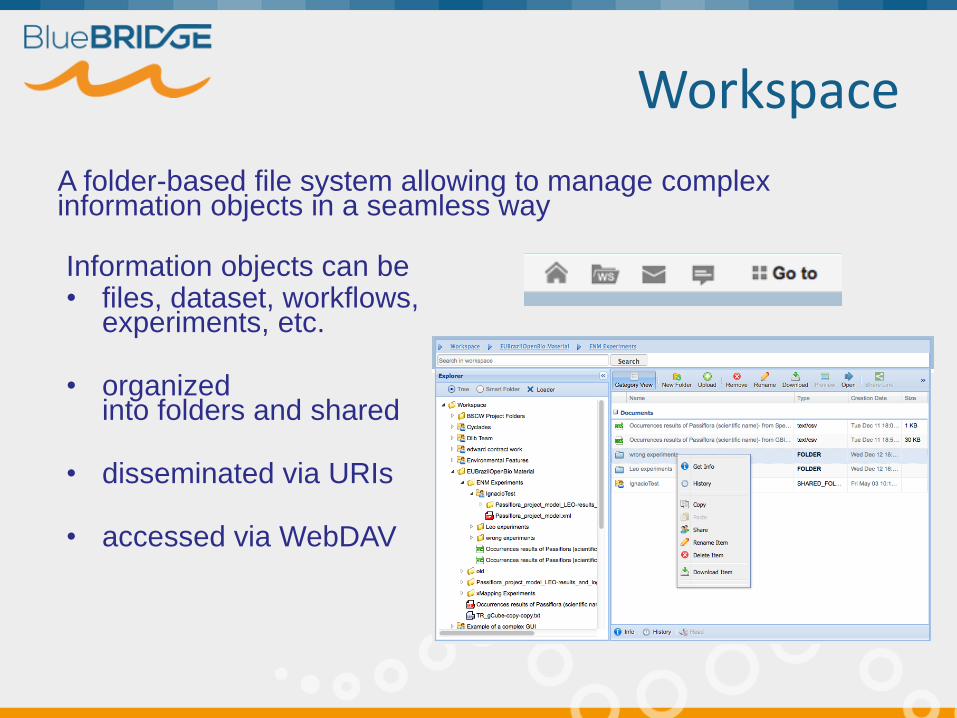
Workspace
A folder-based file system allowing to manage complex information objects in a seamless way
Information objects can be • files, dataset, workflows,
experiments, etc.
• organized into folders and shared
• disseminated via URIs
• accessed via WebDAV

Services Storage
Databases Cloud storage Geospatial data
Metadata generation and management
Harmonisation Sharing
Processing
Data management
Cloud computing Elastic resources assignment
Multi-platform: R, Java, Fortran
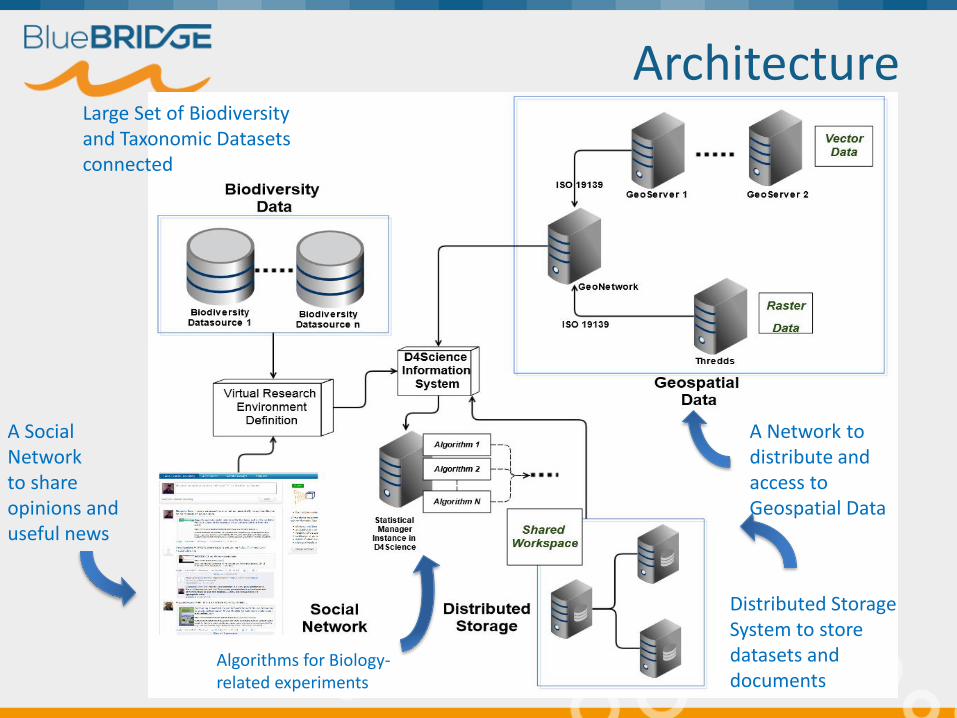
Architecture Large Set of Biodiversity and Taxonomic Datasets connected
A Social Network to share opinions and useful news
Algorithms for Biology-related experiments
Distributed Storage System to store datasets and documents
A Network to distribute and access to Geospatial Data

Online examples:
the i-Marine Web portal and basic functions
http://portal.i-marine.d4science.org
Outline
• E-Infrastructures
• i-Marine
• Biodiversity data
• Geospatial data
• Data processing
• Examples
Biodiversity Data
• Taxonomies
• In biology, a taxon (plural taxa) is a group of one or more populations of an organism or organisms seen by taxonomists to form a unit.
• Introduced by Linnaeus's system in Systema Naturae (10th edition, 1758).
• A taxon is usually known by a particular name and given a particular ranking, especially if (and when) it is accepted or becomes established
• An accepted taxon is given a formal scientific name, according to nomenclature codes, e.g. Gadus morhua (Linnaeus, 1758)*
• A "good" or "useful" taxon is one that reflects evolutionary relationships
* More on scientific names here: http://wiki.i-marine.eu/index.php/Taxa_Merging_Discussion
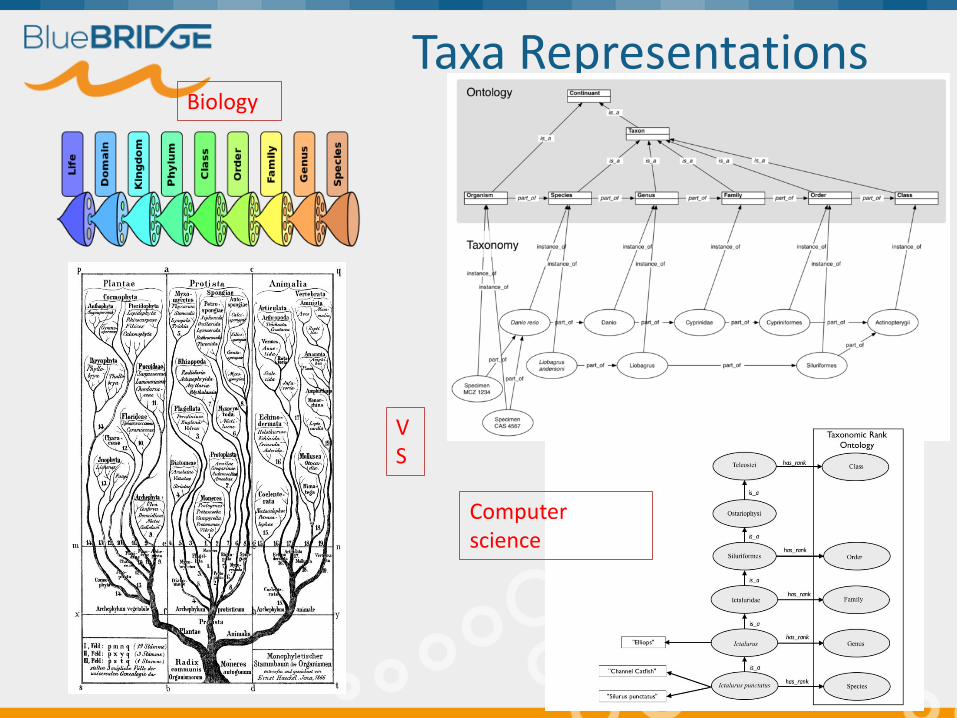
Taxa Representations Biology
Computer science
VS
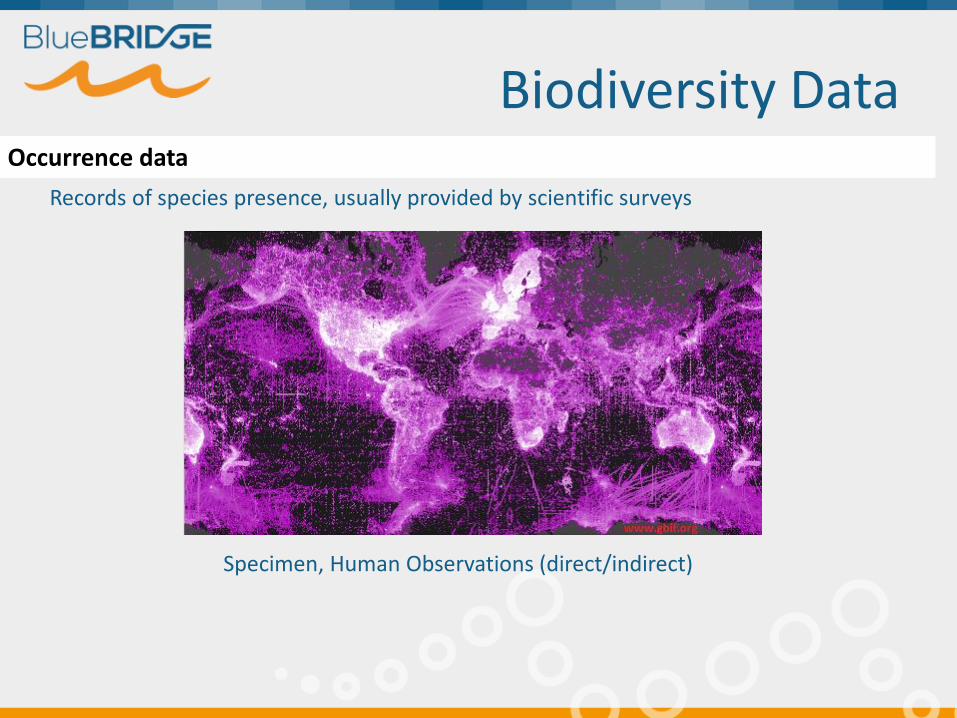
Biodiversity Data
Specimen, Human Observations (direct/indirect)
Records of species presence, usually provided by scientific surveys
Occurrence data
Biodiversity Data Providers
i-Marine hosts biodiversity datasets coming from several data providers: • Some are remotely accessed and are maintained by the respective owners; • Other ones are resident in the e-Infrastructure.
Currently, the accessible datasets are: • Catalogue of Life (CoL), • Global Biodiversity Information Facility (GBIF), • Integrated Taxonomic Information System (ITIS), • Interim Register of Marine and Nonmarine Genera (IRMNG), • Ocean Biogeographic Information System (OBIS), • World Register of Marine Species (WoRMS), • World Register of Deep-Sea Species ( WoRDSS ).
Some data providers are collectors of other data providers, but the alignment is not guaranteed! The datasets allow to retrieve: • Occurrence points (presence points or specimen) • Taxa names
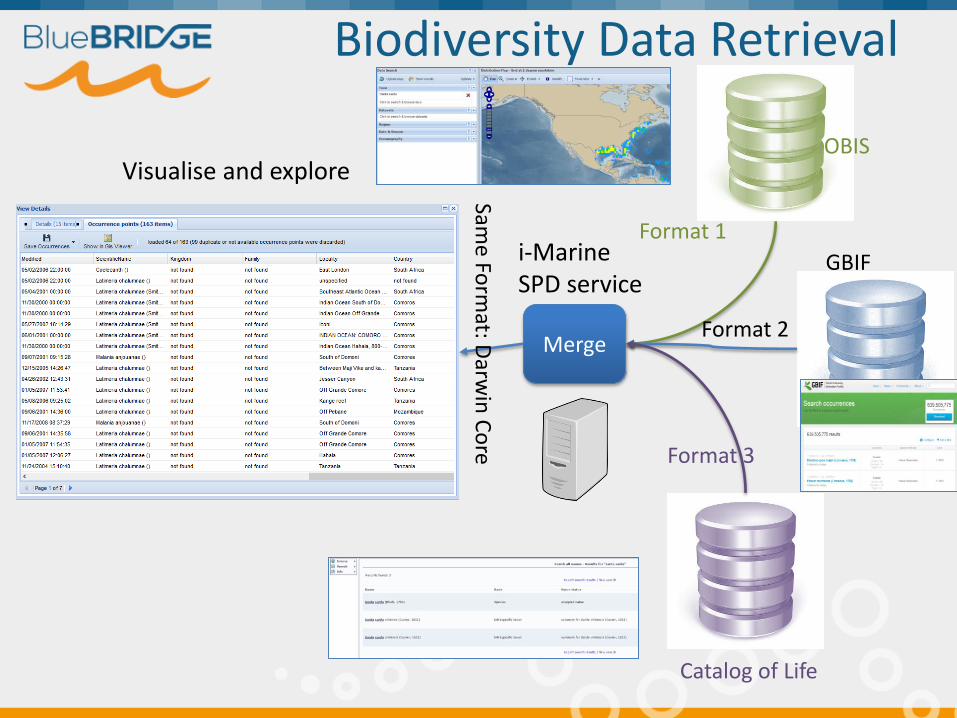
Biodiversity Data Retrieval
Merge
OBIS
GBIF
Catalog of Life
Visualise and explore
Format 1
Format 2
Format 3 Sam
e Form
at: Darw
in C
ore
i-Marine SPD service

Remote
Remote
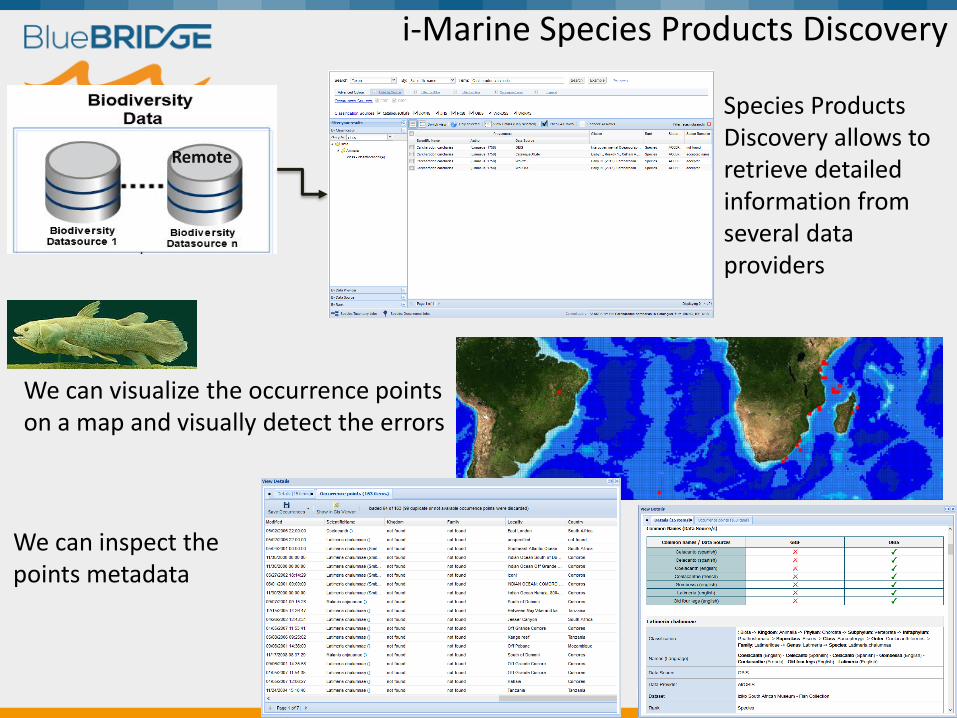
i-Marine Species Products Discovery
Species Products Discovery allows to retrieve detailed information from several data providers
We can visualize the occurrence points on a map and visually detect the errors
We can inspect the points metadata
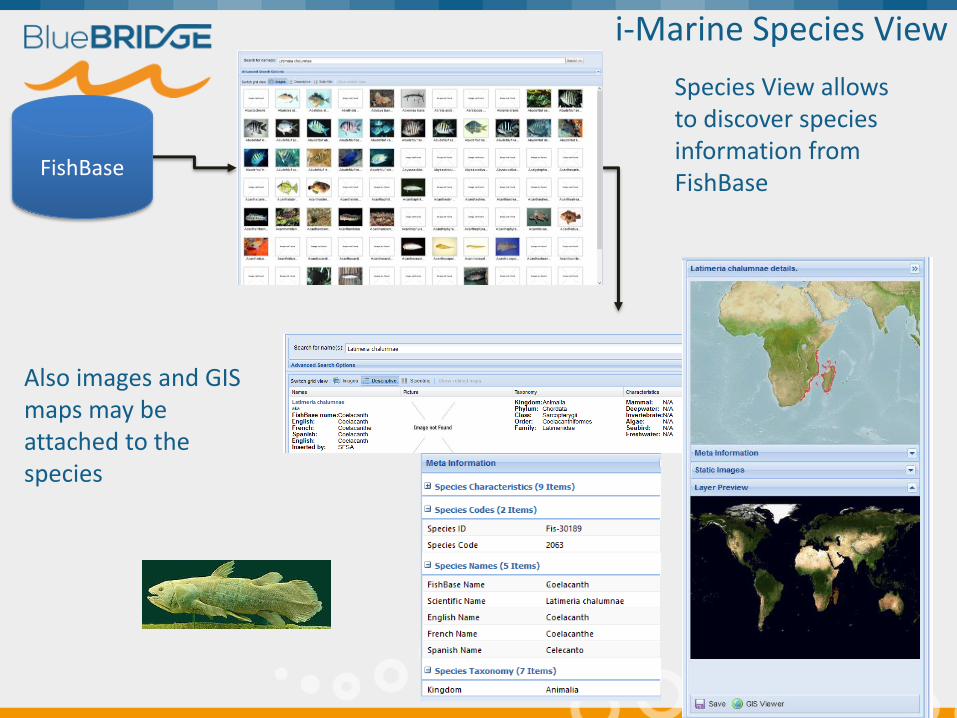
i-Marine Species View
Species View allows to discover species information from FishBase
FishBase
Also images and GIS maps may be attached to the species
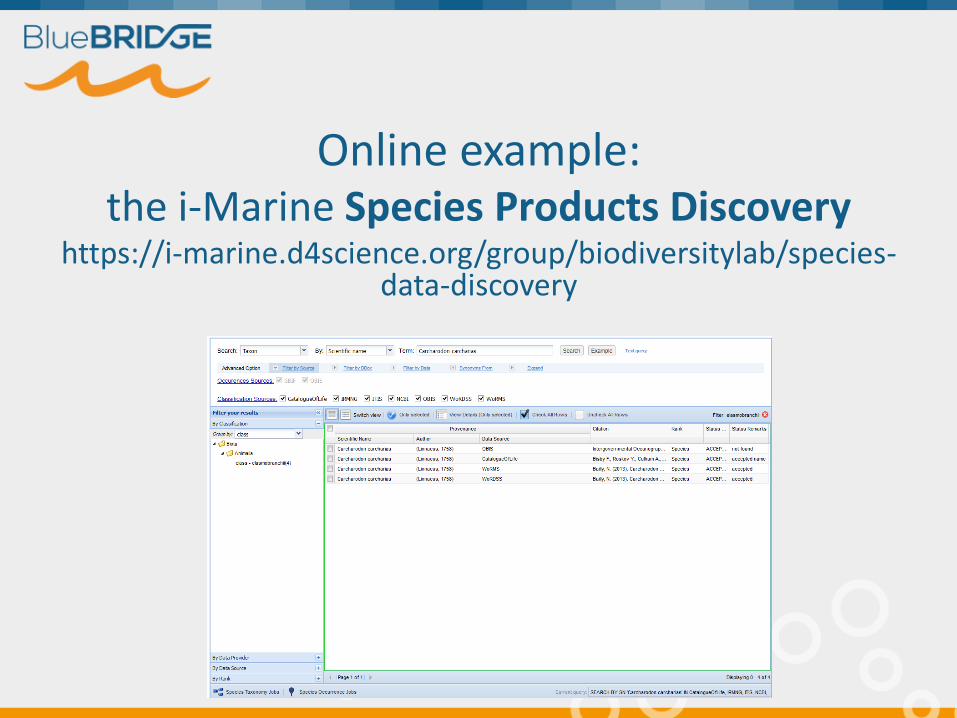
Online example: the i-Marine Species Products Discovery
https://i-marine.d4science.org/group/biodiversitylab/species-data-discovery
Outline
• E-Infrastructures
• i-Marine
• Biodiversity data
• Geospatial data
• Data processing
• Examples
Geospatial data
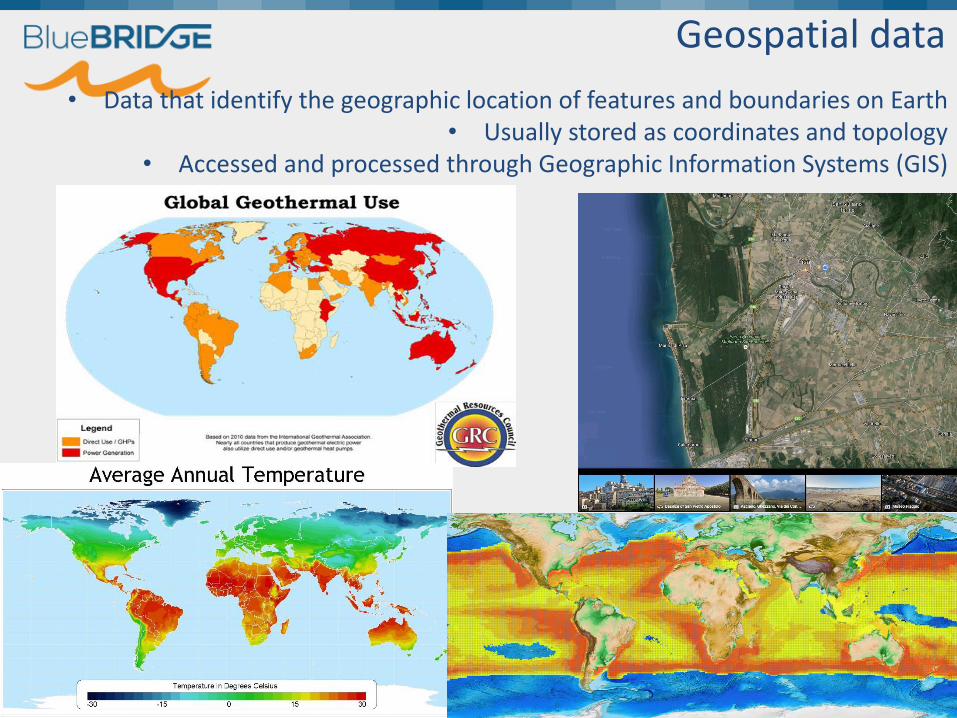
• Data that identify the geographic location of features and boundaries on Earth • Usually stored as coordinates and topology
• Accessed and processed through Geographic Information Systems (GIS)
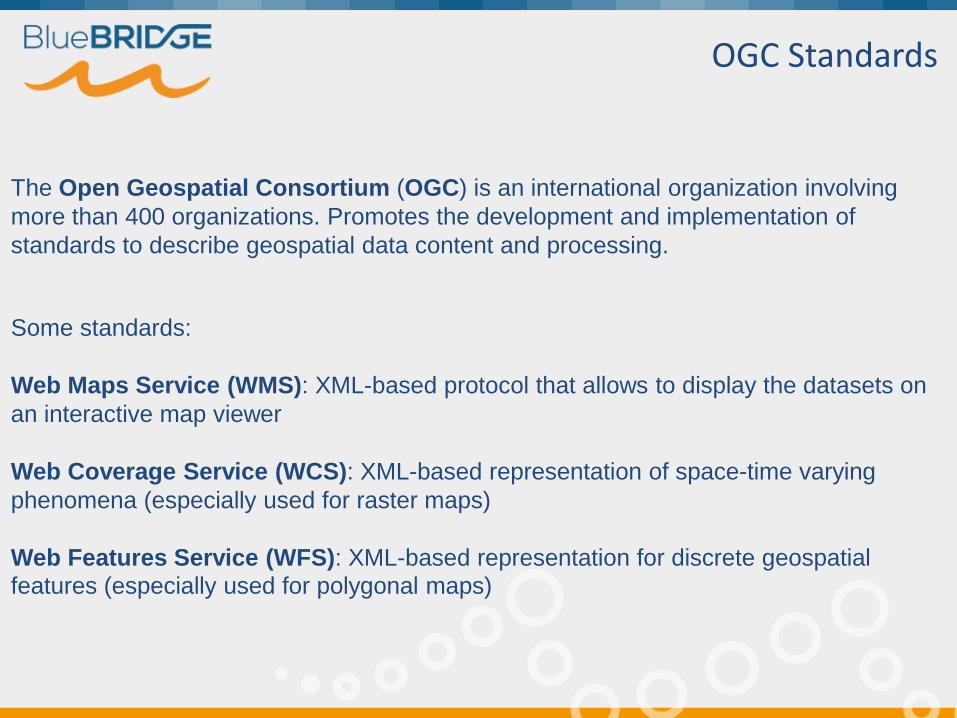
OGC Standards
Some standards:
Web Maps Service (WMS): XML-based protocol that allows to display the datasets on
an interactive map viewer
Web Coverage Service (WCS): XML-based representation of space-time varying
phenomena (especially used for raster maps)
Web Features Service (WFS): XML-based representation for discrete geospatial
features (especially used for polygonal maps)
The Open Geospatial Consortium (OGC) is an international organization involving
more than 400 organizations. Promotes the development and implementation of
standards to describe geospatial data content and processing.
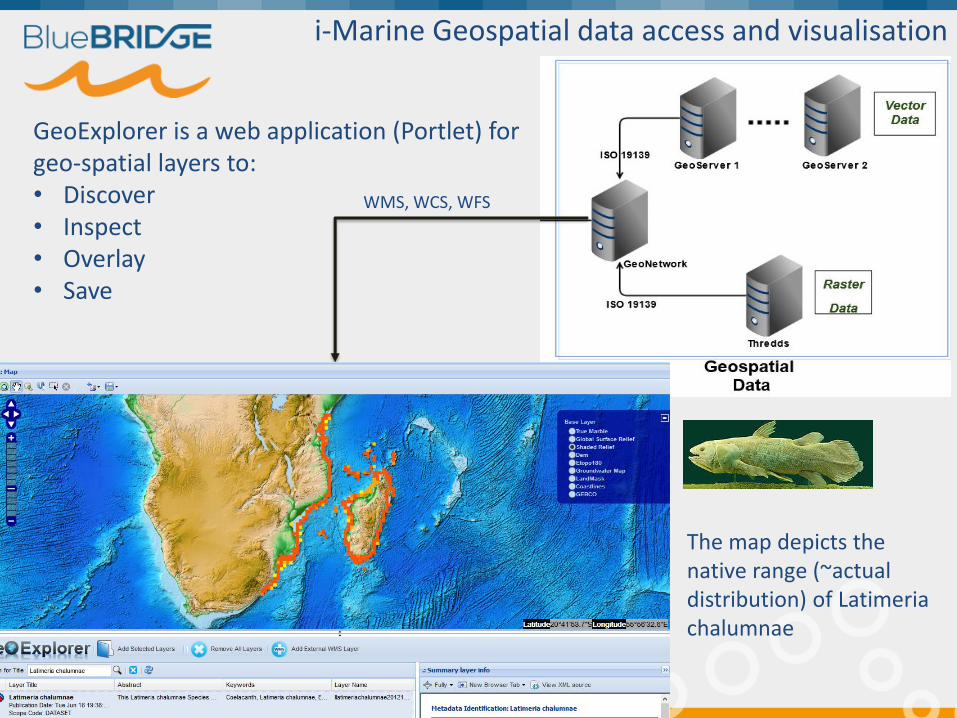
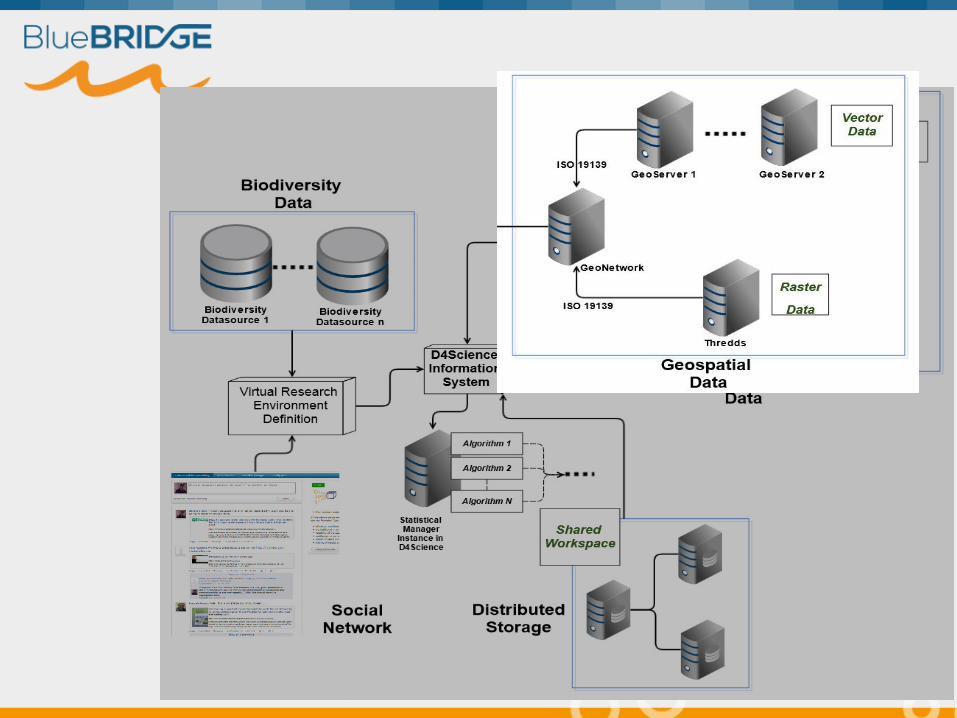
i-Marine Geospatial data access and visualisation
GeoExplorer is a web application (Portlet) for geo-spatial layers to: • Discover • Inspect • Overlay • Save
WMS, WCS, WFS
The map depicts the native range (~actual distribution) of Latimeria chalumnae
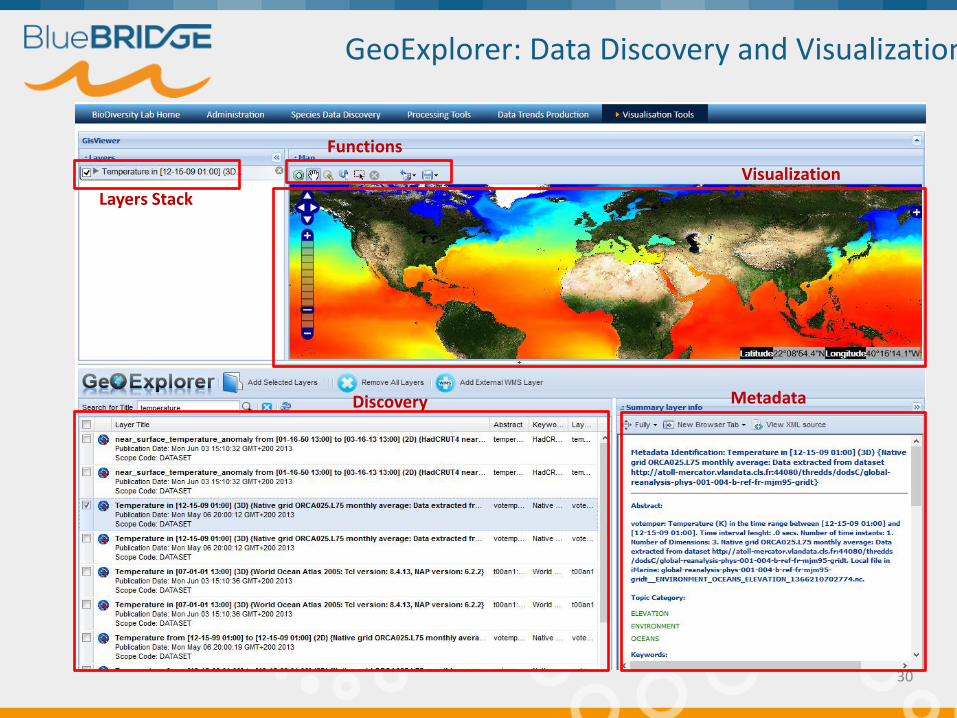
GeoExplorer: Data Discovery and Visualization
30
Layers Stack
Functions
Visualization
Discovery Metadata

Example: the i-Marine GeoExplorer
https://i-marine.d4science.org/group/biodiversitylab/geo-visualisation
Outline
• E-Infrastructures
• i-Marine
• Biodiversity data
• Geospatial data
• Data processing
• Examples
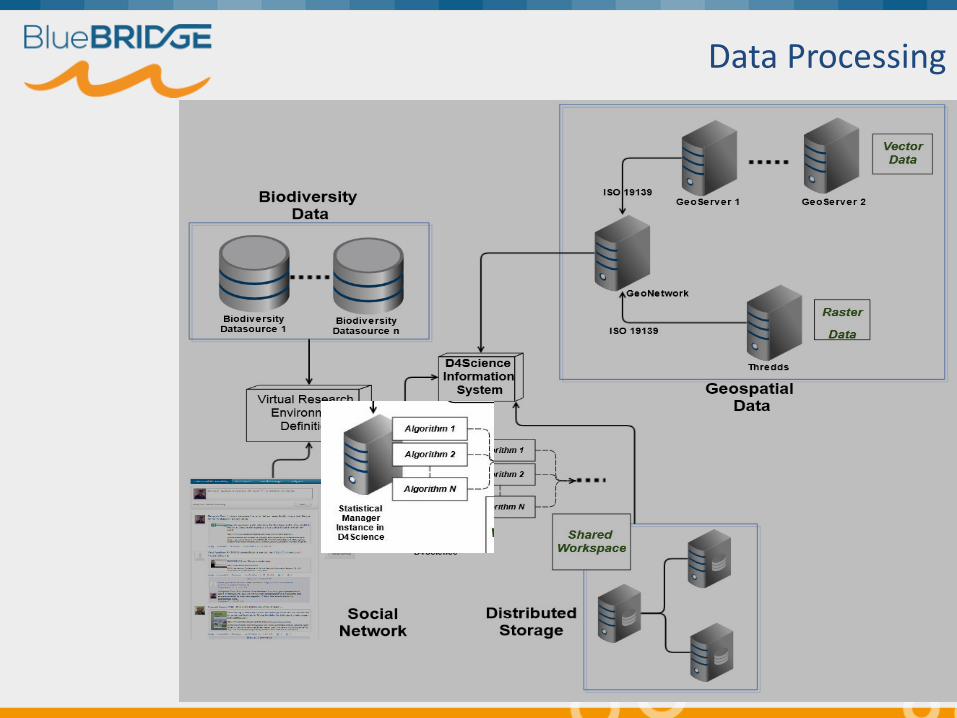
Data Processing
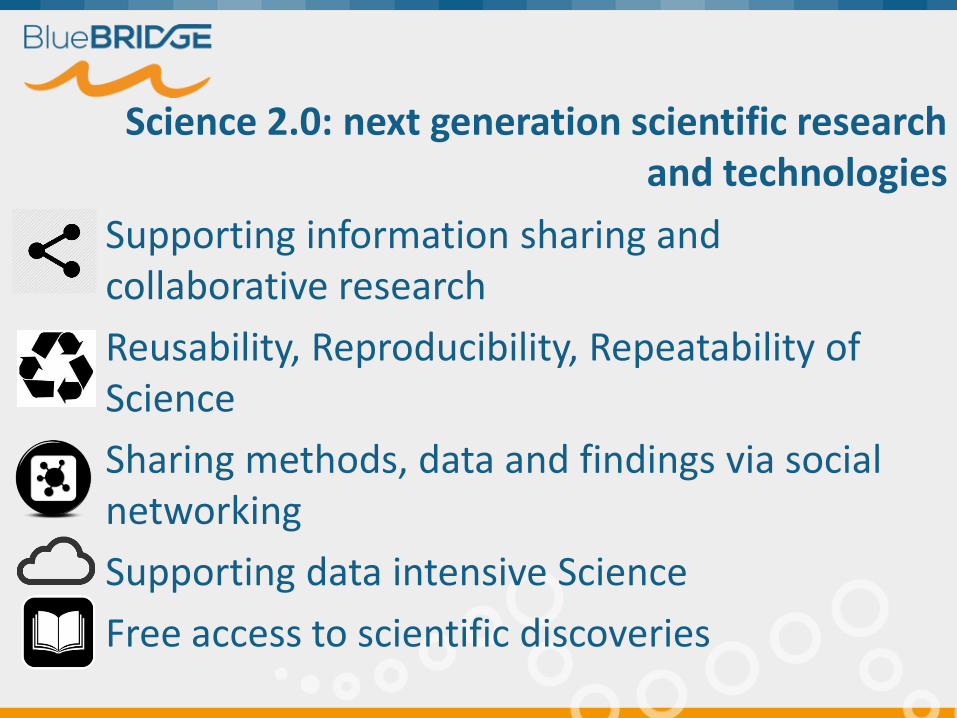
Supporting information sharing and collaborative research
Reusability, Reproducibility, Repeatability of Science
Sharing methods, data and findings via social networking
Supporting data intensive Science
Free access to scientific discoveries
Science 2.0: next generation scientific research and technologies
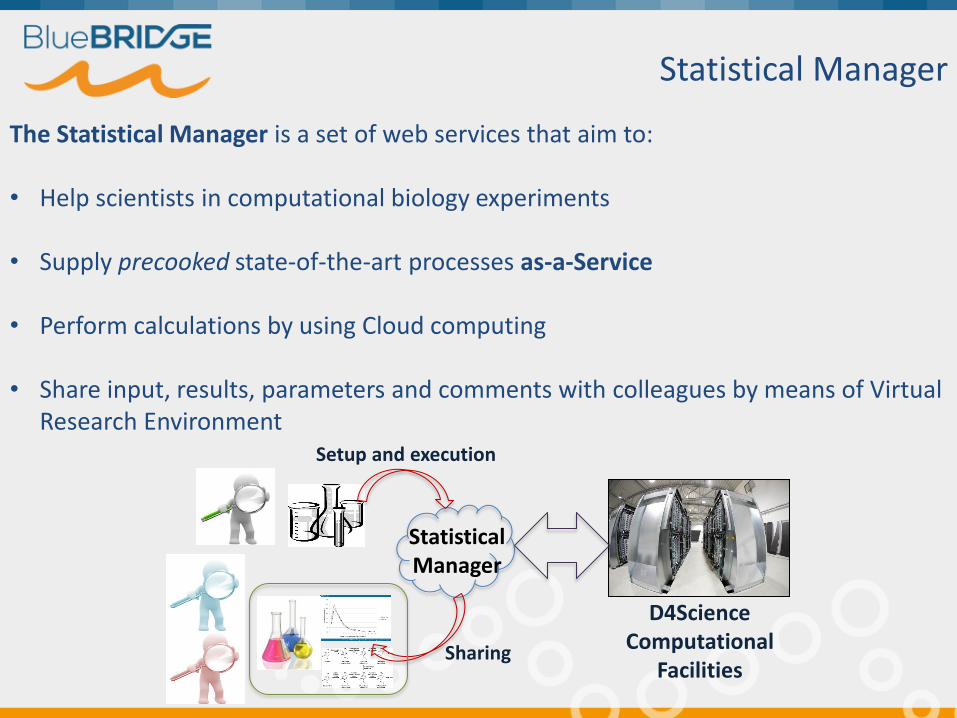
The Statistical Manager is a set of web services that aim to: • Help scientists in computational biology experiments
• Supply precooked state-of-the-art processes as-a-Service
• Perform calculations by using Cloud computing
• Share input, results, parameters and comments with colleagues by means of Virtual
Research Environment
Statistical Manager
Statistical Manager
D4Science Computational
Facilities Sharing
Setup and execution
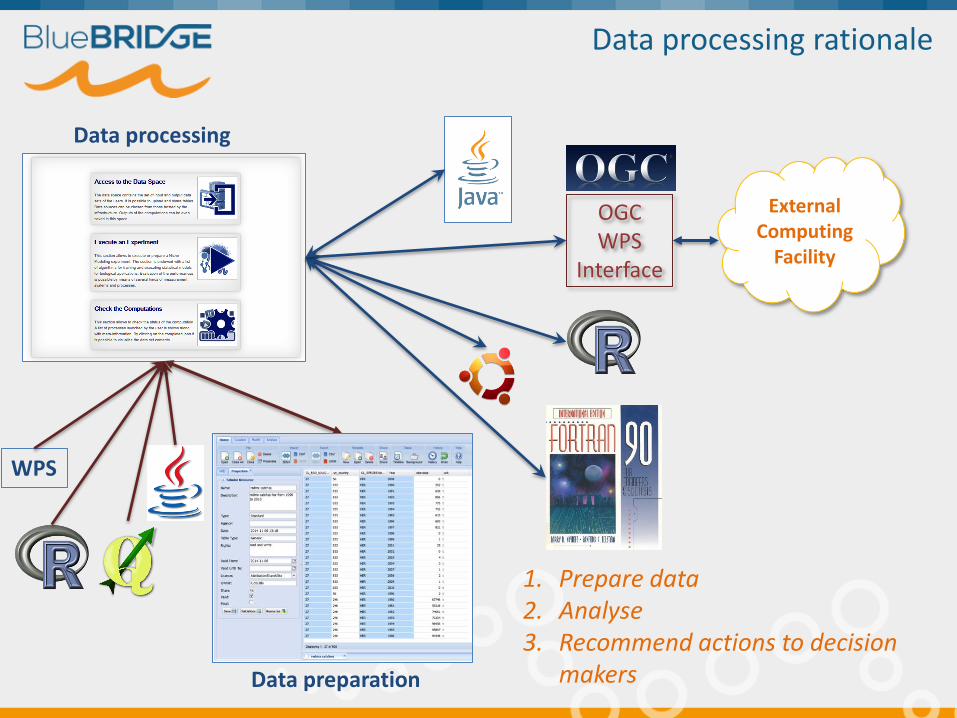
Data processing rationale
External Computing
Facility
OGC WPS
Interface
Data preparation
Data processing
WPS
1. Prepare data 2. Analyse 3. Recommend actions to decision
makers
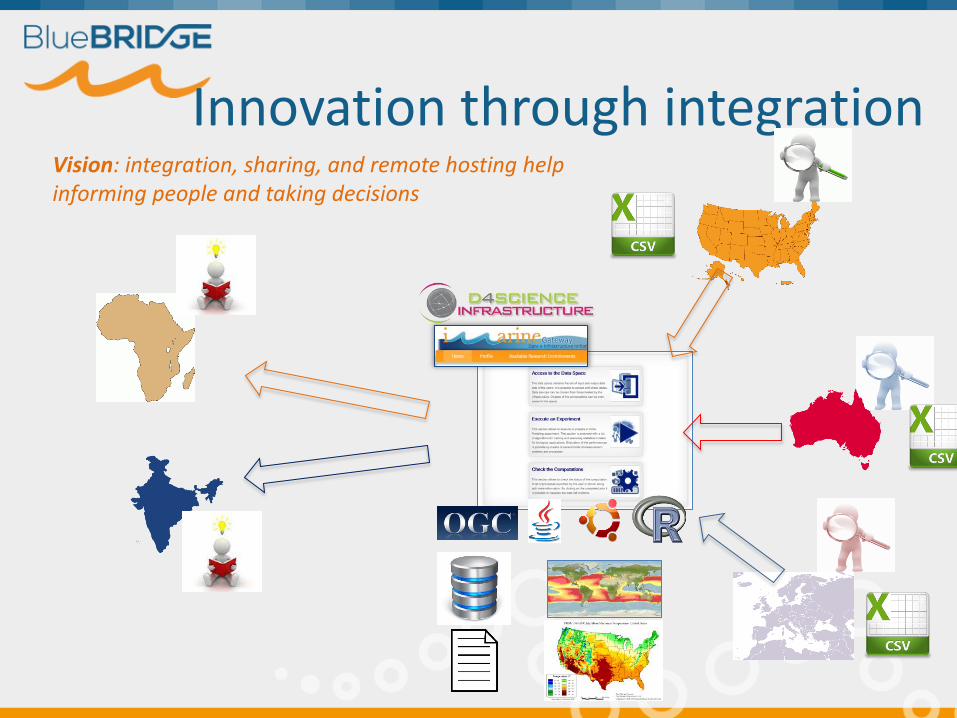
Innovation through integration Vision: integration, sharing, and remote hosting help informing people and taking decisions
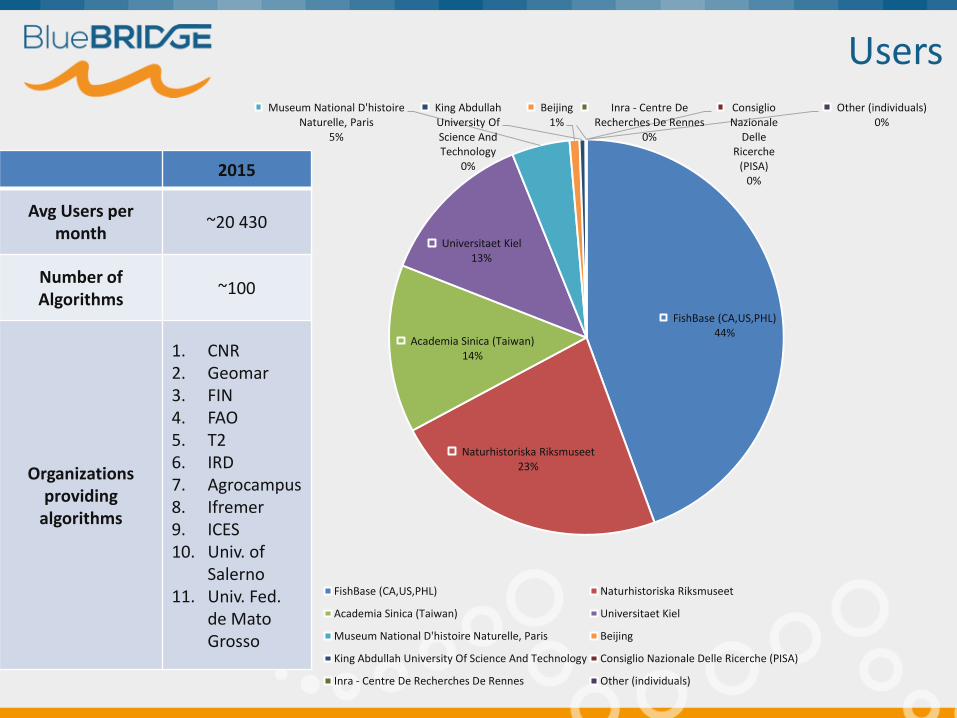
Users
2015
Avg Users per month
~20 430
Number of Algorithms
~100
Organizations providing
algorithms
1. CNR 2. Geomar 3. FIN 4. FAO 5. T2 6. IRD 7. Agrocampus 8. Ifremer 9. ICES 10. Univ. of
Salerno 11. Univ. Fed.
de Mato Grosso
FishBase (CA,US,PHL) 44%
Naturhistoriska Riksmuseet 23%
Academia Sinica (Taiwan) 14%
Universitaet Kiel 13%
Museum National D'histoire Naturelle, Paris
5%
Beijing 1%
King Abdullah University Of Science And Technology
0%
Consiglio Nazionale
Delle Ricerche
(PISA) 0%
Inra - Centre De Recherches De Rennes
0%
Other (individuals) 0%
FishBase (CA,US,PHL) Naturhistoriska Riksmuseet
Academia Sinica (Taiwan) Universitaet Kiel
Museum National D'histoire Naturelle, Paris Beijing
King Abdullah University Of Science And Technology Consiglio Nazionale Delle Ricerche (PISA)
Inra - Centre De Recherches De Rennes Other (individuals)
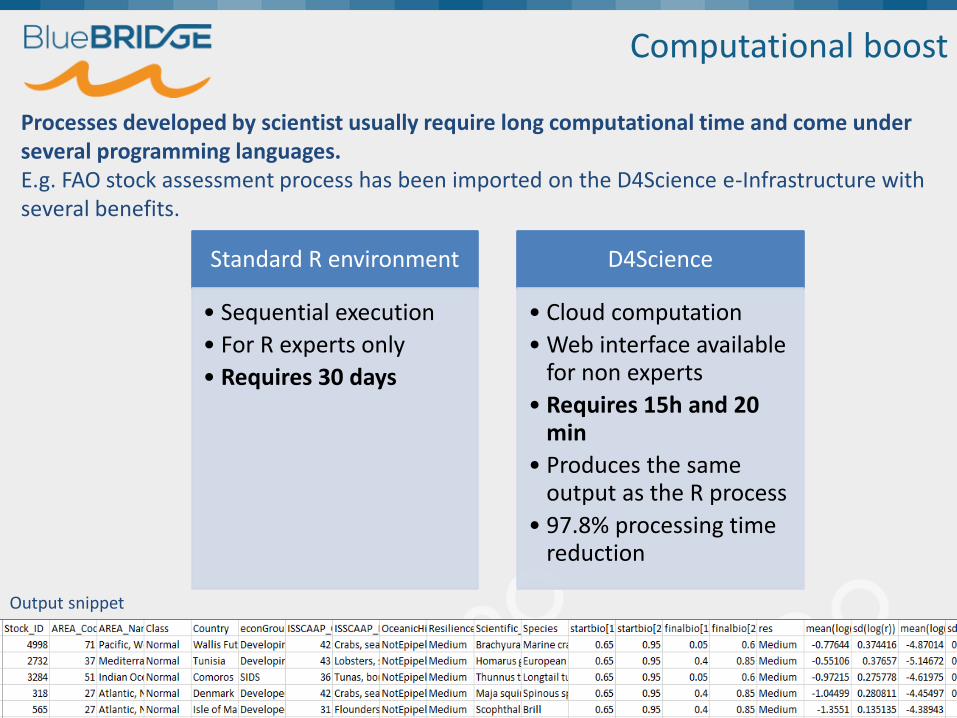
Computational boost
Processes developed by scientist usually require long computational time and come under several programming languages. E.g. FAO stock assessment process has been imported on the D4Science e-Infrastructure with several benefits.
Standard R environment
• Sequential execution
• For R experts only
• Requires 30 days
D4Science
• Cloud computation
• Web interface available for non experts
• Requires 15h and 20 min
• Produces the same output as the R process
• 97.8% processing time reduction
Output snippet
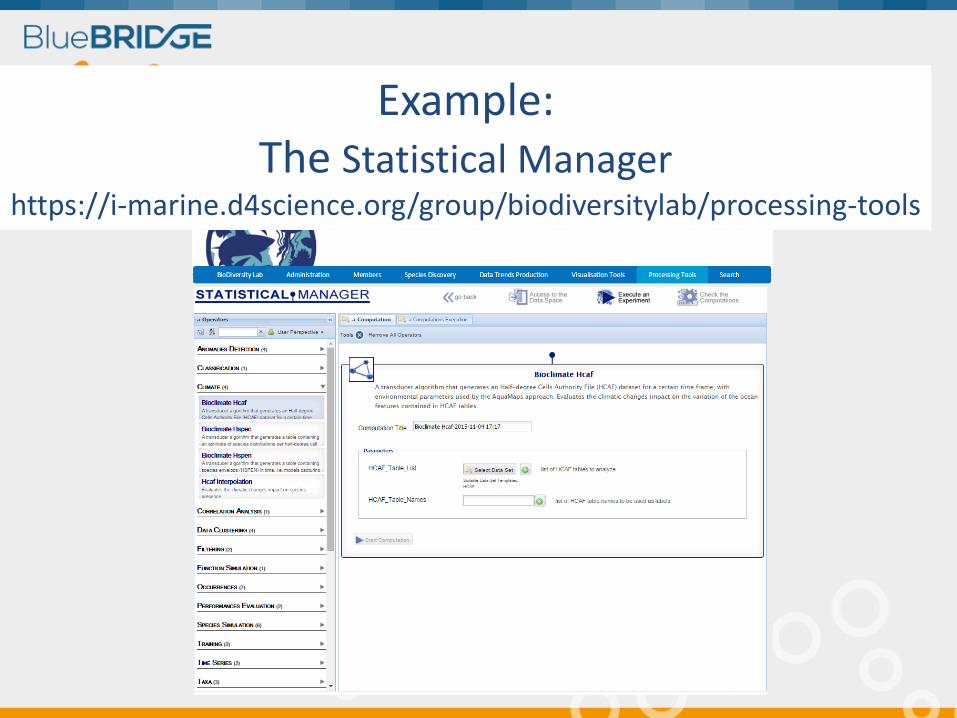
Example: The Statistical Manager
https://i-marine.d4science.org/group/biodiversitylab/processing-tools
Outline
• E-Infrastructures
• i-Marine
• Biodiversity data
• Geospatial data
• Data processing
• Examples
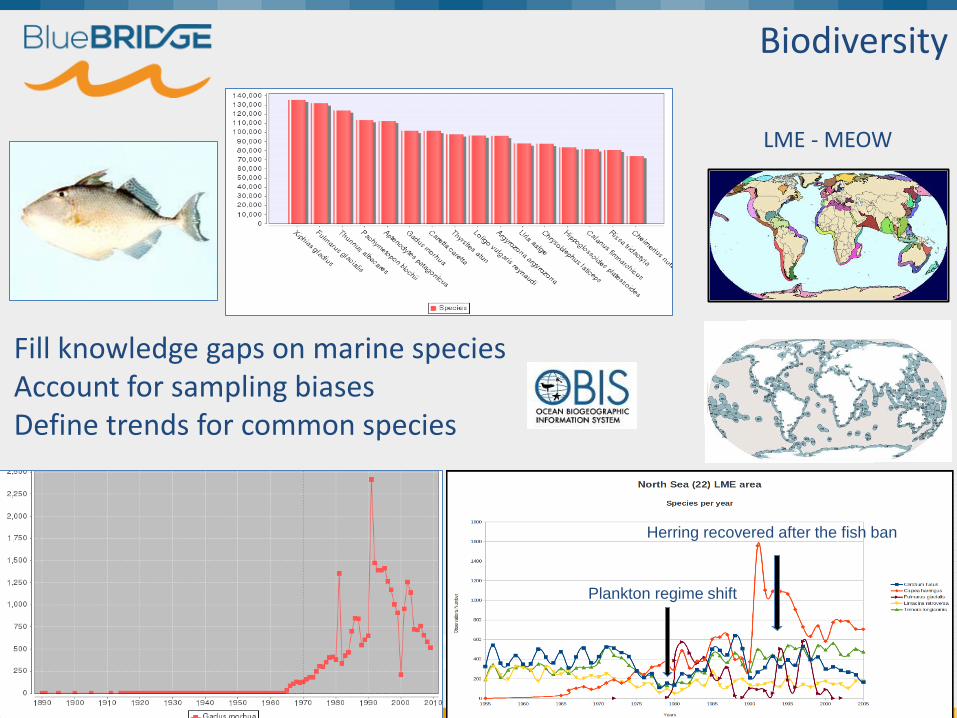
Biodiversity
Fill knowledge gaps on marine species Account for sampling biases Define trends for common species
Plankton regime shift
Herring recovered after the fish ban
LME - MEOW
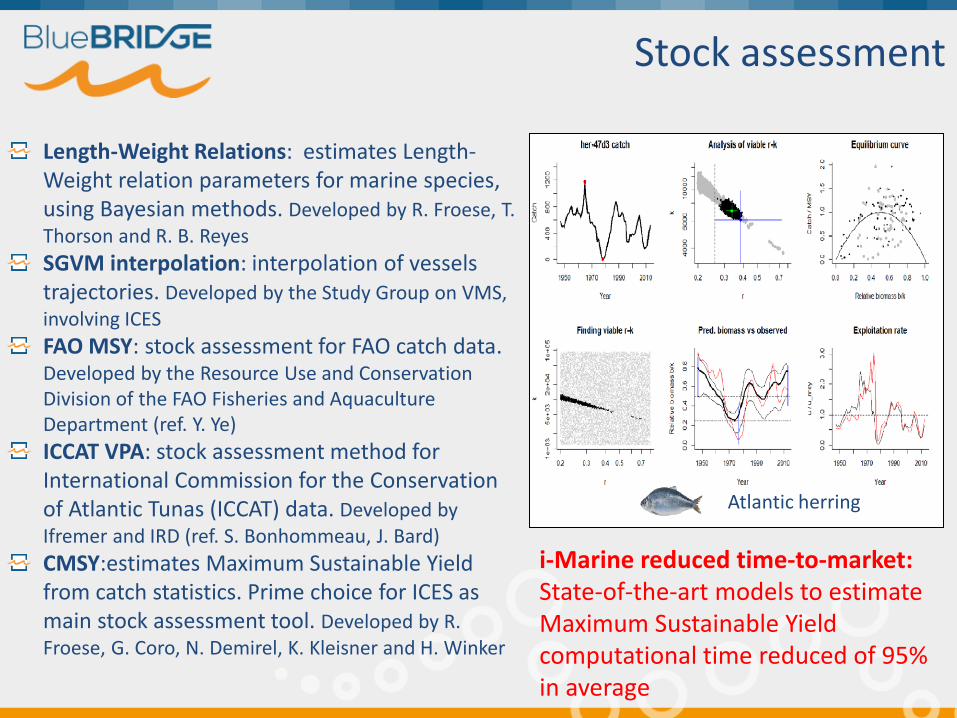
Stock assessment
Length-Weight Relations: estimates Length-Weight relation parameters for marine species, using Bayesian methods. Developed by R. Froese, T. Thorson and R. B. Reyes
SGVM interpolation: interpolation of vessels trajectories. Developed by the Study Group on VMS, involving ICES
FAO MSY: stock assessment for FAO catch data. Developed by the Resource Use and Conservation Division of the FAO Fisheries and Aquaculture Department (ref. Y. Ye)
ICCAT VPA: stock assessment method for International Commission for the Conservation of Atlantic Tunas (ICCAT) data. Developed by Ifremer and IRD (ref. S. Bonhommeau, J. Bard)
CMSY:estimates Maximum Sustainable Yield from catch statistics. Prime choice for ICES as main stock assessment tool. Developed by R. Froese, G. Coro, N. Demirel, K. Kleisner and H. Winker
Atlantic herring
i-Marine reduced time-to-market: State-of-the-art models to estimate Maximum Sustainable Yield computational time reduced of 95% in average
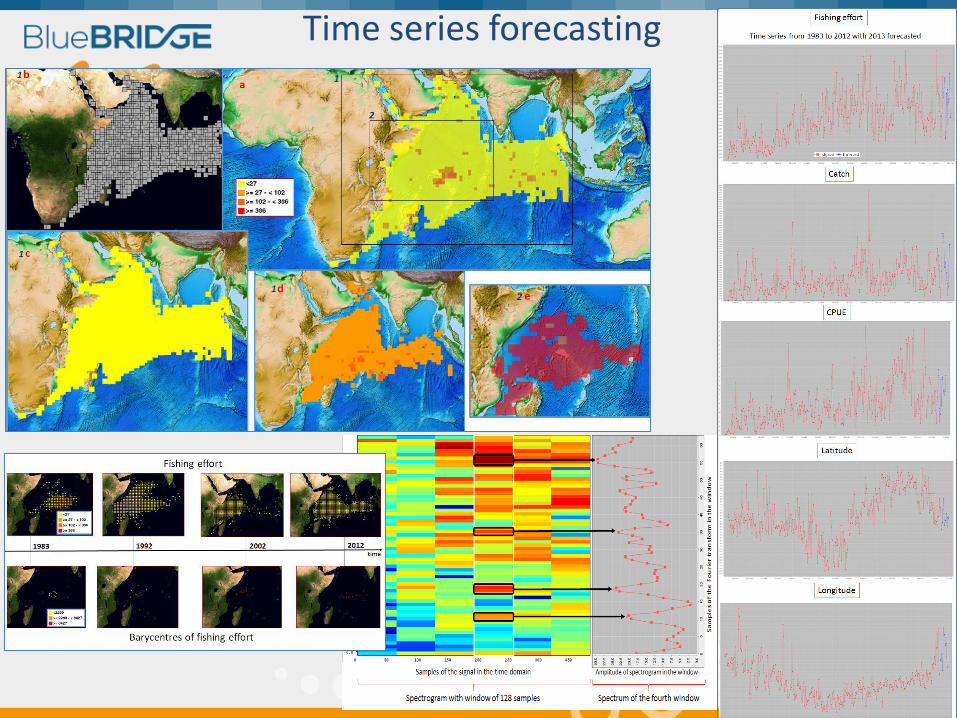
Time series forecasting
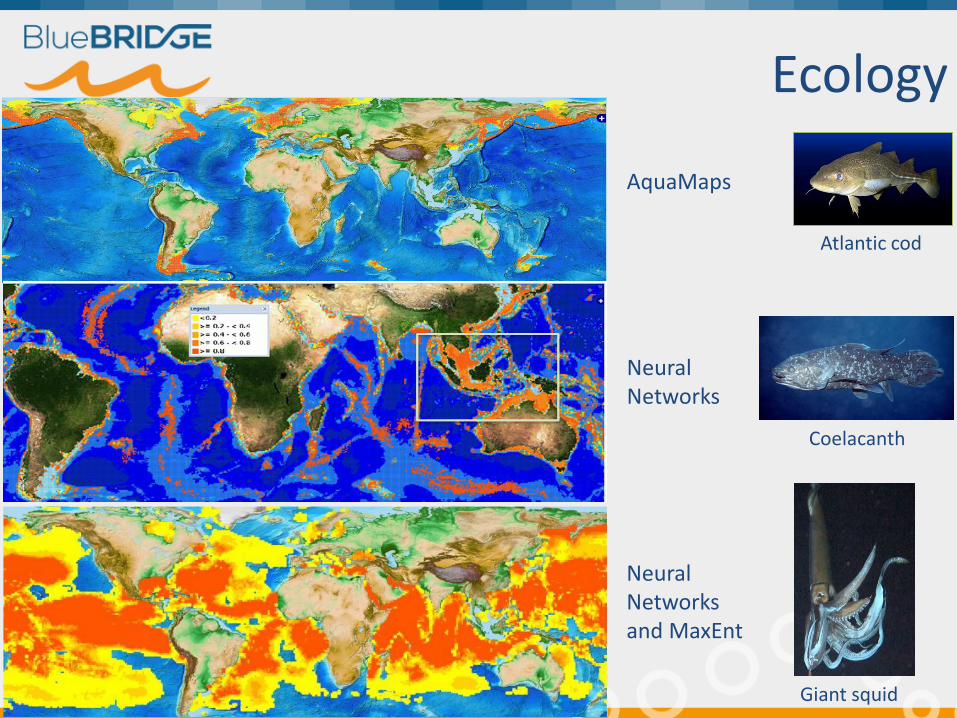
Ecology
Atlantic cod
Coelacanth
Giant squid
AquaMaps
Neural Networks
Neural Networks and MaxEnt
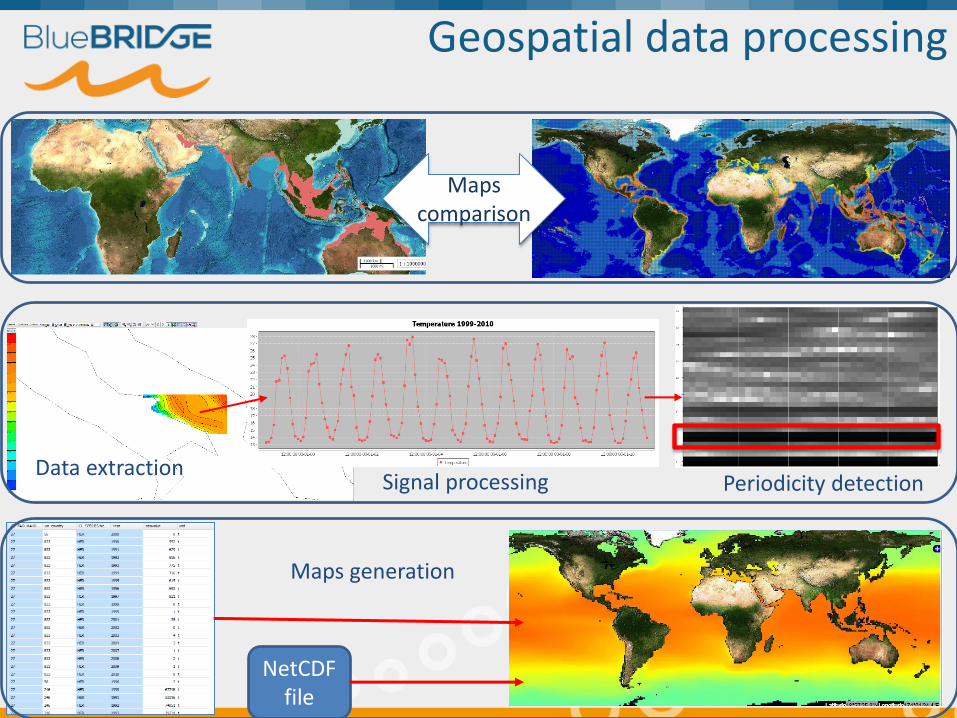
Geospatial data processing
Maps comparison
NetCDF file
Data extraction Signal processing Periodicity detection
Maps generation
One complete experiment
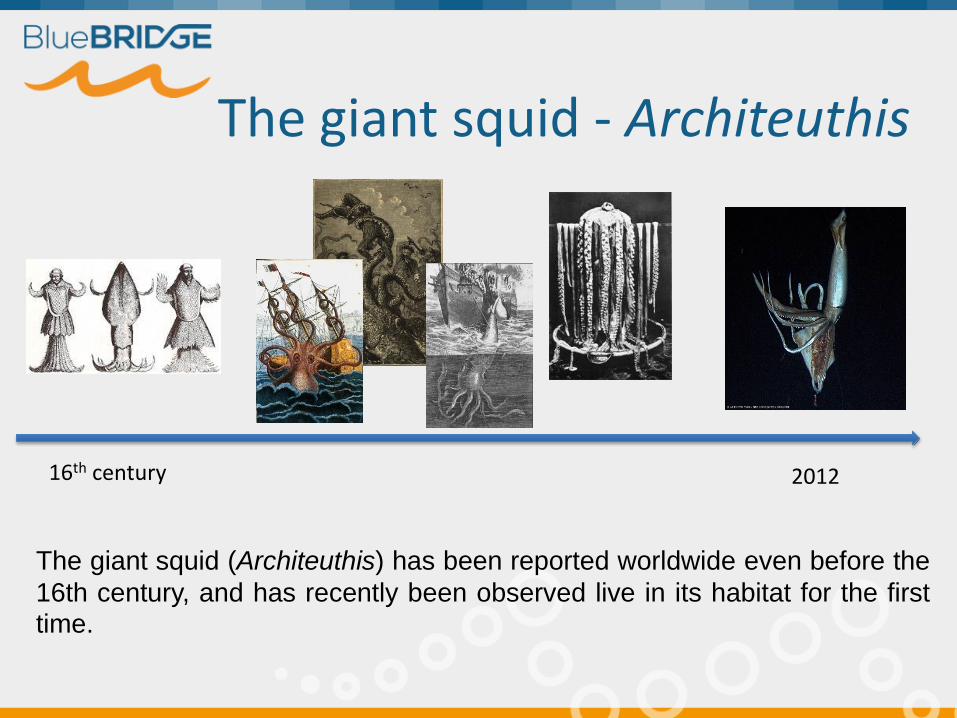
The giant squid - Architeuthis
16th century 2012
The giant squid (Architeuthis) has been reported worldwide even before the
16th century, and has recently been observed live in its habitat for the first time.
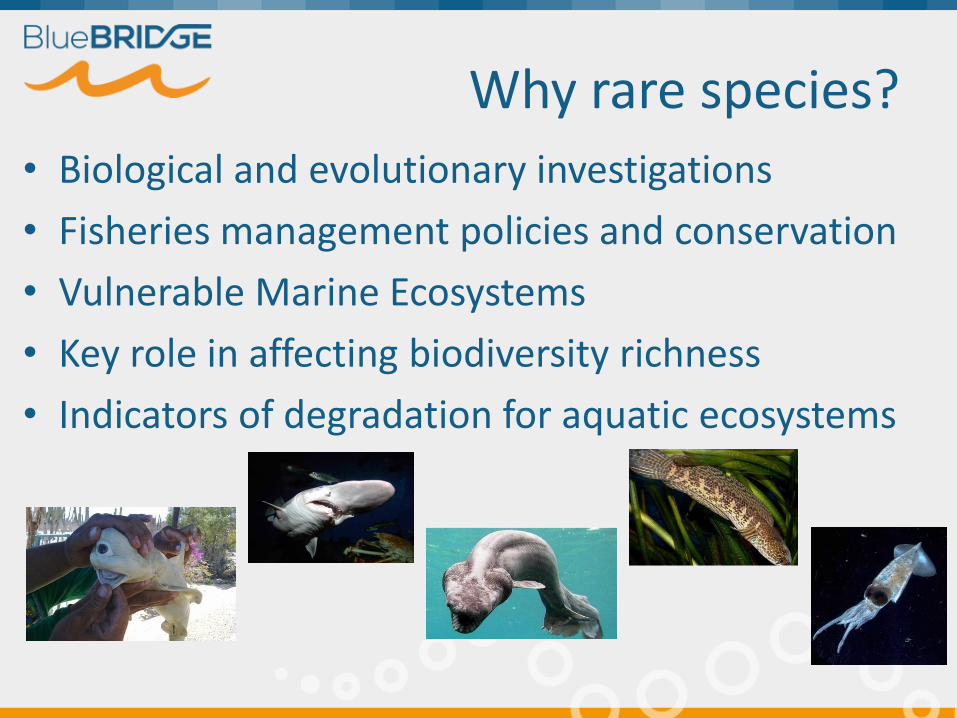
Why rare species?
• Biological and evolutionary investigations
• Fisheries management policies and conservation
• Vulnerable Marine Ecosystems
• Key role in affecting biodiversity richness
• Indicators of degradation for aquatic ecosystems
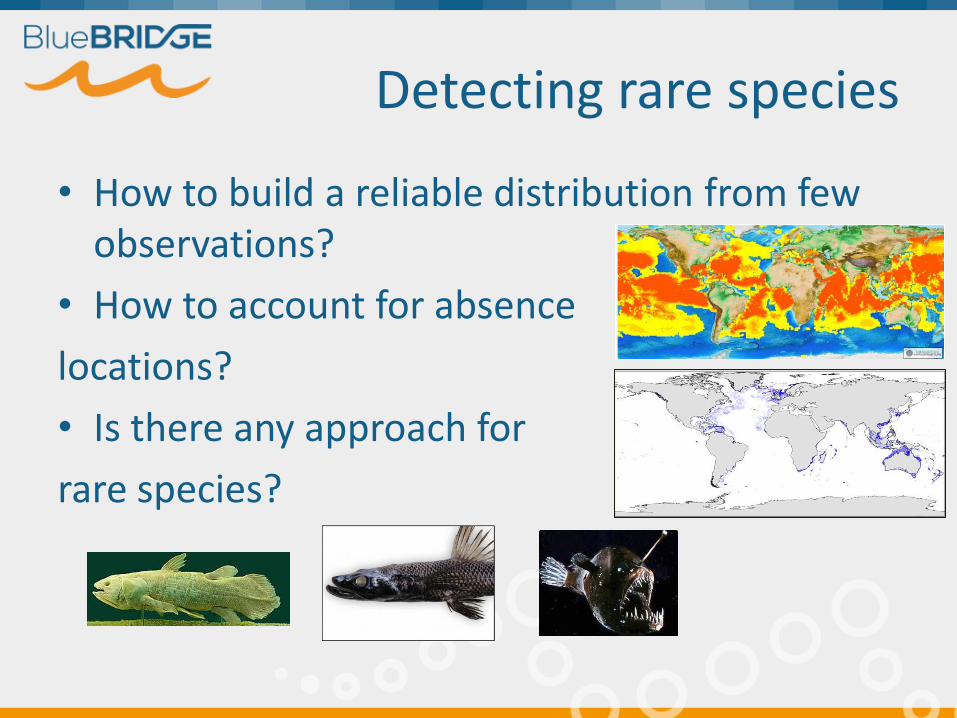
Detecting rare species
• How to build a reliable distribution from few observations?
• How to account for absence
locations?
• Is there any approach for
rare species?
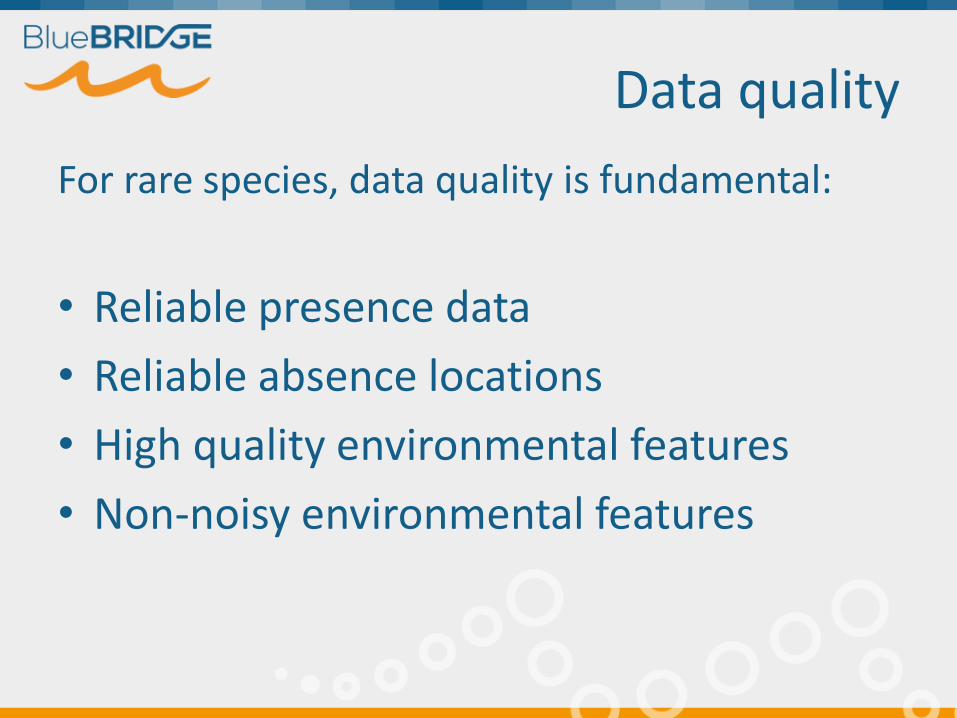
Data quality
For rare species, data quality is fundamental:
• Reliable presence data
• Reliable absence locations
• High quality environmental features
• Non-noisy environmental features
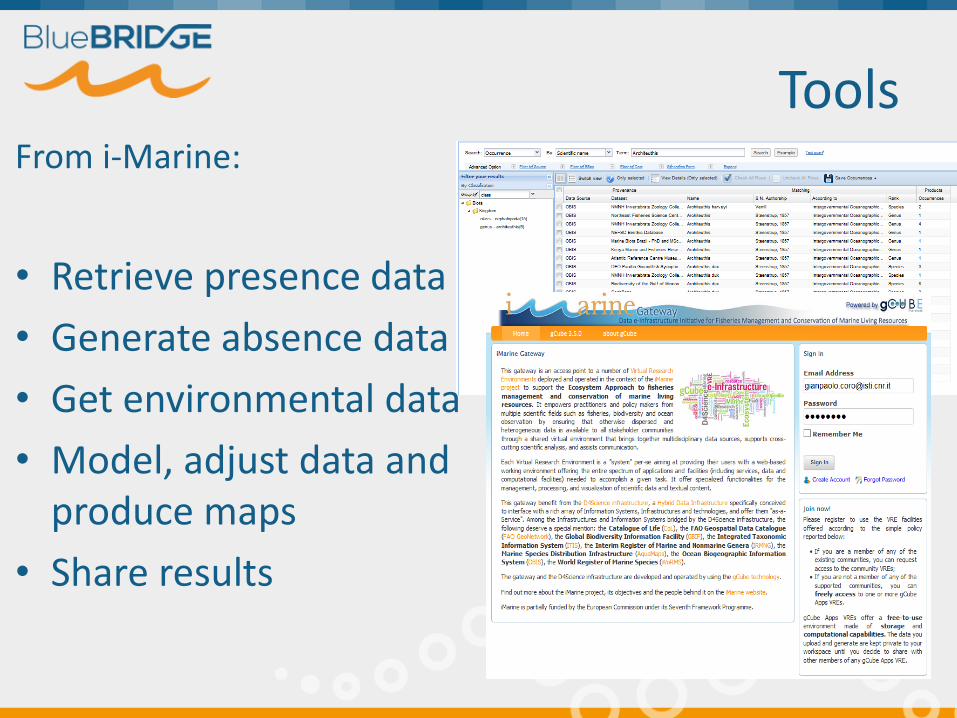
Tools From i-Marine:
• Retrieve presence data
• Generate absence data
• Get environmental data
• Model, adjust data and produce maps
• Share results

1. Presence data of A. dux from i-Marine
https://i-marine.d4science.org/group/biodiversitylab/species-data-discovery
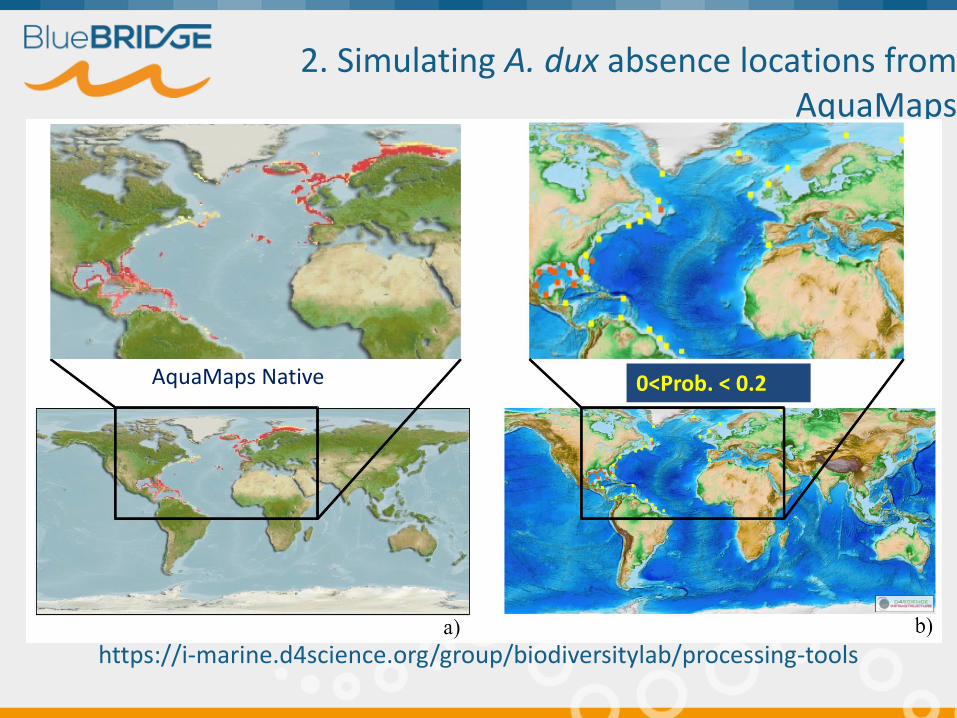
2. Simulating A. dux absence locations from AquaMaps
https://i-marine.d4science.org/group/biodiversitylab/processing-tools
0<Prob. < 0.2 AquaMaps Native
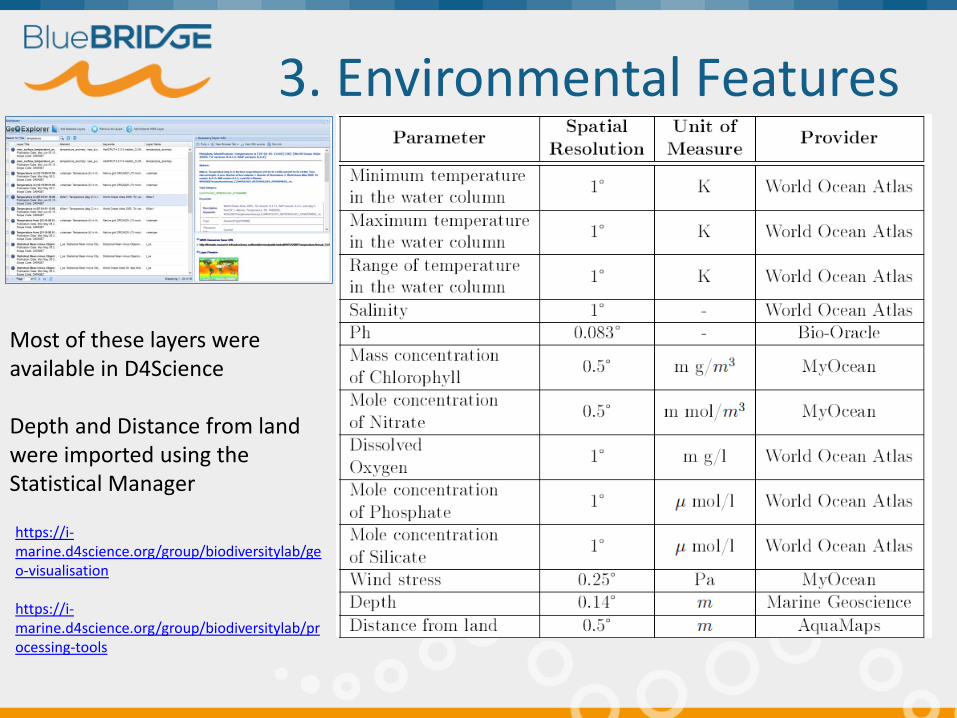
3. Environmental Features
https://i-marine.d4science.org/group/biodiversitylab/geo-visualisation https://i-marine.d4science.org/group/biodiversitylab/processing-tools
Most of these layers were available in D4Science Depth and Distance from land were imported using the Statistical Manager
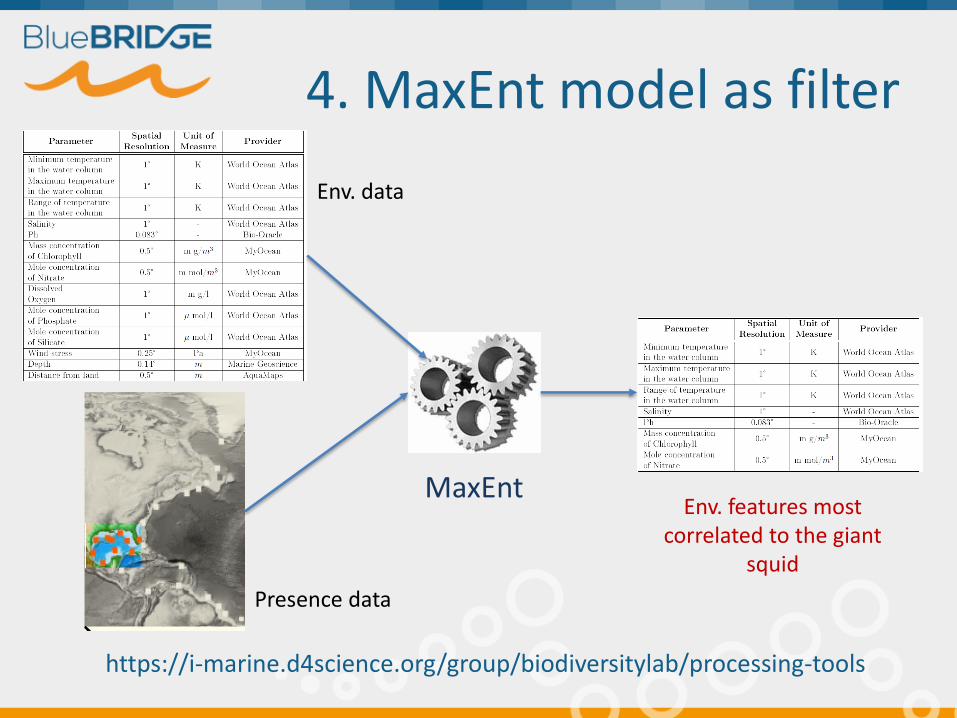
4. MaxEnt model as filter
https://i-marine.d4science.org/group/biodiversitylab/processing-tools
MaxEnt Env. features most
correlated to the giant squid
Presence data
Env. data

Filtered Environmental Features

5. Presence/absence modelling: Artificial Neural Networks (ANN)
Model trained on positive and negative examples In terms of env. features
Trained model
https://i-marine.d4science.org/group/biodiversitylab/processing-tools
Presence/absence data
Filtered env. features
1 (presence data)
0 (absence data)
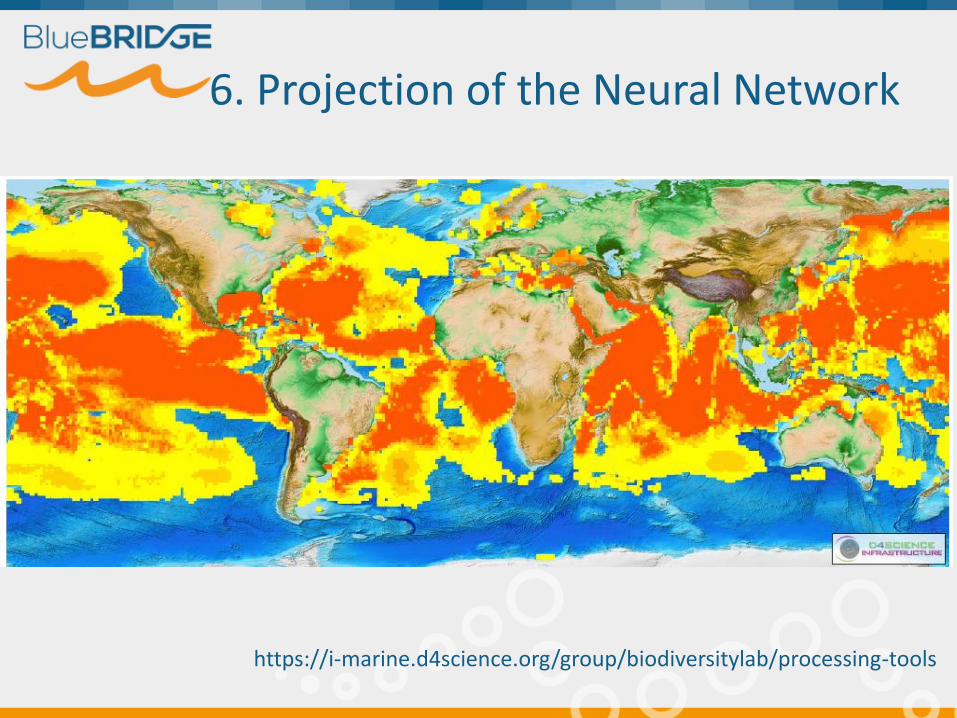
6. Projection of the Neural Network
https://i-marine.d4science.org/group/biodiversitylab/processing-tools

7. Comparison
MaxEnt (presence-only)
22.01% 21.68%
Similarity calculated using Maps Comparison, by Coro, Ellenbroek, Pagano DOI: 10.1080/15481603.2014.959391
Expert map, Nesis, 2003
Aquamaps Suitable
(expert system)
Neural Network (presence/absence)
42.83%
https://i-marine.d4science.org/group/biodiversitylab/processing-tools
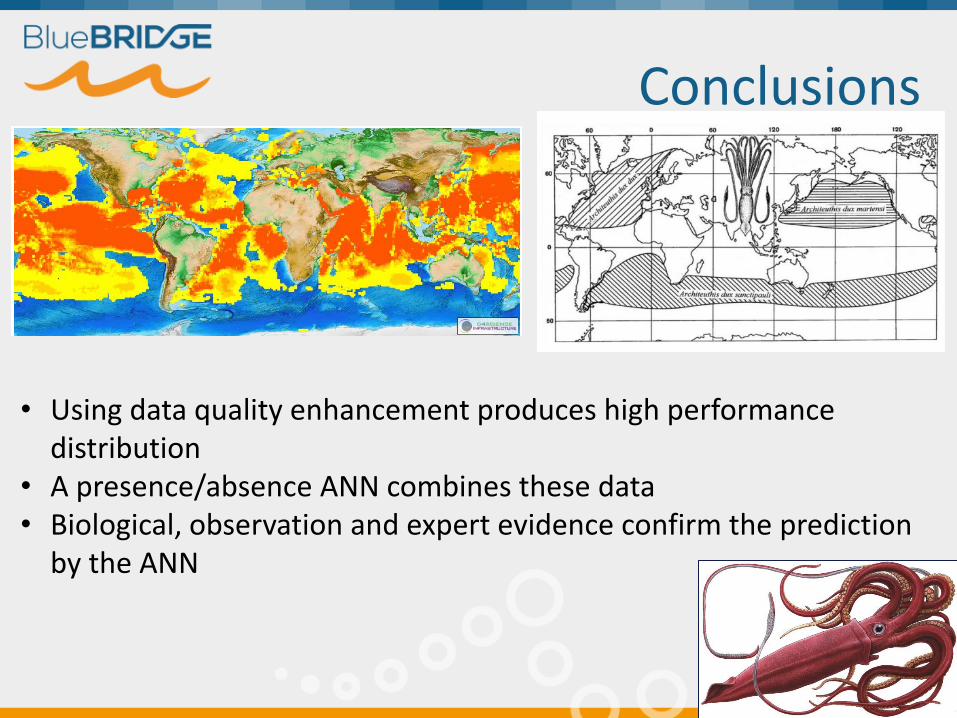
Conclusions
• Using data quality enhancement produces high performance distribution
• A presence/absence ANN combines these data • Biological, observation and expert evidence confirm the prediction
by the ANN
Summary: modelling rare species distributions
1. Retrieve high quality presence locations by relying on the metadata of the records,
2. Use expert knowledge or an expert system to detect absence locations. Select absence locations as widespread as possible, 3. Select a number of environmental characteristics correlated to the species presence, 4. Use MaxEnt to filter the environmental characteristics that are really important with respect to the presence points, 5. Train an Artificial Neural Network on presence and absence locations and select the best learning topology, 6. Project the ANN at global scale, using the a resolution equal to the maximum in the environmental features, 7. Train a MaxEnt model as comparison system.

Coelacanth (Latimeria chalumnae, Smith 1939)
Coelacanths were thought to have gone extinct in the Late Cretaceous, but were rediscovered in 1938 off the coast of South Africa.
Its current form is closely related to its form 400 million years ago. It is related to lungfishes and tetrapods.
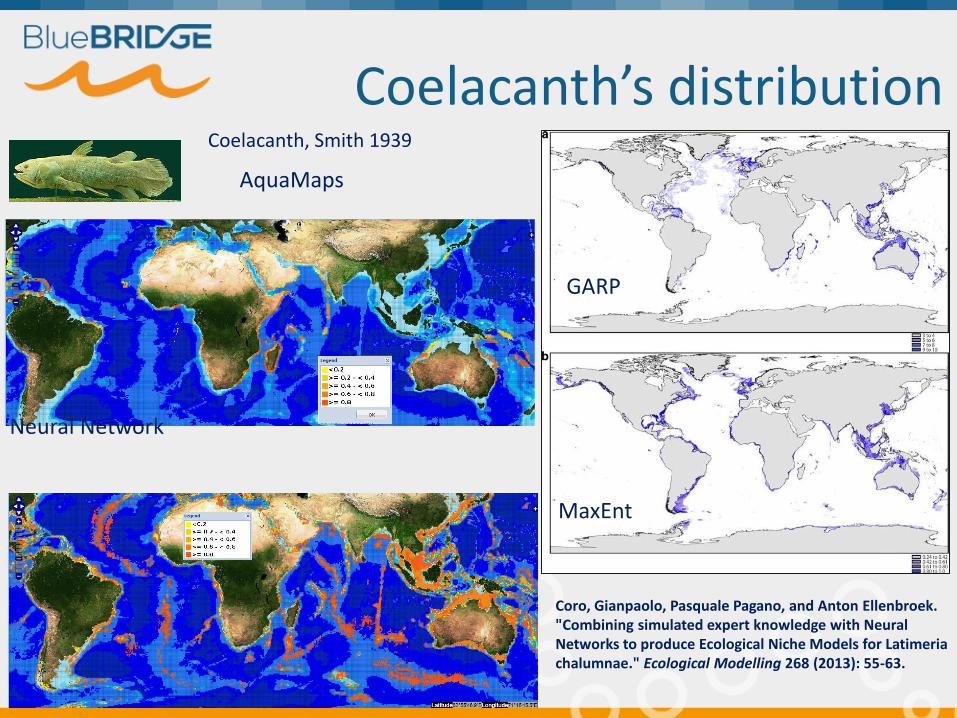
Coelacanth’s distribution Coelacanth, Smith 1939
GARP
MaxEnt
AquaMaps
Neural Network
Coro, Gianpaolo, Pasquale Pagano, and Anton Ellenbroek. "Combining simulated expert knowledge with Neural Networks to produce Ecological Niche Models for Latimeria chalumnae." Ecological Modelling 268 (2013): 55-63.
Thank you