Embed Size (px)
Citation preview

“The Jump to Light Speed – Data Intensive Earth Sciences are Leading the Way to the International LambdaGrid”
Keynote the 15th Federation of Earth Science Information Partners Assembly Meeting: Linking Data and Information
to Decision Makers
San Diego, CA
June 14, 2005Dr. Larry Smarr
Director, California Institute for Telecommunications and Information Technology
Harry E. Gruber Professor,
Dept. of Computer Science and Engineering
Jacobs School of Engineering, UCSD

Earth System Enterprise-Data Lives in Distributed Active Archive Centers (DAAC)
SEDAC (0.1 TB)Human Interactions in
Global Change
GES DAAC-GSFC (1334 TB)
Upper AtmosphereAtmospheric Dynamics, Ocean
Color, Global Biosphere, Hydrology, Radiance Data
ASDC-LaRC (340 TB)Radiation Budget,CloudsAerosols, Tropospheric
Chemistry
ORNL (1 TB)Biogeochemical
DynamicsEOS Land Validation
NSIDC (67 TB)Cryosphere
Polar Processes
LPDAAC-EDC (1143 TB)Land Processes
& Features
PODAAC-JPL (6 TB)Ocean Circulation
Air-Sea Interactions
ASF (256 TB)SAR Products
Sea IcePolar Processes
GHRC (4TB)Global
Hydrology
Challenge: How to Get Data Interactively to End Users Using New Technologies

Cumulative EOSDIS Archive Holdings--Adding Several TBs per Day
0
1,000
2,000
3,000
4,000
5,000
6,000
7,000
8,00020
01
2002
2003
2004
2005
2006
2007
2008
2009
2010
2011
2012
2013
2014
Calendar Year
Cu
mu
lati
ve T
era
Byt
es
Other EOSHIRDLSMLSTESOMIAMSR-EAIRS-isGMAOMOPITTASTERMISRV0 HoldingsMODIS-TMODIS-A
Other EOS =• ACRIMSAT• Meteor 3M• Midori II• ICESat• SORCE
file name: archive holdings_122204.xlstab: all instr bar
Terra EOMDec 2005
Aqua EOMMay 2008
Aura EOMJul 2010
NOTE: Data remains in the archive pending transition to LTA
Source: Glenn Iona, EOSDIS Element Evolution Technical Working Group January 6-7, 2005

Barrier: Average Throughput of NASA Data Products to End User is Only < 50 Megabits/s
Tested from GSFC-ICESATJanuary 2005
http://ensight.eos.nasa.gov/Missions/icesat/index.shtml

Landsat7 Imagery100 Foot Resolution
Draped on elevation data
High Resolution Aerial Photography Generates Images With 10,000 Times More Data than Landsat7
Shane DeGross, Telesis
USGSNew USGS Aerial ImageryAt 1-Foot Resolution
~10x10 square miles of 350 US Cities 2.5 Billion Pixel Images Per City!

Multi-Gigapixel Images are Available from Film Scanners Today
The Gigapxl Projecthttp://gigapxl.org
Balboa Park, San Diego

Large Image with Enormous DetailRequires Interactive Hundred Million Pixel Systems
http://gigapxl.org 1/1000th the Area of Previous Image

Increasing Accuracy in Hurricane Forecasts Real Time Diagnostics in GSFC of Ensemble Runs on ARC Project Columbia
Operational ForecastResolution of National Weather Service
Higher Resolution Research ForecastNASA Goddard Using Ames Altix
5.75 Day Forecast of Hurricane Isidore
Resolved Eye Wall
Intense Rain-
Bands
4x Resolution
Improvement
Source: Bill Putman, Bob Atlas, GFSC
How to Remove the InterCenter Networking Bottleneck?
Project Contacts: Ricky Rood, Bob Atlas, Horace Mitchell, GSFC; Chris Henze, ARC

From “Supercomputer–Centric” to “Supernetwork-Centric” Cyberinfrastructure
1.E+00
1.E+01
1.E+02
1.E+03
1.E+04
1.E+05
1.E+06
1985 1990 1995 2000 2005
Ba
nd
wid
th (
Mb
ps
)
Megabit/s
Gigabit/s
Terabit/s
Network Data Source: Timothy Lance, President, NYSERNet
32x10Gb “Lambdas”
1 GFLOP Cray2
60 TFLOP Altix
Bandwidth of NYSERNet Research Network Backbones
T1
Optical WAN Research Bandwidth Has Grown Much Faster Than
Supercomputer Speed!
Co
mp
utin
g S
peed
(G
FL
OP
S)

San Francisco Pittsburgh
Cleveland
National Lambda Rail (NLR) and TeraGrid Provides Researchers a Cyberinfrastructure Backbone
San Diego
Los Angeles
Portland
Seattle
Pensacola
Baton Rouge
HoustonSan Antonio
Las Cruces /El Paso
Phoenix
New York City
Washington, DC
Raleigh
Jacksonville
Dallas
Tulsa
Atlanta
Kansas City
Denver
Ogden/Salt Lake City
Boise
Albuquerque
UC-TeraGridUIC/NW-Starlight
Chicago
International Collaborators
NLR 4 x 10Gb Lambdas Initially Capable of 40 x 10Gb wavelengths at Buildout
NSF’s TeraGrid Has 4 x 10Gb Lambda Backbone
Links Two Dozen State and Regional Optical
Networks
DOE, NSF, & NASA
Using NLR

NASA Research and Engineering Network (NREN) Overview
• Next Steps
– 1 Gbps (JPL to ARC) Across CENIC (February 2005)
– 10 Gbps ARC, JPL & GSFC Across NLR (May 2005)
– StarLight Peering (May 2005)
– 10 Gbps LRC (Sep 2005)
• NREN Goal – Provide a Wide Area, High-speed Network for
Large Data Distribution and Real-time Interactive Applications
GSFCGSFCARCARC
StarLightStarLight
LRCLRC
GRCGRC
MSFCMSFCJPLJPL
NREN WAN
10 Gigabit EthernetOC-3 ATM (155 Mbps)
NREN Target: September 2005
– Provide Access to NASA Research & Engineering Communities - Primary Focus: Supporting Distributed Data Access to/from Project Columbia
• Sample Application: Estimating the Circulation and Climate of the Ocean (ECCO)
– ~78 Million Data Points
– 1/6 Degree Latitude-Longitude Grid
– Decadal Grids ~ 0.5 Terabytes / Day
– Sites: NASA JPL, MIT, NASA Ames
Source: Kevin Jones, Walter Brooks, ARC
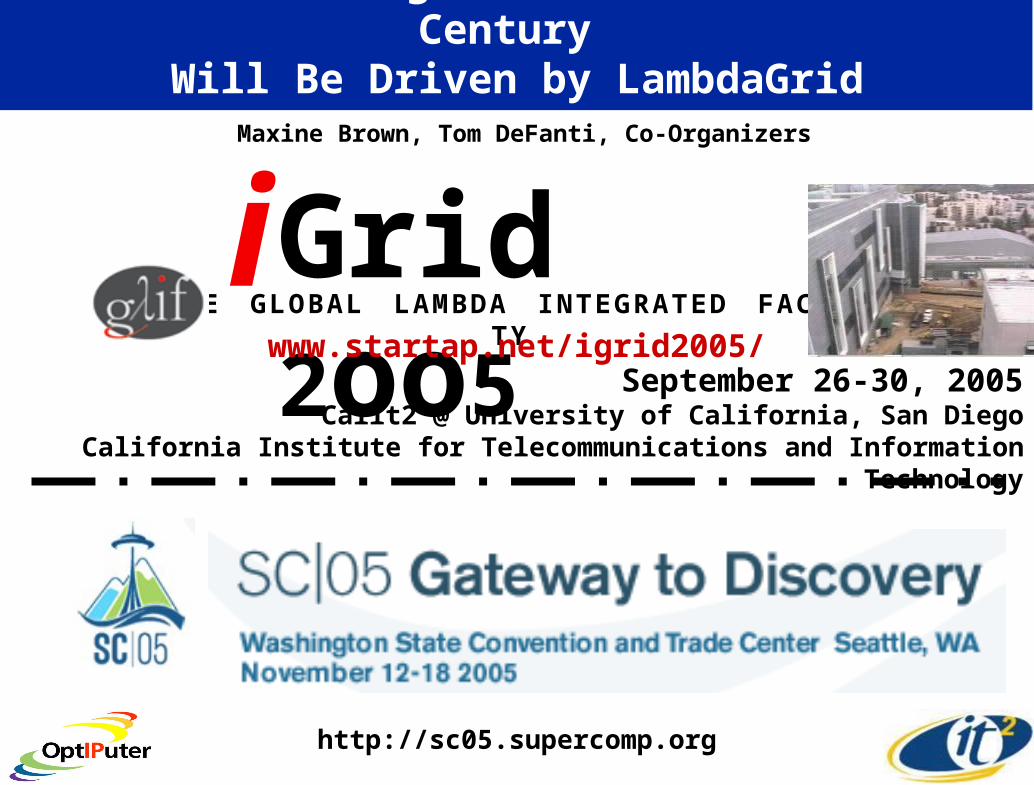
September 26-30, 2005Calit2 @ University of California, San Diego
California Institute for Telecommunications and Information Technology
The Networking Double Header of the Century Will Be Driven by LambdaGrid Applications
iGrid
2oo5T H E G L O B A L L A M B D A I N T E G R A T E D F A C I L I T Y
Maxine Brown, Tom DeFanti, Co-Organizers
www.startap.net/igrid2005/
http://sc05.supercomp.org

The International Lambda Fabric Being Assembled to Support iGrid Experiments
Source: Tom DeFanti, UIC & Calit2

Calit2 -- Research and Living Laboratorieson the Future of the Internet
www.calit2.net
UC San Diego & UC Irvine FacultyWorking in Multidisciplinary Teams
With Students, Industry, and the Community
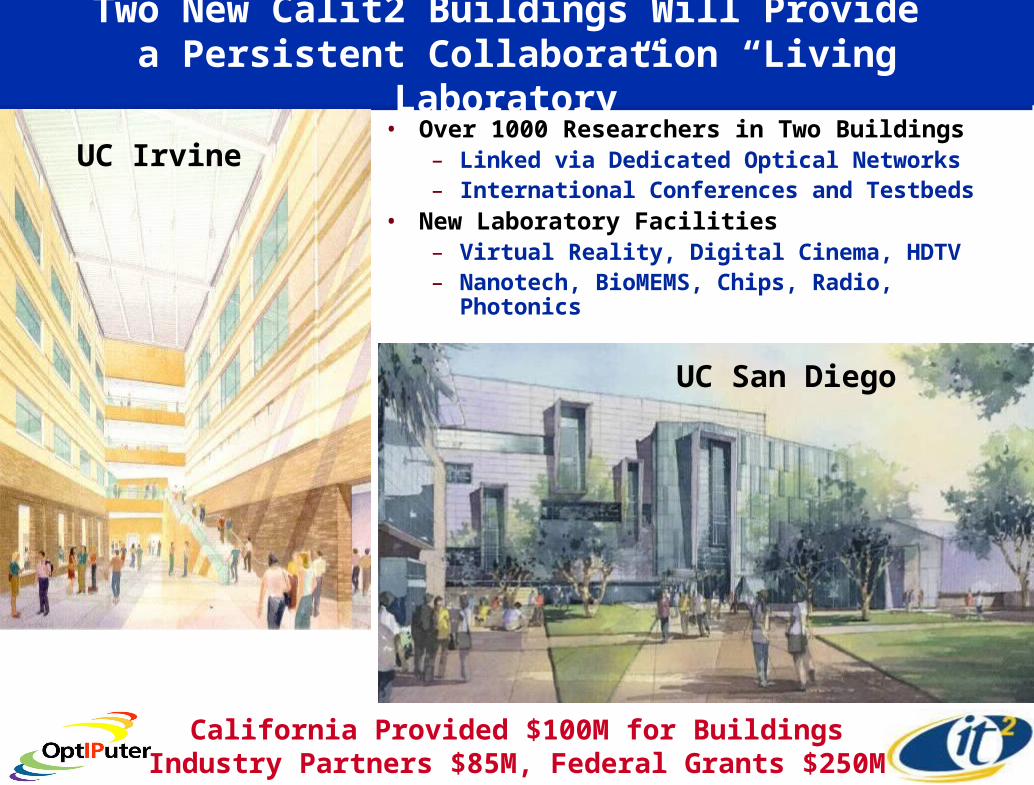
Two New Calit2 Buildings Will Provide a Persistent Collaboration “Living Laboratory”
• Over 1000 Researchers in Two Buildings– Linked via Dedicated Optical Networks– International Conferences and Testbeds
• New Laboratory Facilities– Virtual Reality, Digital Cinema, HDTV– Nanotech, BioMEMS, Chips, Radio, Photonics
Bioengineering
UC San Diego
UC Irvine
California Provided $100M for BuildingsIndustry Partners $85M, Federal Grants $250M

The Calit2@UCSD Building is Designed for Extremely High Bandwidth
1.8 Million Feet of Cat6 Ethernet Cabling
150 Fiber Strands to BuildingExperimental Roof Radio Antenna Farm
Building Radio Transparent Ubiquitous WiFiPhoto: Tim Beach,
Calit2
Over 9,000 Individual
10/100/1000 Mbps
Drops in the Building

Calit2 Collaboration Rooms Testbed UCI to UCSD
In 2005 Calit2 will Link Its Two Buildings
via CENIC-XD Dedicated Fiber over 75 Miles to Create a Distributed
Collaboration Laboratory
UC Irvine UC San Diego
UCI VizClass
UCSD NCMIR
Source: Falko Kuester, UCI & Mark Ellisman, UCSD

The OptIPuter Project – Creating a LambdaGrid “Web” for Gigabyte Data Objects
• NSF Large Information Technology Research Proposal– Calit2 (UCSD, UCI) and UIC Lead Campuses—Larry Smarr PI– Partnering Campuses: USC, SDSU, NW, TA&M, UvA, SARA, NASA
• Industrial Partners– IBM, Sun, Telcordia, Chiaro, Calient, Glimmerglass, Lucent
• $13.5 Million Over Five Years• Linking User’s Linux Clusters to Remote Science ResourcesNIH Biomedical Informatics NSF EarthScope
and ORION
http://ncmir.ucsd.edu/gallery.html
siovizcenter.ucsd.edu/library/gallery/shoot1/index.shtml
Research Network

Optical Networking, Internet Protocol, ComputerBringing the Power of Lambdas to Users
• Complete the Grid Paradigm by Extending Grid Middleware to Control Jitter-Free, Fixed Latency, Predictable Optical Circuits– One or Parallel Dedicated Light-Pipes
– 1 or 10 Gbps WAN Lambdas
– Uses Internet Protocol, But Does NOT Require TCP – Exploring Both Intelligent Routers and Passive Switches
• Tightly Couple to End User Clusters Optimized for Storage, Visualization, or Computing– Linux Clusters With 1 or 10 Gbps I/O per Node– Scalable Visualization Displays with OptIPuter Clusters
• Applications Drivers: – Earth and Ocean Sciences– Biomedical Imaging– Designed to Work with any Discipline Driver

Earth and Planetary Sciences: High Resolution Portals to Global Earth Sciences DataEVL Varrier Autostereo 3D Image USGS 30 MPixel Portable Tiled Display
SIO HIVE 3 MPixel Panoram
Schwehr. K., C. Nishimura, C.L. Johnson, D. Kilb, and A. Nayak, "Visualization Tools Facilitate Geological Investigations of Mars Exploration Rover Landing Sites",
IS&T/SPIE Electronic Imaging Proceedings, in press, 2005
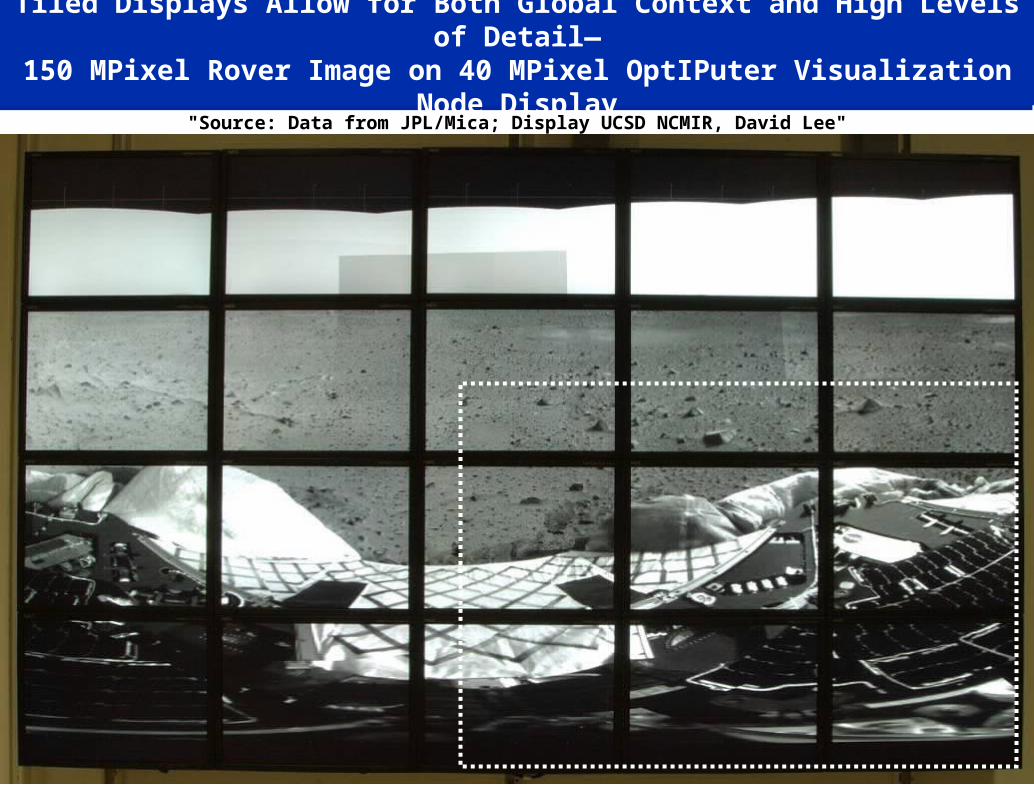
Tiled Displays Allow for Both Global Context and High Levels of Detail—150 MPixel Rover Image on 40 MPixel OptIPuter Visualization Node Display
"Source: Data from JPL/Mica; Display UCSD NCMIR, David Lee"

Interactively Zooming In Using UIC’s Electronic Visualization Lab’s JuxtaView Software
"Source: Data from JPL/Mica; Display UCSD NCMIR, David Lee"

Highest Resolution Zoom
"Source: Data from JPL/Mica; Display UCSD NCMIR, David Lee"

Toward an Interactive Gigapixel Display
• Scalable Adaptive Graphics Environment (SAGE) Controls:
• 100 Megapixels Display
– 55-Panel
• 1/4 TeraFLOP – Driven by 30-Node
Cluster of 64-bit Dual Opterons
• 1/3 Terabit/sec I/O– 30 x 10GE
interfaces– Linked to OptIPuter
• 1/8 TB RAM• 60 TB Disk
Source: Jason Leigh, Tom DeFanti, EVL@UICOptIPuter Co-PIs
NSF LambdaVision
MRI@UIC
Calit2 is Building a LambdaVision Wall in Each of the UCI & UCSD Buildings

OptIPuter Scalable Displays Have Been Extended to Apple-Based Systems “iWall Driven by iCluster”
Source: Atul Nayak, SIOCollaboration of
Calit2/SIO/OptIPuter/USArray
Source: Falko Kuester, Calit2@UCINSF Infrastructure Grant
See GEON Poster: iCluster : Visualizing USArray Data on a Scalable High Resolution Tiled Display Using the OptIPuter
16 Mpixels50 Mpixels
36 Mpixels100 Mpixels
Apple G5s
MacApple 30-inch Cinema HD Display

Personal GeoWall 2 (PG2): Individual OptIPuter User Node
Dual-output for stereo visualization (GeoWall)
LCD array for high-resolution display (7.7 Mpixels)
Single 64-bit PC
Demonstrated by EVL (UIC) at 4th GeoWall Consortium Meeting

SDSC/Calit2 Synthesis CenterYou Will Be Visiting This Week
Collaboration to RunExperiments
Collaboration to Set Up Experiments
Collaboration to StudyExperimental Results
Cyberinfrastructure for the
Geosciences
www.geongrid.org

The Synthesis Center is an Environment Designed for Collaboration with Remote Data Sets
• Environment With …– Large-scale, Wall-sized Displays – Links to On-Demand Cluster Computer Systems– Access to Networks of Databases and Digital Libraries– State-of-the-Art Data Analysis and Mining Tools
• Linked, “Smart” Conference Rooms Between SDSC and Calit2 Buildings on UCSD and UCI Campuses
• Coupled to OptIPuter Planetary Infrastructure
Currently in SDSC BuildingFuture Expansion into Calit2@UCSD Building

Campuses Must Provide Fiber Infrastructure to End-User Laboratories & Large Rotating Data StoresSIO Ocean Supercomputer
IBM Storage Cluster
2 Ten Gbps Campus Lambda Raceway
Streaming Microscope
Source: Phil Papadopoulos, SDSC, Calit2
UCSD Campus LambdaStore Architecture
Global LambdaGrid

UCSD
StarLight Chicago
UIC EVL
NU
CENIC San Diego GigaPOP
CalREN-XD
8
8
The OptIPuter LambdaGrid is Rapidly Expanding
NetherLight Amsterdam
U Amsterdam
NASA Ames
NASA GoddardNLRNLR
2
SDSU
CICESE
via CUDI
CENIC/Abilene Shared Network
1 GE Lambda
10 GE Lambda
PNWGP Seattle
CAVEwave/NLR
NASA JPL
ISI
UCI
CENIC Los Angeles
GigaPOP
22
Source: Greg Hidley, Aaron Chin, Calit2

Interactive Retrieval and Hyperwall Display of Earth Sciences Images Using NLR
Earth Science Data Sets Created by GSFC's Scientific Visualization Studio were Retrieved Across the NLR in Real Time from
OptIPuter servers in Chicago and San Diego and from GSFC Servers in McLean, VA, and Displayed at the SC2004 in Pittsburgh
Enables Scientists To Perform Coordinated Studies Of
Multiple Remote-Sensing Datasets
http://esdcd.gsfc.nasa.gov/LNetphoto3.html
Source: Milt Halem & Randall Jones, NASA GSFC& Maxine Brown, UIC EVL
Eric Sokolowsky

The GEONgrid: Building on the OptIPuter with NASA Goddard
Compute clusterPartner Projects
Chronos
CUAHSI
1TF cluster
Livermore
PoP node
Data Cluster Partner services
USGS
GeologicalSurvey ofCanada
ESRI
KGSNavdat
SCEC
www.geongrid.org
NASAOptIPuter
Rocky MountainTestbed
Mid-Atlantic CoastTestbed
Source: Chaitan Baru, SDSC

NLR GSFC/JPL/SIO Application: Integration of Laser and Radar Topographic Data with Land Cover Data
• Merge the 2 Data Sets, Using SRTM to Achieve Good Coverage & GLAS to Generate Calibrated Profiles
• Interpretation Requires Extracting Land Cover Information from Landsat, MODIS, ASTER, and Other Data Archived in Multiple DAACs
• Use of the OptIPuter over NLR and Local Data Mining and Sub-Setting Tools on NASA ECHO Data Pools will Permit Systematic Fusion Of Global Data Sets, Which are Not Possible with Current Bandwidth
33
SRTM Topography
ICESat – SRTM Elevations (m)
WUS L2B - MODIS (500m) VCF %Tree Cover vs. ICESat-SRTM Differences
0
0.1
0.2
0.3
0.4
0.5
0.6
0.7
0.8
0.9
1
-100 -80 -60 -40 -20 0 20 40 60 80 100
ICESat Centroid - 30m SRTM (m)
Nor
m. #
of
Occ
urre
nces 0-20% (11490)
20-40% (6294)40-60% (3657)60-80% (12503)80-100% (126)
0
0.1
0.2
0.3
0.4
0.5
0.6
0.7
0.8
0.9
1
-100 -80 -60 -40 -20 0 20 40 60 80 1000
0.1
0.2
0.3
0.4
0.5
0.6
0.7
0.8
0.9
1
0 10 20 30 40 50 60 70 80 90 100 110 120 130 140 150
0-20% (11490)20-40% (6294)40-60% (3657)60-80% (12503)80-100% (126)
% Tree Cover Classes
MODIS Vegetation Continuous Fields (Hansen et al., 2003)
% Tree Cover% Herbaceous Cover
% Bare Cover
ICESatElevation Profiles
0
3000
meters
Elevation DifferenceHistograms as Function
of % Tree Cover
http://icesat.gsfc.nasa.govhttp://www2.jpl.nasa.gov/srtm
http://glcf.umiacs.umd.edu/data/modis/vcf
Geoscience Laser Altimeter System
(GLAS)
Shuttle Radar Topography
Mission
Key Contacts: H.K. Ramapriyan, R. Pfister, C. Carabajal, C. Lynn, D. Harding, M. Seablom, P. Gary GSFC; T. Yunck, JPL; B. Minster, SIO; L. Smarr, UCSD, S. Graves, UTA

NSF’s Ocean Observatories Initiative (OOI)Envisions Global, Regional, and Coastal Scales
LEO15 Inset Courtesy of Rutgers University, Institute of Marine and Coastal Sciences

LOOKING: (Laboratory for the Ocean Observatory
Knowledge Integration Grid)
Adding Web and Grid Services to Lambdas to Provide Real Time Control of Ocean Observatories
• Goal: – Prototype Cyberinfrastructure for NSF’s
Ocean Research Interactive Observatory Networks (ORION)
• LOOKING NSF ITR with PIs:– John Orcutt & Larry Smarr - UCSD– John Delaney & Ed Lazowska –UW– Mark Abbott – OSU
• Collaborators at:– MBARI, WHOI, NCSA, UIC, CalPoly,
UVic, CANARIE, Microsoft, NEPTUNE-Canarie
www.neptune.washington.edu
http://lookingtosea.ucsd.edu/

Looking High Level LOOKING Service System Architecture

Use OptIPuter to Couple Data Assimilation Models to Remote Data Sources and Analysis
Regional Ocean Modeling System (ROMS) http://ourocean.jpl.nasa.gov/

MARS Cable Observatory Testbed – LOOKING Living Laboratory
Tele-Operated Crawlers
Central Lander
MARS Installation Oct 2005 -Jan 2006
Source: Jim
Bellingham, MBARI
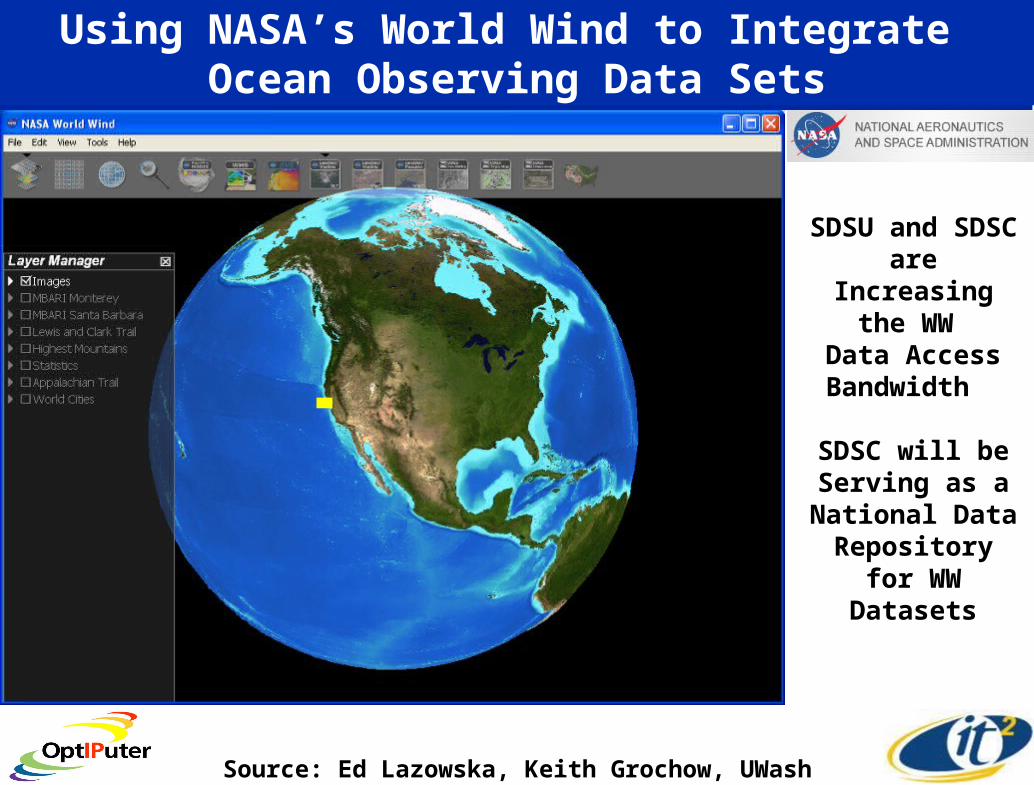
Using NASA’s World Wind to Integrate Ocean Observing Data Sets
Source: Ed Lazowska, Keith Grochow, UWash
SDSU and SDSC are Increasing
the WW Data AccessBandwidth
SDSC will beServing as a National Data Repository for WW Datasets
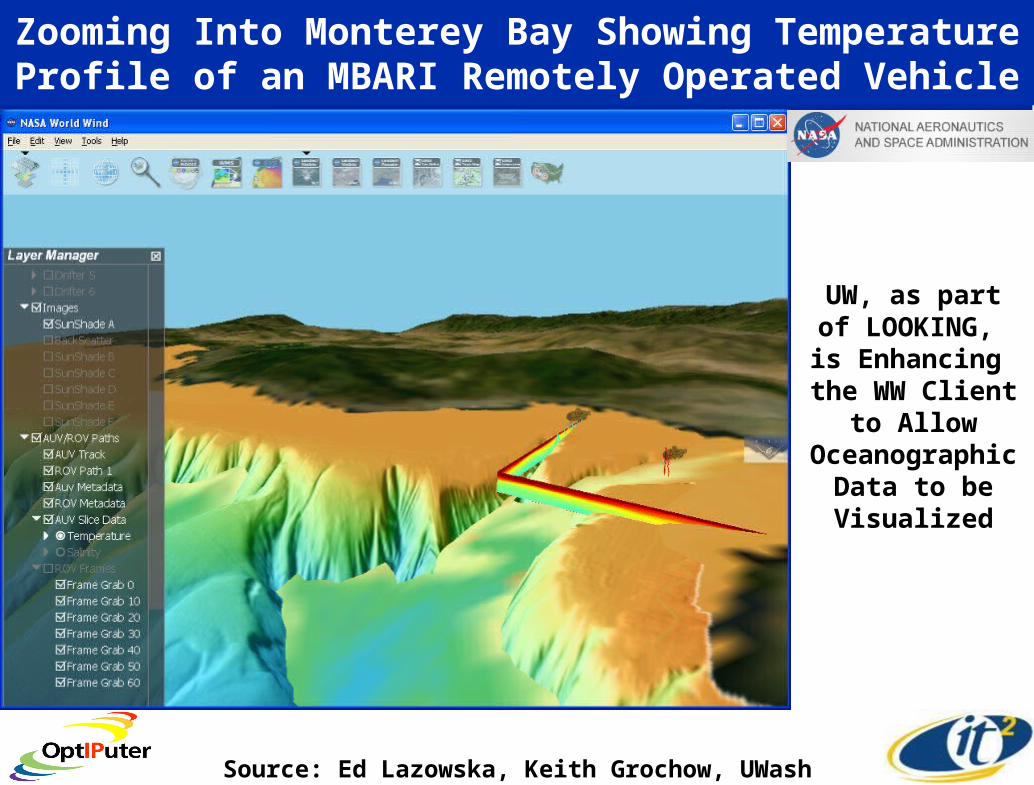
Zooming Into Monterey Bay Showing Temperature Profile of an MBARI Remotely Operated Vehicle
UW, as part of LOOKING,
is Enhancing the WW Client
to AllowOceanographic
Data to be Visualized
Source: Ed Lazowska, Keith Grochow, UWash

Proposed Experiment for iGrid 2005 –Remote Interactive HD Imaging of Deep Sea Vent
Source John Delaney & Deborah Kelley, UWash
To Starlight, TRECC,
and ACCESS