Embed Size (px)
Citation preview

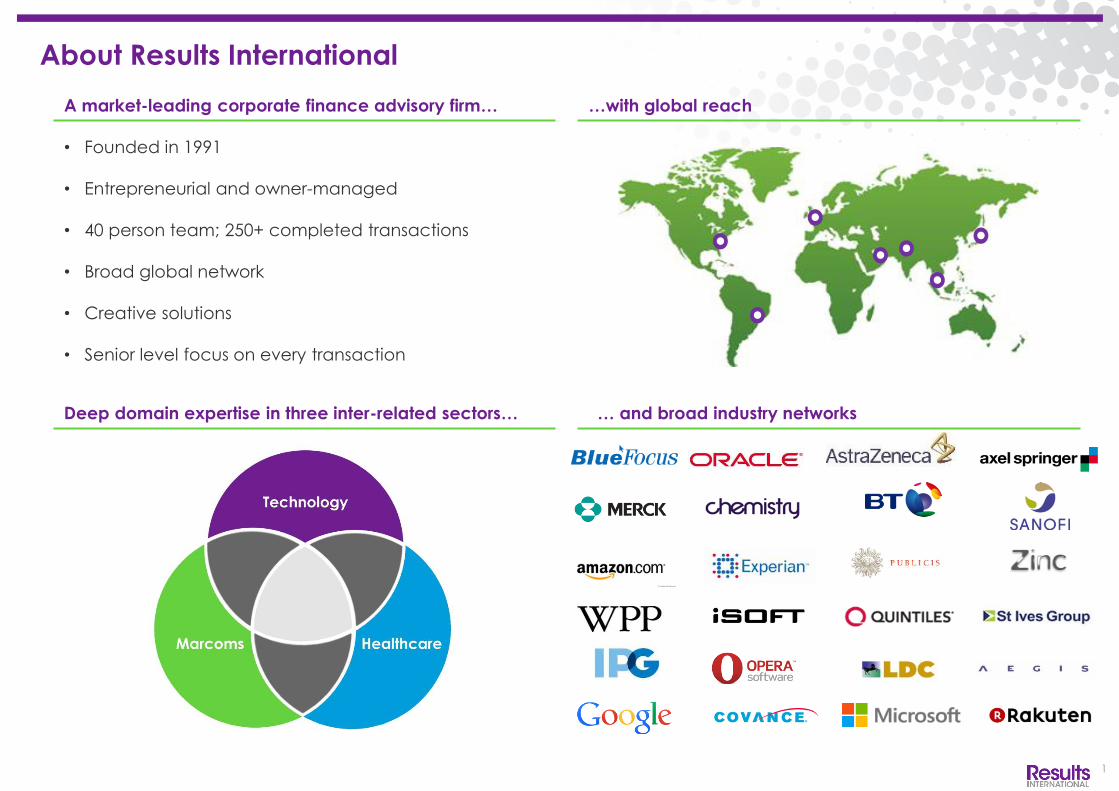
Deep domain expertise in three inter-related sectors… … and broad industry networks
A market-leading corporate finance advisory firm…
• Founded in 1991
• Entrepreneurial and owner-managed
• 40 person team; 250+ completed transactions
• Broad global network
• Creative solutions
• Senior level focus on every transaction
…with global reach
1
About Results International

40
60
80
100
120
140
160
180
200
220
Mar 14 Apr 14 May 14 Jun 14 Jul 14 Aug 14 Sep 14 Oct 14 Nov 14 Dec 14 Jan 15 Feb 15 Mar 15
Broadline Endpoint Network Data Monitoring & Analysis Global Security NASDAQ Comp
Results International Global Cyber Security Indices
Note: Based on share prices as at 31st March 2015 Note: Indices weighted by market capitalisation Sources: Capital IQ and Results analysis 2
36.3%
18.9% 16.7%
45.3%
14.5%
(23.5%)
14.6%
Q1 2015 Performance
Broadline (4.1%)
Endpoint 16.1%
Network 5.2%
Data 17.5%
Monitoring & Analysis 16.0%
Global Security 4.6%

Cyber Security: Share Price Performance
Note: Share price performance as at 31st March 2015 Sources: Capital IQ and Results analysis
3
Broadline Endpoint Network Data
Monitoring & Analysis
Q1
-20
15
Last
12
Mo
nth
s
(8.9%)
18.6%
9.7%
40.2%
19.6%
(7.0%)
7.3% 4.3%
(27.4%)
14.0%
(11.9%)
19.2%
(5.0%)
7.5%
24.3%
(13.6%)
22.8%
(25.4%)
23.1%
(40.0%)
(30.0%)
(20.0%)
(10.0%)
0.0%
10.0%
20.0%
30.0%
40.0%
50.0%
17.0% 23.9%
3.3% n.a.
12.1%
n.a.
13.3% 21.2%
(32.8%)
58.6%
7.8%
112.9%
18.3%
(6.6%)
(36.3%)
(23.3%)
59.7%
(51.1%)
82.8%
(60.0%)
(40.0%)
(20.0%)
0.0%
20.0%
40.0%
60.0%
80.0%
100.0%
120.0%
140.0%

Company IPO
Date Description Raised
Indicative Price
Range ($)
IPO Price
($)
Increase vs.
range
Day 1
Increase
Current
Increase(1)
Current
EV
EV / Revenue
2015E
EV / EBITDA
2015E
Sep-14 Privileged account
security 86 13.00-15.00 16.00 14.3% 87.1% 247.3% 1,764 13.3 x n.m.
Jun-14 Mobile security and
management 100 8.00-10.00 9.00 0.0% 22.4% 2.9% 683 4.0 x n.m.
Nov-13 Network security and
data storage 64 18.00-21.00 18.00 (7.7%) 19.7% 113.7% 1,976 6.2 x 27.4 x
Sep-13 Forensics and malware protection
304 15.00-17.00 20.00 25.0% 80.0% 96.3% 6,267 10.1 x n.m.
Sep-12 Cloud security and
compliance 91 11.00-13.00 12.00 0.0% 18.0% 287.3% 1,704 10.1 x 39.5 x
Jul-12 Firewalls and network
security 260 38.00-40.00 42.00 7.7% 26.5% 247.8% 12,596 12.6 x n.m.
Apr-12 Communication
security 82 10.00-12.00 13.00 18.2% 8.3% 355.5% 2,511 10.1 x n.m.
Feb-12 Antivirus and anti-
spyware 128 16.00-18.00 16.00 (5.9%) (18.8%) 35.3% 1,243 3.0 x 8.1 x
Nov-11 Data centre security 90 14.00-16.00 18.00 20.0% 33.3% 137.2% 1,187 6.0 x n.m.
Cyber Security: Recent IPO Performances
4
Note: Calendarised to December year end; $ millions, except share price data; Multiples capped at 20x EV / Revenue and 50x EV / EBITDA Note: (1) Current increase from IPO price; Market data as of 31st March 2015 Source: Capital IQ
Nasdaq
Nasdaq
Nasdaq
Nasdaq
NYSE
NYSE
NYSE
NYSE
Nasdaq

Cyber Security: Valuation Benchmarks
5
EBITDA Margin 2015E EV / EBITDA 2015E
Revenue Growth (2015-16E) EV / Revenue 2015E
Note: EV = Enterprise Value; Financials calendarised to December year end
Note: Median values reported; excludes negative multiples
Note: See Selected Publicly Traded Companies (Slide 9) for details of companies included in each category
Source: Capital IQ
1.9%
16.9%
13.5%
25.4%
14.7% 15.6%
0.0%
5.0%
10.0%
15.0%
20.0%
25.0%
30.0%
Broadline Endpoint Network Data Monitoring &
Analysis
Global
Security
34.7%
18.7% 20.7%
(9.2%)
13.6%
19.1%
(15.0%)
(10.0%)
(5.0%)
0.0%
5.0%
10.0%
15.0%
20.0%
25.0%
30.0%
35.0%
40.0%
Broadline Endpoint Network Data Monitoring &
Analysis
Global
Security
2.7 x 3.5 x
4.6 x
10.1 x
5.7 x
4.0 x
0.0 x
2.0 x
4.0 x
6.0 x
8.0 x
10.0 x
12.0 x
Broadline Endpoint Network Data Monitoring &
Analysis
Global
Security
7.8 x 8.6 x
15.1 x
n.m.
39.5 x
11.6 x
0.0 x
5.0 x
10.0 x
15.0 x
20.0 x
25.0 x
30.0 x
35.0 x
40.0 x
45.0 x
Broadline Endpoint Network Data Monitoring &
Analysis
Global
Security

Cyber Security: Global M&A Activity
6 Sources: Press Releases, Capital IQ, Mergermarket and Results analysis
26 26 26 27
23 23
32
24
15
31
25
22
32
28 28
22
34
0
500
1,000
1,500
2,000
2,500
3,000
3,500
0
5
10
15
20
25
30
35
40
Q1 2011 Q2 2011 Q3 2011 Q4 2011 Q1 2012 Q2 2012 Q3 2012 Q4 2012 Q1 2013 Q2 2013 Q3 2013 Q4 2013 Q1 2014 Q2 2014 Q3 2014 Q4 2014 Q1 2015
Tota
l D
isc
lose
d D
ea
l V
alu
e (
$m
)
Nu
mb
er
of D
ea
ls
Number of Deals Total Disclosed Deal Value
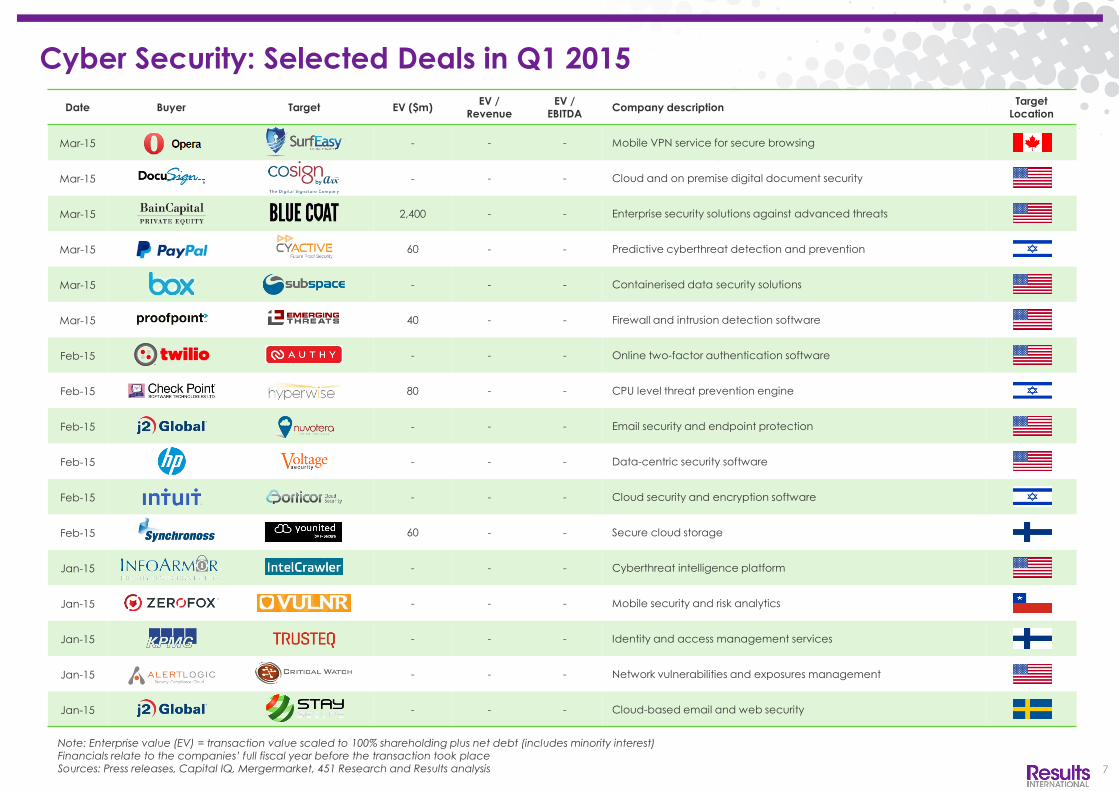
Cyber Security: Selected Deals in Q1 2015
Date Buyer Target EV ($m) EV /
Revenue EV /
EBITDA Company description
Target Location
Mar-15 - - - Mobile VPN service for secure browsing
Mar-15 - - - Cloud and on premise digital document security
Mar-15 2,400 - - Enterprise security solutions against advanced threats
Mar-15 60 - - Predictive cyberthreat detection and prevention
Mar-15 - - - Containerised data security solutions
Mar-15 40 - - Firewall and intrusion detection software
Feb-15 - - - Online two-factor authentication software
Feb-15 80 - - CPU level threat prevention engine
Feb-15 - - - Email security and endpoint protection
Feb-15 - - - Data-centric security software
Feb-15 - - - Cloud security and encryption software
Feb-15 60 - - Secure cloud storage
Jan-15 - - - Cyberthreat intelligence platform
Jan-15 - - - Mobile security and risk analytics
Jan-15 - - - Identity and access management services
Jan-15 - - - Network vulnerabilities and exposures management
Jan-15 - - - Cloud-based email and web security
7
Note: Enterprise value (EV) = transaction value scaled to 100% shareholding plus net debt (includes minority interest) Financials relate to the companies’ full fiscal year before the transaction took place Sources: Press releases, Capital IQ, Mergermarket, 451 Research and Results analysis

Cyber Security: Selected Fundraisings in Q1 2015
Date Company Type of round Funds
raised ($m) Investor participation Company description
Company headquarters
Mar-15 Venture 52.0 Andreessen Horowitz Enterprise security and systems management
Mar-15 Series A 18.0 Hoxton Ventures, Talis Capital, Invoke Capital Partners Behavioural cyber defence technology
Mar-15 Series A 6.0 Costanoa Venture Capital, Rally Ventures, Paladin Capital Group, Blackbird Ventures
Crowdsourced security testing platform
Mar-15 Series B 30.0 Third Point Ventures, Mayfield Fund, Telstra, Pelion Ventures Cloud application security services
Mar-15 Series A 8.0 USVP, Plus Capital, Double M Capital, Core Ventures Group, Inventures Group
Application security solutions
Mar-15 Series A 9.8 March Capital Partners, Allegis Capital, The Hive Cybersecurity analytics
Mar-15 Series A 1.7 Inventures Group, Paua Ventures Web application security analytics
Feb-15 Series B 12.0 Telstra Ventures, TOYO Corporation, Sierra Ventures, Samsung Ventures Mobile threat defence
Mar-15 Venture 19.0 Blue Sky Capital, Rogers Venture Partners Identity and authentication solutions
Feb-15 Series B 25.0 GGV Capital, Icon Ventures, Kleiner Perkins Caulfield & Byers, Google Ventures, Greylock Partners, Allegis Capital
Crowd security intelligence platform
Feb-15 Venture 8.0 Strom Ventures, Passion Capital, TenEleven Ventures Cyberthreat intelligence
Feb-15 Series A 18.0 Alcatel-Lucent, Cisco Investments, Marker, Bessemer Venture Partners, Innovation Endeavors
Cybersecurity research lab
Feb-15 Venture 15.0 83North Venture Capital, Bessemer Venture Partners Secure mobile gateway and threat prevention
Jan-15 Series B 15.0 Sequoia Capital, Index Ventures, EMC, Zohar Zisapel User activity auditing and threat protection
Jan-15 Series C 14.1 DRW Ventures, Icon Ventures, Leapfrog Ventures, Math Venture Partners, OVP Venture Partners, Pallasite Ventures, Tyco, Venrock
Security risk management solutions
Jan-15 Series B 8.0 Harmony Partners, New Science Ventures, .406 Ventures Cloud data encryption platform
Jan-15 Series C 40.1 Jafco Ventures, TechOperators, Google Ventures, Meritech Capital, KPCB
Data security platform
8
Sources: VentureSource, Capital IQ and Results analysis
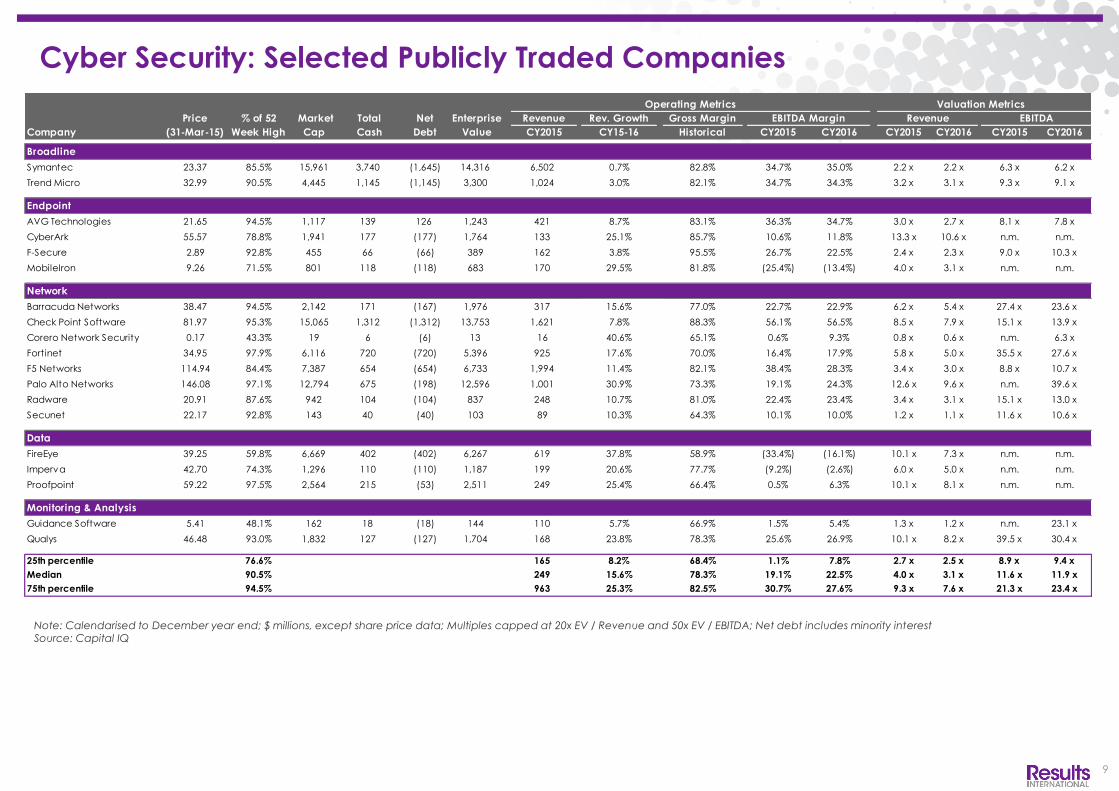
Price % of 52 Market Total Net Enterprise Revenue Rev. Growth Gross Margin EBITDA Margin
Company (31-Mar-15) Week High Cap Cash Debt Value CY2015 CY15-16 Historical CY2015 CY2016 CY2015 CY2016 CY2015 CY2016
Broadline
Symantec 23.37 85.5% 15,961 3,740 (1,645) 14,316 6,502 0.7% 82.8% 34.7% 35.0% 2.2 x 2.2 x 6.3 x 6.2 x
Trend Micro 32.99 90.5% 4,445 1,145 (1,145) 3,300 1,024 3.0% 82.1% 34.7% 34.3% 3.2 x 3.1 x 9.3 x 9.1 x
Endpoint
AVG Technologies 21.65 94.5% 1,117 139 126 1,243 421 8.7% 83.1% 36.3% 34.7% 3.0 x 2.7 x 8.1 x 7.8 x
CyberArk 55.57 78.8% 1,941 177 (177) 1,764 133 25.1% 85.7% 10.6% 11.8% 13.3 x 10.6 x n.m. n.m.
F-Secure 2.89 92.8% 455 66 (66) 389 162 3.8% 95.5% 26.7% 22.5% 2.4 x 2.3 x 9.0 x 10.3 x
MobileIron 9.26 71.5% 801 118 (118) 683 170 29.5% 81.8% (25.4%) (13.4%) 4.0 x 3.1 x n.m. n.m.
Network
Barracuda Networks 38.47 94.5% 2,142 171 (167) 1,976 317 15.6% 77.0% 22.7% 22.9% 6.2 x 5.4 x 27.4 x 23.6 x
Check Point Software 81.97 95.3% 15,065 1,312 (1,312) 13,753 1,621 7.8% 88.3% 56.1% 56.5% 8.5 x 7.9 x 15.1 x 13.9 x
Corero Network Security 0.17 43.3% 19 6 (6) 13 16 40.6% 65.1% 0.6% 9.3% 0.8 x 0.6 x n.m. 6.3 x
Fortinet 34.95 97.9% 6,116 720 (720) 5,396 925 17.6% 70.0% 16.4% 17.9% 5.8 x 5.0 x 35.5 x 27.6 x
F5 Networks 114.94 84.4% 7,387 654 (654) 6,733 1,994 11.4% 82.1% 38.4% 28.3% 3.4 x 3.0 x 8.8 x 10.7 x
Palo Alto Networks 146.08 97.1% 12,794 675 (198) 12,596 1,001 30.9% 73.3% 19.1% 24.3% 12.6 x 9.6 x n.m. 39.6 x
Radware 20.91 87.6% 942 104 (104) 837 248 10.7% 81.0% 22.4% 23.4% 3.4 x 3.1 x 15.1 x 13.0 x
Secunet 22.17 92.8% 143 40 (40) 103 89 10.3% 64.3% 10.1% 10.0% 1.2 x 1.1 x 11.6 x 10.6 x
Data
FireEye 39.25 59.8% 6,669 402 (402) 6,267 619 37.8% 58.9% (33.4%) (16.1%) 10.1 x 7.3 x n.m. n.m.
Imperva 42.70 74.3% 1,296 110 (110) 1,187 199 20.6% 77.7% (9.2%) (2.6%) 6.0 x 5.0 x n.m. n.m.
Proofpoint 59.22 97.5% 2,564 215 (53) 2,511 249 25.4% 66.4% 0.5% 6.3% 10.1 x 8.1 x n.m. n.m.
Monitoring & Analysis
Guidance Software 5.41 48.1% 162 18 (18) 144 110 5.7% 66.9% 1.5% 5.4% 1.3 x 1.2 x n.m. 23.1 x
Qualys 46.48 93.0% 1,832 127 (127) 1,704 168 23.8% 78.3% 25.6% 26.9% 10.1 x 8.2 x 39.5 x 30.4 x
25th percentile 76.6% 165 8.2% 68.4% 1.1% 7.8% 2.7 x 2.5 x 8.9 x 9.4 x
Median 90.5% 249 15.6% 78.3% 19.1% 22.5% 4.0 x 3.1 x 11.6 x 11.9 x
75th percentile 94.5% 963 25.3% 82.5% 30.7% 27.6% 9.3 x 7.6 x 21.3 x 23.4 x
Operating Metrics Valuation Metrics
Revenue EBITDA
Cyber Security: Selected Publicly Traded Companies
9
Note: Calendarised to December year end; $ millions, except share price data; Multiples capped at 20x EV / Revenue and 50x EV / EBITDA; Net debt includes minority interest Source: Capital IQ

27 Soho Square, London, W1D 3AY
t +44 20 7629 7575 | f +44 20 7629 2233
www.resultsig.com
Chris Lewis
Managing Director
Di: +44 (0) 20 7514 8236
10
Mark Williams
Director
Di: +44 (0) 20 7514 8242
Disclaimer:
This document has been produced by Results International Group LLP (“Results”) and is furnished to you solely for your information and may not be reproduced or redistributed, in whole or in part, to any other person. No representation or warranty (expressed or implied) is made as to, and no reliance should be placed on, the fairness, accuracy or completeness of the information contained herein and, accordingly, none of Results’ officers or employees accepts any liability whatsoever arising directly or indirectly from the use of this document.
Authorised and regulated by the Financial Conduct Authority.
Contact Us
588 Broadway, Suite 1010, New York, NY 10012
t +1 646 747 6500
www.resultsig.com
Pierre-Georges Roy
Partner
Di: +1 646 747 6505
Maurice Watkins
Partner
Di: +1 646 747 6500