Embed Size (px)
Citation preview
SOLARWINDS STATE OF GOVERNMENT IT MANAGEMENT AND MONITORING SURVEY SUMMARY REPORT | MARKET CONNECTIONS, INC. | 703.378.2025 © 2015© 2015 SOLARWINDS WORLDWIDE, LLC. ALL RIGHTS RESERVED
SolarWinds State of Government IT Management and Monitoring Survey Summary Report2015
.SOLARWINDS STATE OF GOVERNMENT IT MANAGEMENT AND MONITORING SURVEY SUMMARY REPORT | MARKET CONNECTIONS, INC. | 703.378.2025 © 2015
© 2015 SOLARWINDS WORLDWIDE, LLC. ALL RIGHTS RESERVED
2
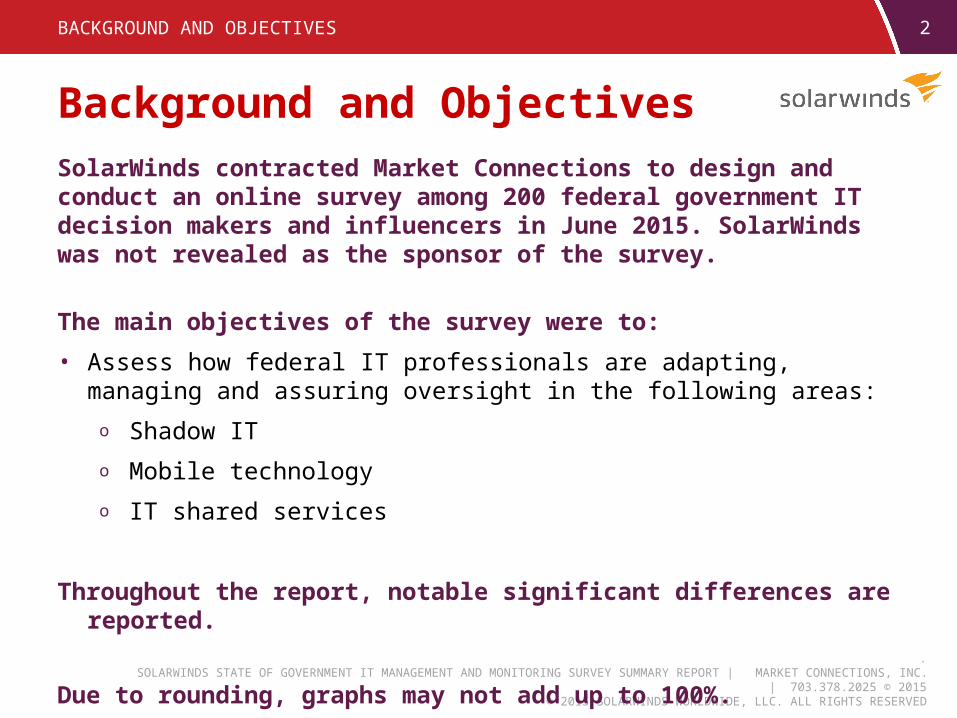
SolarWinds contracted Market Connections to design and conduct an online survey among 200 federal government IT decision makers and influencers in June 2015. SolarWinds was not revealed as the sponsor of the survey.
The main objectives of the survey were to:
• Assess how federal IT professionals are adapting, managing and assuring oversight in the following areas:o Shadow ITo Mobile technologyo IT shared services
Throughout the report, notable significant differences are reported.
Due to rounding, graphs may not add up to 100%.
BACKGROUND AND OBJECTIVES
Background and Objectives
.SOLARWINDS STATE OF GOVERNMENT IT MANAGEMENT AND MONITORING SURVEY SUMMARY REPORT | MARKET CONNECTIONS, INC. | 703.378.2025 © 2015
© 2015 SOLARWINDS WORLDWIDE, LLC. ALL RIGHTS RESERVED
3
Organizations Represented
RESPONDENT CLASSIFICATIONS
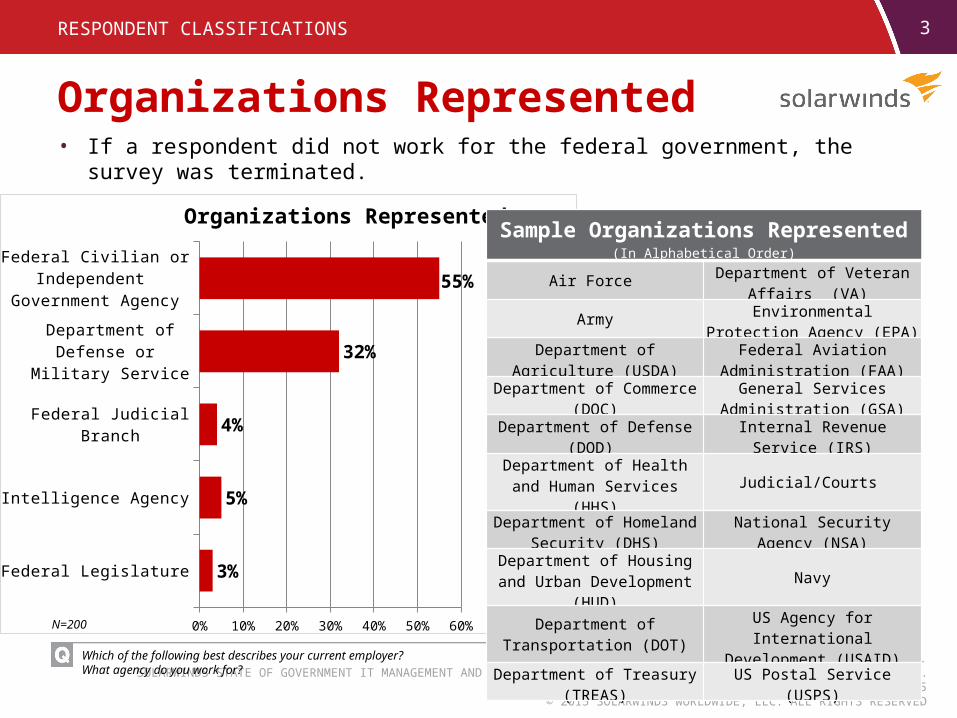
• If a respondent did not work for the federal government, the survey was terminated.
Which of the following best describes your current employer?What agency do you work for?
Federal Legislature
Intelligence Agency
Federal Judicial Branch
Department of Defense or Military Service
Federal Civilian or Independent Government Agency
0% 10% 20% 30% 40% 50% 60%
3%
5%
4%
32%
55%
Organizations RepresentedSample Organizations Represented
(In Alphabetical Order)
Air Force Department of Veteran Affairs (VA)
Army Environmental Protection Agency (EPA)
Department of Agriculture (USDA) Federal Aviation Administration (FAA)
Department of Commerce (DOC) General Services Administration (GSA)
Department of Defense (DOD) Internal Revenue Service (IRS)
Department of Health and Human Services (HHS) Judicial/Courts
Department of Homeland Security (DHS) National Security Agency (NSA)
Department of Housing and Urban Development (HUD) Navy
Department of Transportation (DOT)
US Agency for International Development (USAID)
Department of Treasury (TREAS) US Postal Service (USPS)N=200
.SOLARWINDS STATE OF GOVERNMENT IT MANAGEMENT AND MONITORING SURVEY SUMMARY REPORT | MARKET CONNECTIONS, INC. | 703.378.2025 © 2015
© 2015 SOLARWINDS WORLDWIDE, LLC. ALL RIGHTS RESERVED
4
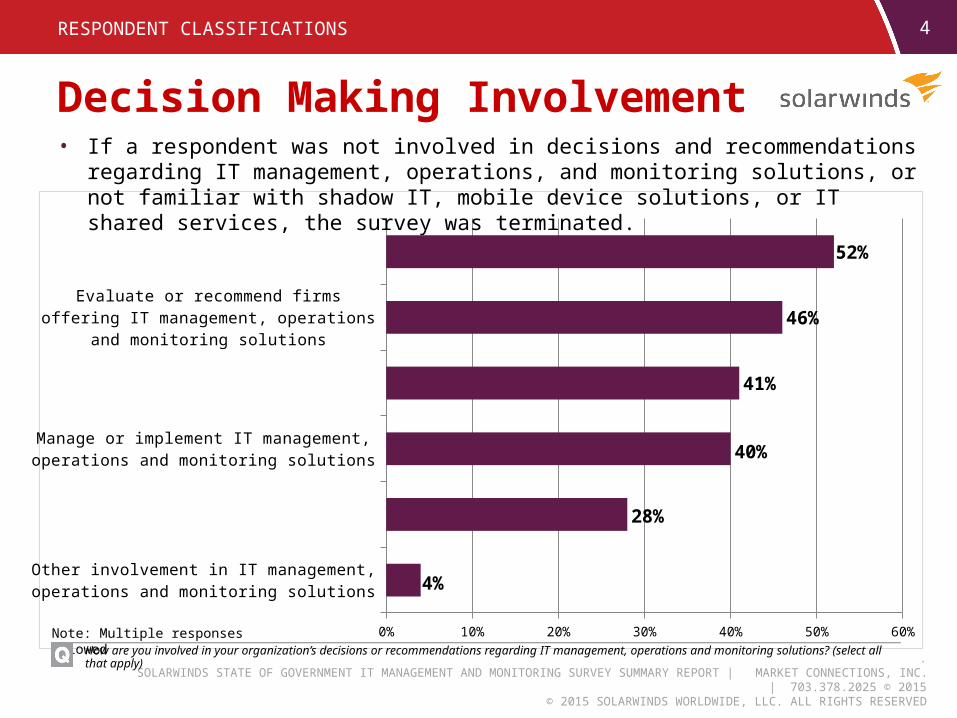
Other involvement in IT management, operations and monitoring solutions
Make the final decision regarding IT management, operations and monitoring solutions
Manage or implement IT management, operations and monitoring solutions
Develop technical requirements for IT management, operations and monitoring solutions
Evaluate or recommend firms offering IT management, operations and monitoring solutions
On a team that makes decisions IT management, operations and monitoring solutions
0% 10% 20% 30% 40% 50% 60%
4%
28%
40%
41%
46%
52%
RESPONDENT CLASSIFICATIONS
How are you involved in your organization’s decisions or recommendations regarding IT management, operations and monitoring solutions? (select all that apply)
Note: Multiple responses allowed
Decision Making Involvement• If a respondent was not involved in decisions and recommendations regarding IT management,
operations, and monitoring solutions, or not familiar with shadow IT, mobile device solutions, or IT shared services, the survey was terminated.
.SOLARWINDS STATE OF GOVERNMENT IT MANAGEMENT AND MONITORING SURVEY SUMMARY REPORT | MARKET CONNECTIONS, INC. | 703.378.2025 © 2015
© 2015 SOLARWINDS WORLDWIDE, LLC. ALL RIGHTS RESERVED
5
Technologies and Tenure
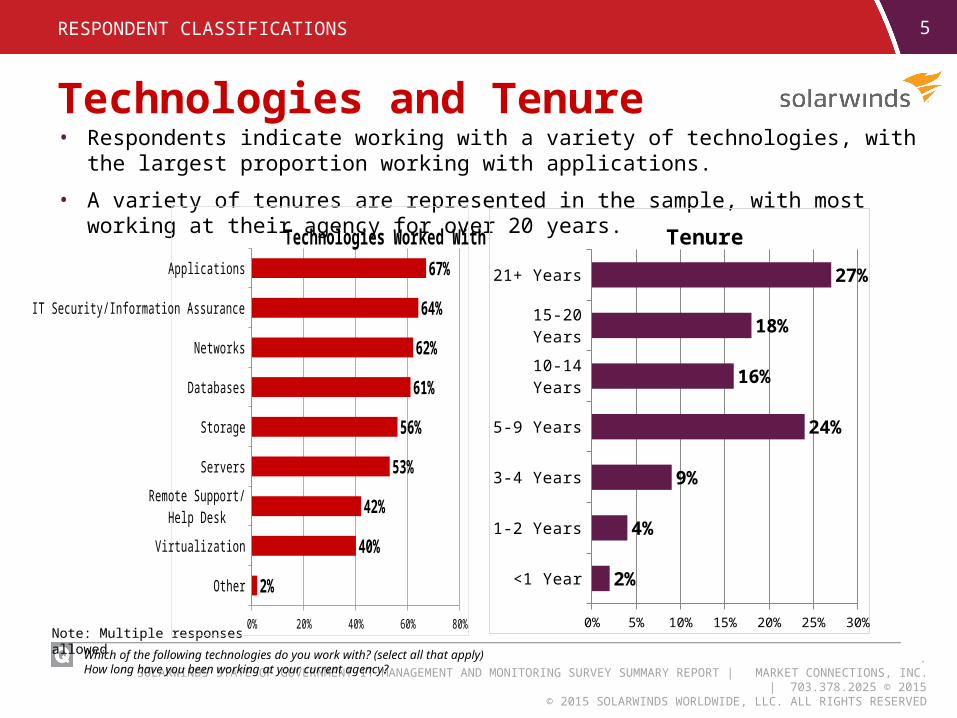
Which of the following technologies do you work with? (select all that apply)How long have you been working at your current agency?
RESPONDENT CLASSIFICATIONS
• Respondents indicate working with a variety of technologies, with the largest proportion working with applications.
• A variety of tenures are represented in the sample, with most working at their agency for over 20 years.
Note: Multiple responses allowed
Other
Virtualization
Remote Support/Help Desk
Servers
Storage
Databases
Networks
IT Security/Information Assurance
Applications
0% 20% 40% 60% 80%
2%
40%
42%
53%
56%
61%
62%
64%
67%
Technologies Worked With
<1 Year
1-2 Years
3-4 Years
5-9 Years
10-14 Years
15-20 Years
21+ Years
0% 5% 10% 15% 20% 25% 30%
2%
4%
9%
24%
16%
18%
27%
Tenure
.SOLARWINDS STATE OF GOVERNMENT IT MANAGEMENT AND MONITORING SURVEY SUMMARY REPORT | MARKET CONNECTIONS, INC. | 703.378.2025 © 2015
© 2015 SOLARWINDS WORLDWIDE, LLC. ALL RIGHTS RESERVED
6
None of the above
Storage solutions to accommodate data growth
Virtualization of servers
Application performance management
Disaster recovery and continuity planning
IT shared services
Data center consolidation
Mobile device management
Network consolidation and/or modernization
VoIP rollout or improvement
Private cloud computing
Cyber-security/IT security
Shadow IT
Public cloud computing
0% 5% 10% 15% 20% 25% 30% 35% 40% 45%
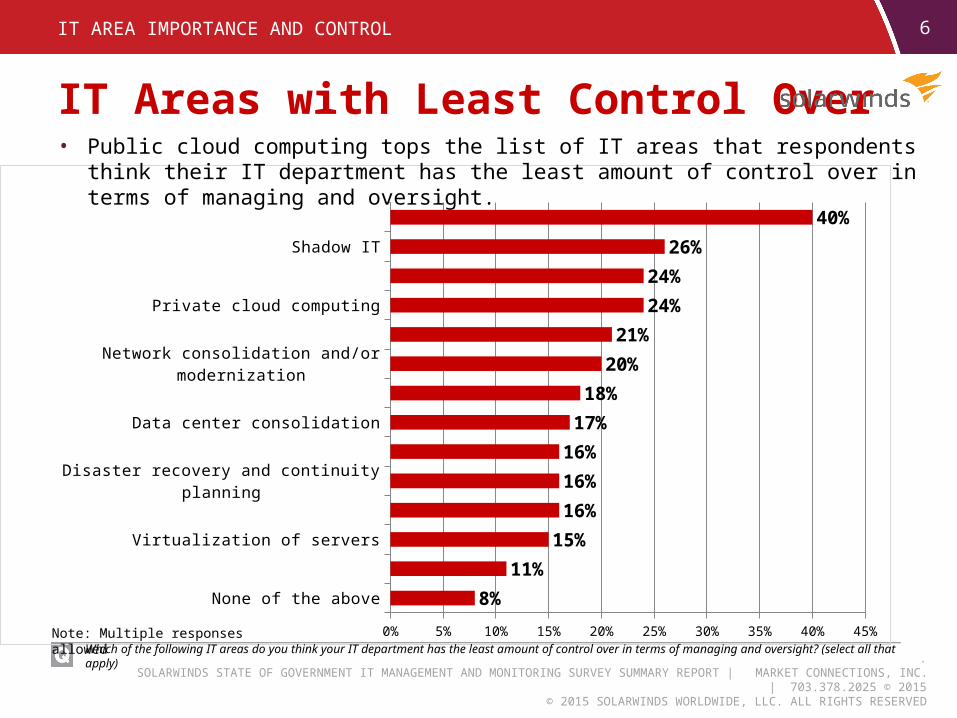
8%
11%
15%
16%
16%
16%
17%
18%
20%
21%
24%
24%
26%
40%
IT Areas with Least Control Over
IT AREA IMPORTANCE AND CONTROL
Which of the following IT areas do you think your IT department has the least amount of control over in terms of managing and oversight? (select all that apply)
• Public cloud computing tops the list of IT areas that respondents think their IT department has the least amount of control over in terms of managing and oversight.
Note: Multiple responses allowed
.SOLARWINDS STATE OF GOVERNMENT IT MANAGEMENT AND MONITORING SURVEY SUMMARY REPORT | MARKET CONNECTIONS, INC. | 703.378.2025 © 2015
© 2015 SOLARWINDS WORLDWIDE, LLC. ALL RIGHTS RESERVED
7
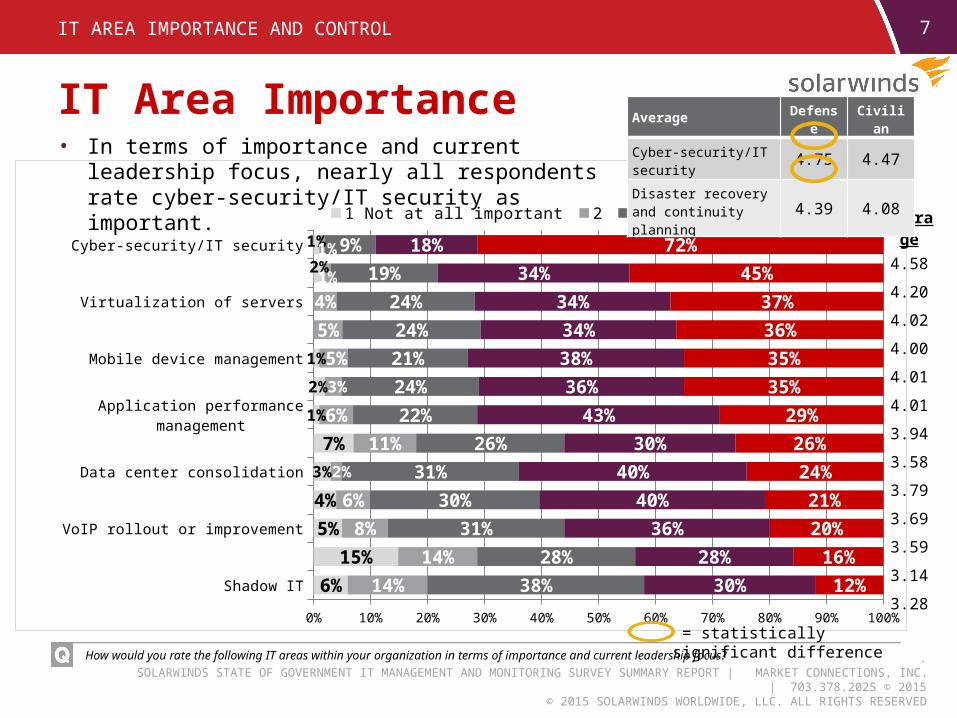
IT Area Importance
IT AREA IMPORTANCE AND CONTROL
How would you rate the following IT areas within your organization in terms of importance and current leadership focus?
Shadow IT
Public cloud computing
VoIP rollout or improvement
IT shared services
Data center consolidation
Private cloud computing
Application performance management
Storage solutions to accommodate data growth
Mobile device management
Network consolidation and/or modernization
Virtualization of servers
Disaster recovery and continuity planning
Cyber-security/IT security
0% 10% 20% 30% 40% 50% 60% 70% 80% 90% 100%
6%
15%
5%
4%
3%
7%
1%
2%
1%
2%
1%
14%
14%
8%
6%
2%
11%6%
3%
5%
5%
4%1%
1%
38%
28%
31%
30%
31%
26%22%
24%
21%
24%
24%
19%
9%
30%
28%
36%
40%
40%
30%43%
36%
38%
34%
34%
34%
18%
12%
16%
20%
21%
24%
26%29%
35%
35%
36%
37%
45%
72%
1 Not at all important 2 3 4 5-Very important
• In terms of importance and current leadership focus, nearly all respondents rate cyber-security/IT security as important.
Average
4.58
4.20
4.02
4.00
4.01
4.01
3.94
3.58
3.79
3.69
3.59
3.14
3.28
Average Defense Civilian
Cyber-security/IT security 4.75 4.47
Disaster recovery and continuity planning 4.39 4.08
= statistically significant difference
.SOLARWINDS STATE OF GOVERNMENT IT MANAGEMENT AND MONITORING SURVEY SUMMARY REPORT | MARKET CONNECTIONS, INC. | 703.378.2025 © 2015
© 2015 SOLARWINDS WORLDWIDE, LLC. ALL RIGHTS RESERVED
Shadow IT
Prior to the questions, the following definition was provided: Shadow IT refers to information technology tools and solutions that are specified, provided and/or supported by teams outside of the official IT department.
8
.SOLARWINDS STATE OF GOVERNMENT IT MANAGEMENT AND MONITORING SURVEY SUMMARY REPORT | MARKET CONNECTIONS, INC. | 703.378.2025 © 2015
© 2015 SOLARWINDS WORLDWIDE, LLC. ALL RIGHTS RESERVED
Significant reduc-tion
Slight reduction
Remain the same
Slight increase
Significant increase
0% 5% 10% 15% 20% 25% 30% 35% 40% 45%
2%
8%
32%
41%
17%
Shadow IT in the Next Two Years
Don’t know
Not at all
Very little
Somewhat
Quite a bit
A great deal
0% 5% 10% 15% 20% 25% 30% 35% 40%
2%
8%
21%
36%
24%
9%
Prevalence of Shadow IT Use
SHADOW IT 9
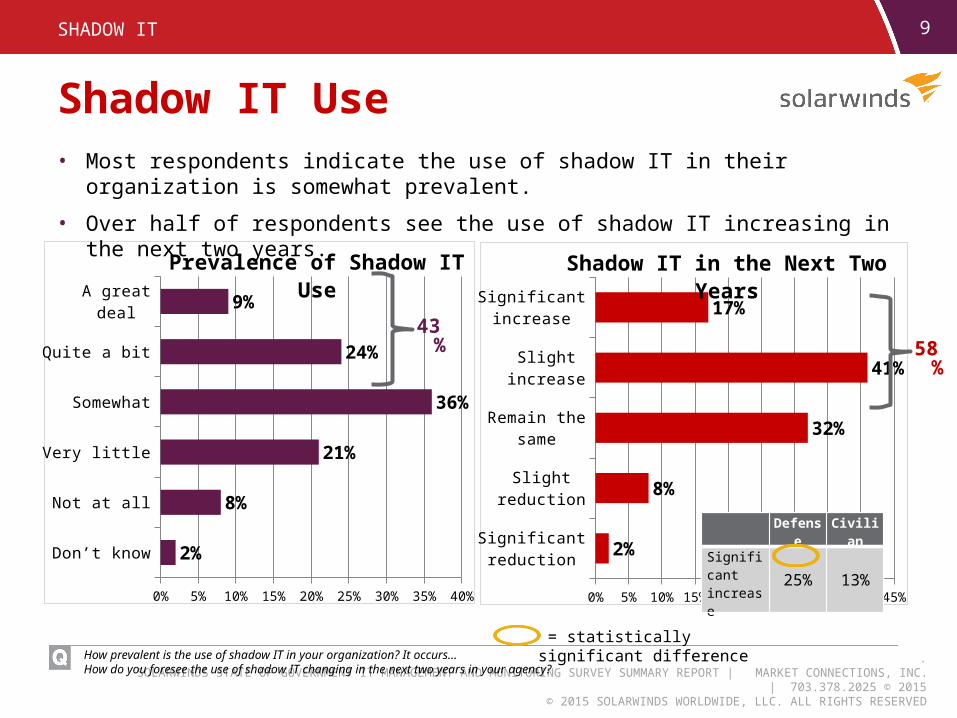
Shadow IT Use
How prevalent is the use of shadow IT in your organization? It occurs…How do you foresee the use of shadow IT changing in the next two years in your agency?
• Most respondents indicate the use of shadow IT in their organization is somewhat prevalent.
• Over half of respondents see the use of shadow IT increasing in the next two years.
= statistically significant difference
Defense Civilian
Significant increase 25% 13%
43%58%
.SOLARWINDS STATE OF GOVERNMENT IT MANAGEMENT AND MONITORING SURVEY SUMMARY REPORT | MARKET CONNECTIONS, INC. | 703.378.2025 © 2015
© 2015 SOLARWINDS WORLDWIDE, LLC. ALL RIGHTS RESERVED
10
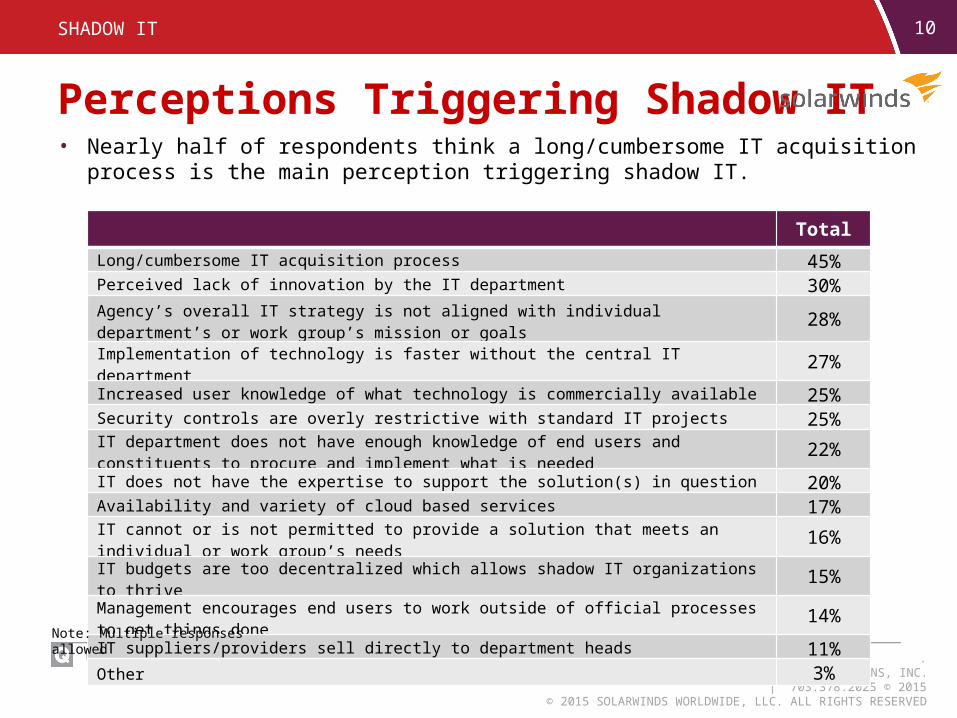
Perceptions Triggering Shadow IT
SHADOW IT
What do you think are the main perceptions (real or unreal) triggering shadow IT in your organization or others like yours? (select all that apply)
Total
Long/cumbersome IT acquisition process 45%Perceived lack of innovation by the IT department 30%Agency’s overall IT strategy is not aligned with individual department’s or work group’s mission or goals 28%Implementation of technology is faster without the central IT department 27%Increased user knowledge of what technology is commercially available 25%Security controls are overly restrictive with standard IT projects 25%IT department does not have enough knowledge of end users and constituents to procure and implement what is needed 22%
IT does not have the expertise to support the solution(s) in question 20%Availability and variety of cloud based services 17%IT cannot or is not permitted to provide a solution that meets an individual or work group’s needs 16%IT budgets are too decentralized which allows shadow IT organizations to thrive 15%Management encourages end users to work outside of official processes to get things done 14%IT suppliers/providers sell directly to department heads 11%Other 3%
Note: Multiple responses allowed
• Nearly half of respondents think a long/cumbersome IT acquisition process is the main perception triggering shadow IT.
.SOLARWINDS STATE OF GOVERNMENT IT MANAGEMENT AND MONITORING SURVEY SUMMARY REPORT | MARKET CONNECTIONS, INC. | 703.378.2025 © 2015
© 2015 SOLARWINDS WORLDWIDE, LLC. ALL RIGHTS RESERVED
11
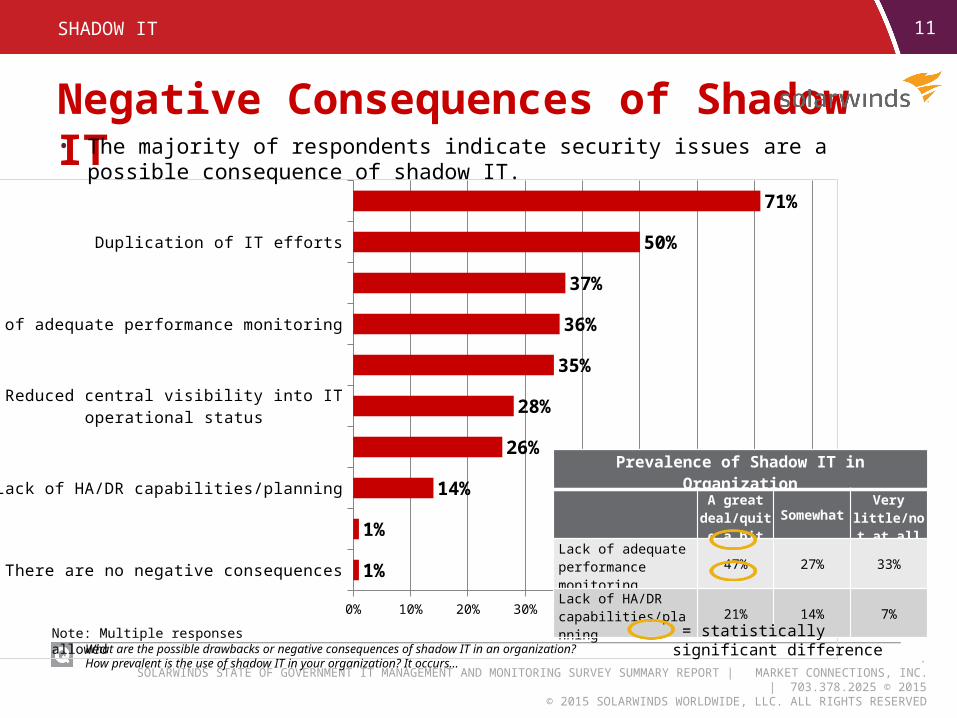
There are no negative consequences
Other
Lack of HA/DR capabilities/planning
Stove-piped systems
Reduced central visibility into IT operational status
Little or no accountability for failed IT projects
Lack of adequate performance monitoring
Lack of interoperability
Duplication of IT efforts
Security issues
0% 10% 20% 30% 40% 50% 60% 70% 80%
1%
1%
14%
26%
28%
35%
36%
37%
50%
71%
Negative Consequences of Shadow IT
SHADOW IT
What are the possible drawbacks or negative consequences of shadow IT in an organization?How prevalent is the use of shadow IT in your organization? It occurs…
Note: Multiple responses allowed
• The majority of respondents indicate security issues are a possible consequence of shadow IT.
Prevalence of Shadow IT in OrganizationA great
deal/quite a bit
SomewhatVery
little/not at all
Lack of adequate performance monitoring 47% 27% 33%
Lack of HA/DR capabilities/planning 21% 14% 7%
= statistically significant difference
.SOLARWINDS STATE OF GOVERNMENT IT MANAGEMENT AND MONITORING SURVEY SUMMARY REPORT | MARKET CONNECTIONS, INC. | 703.378.2025 © 2015
© 2015 SOLARWINDS WORLDWIDE, LLC. ALL RIGHTS RESERVED
12
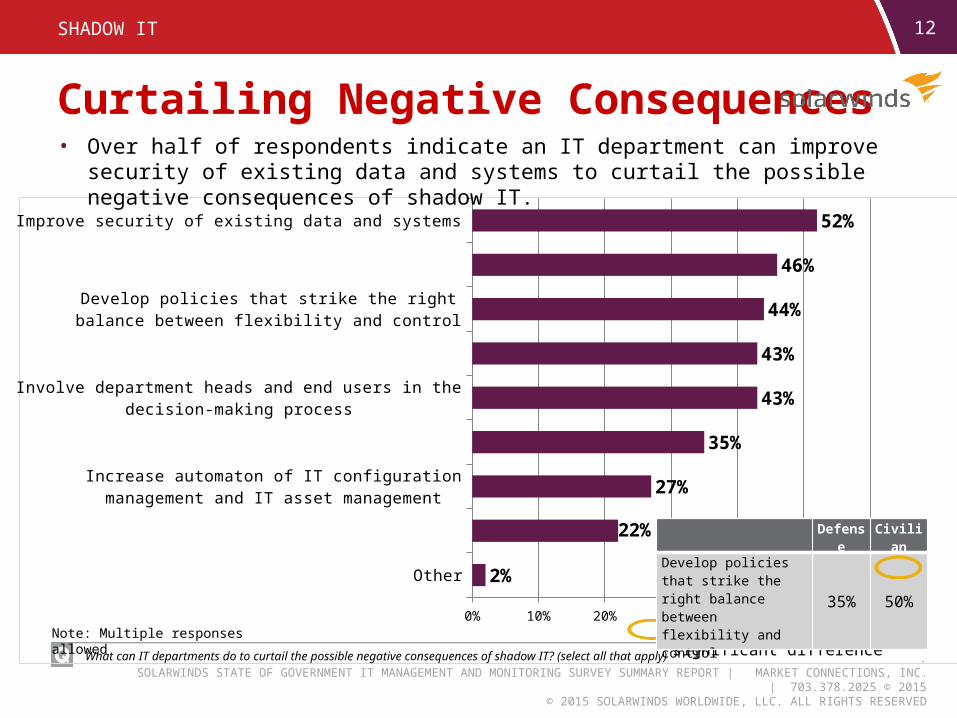
Other
Provide documentation to department heads to use for their own IT implementations
Increase automaton of IT configuration management and IT asset management
Gather feedback from end-users about satisfaction with their IT systems
Involve department heads and end users in the decision-making process
Educate employees about proper use of technology
Develop policies that strike the right balance between flexibility and control
Implement systems and tools to identify the use of shadow IT and monitor sensitive data that gets stored in unmanaged environments
Improve security of existing data and systems
0% 10% 20% 30% 40% 50% 60%
2%
22%
27%
35%
43%
43%
44%
46%
52%
Curtailing Negative Consequences
SHADOW IT
What can IT departments do to curtail the possible negative consequences of shadow IT? (select all that apply)
Note: Multiple responses allowed
• Over half of respondents indicate an IT department can improve security of existing data and systems to curtail the possible negative consequences of shadow IT.
= statistically significant difference
Defense Civilian
Develop policies that strike the right balance between flexibility and control
35% 50%
.SOLARWINDS STATE OF GOVERNMENT IT MANAGEMENT AND MONITORING SURVEY SUMMARY REPORT | MARKET CONNECTIONS, INC. | 703.378.2025 © 2015
© 2015 SOLARWINDS WORLDWIDE, LLC. ALL RIGHTS RESERVED
13
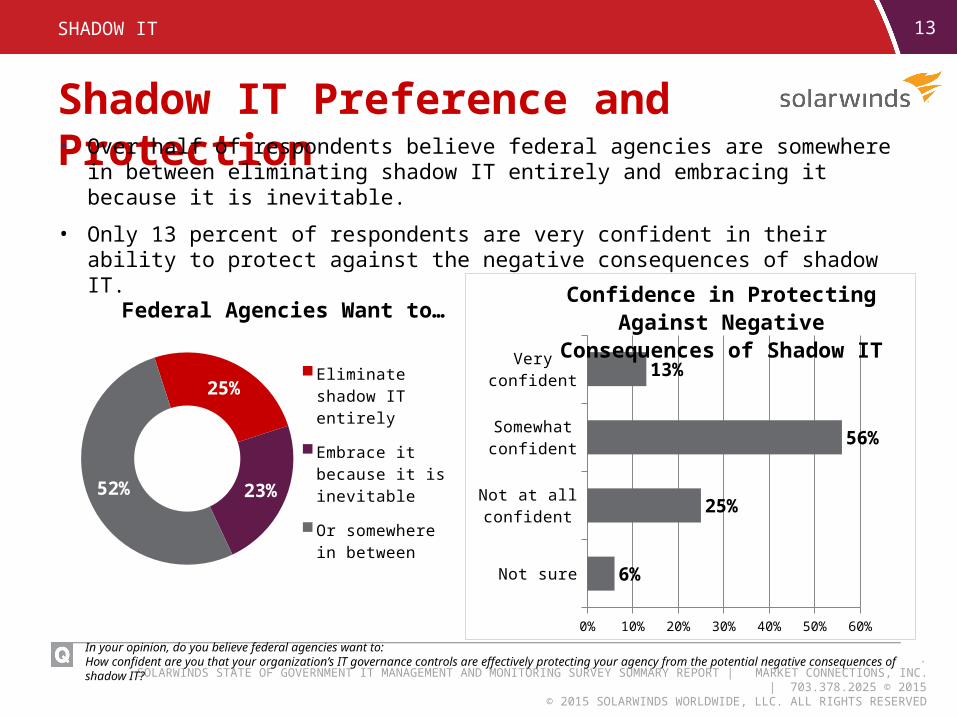
Not sure
Not at all confident
Somewhat confident
Very confident
0% 10% 20% 30% 40% 50% 60%
6%
25%
56%
13%
Confidence in Protecting Against Nega-tive Consequences of Shadow IT
SHADOW IT
In your opinion, do you believe federal agencies want to:How confident are you that your organization’s IT governance controls are effectively protecting your agency from the potential negative consequences of shadow IT?
25%
23%52%
Federal Agencies Want to…
Eliminate shadow IT entirely
Embrace it because it is inevitable
Or somewhere in be-tween
Shadow IT Preference and Protection• Over half of respondents believe federal agencies are somewhere in between eliminating
shadow IT entirely and embracing it because it is inevitable.
• Only 13 percent of respondents are very confident in their ability to protect against the negative consequences of shadow IT.

.SOLARWINDS STATE OF GOVERNMENT IT MANAGEMENT AND MONITORING SURVEY SUMMARY REPORT | MARKET CONNECTIONS, INC. | 703.378.2025 © 2015
© 2015 SOLARWINDS WORLDWIDE, LLC. ALL RIGHTS RESERVED
14
The network is monitored for the volume of data being used by applications and between specific devices
Log files (firewall, server, etc.) are collected centrally and scanned for patterns indicating a security breach
The network is monitored for unexpected ports, protocols, etc.
User PC’s are regularly scanned for unauthorized software
0% 10% 20% 30% 40% 50% 60% 70% 80% 90% 100%
7%
5%
7%
7%
10%
9%
9%
9%
28%
30%
24%
23%
54%
55%
60%
61%
NA/Don’t know Not currently used In the process of implementing Fully capable/implemented
SHADOW IT
What management, monitoring and security tools and practices does your organization use to protect against the possible negative consequences of shadow IT?
Tools and Practices In Use• The most common management and monitoring tools and practices are noted below with over
half of the respondents indicating they are fully capable or implemented.
.SOLARWINDS STATE OF GOVERNMENT IT MANAGEMENT AND MONITORING SURVEY SUMMARY REPORT | MARKET CONNECTIONS, INC. | 703.378.2025 © 2015
© 2015 SOLARWINDS WORLDWIDE, LLC. ALL RIGHTS RESERVED
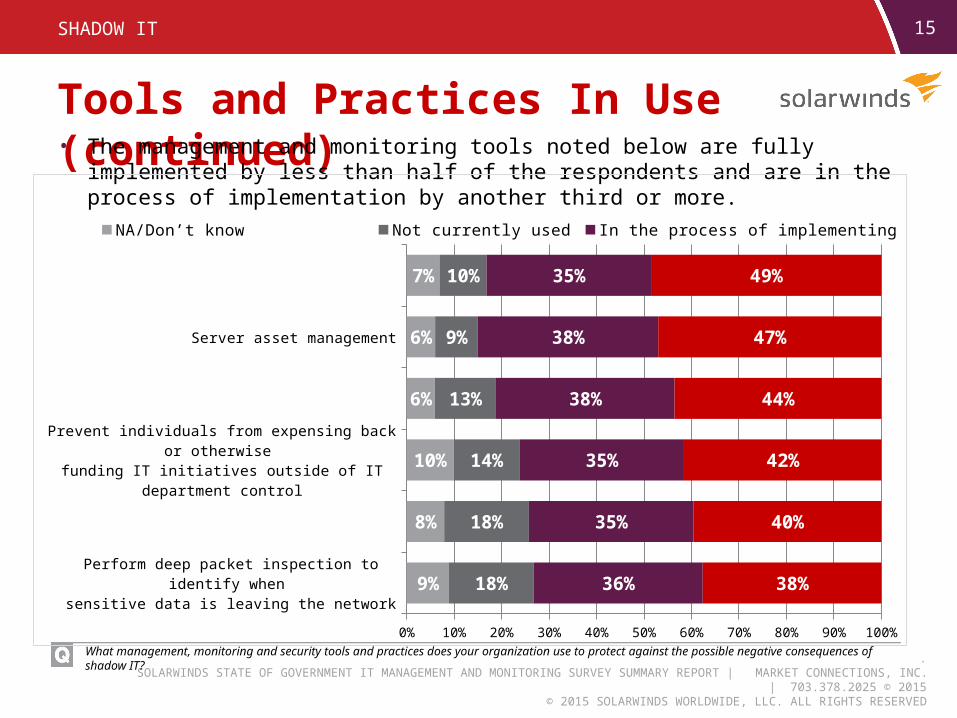
15SHADOW IT
What management, monitoring and security tools and practices does your organization use to protect against the possible negative consequences of shadow IT?
Tools and Practices In Use (continued)• The management and monitoring tools noted below are fully implemented by less than half of
the respondents and are in the process of implementation by another third or more.
Perform deep packet inspection to identify when sensitive data is leaving the network
Block access to known conduits for Shadow IT such as cloud providers and hosting companies
Prevent individuals from expensing back or otherwise funding IT initiatives outside of IT department control
Documented policies and procedures prohibiting users from creating and using non-sanctioned solutions
Server asset management
Tools that track all devices are attached to the network
0% 10% 20% 30% 40% 50% 60% 70% 80% 90% 100%
9%
8%
10%
6%
6%
7%
18%
18%
14%
13%
9%
10%
36%
35%
35%
38%
38%
35%
38%
40%
42%
44%
47%
49%
NA/Don’t know Not currently used In the process of implementing Fully capable/implemented
.SOLARWINDS STATE OF GOVERNMENT IT MANAGEMENT AND MONITORING SURVEY SUMMARY REPORT | MARKET CONNECTIONS, INC. | 703.378.2025 © 2015
© 2015 SOLARWINDS WORLDWIDE, LLC. ALL RIGHTS RESERVED
16SHADOW IT
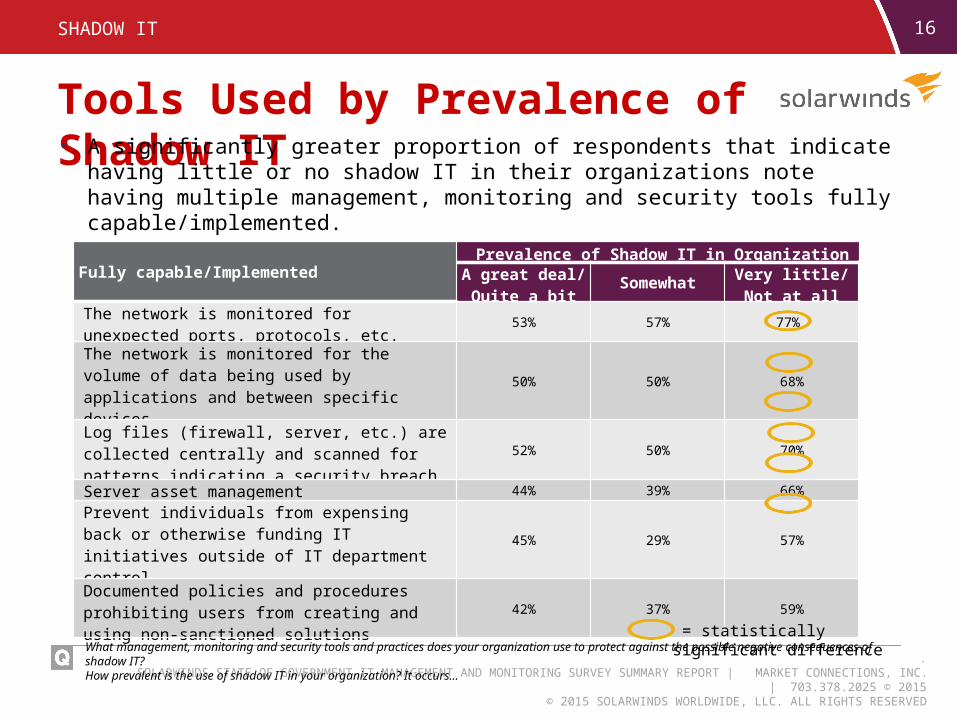
What management, monitoring and security tools and practices does your organization use to protect against the possible negative consequences of shadow IT? How prevalent is the use of shadow IT in your organization? It occurs…
Tools Used by Prevalence of Shadow IT• A significantly greater proportion of respondents that indicate having little or no shadow IT in
their organizations note having multiple management, monitoring and security tools fully capable/implemented.
Fully capable/Implemented Prevalence of Shadow IT in Organization
A great deal/Quite a bit Somewhat Very little/
Not at allThe network is monitored for unexpected ports, protocols, etc. 53% 57% 77%
The network is monitored for the volume of data being used by applications and between specific devices 50% 50% 68%
Log files (firewall, server, etc.) are collected centrally and scanned for patterns indicating a security breach 52% 50% 70%
Server asset management 44% 39% 66%Prevent individuals from expensing back or otherwise funding IT initiatives outside of IT department control 45% 29% 57%
Documented policies and procedures prohibiting users from creating and using non-sanctioned solutions 42% 37% 59%
= statistically significant difference

.SOLARWINDS STATE OF GOVERNMENT IT MANAGEMENT AND MONITORING SURVEY SUMMARY REPORT | MARKET CONNECTIONS, INC. | 703.378.2025 © 2015
© 2015 SOLARWINDS WORLDWIDE, LLC. ALL RIGHTS RESERVED
17SHADOW IT
What management, monitoring and security tools and practices does your organization use to protect against the possible negative consequences of shadow IT?How confident are you that your organization’s IT governance controls are effectively protecting your agency from the potential negative consequences of shadow IT?
Tools Used by Confidence Level• A significantly greater proportion of respondents that are confident their organization's IT
controls are providing protection from the negative consequences of shadow IT note having multiple management, monitoring and security tools fully capable/implemented.
Fully capable/Implemented
Confident that Organization’s IT Controls are Protecting from Negative Consequences of
Shadow IT
Very/Somewhat Confident
Not at all confident/ Unsure
The network is monitored for unexpected ports, protocols, etc. 65% 49%
Server asset management 52% 36%Block access to known conduits for shadow IT such as cloud providers and hosting companies 49% 18%
Perform deep packet inspection to identify when sensitive data is leaving the network 46% 18%
Prevent individuals from expensing back or otherwise funding IT initiatives outside of IT department control 49% 26%
Documented policies and procedures prohibiting users from creating and using non-sanctioned solutions 49% 33%
= statistically significant difference

.SOLARWINDS STATE OF GOVERNMENT IT MANAGEMENT AND MONITORING SURVEY SUMMARY REPORT | MARKET CONNECTIONS, INC. | 703.378.2025 © 2015
© 2015 SOLARWINDS WORLDWIDE, LLC. ALL RIGHTS RESERVED
Mobile Technology
18

.SOLARWINDS STATE OF GOVERNMENT IT MANAGEMENT AND MONITORING SURVEY SUMMARY REPORT | MARKET CONNECTIONS, INC. | 703.378.2025 © 2015
© 2015 SOLARWINDS WORLDWIDE, LLC. ALL RIGHTS RESERVED
19
All types of personally owned mobile devices are approved for access
Personally-owned devices can access some functions (i.e., email) but not all functions
No mobile device access is allowed
Only a specific list of personally owned mobile devices are approved for access
Only organization-owned mobile devices are allowed access
0% 5% 10% 15% 20% 25% 30% 35% 40%
11%
14%
19%
19%
36%
Personally Owned Device Policy
MOBILE TECHNOLOGY
Which statement best describes the policy regarding employees accessing your organization’s systems using their personally owned mobile devices?
• Over one-third of respondents indicate only organization-owned mobile devices are allowed access to their organization’s systems.
= statistically significant difference
Defense Civilian
No mobile device access is allowed 35% 10%
Personally-owned devices can access some functions but not all functions
5% 20%
.SOLARWINDS STATE OF GOVERNMENT IT MANAGEMENT AND MONITORING SURVEY SUMMARY REPORT | MARKET CONNECTIONS, INC. | 703.378.2025 © 2015
© 2015 SOLARWINDS WORLDWIDE, LLC. ALL RIGHTS RESERVED
Not sure
Not at all confident
Somewhat confident
Very confident
0% 10% 20% 30% 40% 50% 60% 70%
3%
12%
59%
25%
Confidence in Security Controls Effec-tively Protecting Data
No threat
Not yet, but it will be a problem
Yes, but it’s minor.We can manage it.
Yes, significantly
0% 10% 20% 30% 40% 50% 60%
7%
13%
48%
32%
Believe Mobile Devices Threaten Security
MOBILE TECHNOLOGY 20
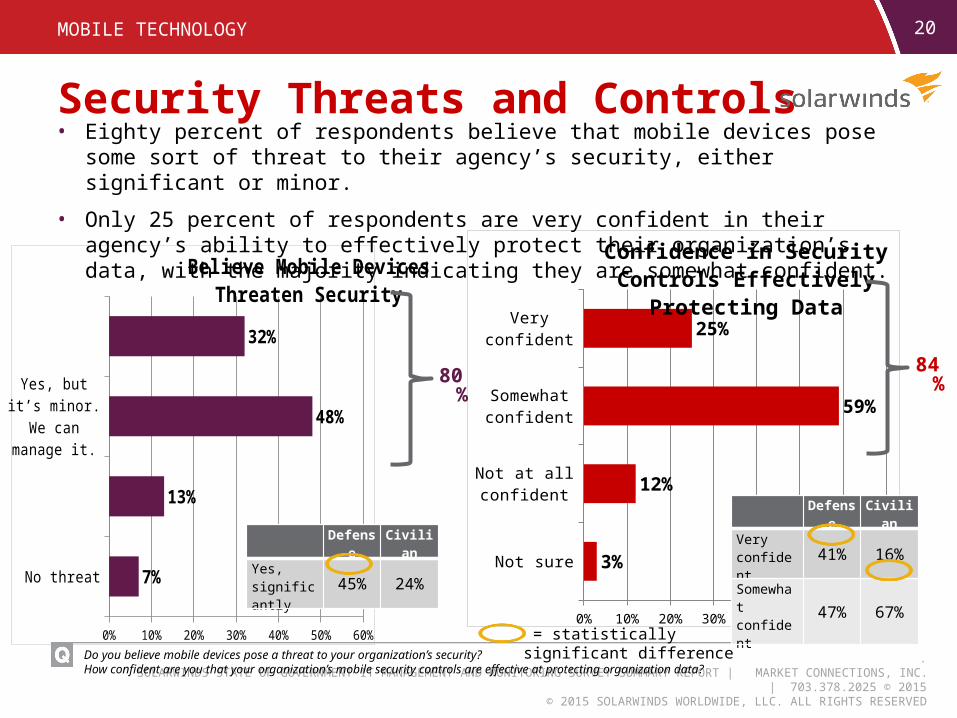
Security Threats and Controls• Eighty percent of respondents believe that mobile devices pose some sort of threat to their
agency’s security, either significant or minor.
• Only 25 percent of respondents are very confident in their agency’s ability to effectively protect their organization’s data, with the majority indicating they are somewhat confident.
Do you believe mobile devices pose a threat to your organization’s security?How confident are you that your organization’s mobile security controls are effective at protecting organization data?
Defense Civilian
Yes, significantly 45% 24%
= statistically significant difference
Defense Civilian
Very confident 41% 16%
Somewhat confident 47% 67%
80% 84%
.SOLARWINDS STATE OF GOVERNMENT IT MANAGEMENT AND MONITORING SURVEY SUMMARY REPORT | MARKET CONNECTIONS, INC. | 703.378.2025 © 2015
© 2015 SOLARWINDS WORLDWIDE, LLC. ALL RIGHTS RESERVED
21MOBILE TECHNOLOGY
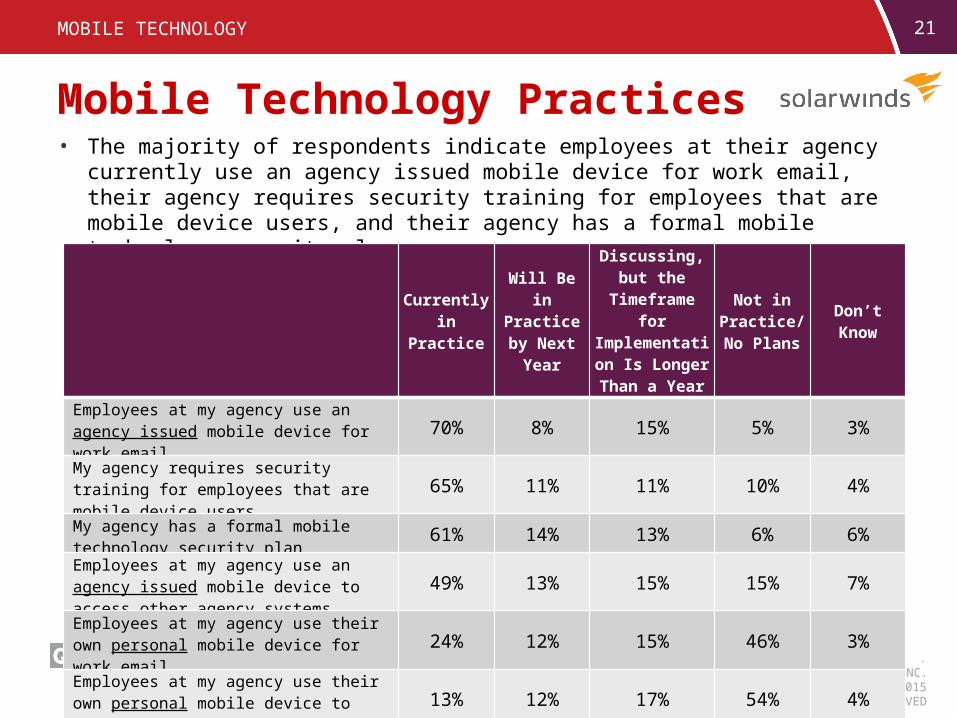
Please indicate the approximate timeframe for each of the following statements regarding mobile technology at your agency.
Mobile Technology Practices• The majority of respondents indicate employees at their agency currently use an agency
issued mobile device for work email, their agency requires security training for employees that are mobile device users, and their agency has a formal mobile technology security plan.
Currently in Practice
Will Be in Practice by Next Year
Discussing, but the Timeframe for Implementation Is
Longer Than a Year From Now
Not in Practice/No
PlansDon’t Know
Employees at my agency use an agency issued mobile device for work email 70% 8% 15% 5% 3%
My agency requires security training for employees that are mobile device users 65% 11% 11% 10% 4%
My agency has a formal mobile technology security plan 61% 14% 13% 6% 6%
Employees at my agency use an agency issued mobile device to access other agency systems 49% 13% 15% 15% 7%
Employees at my agency use their own personal mobile device for work email 24% 12% 15% 46% 3%
Employees at my agency use their own personal mobile device to access other agency systems 13% 12% 17% 54% 4%
.SOLARWINDS STATE OF GOVERNMENT IT MANAGEMENT AND MONITORING SURVEY SUMMARY REPORT | MARKET CONNECTIONS, INC. | 703.378.2025 © 2015
© 2015 SOLARWINDS WORLDWIDE, LLC. ALL RIGHTS RESERVED
22MOBILE TECHNOLOGY
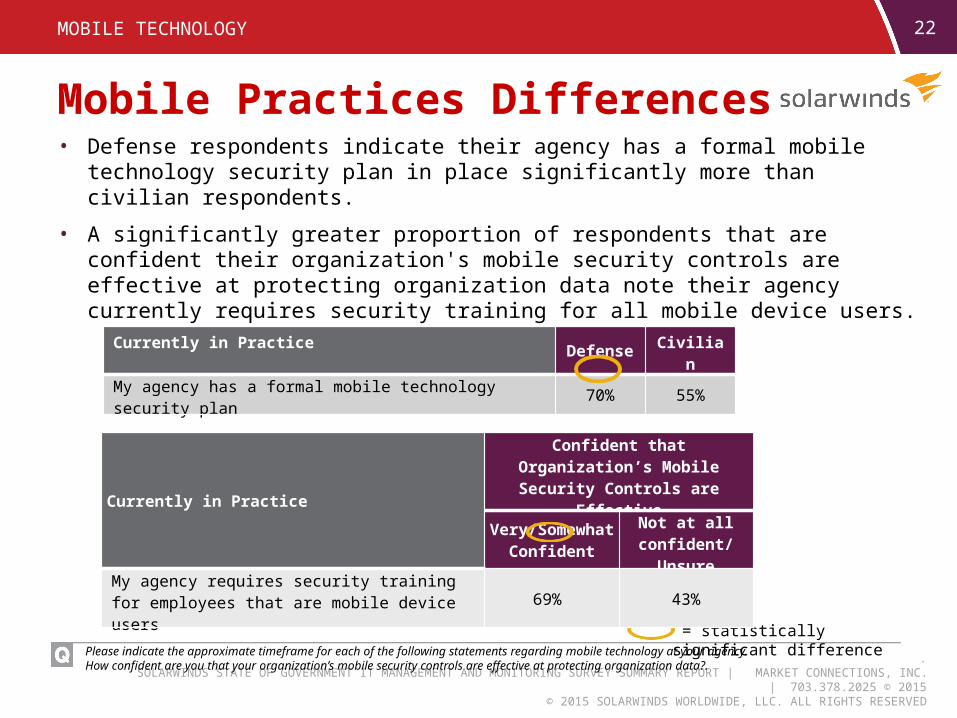
Please indicate the approximate timeframe for each of the following statements regarding mobile technology at your agency.How confident are you that your organization’s mobile security controls are effective at protecting organization data?.
Mobile Practices Differences• Defense respondents indicate their agency has a formal mobile technology security plan in place
significantly more than civilian respondents.
• A significantly greater proportion of respondents that are confident their organization's mobile security controls are effective at protecting organization data note their agency currently requires security training for all mobile device users.
Currently in Practice Defense Civilian
My agency has a formal mobile technology security plan 70% 55%
= statistically significant difference
Currently in Practice
Confident that Organization’s Mobile Security Controls are Effective
Very/Somewhat Confident
Not at all confident/ Unsure
My agency requires security training for employees that are mobile device users 69% 43%
.SOLARWINDS STATE OF GOVERNMENT IT MANAGEMENT AND MONITORING SURVEY SUMMARY REPORT | MARKET CONNECTIONS, INC. | 703.378.2025 © 2015
© 2015 SOLARWINDS WORLDWIDE, LLC. ALL RIGHTS RESERVED
23
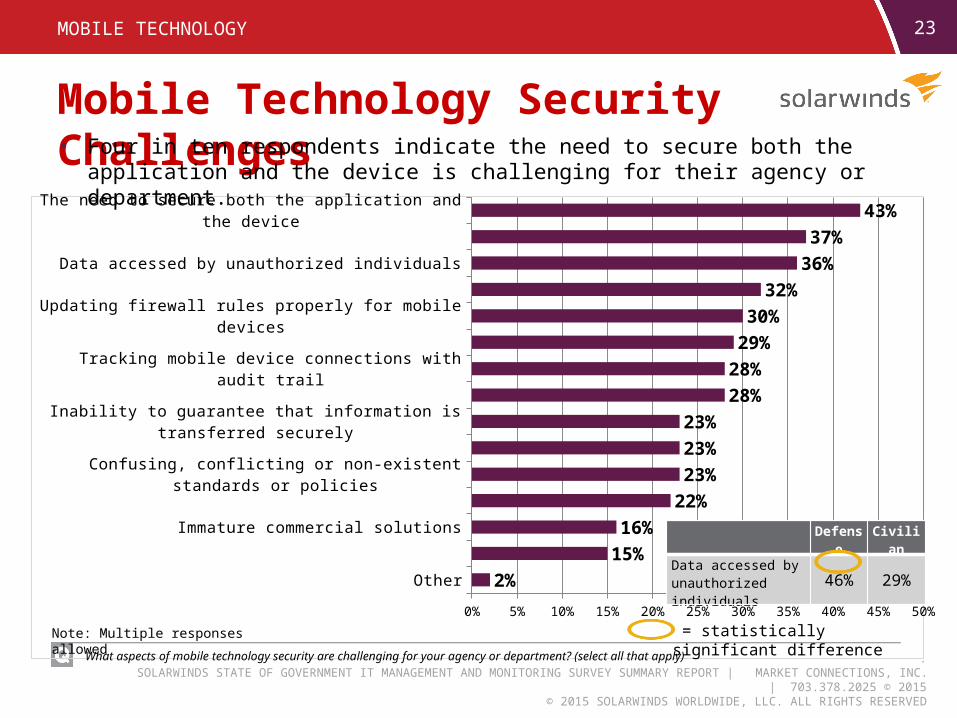
Other
Difficulty moving from a pilot program to an agency-wide program
Immature commercial solutions
Tracking excessive bandwidth use by mobile devices
Confusing, conflicting or non-existent standards or policies
Converting existing secure web apps to be mobile friendly
Inability to guarantee that information is transferred securely
Identity management/authentication with audit trail
Tracking mobile device connections with audit trail
Data loss due to lost or stolen devices
Updating firewall rules properly for mobile devices
Security testing and certifying of mobile apps
Data accessed by unauthorized individuals
Ensuring mobile devices are not infected with malware
The need to secure both the application and the device
0% 5% 10% 15% 20% 25% 30% 35% 40% 45% 50%
2%15%
16%22%
23%23%23%
28%28%
29%30%
32%36%
37%43%
Mobile Technology Security Challenges
MOBILE TECHNOLOGY
What aspects of mobile technology security are challenging for your agency or department? (select all that apply)
Note: Multiple responses allowed
• Four in ten respondents indicate the need to secure both the application and the device is challenging for their agency or department.
= statistically significant difference
Defense Civilian
Data accessed by unauthorized individuals 46% 29%
.SOLARWINDS STATE OF GOVERNMENT IT MANAGEMENT AND MONITORING SURVEY SUMMARY REPORT | MARKET CONNECTIONS, INC. | 703.378.2025 © 2015
© 2015 SOLARWINDS WORLDWIDE, LLC. ALL RIGHTS RESERVED
24MOBILE TECHNOLOGY
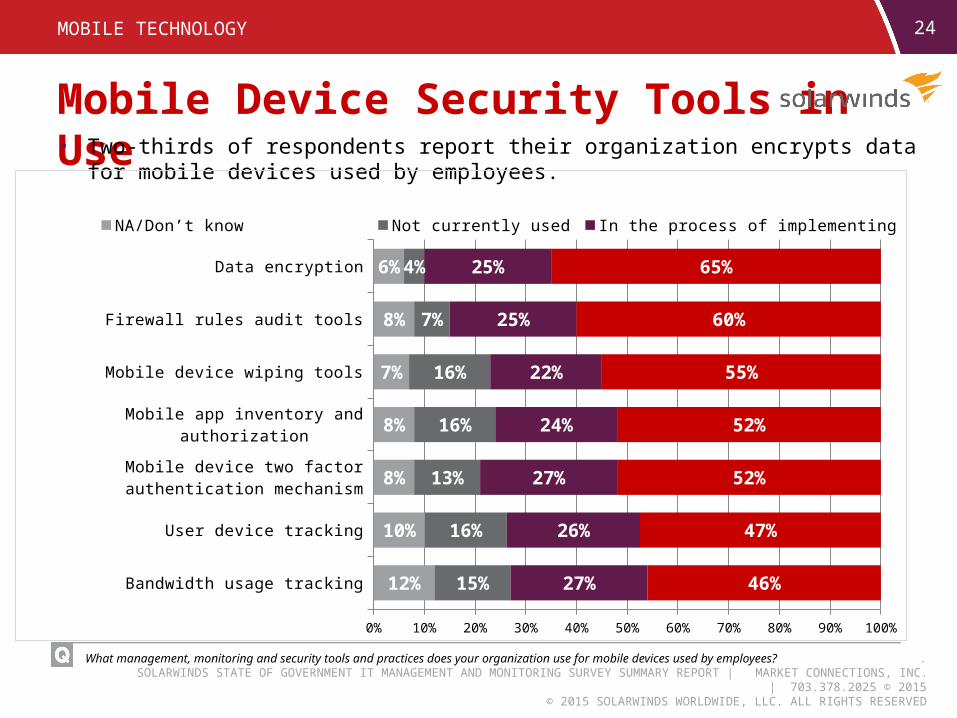
What management, monitoring and security tools and practices does your organization use for mobile devices used by employees?
Mobile Device Security Tools in Use• Two-thirds of respondents report their organization encrypts data for mobile devices used by
employees.
Bandwidth usage tracking
User device tracking
Mobile device two factor authentication mechanism
Mobile app inventory and authorization
Mobile device wiping tools
Firewall rules audit tools
Data encryption
0% 10% 20% 30% 40% 50% 60% 70% 80% 90% 100%
12%
10%
8%
8%
7%
8%
6%
15%
16%
13%
16%
16%
7%
4%
27%
26%
27%
24%
22%
25%
25%
46%
47%
52%
52%
55%
60%
65%
NA/Don’t know Not currently used In the process of implementing Fully capable/implemented
.SOLARWINDS STATE OF GOVERNMENT IT MANAGEMENT AND MONITORING SURVEY SUMMARY REPORT | MARKET CONNECTIONS, INC. | 703.378.2025 © 2015
© 2015 SOLARWINDS WORLDWIDE, LLC. ALL RIGHTS RESERVED
25MOBILE TECHNOLOGY
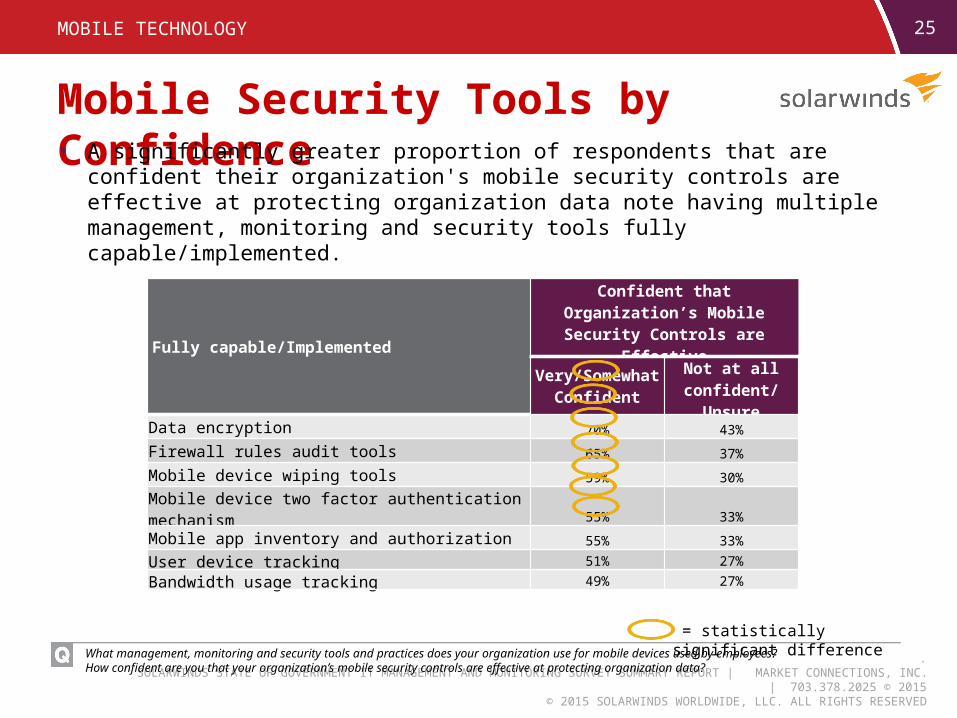
What management, monitoring and security tools and practices does your organization use for mobile devices used by employees?How confident are you that your organization’s mobile security controls are effective at protecting organization data?
Mobile Security Tools by Confidence• A significantly greater proportion of respondents that are confident their organization's mobile
security controls are effective at protecting organization data note having multiple management, monitoring and security tools fully capable/implemented.
Fully capable/Implemented
Confident that Organization’s Mobile Security Controls are Effective
Very/Somewhat Confident
Not at all confident/ Unsure
Data encryption 70% 43%
Firewall rules audit tools 65% 37%
Mobile device wiping tools 59% 30%
Mobile device two factor authentication mechanism 55% 33%
Mobile app inventory and authorization 55% 33%User device tracking 51% 27%Bandwidth usage tracking 49% 27%
= statistically significant difference
.SOLARWINDS STATE OF GOVERNMENT IT MANAGEMENT AND MONITORING SURVEY SUMMARY REPORT | MARKET CONNECTIONS, INC. | 703.378.2025 © 2015
© 2015 SOLARWINDS WORLDWIDE, LLC. ALL RIGHTS RESERVED
IT Shared Services
For the purposes of the remainder of the survey, respondents referred to the following definition of IT shared services: IT shared services for government covers the entire spectrum of IT service opportunities either within or across federal agencies, where previously that service had been found in more than one part of each agency. Under this strategy the funding and resourcing of IT services is shared. The providing department effectively becomes an internal service provider for one or more agencies. Each unit receiving the service must assume shared accountability for the results, while the agency provider of the shared service must ensure that the agreed results are delivered appropriately.
26
.SOLARWINDS STATE OF GOVERNMENT IT MANAGEMENT AND MONITORING SURVEY SUMMARY REPORT | MARKET CONNECTIONS, INC. | 703.378.2025 © 2015
© 2015 SOLARWINDS WORLDWIDE, LLC. ALL RIGHTS RESERVED
27IT SHARED SERVICES
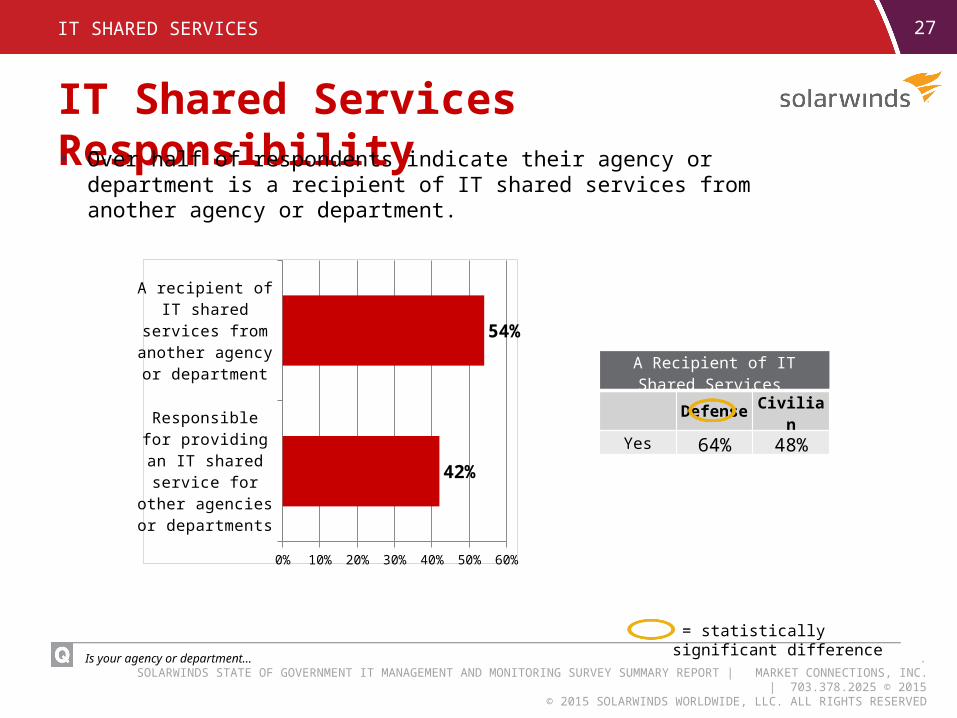
Is your agency or department…
IT Shared Services Responsibility• Over half of respondents indicate their agency or department is a recipient of IT
shared services from another agency or department.
A Recipient of IT Shared Services Defense Civilian
Yes 64% 48%
= statistically significant difference
Responsible for providing an IT
shared service for other agencies or
departments
A recipient of IT shared services from
another agency or department
0% 10% 20% 30% 40% 50% 60%
42%
54%
.SOLARWINDS STATE OF GOVERNMENT IT MANAGEMENT AND MONITORING SURVEY SUMMARY REPORT | MARKET CONNECTIONS, INC. | 703.378.2025 © 2015
© 2015 SOLARWINDS WORLDWIDE, LLC. ALL RIGHTS RESERVED
28IT SHARED SERVICES
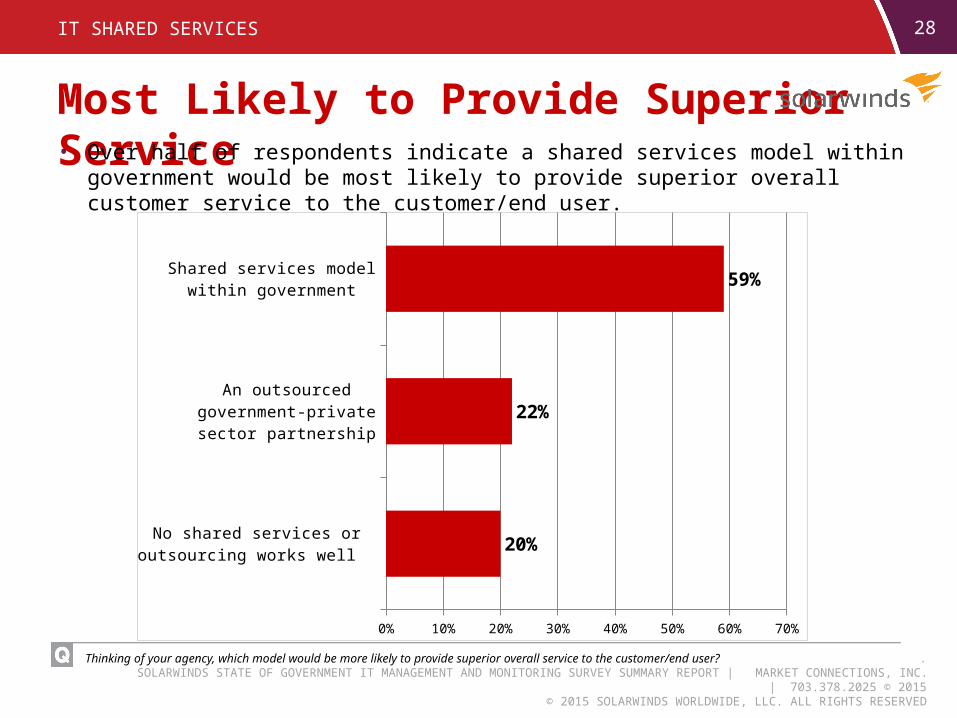
Thinking of your agency, which model would be more likely to provide superior overall service to the customer/end user?
Most Likely to Provide Superior Service• Over half of respondents indicate a shared services model within government would be most
likely to provide superior overall customer service to the customer/end user.
No shared services or outsourcing works well
An outsourced government-private sector partnership
Shared services model within government
0% 10% 20% 30% 40% 50% 60% 70%
20%
22%
59%
.SOLARWINDS STATE OF GOVERNMENT IT MANAGEMENT AND MONITORING SURVEY SUMMARY REPORT | MARKET CONNECTIONS, INC. | 703.378.2025 © 2015
© 2015 SOLARWINDS WORLDWIDE, LLC. ALL RIGHTS RESERVED
29
Other
Inadequate monitoring of service levels and the achievement of SLA
Takes too much time to start delivering the service
Potentially unmotivated service providers that are not aligned with my mission
Shared services too often have poor performance and reliability characteristics
Forced to replace existing well-running service provider or tool with agency selected tool
Executive buy-in can be inadequate, which hampers/weakens implementation
Decreased flexibility to respond to new needs or requirements
Cultural resistance in changing to a new system
0% 10% 20% 30% 40% 50% 60%
2%
25%
28%
31%
35%
35%
37%
37%
56%
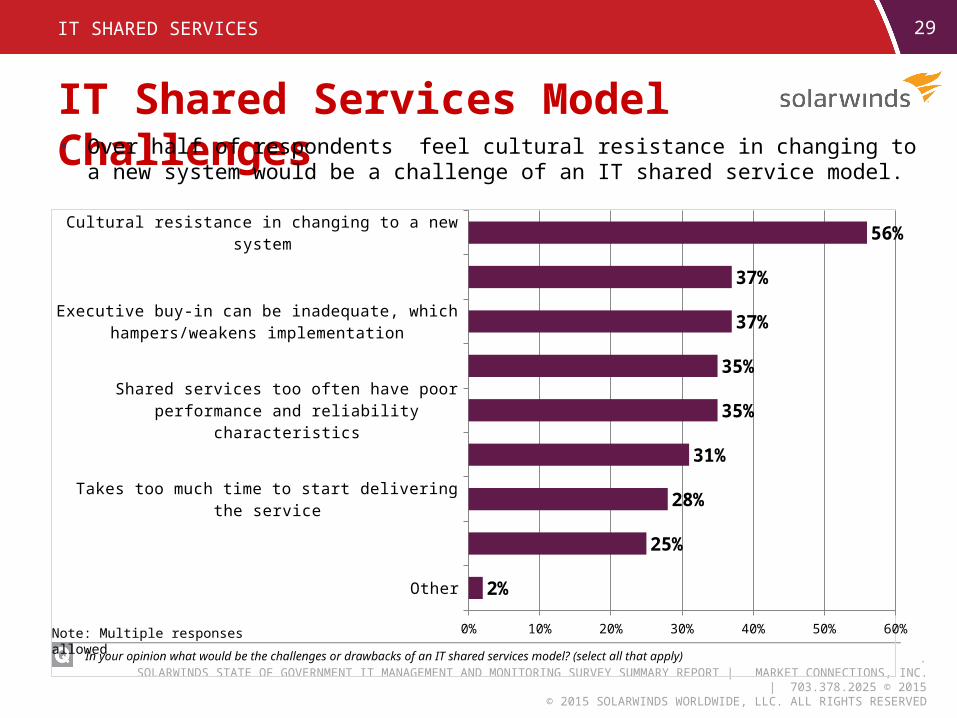
IT Shared Services Model Challenges
IT SHARED SERVICES
In your opinion what would be the challenges or drawbacks of an IT shared services model? (select all that apply)
Note: Multiple responses allowed
• Over half of respondents feel cultural resistance in changing to a new system would be a challenge of an IT shared service model.
.SOLARWINDS STATE OF GOVERNMENT IT MANAGEMENT AND MONITORING SURVEY SUMMARY REPORT | MARKET CONNECTIONS, INC. | 703.378.2025 © 2015
© 2015 SOLARWINDS WORLDWIDE, LLC. ALL RIGHTS RESERVED
30
Other
Increase communications with stakeholders, which encourages collaboration, transparency and accountability
Closes productivity gaps by implementing integrated governance processes
Opportunity to adopt best practices within and across agencies, leading to better trained and skilled staff
Provides innovative IT service solutions at the program, bureau and agency levels
Frees staff to focus resources on value-added tasks
Standardizes IT service delivery in general, for more consistent performance
Achieve economies of scale
Saves money by eliminating duplication
0% 10% 20% 30% 40% 50% 60% 70%
1%
17%
28%
30%
37%
41%
52%
54%
60%
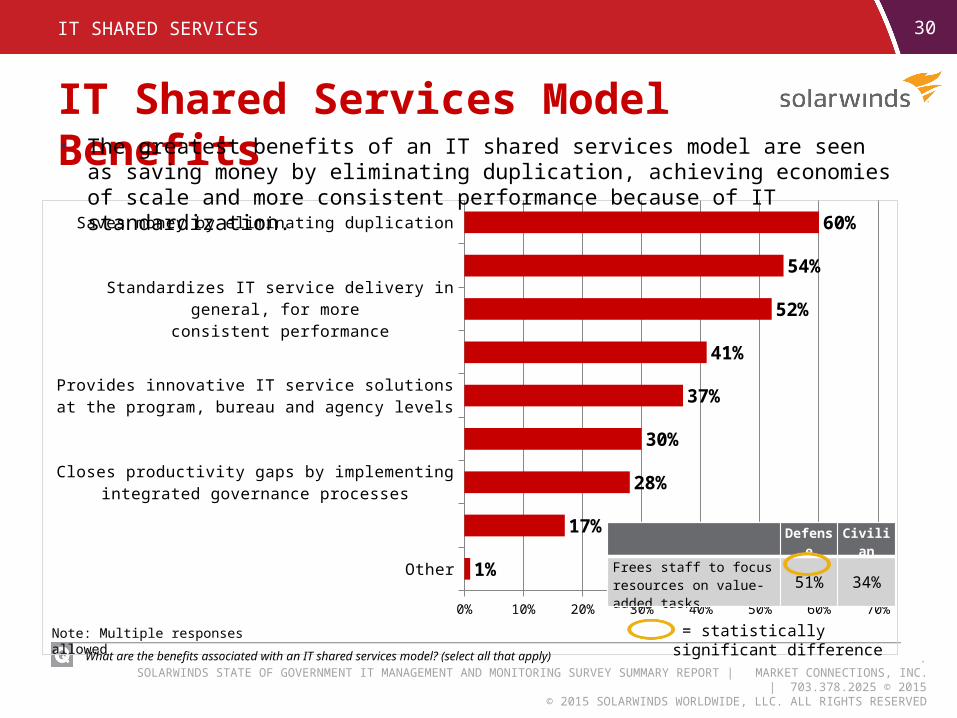
IT Shared Services Model Benefits
IT SHARED SERVICES
What are the benefits associated with an IT shared services model? (select all that apply)
Note: Multiple responses allowed
• The greatest benefits of an IT shared services model are seen as saving money by eliminating duplication, achieving economies of scale and more consistent performance because of IT standardization.
= statistically significant difference
Defense Civilian
Frees staff to focus resources on value-added tasks 51% 34%
.SOLARWINDS STATE OF GOVERNMENT IT MANAGEMENT AND MONITORING SURVEY SUMMARY REPORT | MARKET CONNECTIONS, INC. | 703.378.2025 © 2015
© 2015 SOLARWINDS WORLDWIDE, LLC. ALL RIGHTS RESERVED
31IT SHARED SERVICES
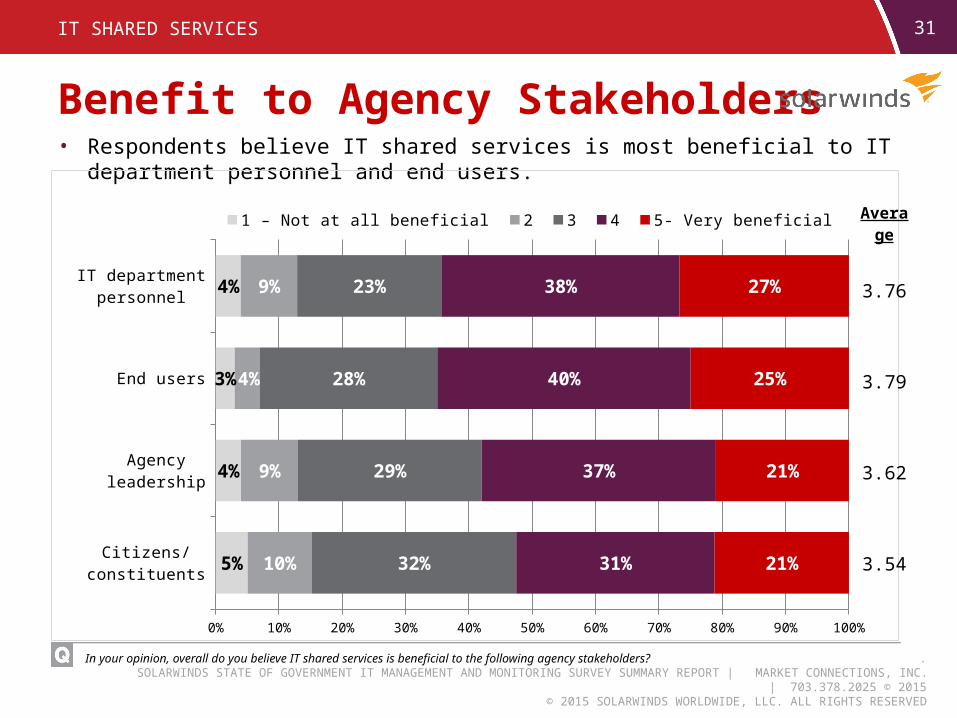
In your opinion, overall do you believe IT shared services is beneficial to the following agency stakeholders?
Benefit to Agency Stakeholders• Respondents believe IT shared services is most beneficial to IT department personnel and end
users.
Citizens/constituents
Agency leadership
End users
IT department personnel
0% 10% 20% 30% 40% 50% 60% 70% 80% 90% 100%
5%
4%
3%
4%
10%
9%
4%
9%
32%
29%
28%
23%
31%
37%
40%
38%
21%
21%
25%
27%
1 – Not at all beneficial 2 3 4 5- Very beneficialAverage
3.76
3.79
3.62
3.54
.SOLARWINDS STATE OF GOVERNMENT IT MANAGEMENT AND MONITORING SURVEY SUMMARY REPORT | MARKET CONNECTIONS, INC. | 703.378.2025 © 2015
© 2015 SOLARWINDS WORLDWIDE, LLC. ALL RIGHTS RESERVED
32
Contact Information
RESEARCH TO INFORM YOUR BUSINESS DECISIONS
Laurie Morrow, Director of Research Services 11350 Random Hills Road, Suite 800 | Fairfax, VA 22030 | 703.378.2025, ext. [email protected]
Lisa M. Sherwin Wulf, Director of Marketing – Federal | SolarWinds2250 Corporate Park Drive, Suite 210| Herndon, VA 20171| [email protected] www.solarwinds.com/federalLinkedIn: SolarWinds Government