Embed Size (px)
Citation preview

Application Performance End User Study
PUBLIC SECTOR VS. PRIVATE SECTOR Findings
Conducted by Redshift ResearchJuly 2014
© 2014 SOLARWINDS WORLDWIDE, LLC. ALL RIGHTS RESERVED.
2
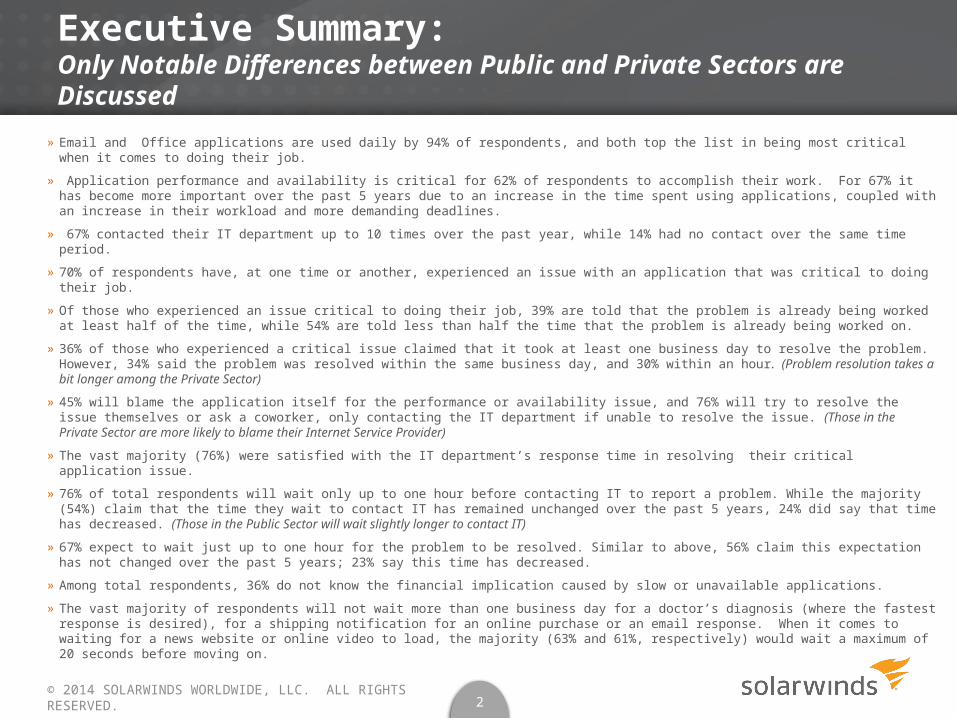
Executive Summary: Only Notable Differences between Public and Private Sectors are Discussed
» Email and Office applications are used daily by 94% of respondents, and both top the list in being most critical when it comes to doing their job.
» Application performance and availability is critical for 62% of respondents to accomplish their work. For 67% it has become more important over the past 5 years due to an increase in the time spent using applications, coupled with an increase in their workload and more demanding deadlines.
» 67% contacted their IT department up to 10 times over the past year, while 14% had no contact over the same time period.
» 70% of respondents have, at one time or another, experienced an issue with an application that was critical to doing their job.
» Of those who experienced an issue critical to doing their job, 39% are told that the problem is already being worked at least half of the time, while 54% are told less than half the time that the problem is already being worked on.
» 36% of those who experienced a critical issue claimed that it took at least one business day to resolve the problem. However, 34% said the problem was resolved within the same business day, and 30% within an hour. (Problem resolution takes a bit longer among the Private Sector)
» 45% will blame the application itself for the performance or availability issue, and 76% will try to resolve the issue themselves or ask a coworker, only contacting the IT department if unable to resolve the issue. (Those in the Private Sector are more likely to blame their Internet Service Provider)
» The vast majority (76%) were satisfied with the IT department’s response time in resolving their critical application issue.
» 76% of total respondents will wait only up to one hour before contacting IT to report a problem. While the majority (54%) claim that the time they wait to contact IT has remained unchanged over the past 5 years, 24% did say that time has decreased. (Those in the Public Sector will wait slightly longer to contact IT)
» 67% expect to wait just up to one hour for the problem to be resolved. Similar to above, 56% claim this expectation has not changed over the past 5 years; 23% say this time has decreased.
» Among total respondents, 36% do not know the financial implication caused by slow or unavailable applications.
» The vast majority of respondents will not wait more than one business day for a doctor’s diagnosis (where the fastest response is desired), for a shipping notification for an online purchase or an email response. When it comes to waiting for a news website or online video to load, the majority (63% and 61%, respectively) would wait a maximum of 20 seconds before moving on.© 2014 SOLARWINDS WORLDWIDE, LLC. ALL RIGHTS RESERVED.

US RESULTS: Public vs. Private Sector
Software or Applications Used on a Daily Basis
Base: 403 Total, 215 Public, 184 Private
Q4. On a daily basis, which of the following software or applications do you use at work? (Please select all that apply
Analytics
CRM
Social Media
Enterprise Resource Planning
Video or Web-based Conferencing
Collaboration
Proprietary/Custom
File Sharing
Office
10%
14%
17%
20%
29%
33%
38%
50%
94%
94%
9%
10%
15%
19%
23%
32%
33%
46%
92%
92%
12%
18%
18%
21%
35%
34%
45%
54%
95%
96%
Private SectorPublic SectorTotal
3
© 2014 SOLARWINDS WORLDWIDE, LLC. ALL RIGHTS RESERVED.

US RESULTS: Public vs. Private Sector
Rating of Applications: Most Critical (10) to Least Critical (1) for Job PerformanceMean Scores
Base: 403 Total, 215 Public, 184 Private
Q5.The following are examples of various applications you might use at work. Please rank each application using a scale from 1-10, with 10 being the most critical to doing your job and 1 being the least critical.
Analytics
CRM
Social Media
Enterprise Resource Planning
Video or Web-based Conferencing
Collaboration
Proprietary/Custom
File Sharing
Office
3.71
4.08
3.52
4.31
4.54
5.09
5.93
5.63
8.30
8.37
3.85
4.04
3.47
4.37
4.38
5.15
5.84
5.44
8.00
8.16
3.59
4.14
3.59
4.29
4.76
4.99
6.01
5.84
8.28
8.60
Private Sector
Public Sector
Total
4
© 2014 SOLARWINDS WORLDWIDE, LLC. ALL RIGHTS RESERVED.

US RESULTS: Public vs. Private Sector
How Application Performance & Availability Affects Job
Base: 403 Total, 215 Public, 184 Private
Q6. How does application performance and availability (for example, applications running slowly, applications being unavailable, connectivity problems, etc.) affect your ability to do your job?
Does not affect my job
A lack of it makes job more difficult but not impossible
Critical to accomplishing my job
7%
31%
62%
8%
29%
63%
7%
34%
59%
Private Sector
Public Sector
Total
5
© 2014 SOLARWINDS WORLDWIDE, LLC. ALL RIGHTS RESERVED.

US RESULTS: Public vs. Private Sector
Over Past 5 Years, how Application Performance & Availability Changed Ability to Perform Job
Base: 403 Total, 215 Public, 184 Private
Q7. Over the past 5 years, how has application performance and availability’s impact on your ability to do your job changed?
Application performance and availability has become less important in accomplishing my job
Application performance and availability’s impact on my ability to accomplish my job has not changed
Application performance and availability has become more important to doing my job
7%
26%
67%
9%
26%
66%
5%
28%
67%
Private Sector
Public Sector
Total
6
© 2014 SOLARWINDS WORLDWIDE, LLC. ALL RIGHTS RESERVED.
US RESULTS: Public vs. Private Sector
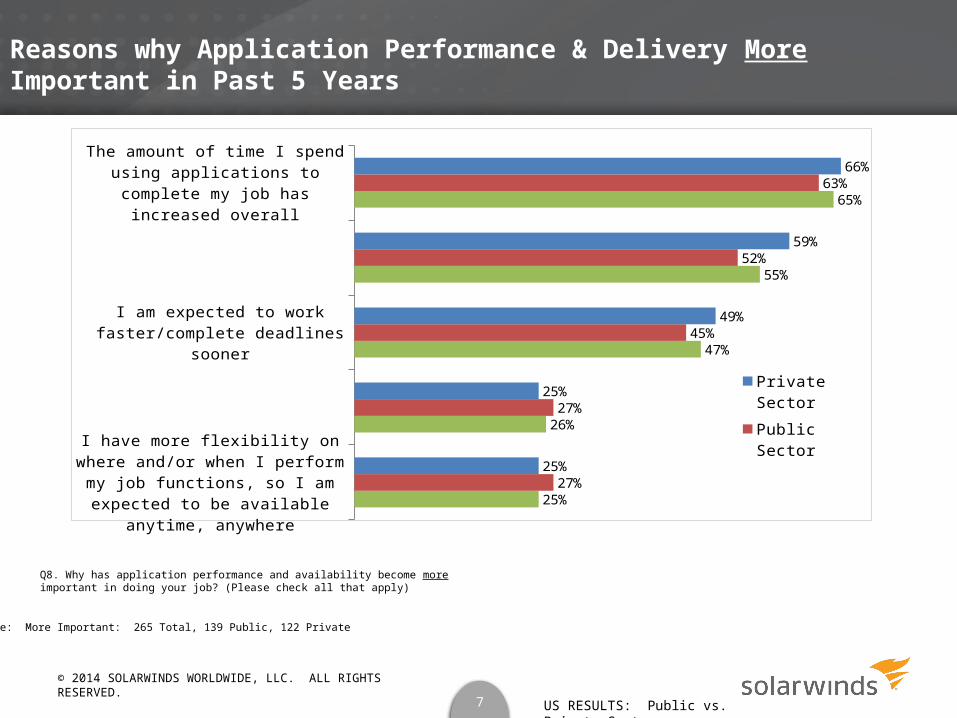
Reasons why Application Performance & Delivery More Important in Past 5 Years
Base: More Important: 265 Total, 139 Public, 122 Private
Q8. Why has application performance and availability become more important in doing your job? (Please check all that apply)
I have more flexibility on where and/or when I perform my job functions, so I am expected to be available anytime, anywhere
Financial and/or business consequences related to my work have increased
I am expected to work faster/complete deadlines sooner
My workload has increased
The amount of time I spend using applications to complete my job has increased overall
25%
26%
47%
55%
65%
27%
27%
45%
52%
63%
25%
25%
49%
59%
66%
Private Sector
Public Sector
Total
7
© 2014 SOLARWINDS WORLDWIDE, LLC. ALL RIGHTS RESERVED.

US RESULTS: Public vs. Private Sector
Number of Times Contacted IT Dept. in Past Year due to Application Performance and Availability Issues
Base: 403 Total, 215 Public, 184 Private
Q10. How many times have you contacted your organization’s IT department in the past year due to application performance and availability issues?
Balance do not have an IT department
Up to 10 Times: 67%/66%/67%
None
1 to 5
6 to 10
11 to 15
More than 15
14%
48%
19%
8%
6%
16%
45%
21%
7%
8%
13%
51%
16%
10%
4%
Private Sec-tor
Public Sector
Total
8
© 2014 SOLARWINDS WORLDWIDE, LLC. ALL RIGHTS RESERVED.

US RESULTS: Public vs. Private Sector
Whether Ever Experienced Application Performance or Availability Issue Critical to Doing Job
Base: 403 Total, 215 Public, 184 Private
Q11. Have you ever experienced a performance or availability issue related to one or more of the applications most critical to doing your job?
Yes
No
70%
30%
71%
29%
69%
31%
Private Sector
Public Sector
Total
9
© 2014 SOLARWINDS WORLDWIDE, LLC. ALL RIGHTS RESERVED.

US RESULTS: Public vs. Private Sector
Percent of Time Problem already Reported to IT Dept. and being Worked on
Base: Experienced at least one application or performance issue critical to job: 283 Total, 152 Public, 127 Private
Q12. On average, when you contact your organization’s IT department about a performance or availability issue related to the applications most critical to doing your job, what percentage of the time are you told they are already aware of the problem and/or working to resolve it?
Balance do not have an IT department/DK/NA
100-75%
75-50%
50-25%
25% or less
12%
27%
29%
25%
12%
28%
32%
24%
13%
25%
27%
24%
Private Sector
Public Sector
Total
10
© 2014 SOLARWINDS WORLDWIDE, LLC. ALL RIGHTS RESERVED.

US RESULTS: Public vs. Private Sector
Longest Waiting Time Experienced for Problem Resolution
Base: Experienced at least one application or performance issue critical to job: 283 Total, 152 Public, 127 Private
Immediately
Half hour or less
More than a half an hour, less than an hour
An hour
More than an hour
Several hours
One business day
Several business days
More than a week
2%
10%
10%
8%
16%
18%
14%
17%
5%
Q13. What’s the longest you’ve had to wait for a performance and availability issue related to an application critical to performing your job to be resolved?
One Business day to more than one week: 36%
More than one hour but within the same business day: 34%
One hour or less: 30%
11
TOTAL SAMPLE
Balance do not have an IT department/DK/NA
© 2014 SOLARWINDS WORLDWIDE, LLC. ALL RIGHTS RESERVED.
US RESULTS: Public vs. Private Sector
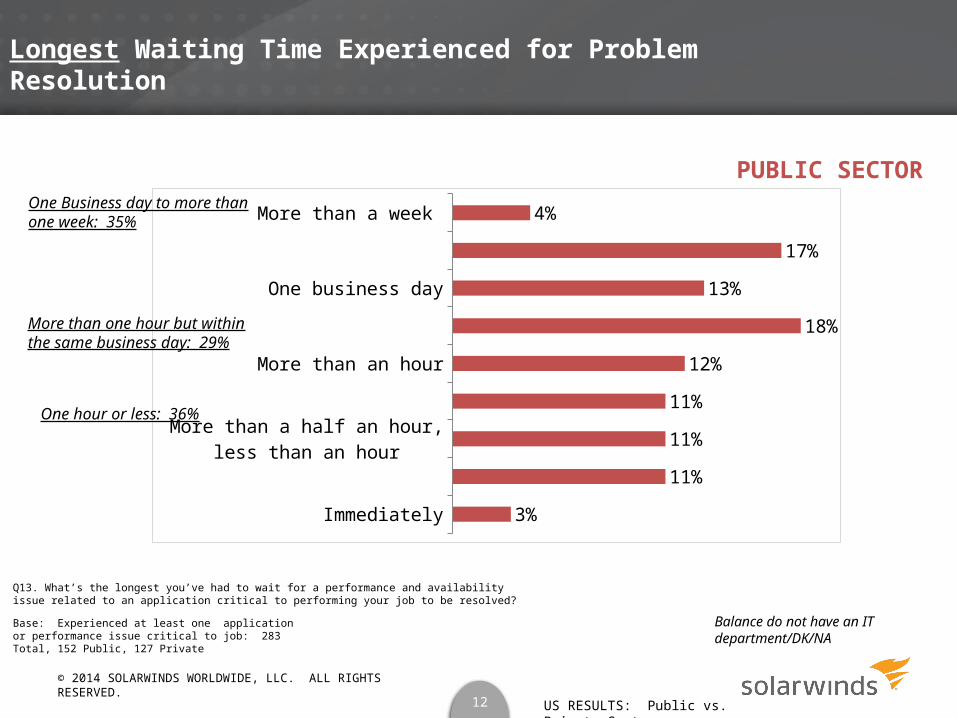
Longest Waiting Time Experienced for Problem Resolution
Base: Experienced at least one application or performance issue critical to job: 283 Total, 152 Public, 127 Private
Immediately
Half hour or less
More than a half an hour, less than an hour
An hour
More than an hour
Several hours
One business day
Several business days
More than a week
3%
11%
11%
11%
12%
18%
13%
17%
4%
Q13. What’s the longest you’ve had to wait for a performance and availability issue related to an application critical to performing your job to be resolved?
One Business day to more than one week: 35%
More than one hour but within the same business day: 29%
One hour or less: 36%
12
PUBLIC SECTOR
Balance do not have an IT department/DK/NA
© 2014 SOLARWINDS WORLDWIDE, LLC. ALL RIGHTS RESERVED.

US RESULTS: Public vs. Private Sector
Longest Waiting Time Experienced for Problem Resolution
Base: Experienced at least one application or performance issue critical to job: 283 Total, 152 Public, 127 Private
Immediately
Half hour or less
More than a half an hour, less than an hour
An hour
More than an hour
Several hours
One business day
Several business days
More than a week
1%
9%
8%
5%
21%
18%
15%
16%
6%
Q13. What’s the longest you’ve had to wait for a performance and availability issue related to an application critical to performing your job to be resolved?
One Business day to more than one week: 37%
More than one hour but within the same business day: 39%
One hour or less: 24%
13
PRIVATE SECTOR
Balance do not have an IT department/DK/NA
© 2014 SOLARWINDS WORLDWIDE, LLC. ALL RIGHTS RESERVED.

US RESULTS: Public vs. Private Sector
First to Blame for Problem
Base: Experienced at least one application or performance issue critical to job: 283 Total, 152 Public, 127 Private
Q14. When you encounter an application performance or availability issue, which of the following do you typically first assume is to blame?
Other
Application vendor
User error
IT department
Internet service provider
The application itself
3%
8%
11%
13%
20%
45%
3%
9%
15%
14%
13%
47%
3%
7%
7%
11%
28%
41%
Private Sec-torPublic SectorTotal
14
© 2014 SOLARWINDS WORLDWIDE, LLC. ALL RIGHTS RESERVED.

US RESULTS: Public vs. Private Sector
Satisfaction Level with IT Dept. Response Time with Problem Resolution
Base: Experienced at least one application or performance issue critical to job: 283 Total, 152 Public, 127 Private
Q15. How satisfied are you with your IT department’s response time in resolving application performance and availability issues?
Total Satisfied: 76%/80%/72%
Balance do not have an IT department/DK/NA
Very satisfied
Somewhat satisfied
Somewhat dissatisfied
Very dissatisfied
32%
44%
12%
5%
35%
45%
11%
6%
29%
43%
14%
4%
Private Sector
Public Sector
Total
15
© 2014 SOLARWINDS WORLDWIDE, LLC. ALL RIGHTS RESERVED.
US RESULTS: Public vs. Private Sector
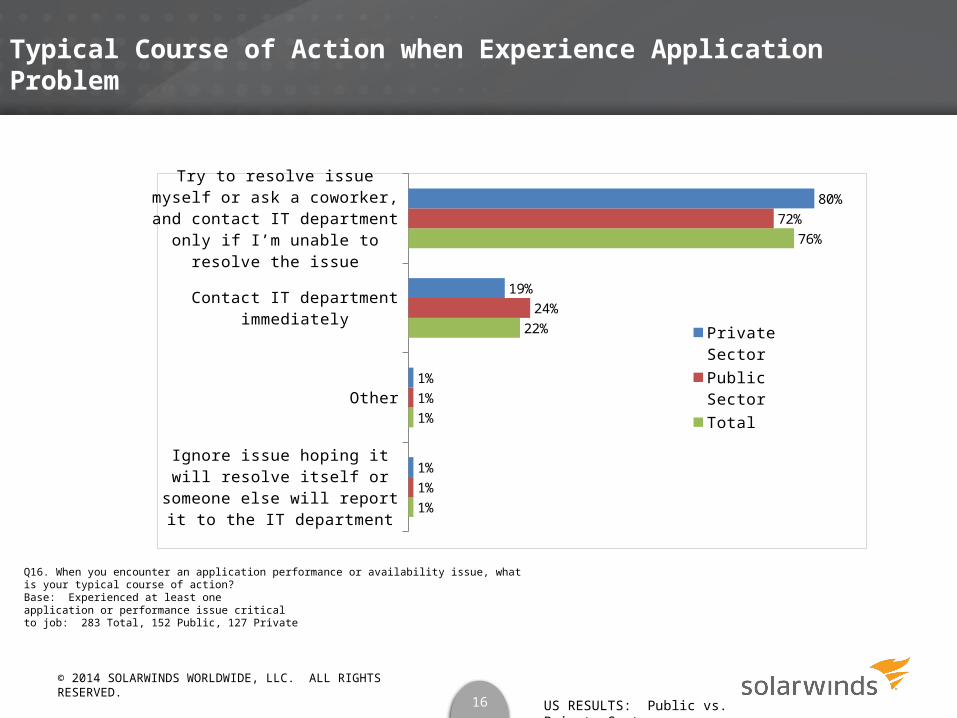
Typical Course of Action when Experience Application Problem
Base: Experienced at least one application or performance issue critical to job: 283 Total, 152 Public, 127 Private
Q16. When you encounter an application performance or availability issue, what is your typical course of action?
Ignore issue hoping it will resolve itself or someone else will report it to the IT
department
Other
Contact IT department immediately
Try to resolve issue myself or ask a coworker, and contact IT department only if I’m unable to resolve the issue
1%
1%
22%
76%
1%
1%
24%
72%
1%
1%
19%
80%
Private Sector
Public Sector
Total
16
© 2014 SOLARWINDS WORLDWIDE, LLC. ALL RIGHTS RESERVED.

US RESULTS: Public vs. Private Sector
Estimated Cost for Company caused by Slow or Unavailable Applications Critical to Job
Base: 403 Total, 215 Public, 184 Private
Q17.If you were to equate financial loss based on lost productivity or revenue to one or more of the most critical applications to doing your job being regularly slow or unavailable, how much would it cost your company per year?
Hundreds of dollars or less
Thousands of dollars
Tens of thousands of dollars
Hundreds of thousands of dollars
Millions of dollars
I don’t know
23%
24%
12%
3%
2%
36%
21%
23%
12%
4%
1%
39%
24%
24%
11%
4%
4%
33%
Private Sector
Public Sector
Total
17
© 2014 SOLARWINDS WORLDWIDE, LLC. ALL RIGHTS RESERVED.
US RESULTS: Public vs. Private Sector
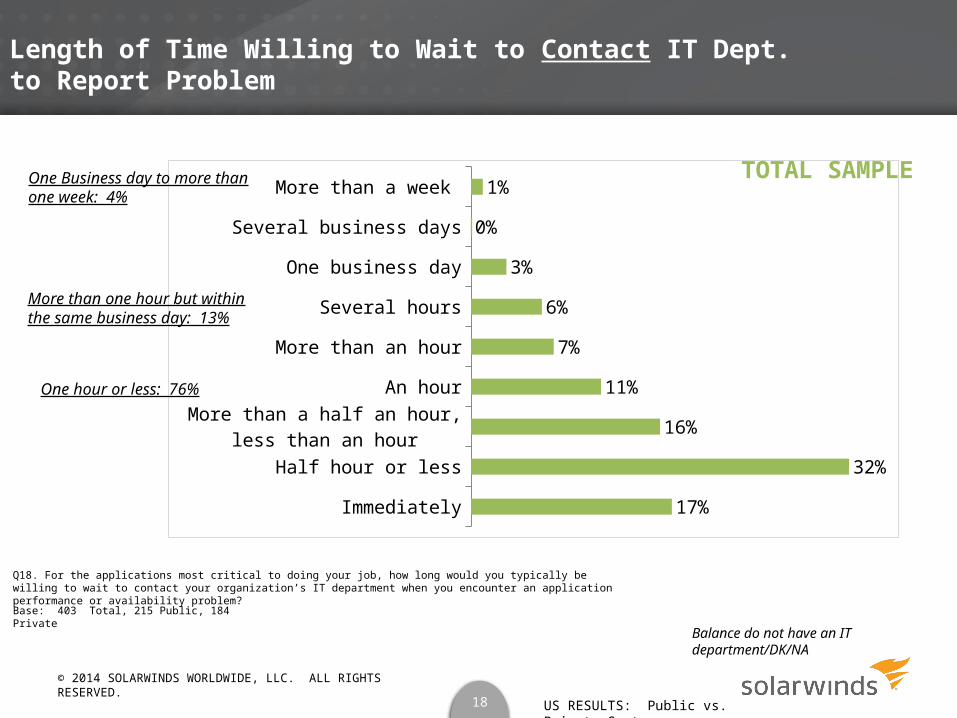
Length of Time Willing to Wait to Contact IT Dept. to Report Problem
Base: 403 Total, 215 Public, 184 Private
Immediately
Half hour or less
More than a half an hour, less than an hour
An hour
More than an hour
Several hours
One business day
Several business days
More than a week
17%
32%
16%
11%
7%
6%
3%
0%
1%
Q18. For the applications most critical to doing your job, how long would you typically be willing to wait to contact your organization’s IT department when you encounter an application performance or availability problem?
One Business day to more than one week: 4%
More than one hour but within the same business day: 13%
One hour or less: 76%
Balance do not have an IT department/DK/NA
18
TOTAL SAMPLE
© 2014 SOLARWINDS WORLDWIDE, LLC. ALL RIGHTS RESERVED.
US RESULTS: Public vs. Private Sector
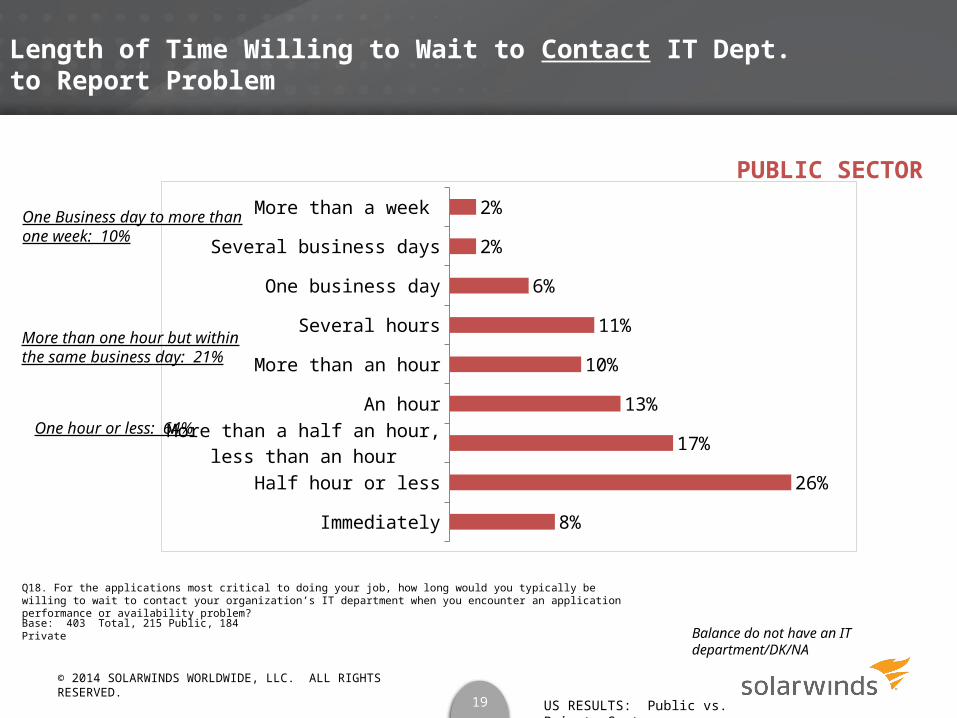
Length of Time Willing to Wait to Contact IT Dept. to Report Problem
Base: 403 Total, 215 Public, 184 Private
Immediately
Half hour or less
More than a half an hour, less than an hour
An hour
More than an hour
Several hours
One business day
Several business days
More than a week
8%
26%
17%
13%
10%
11%
6%
2%
2%
Q18. For the applications most critical to doing your job, how long would you typically be willing to wait to contact your organization’s IT department when you encounter an application performance or availability problem?
One Business day to more than one week: 10%
More than one hour but within the same business day: 21%
One hour or less: 64%
Balance do not have an IT department/DK/NA
19
PUBLIC SECTOR
© 2014 SOLARWINDS WORLDWIDE, LLC. ALL RIGHTS RESERVED.
US RESULTS: Public vs. Private Sector
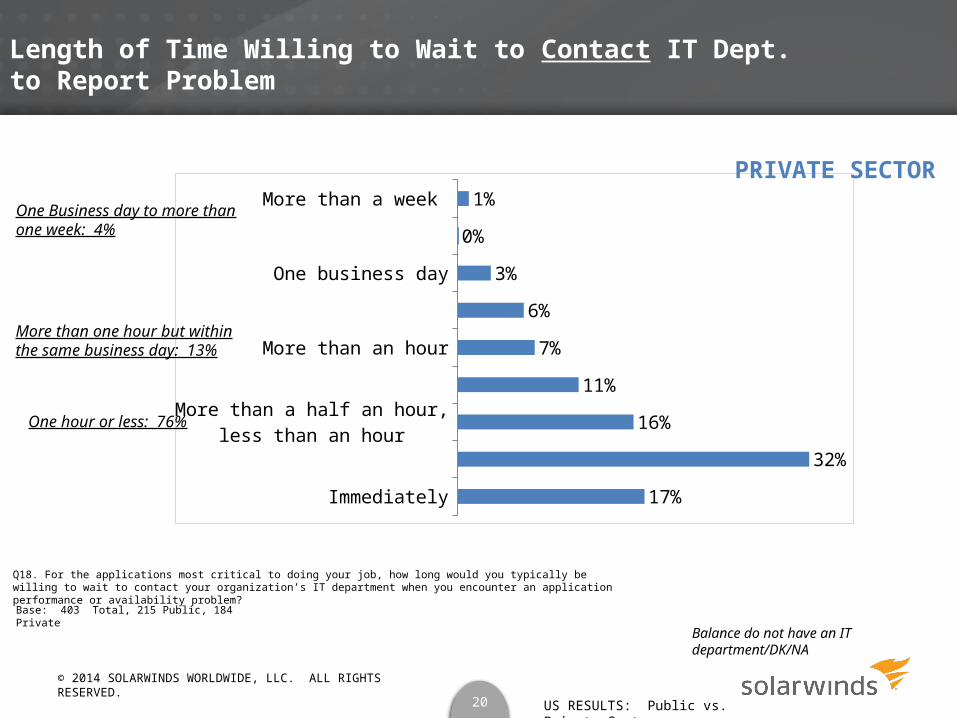
Length of Time Willing to Wait to Contact IT Dept. to Report Problem
Base: 403 Total, 215 Public, 184 Private
Immediately
Half hour or less
More than a half an hour, less than an hour
An hour
More than an hour
Several hours
One business day
Several business days
More than a week
17%
32%
16%
11%
7%
6%
3%
0%
1%
Q18. For the applications most critical to doing your job, how long would you typically be willing to wait to contact your organization’s IT department when you encounter an application performance or availability problem?
One Business day to more than one week: 4%
More than one hour but within the same business day: 13%
One hour or less: 76%
Balance do not have an IT department/DK/NA
20
PRIVATE SECTOR
© 2014 SOLARWINDS WORLDWIDE, LLC. ALL RIGHTS RESERVED.
US RESULTS: Public vs. Private Sector
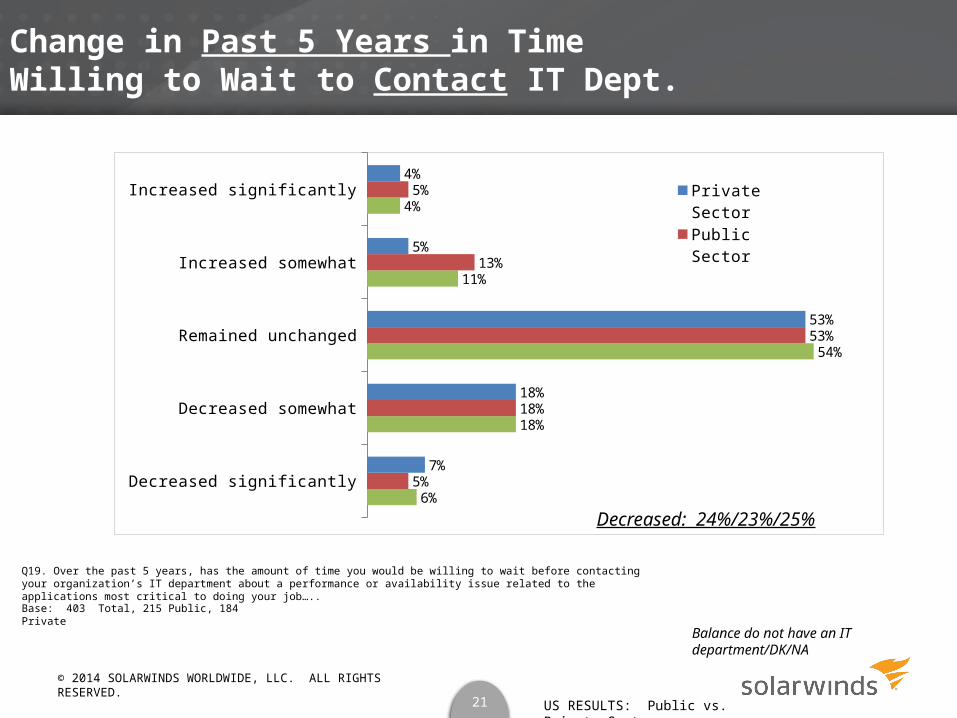
Change in Past 5 Years in Time Willing to Wait to Contact IT Dept.
Base: 403 Total, 215 Public, 184 Private
Q19. Over the past 5 years, has the amount of time you would be willing to wait before contacting your organization’s IT department about a performance or availability issue related to the applications most critical to doing your job…..
Decreased: 24%/23%/25%
Balance do not have an IT department/DK/NA
Decreased significantly
Decreased somewhat
Remained unchanged
Increased somewhat
Increased significantly
6%
18%
54%
11%
4%
5%
18%
53%
13%
5%
7%
18%
53%
5%
4%Private Sec-torPublic SectorTotal
21
© 2014 SOLARWINDS WORLDWIDE, LLC. ALL RIGHTS RESERVED.

US RESULTS: Public vs. Private Sector
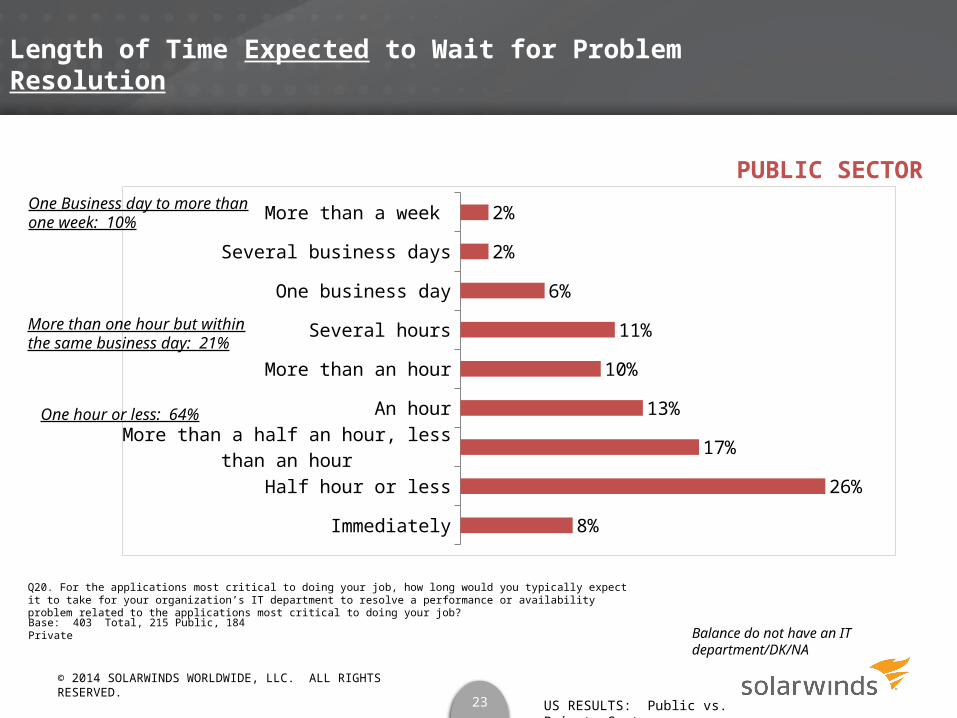
Length of Time Expected to Wait for Problem Resolution
Base: 403 Total, 215 Public, 184 Private
Immediately
Half hour or less
More than a half an hour, less than an hour
An hour
More than an hour
Several hours
One business day
Several business days
More than a week
8%
27%
16%
16%
9%
9%
4%
1%
1%
Q20. For the applications most critical to doing your job, how long would you typically expect it to take for your organization’s IT department to resolve a performance or availability problem related to the applications most critical to doing your job?
One Business day to more than one week: 6%
More than one hour but within the same business day: 18%
One hour or less: 67%
Balance do not have an IT department/DK/NA
22
TOTAL SAMPLE
© 2014 SOLARWINDS WORLDWIDE, LLC. ALL RIGHTS RESERVED.
US RESULTS: Public vs. Private Sector
Length of Time Expected to Wait for Problem Resolution
Base: 403 Total, 215 Public, 184 Private
Immediately
Half hour or less
More than a half an hour, less than an hour
An hour
More than an hour
Several hours
One business day
Several business days
More than a week
8%
26%
17%
13%
10%
11%
6%
2%
2%
Q20. For the applications most critical to doing your job, how long would you typically expect it to take for your organization’s IT department to resolve a performance or availability problem related to the applications most critical to doing your job?
One Business day to more than one week: 10%
More than one hour but within the same business day: 21%
One hour or less: 64%
Balance do not have an IT department/DK/NA
23
PUBLIC SECTOR
© 2014 SOLARWINDS WORLDWIDE, LLC. ALL RIGHTS RESERVED.

US RESULTS: Public vs. Private Sector
Length of Time Expected to Wait for Problem Resolution
Base: 403 Total, 215 Public, 184 Private
Immediately
Half hour or less
More than a half an hour, less than an hour
An hour
More than an hour
Several hours
One business day
Several business days
More than a week
7%
27%
16%
18%
8%
7%
3%
1%
0%
Q20. For the applications most critical to doing your job, how long would you typically expect it to take for your organization’s IT department to resolve a performance or availability problem related to the applications most critical to doing your job?
One Business day to more than one week: 4%
More than one hour but within the same business day: 15%
One hour or less: 68%
Balance do not have an IT department/DK/NA
24
PRIVATE SECTOR
© 2014 SOLARWINDS WORLDWIDE, LLC. ALL RIGHTS RESERVED.

US RESULTS: Public vs. Private Sector
Change in Past 5 Years in Time Willing to Wait for Problem Resolution
Base: 403 Total, 215 Public, 184 Private
Q21. Over the past 5 years, has the amount of time you would be willing to wait for your organization’s IT department to resolve a performance or availability problem related to the applications most critical to doing your job….
Decreased: 23%/20%/26%
Balance do not have an IT department/DK/NA
Decreased significantly
Decreased somewhat
Remained unchanged
Increased somewhat
Increased significantly
5%
18%
56%
11%
3%
4%
16%
59%
13%
2%
6%
20%
52%
8%
3%
Private Sector
Public Sector
Total
25
© 2014 SOLARWINDS WORLDWIDE, LLC. ALL RIGHTS RESERVED.
US RESULTS: Public vs. Private Sector
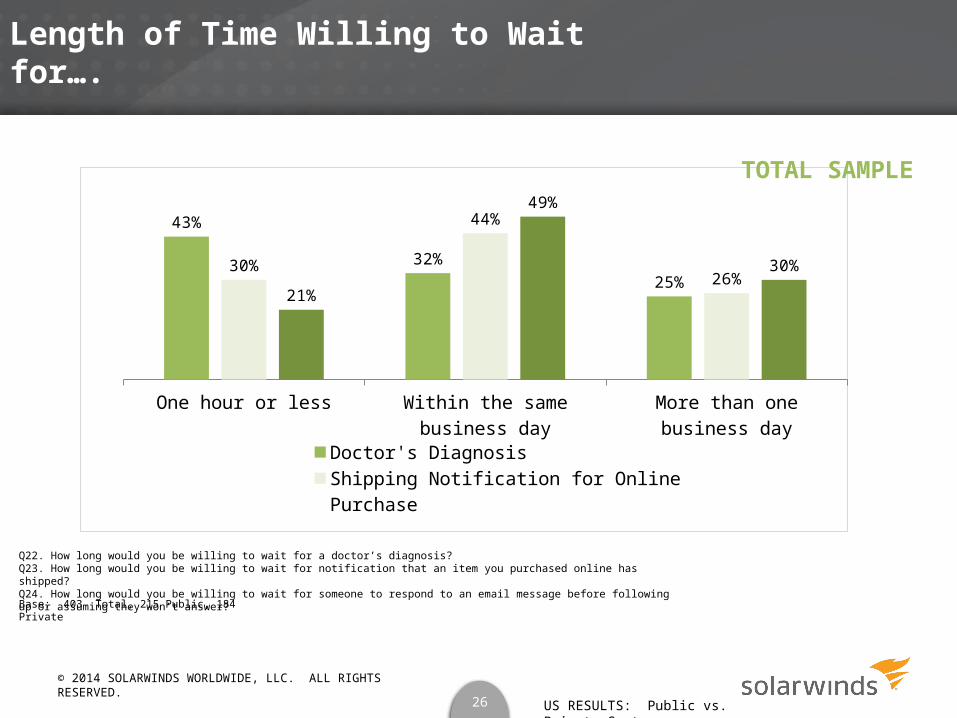
Length of Time Willing to Wait for….
One hour or less Within the same business day More than one business day
43%
32%25%
30%
44%
26%21%
49%
30%
Doctor's DiagnosisShipping Notification for Online PurchaseResponse to Email Message
Q22. How long would you be willing to wait for a doctor’s diagnosis?Q23. How long would you be willing to wait for notification that an item you purchased online has shipped?Q24. How long would you be willing to wait for someone to respond to an email message before following up or assuming they won’t answer?
Base: 403 Total, 215 Public, 184 Private
26
TOTAL SAMPLE
© 2014 SOLARWINDS WORLDWIDE, LLC. ALL RIGHTS RESERVED.
US RESULTS: Public vs. Private Sector
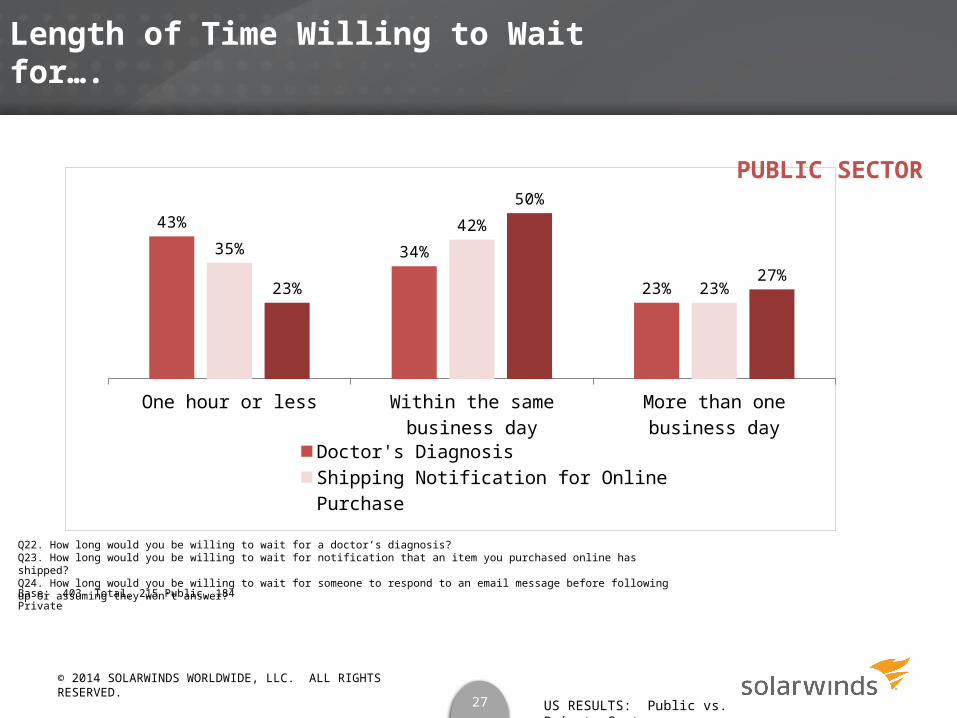
Length of Time Willing to Wait for….
One hour or less Within the same business day More than one business day
43%
34%
23%
35%42%
23%23%
50%
27%
Doctor's DiagnosisShipping Notification for Online PurchaseResponse to Email Message
Q22. How long would you be willing to wait for a doctor’s diagnosis?Q23. How long would you be willing to wait for notification that an item you purchased online has shipped?Q24. How long would you be willing to wait for someone to respond to an email message before following up or assuming they won’t answer?
Base: 403 Total, 215 Public, 184 Private
27
PUBLIC SECTOR
© 2014 SOLARWINDS WORLDWIDE, LLC. ALL RIGHTS RESERVED.
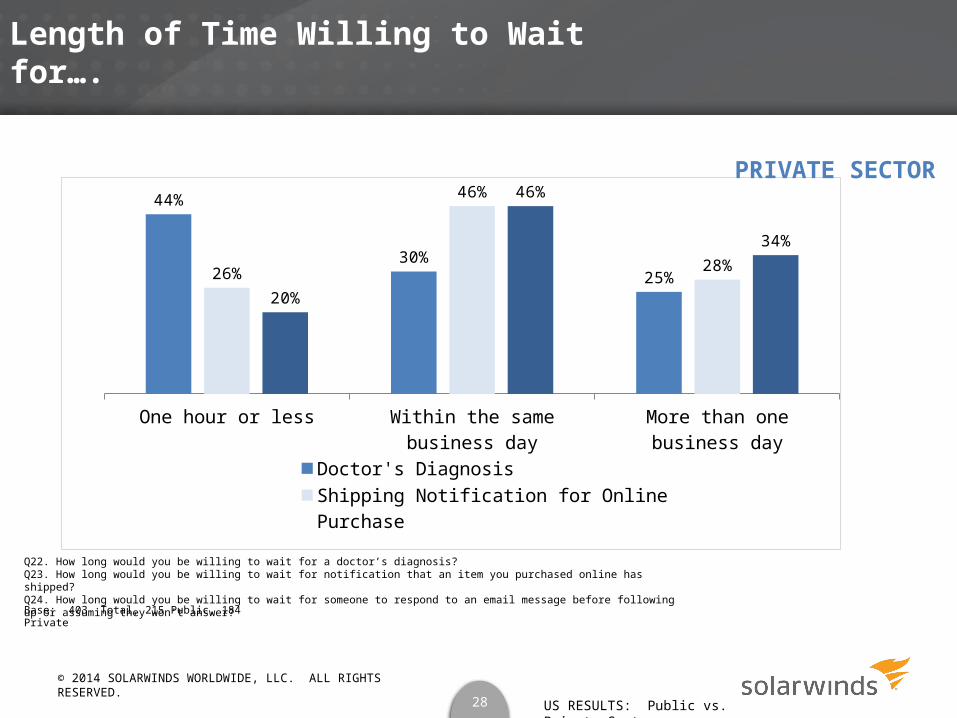
US RESULTS: Public vs. Private Sector
Length of Time Willing to Wait for….
One hour or less Within the same business day More than one business day
44%
30%25%26%
46%
28%
20%
46%
34%
Doctor's DiagnosisShipping Notification for Online PurchaseResponse to Email Message
Q22. How long would you be willing to wait for a doctor’s diagnosis?Q23. How long would you be willing to wait for notification that an item you purchased online has shipped?Q24. How long would you be willing to wait for someone to respond to an email message before following up or assuming they won’t answer?
Base: 403 Total, 215 Public, 184 Private
28
PRIVATE SECTOR
© 2014 SOLARWINDS WORLDWIDE, LLC. ALL RIGHTS RESERVED.

US RESULTS: Public vs. Private Sector
Length of Time Willing to Wait for….
1-10 seconds 11-20 seconds 21-30 seconds More than 30 seconds
25%
38%
23%
14%
24%
37%
23%
16%
News Website to Load Before Moving to Alternate Site
Online Video to Load before Moving On
Q25. How long would you be willing to wait for a news website to load before moving on to an alternative site?Q26. How would you be willing to wait for an online video to load and play before moving on?
Base: 403 Total, 215 Public, 184 Private
20 seconds or less: 63%
20 seconds or less: 61%
29
TOTAL SAMPLE
© 2014 SOLARWINDS WORLDWIDE, LLC. ALL RIGHTS RESERVED.

US RESULTS: Public vs. Private Sector
Length of Time Willing to Wait for….
1-10 seconds 11-20 seconds 21-30 seconds More than 30 seconds
25%
36%
22%
16%
26%
35%
21%18%
News Website to Load Before Moving to Alternate Site
Online Video to Load before Moving On
Q25. How long would you be willing to wait for a news website to load before moving on to an alternative site?Q26. How would you be willing to wait for an online video to load and play before moving on?
Base: 403 Total, 215 Public, 184 Private
20 seconds or less: 61%
20 seconds or less: 61%
30
PUBLIC SECTOR
© 2014 SOLARWINDS WORLDWIDE, LLC. ALL RIGHTS RESERVED.
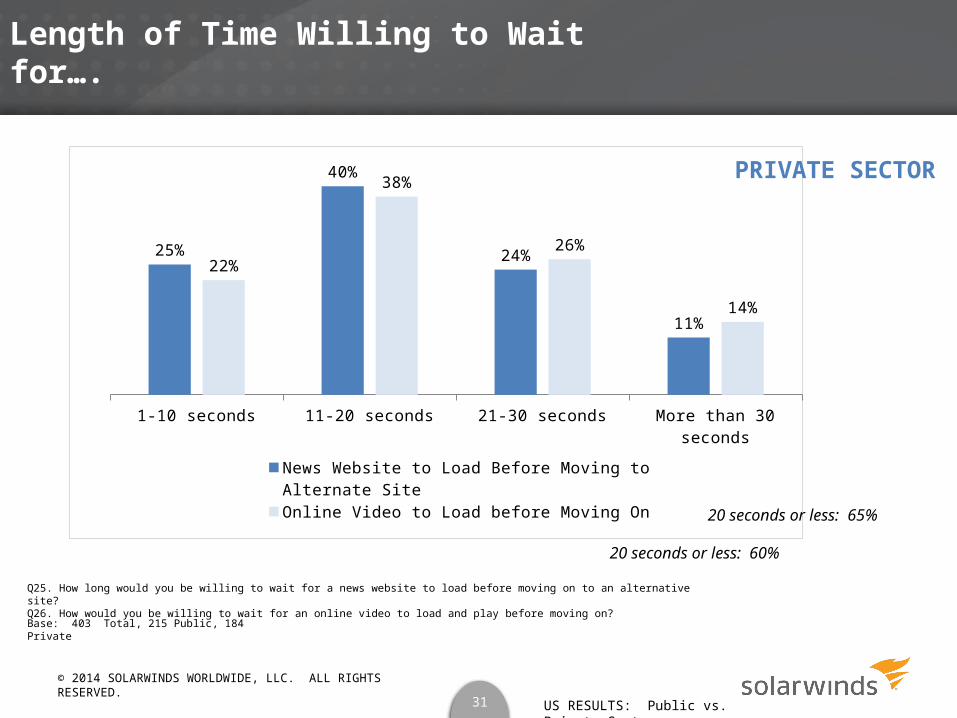
US RESULTS: Public vs. Private Sector
Length of Time Willing to Wait for….
1-10 seconds 11-20 seconds 21-30 seconds More than 30 seconds
25%
40%
24%
11%
22%
38%
26%
14%
News Website to Load Before Moving to Alternate Site
Online Video to Load before Moving On
Q25. How long would you be willing to wait for a news website to load before moving on to an alternative site?Q26. How would you be willing to wait for an online video to load and play before moving on?
Base: 403 Total, 215 Public, 184 Private
20 seconds or less: 65%
20 seconds or less: 60%
31
PRIVATE SECTOR
© 2014 SOLARWINDS WORLDWIDE, LLC. ALL RIGHTS RESERVED.
32
Appendix
© 2014 SOLARWINDS WORLDWIDE, LLC. ALL RIGHTS RESERVED.

US RESULTS: Public vs. Private Sector
Examples Provided to Respondents for Software or Applications (shortened for reporting purposes)
• Email applications (for example, Microsoft Exchange, Lotus Notes, etc.)
• Video or Web-based conferencing applications (for example, Adobe Connect/Defense Connect Online, Cisco WebEx, Citrix, Skype, etc.)
• Office applications (for example, Microsoft Word, Apple Keynote, Google Sheets)
• File sharing applications (for example, Internal/proprietary server or storage, SharePoint, Dropbox, Google Drive, etc.)
• Social media applications (for example, HootSuite, Tweetdeck, SocialOomph, etc.)
• Collaboration applications (for example, Microsoft Lync, Confluence, Microsoft Sharepoint, Google Docs, etc.)
• Analytics applications (for example, SAS, Tableau, SiSense, etc.)
• Enterprise resource planning applications (for example, SAP, PeopleSoft, etc.)
• CRM applications (Salesforce Sales Cloud, NetSuite CRM, Microsoft Dynamics, etc.)
• Proprietary/custom business applications (for example, inventory, accounting and logistics applications, etc.)
33
© 2014 SOLARWINDS WORLDWIDE, LLC. ALL RIGHTS RESERVED.

US RESULTS: Public vs. Private Sector
Demographics/Corpographics
Male25%
Female75%
Base: 403 Total, 215 Public, 184 Private
18-24 25-34 35-44 45-54 55+
4%
33%25%
18% 19%
Administrative/AssistantClerical
SupervisorProject Manager
ManagerDirector
Managing DirectorVice President/Senior VP/Executive VP
Owner or PartnerOther
23%18%
7%9%
15%5%
1%2%
1%17%
Position
Northeast Southeast Midwest West
25%31% 29%
16%
Region
34
TOTAL SAMPLE
© 2014 SOLARWINDS WORLDWIDE, LLC. ALL RIGHTS RESERVED.
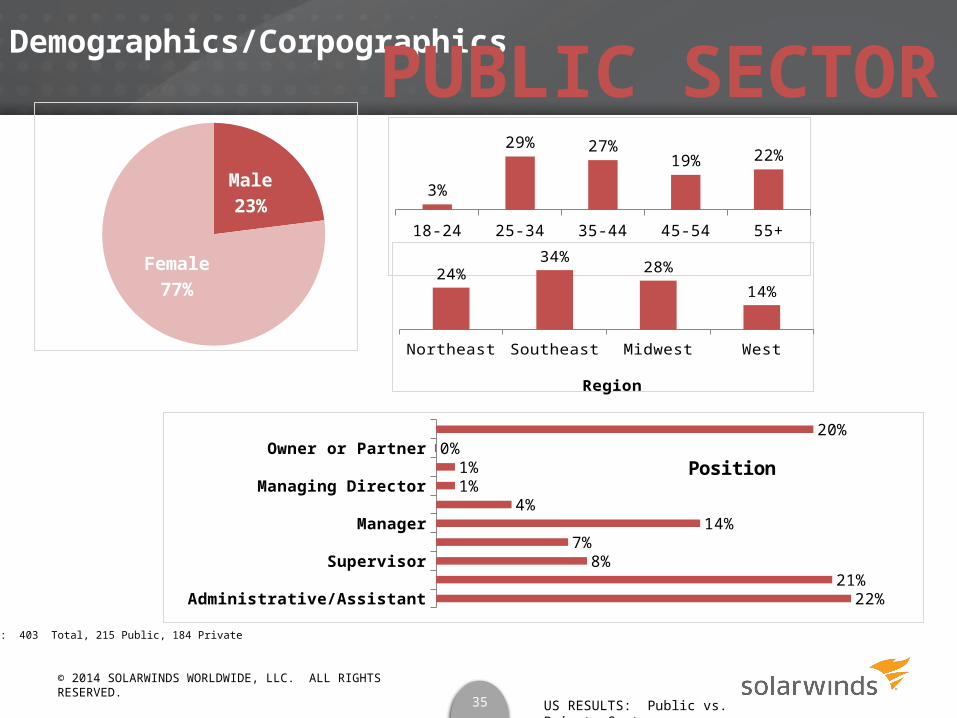
US RESULTS: Public vs. Private Sector
Demographics/Corpographics
Male23%
Female77%
Base: 403 Total, 215 Public, 184 Private
18-24 25-34 35-44 45-54 55+
3%
29% 27%19% 22%
Administrative/AssistantClerical
SupervisorProject Manager
ManagerDirector
Managing DirectorVice President/Senior VP/Executive VP
Owner or PartnerOther
22%21%
8%7%
14%4%
1%1%
0%20%
Position
Northeast Southeast Midwest West
24%34%
28%
14%
Region
35
PUBLIC SECTOR
© 2014 SOLARWINDS WORLDWIDE, LLC. ALL RIGHTS RESERVED.
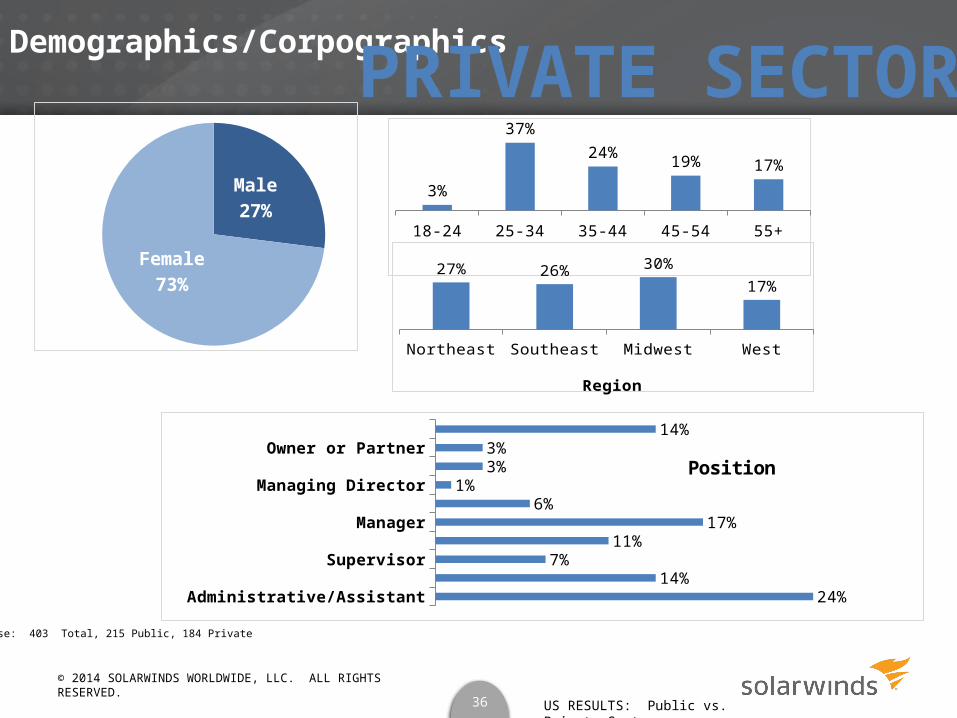
US RESULTS: Public vs. Private Sector
Demographics/Corpographics
Male27%
Female73%
Base: 403 Total, 215 Public, 184 Private
18-24 25-34 35-44 45-54 55+
3%
37%24% 19% 17%
Administrative/AssistantClerical
SupervisorProject Manager
ManagerDirector
Managing DirectorVice President/Senior VP/Executive VP
Owner or PartnerOther
24%14%
7%11%
17%6%
1%3%3%
14%
Position
Northeast Southeast Midwest West
27% 26% 30%17%
Region
36
PRIVATE SECTOR
© 2014 SOLARWINDS WORLDWIDE, LLC. ALL RIGHTS RESERVED.

US RESULTS: Public vs. Private Sector
Demographics/Corpographics
Base: 403 Total, 215 Public, 184 Private
Accounting/Finance
Communications
Creative
Engineering
IT
Law/Public Affairs
Marketing/Sales
Operations
Procurement
Other
17%
4%
3%
7%
11%
6%
6%
13%
2%
30%
Dept./Function
Less than 10
11 to 19 20-40 41-60 61-99 100-150 151-199 200-299 300-399 400-499 500-599 600-699 700 -799
800-899 900-999 1000-1999
2,000 or more
I Don’t know
7% 5% 6% 5% 3%6% 4% 6%
3% 3% 4% 2% 1% 1% 2%
8%
29%
5%
No. Employees
Yes53%
No46%
It's complicated1%Co. in Public Sector
37
TOTAL SAMPLE
© 2014 SOLARWINDS WORLDWIDE, LLC. ALL RIGHTS RESERVED.

US RESULTS: Public vs. Private Sector
Demographics/Corpographics
Base: 403 Total, 215 Public, 184 Private
Accounting/Finance
Communications
Creative
Engineering
IT
Law/Public Affairs
Marketing/Sales
Operations
Procurement
Other
17%
6%
4%
6%
12%
4%
4%
13%
2%
32%
Dept./Function
Less than 10
11 to 19 20-40 41-60 61-99 100-150 151-199 200-299 300-399 400-499 500-599 600-699 700 -799
800-899 900-999 1000-1999
2,000 or more
I Don’t know
5%1%
6%2% 2%
6% 5% 7%2% 4% 4% 2% 1% 1% 2%
10%
34%
6%
No. Employees
38
PUBLIC SECTOR
© 2014 SOLARWINDS WORLDWIDE, LLC. ALL RIGHTS RESERVED.

US RESULTS: Public vs. Private Sector
Demographics/Corpographics
Base: 403 Total, 215 Public, 184 Private
Accounting/Finance
Communications
Creative
Engineering
IT
Law/Public Affairs
Marketing/Sales
Operations
Procurement
Other
17%
2%
2%
8%
10%
9%
9%
13%
2%
27%
Dept./Function
Less than 10
11 to 19 20-40 41-60 61-99 100-150 151-199 200-299 300-399 400-499 500-599 600-699 700 -799
800-899 900-999 1000-1999
2,000 or more
I Don’t know
10% 10%7% 9%
4% 5%2% 4% 3% 2%
5%2% 2% 1% 2%
5%
23%
4%
No. Employees
39
PRIVATE SECTOR
© 2014 SOLARWINDS WORLDWIDE, LLC. ALL RIGHTS RESERVED.
40
Methodology
» Redshift Research conducted this study on behalf of Text 100 and Solarwinds.
» The survey was carried out in accordance with the Market Research Society’s code of conduct, which guarantees anonymity to all respondents, and was designed to measure the attitudes of Small Businesses regarding Technology.
» Research was conducted in June, 2014 using an email invitation and an online survey.
» The survey was conducted among 1,816 respondents 18 years of age or older were currently employed in an office environment full time. All were required to use at least one type of computer software application to qualify (including email). No restrictions were placed on the size or type of company where the respondent worked. The study was conducted in the following countries: Australia (n=201), Brazil (n=207), Denmark (n=200), Germany (n=300), Singapore (n=202), US (n=403), and the UK (n=303). In Brazil and Germany, the respondents answered the survey in-language.
» The data were set to ensure reliable and accurate representation of the total populations aged 18 and older. Results of any sample are subject to sampling variation. The magnitude of the variation is measurable and is affected by the number of interviews and the level of the percentages expressing the results. In this particular study, the chances are 95 in 100 that a survey result does not vary, plus or minus, by more than between 4.88 and 6.91 percentage points from the result that would be obtained if interviews had been conducted with all persons in the universe represented by the sample.
» Sample was selected from the Crowdology panel. Crowdology™ is an online panel owned and operated by Redshift Research.
The Crowdology™ panel is balanced across regional, age and gender demographic factors, and is nationally representative of the US population. Each respondent completes 120 profiling questions before being accepted to join our panel. Panel Quality Management is carried out frequently to ensure reliable surveys.
© 2014 SOLARWINDS WORLDWIDE, LLC. ALL RIGHTS RESERVED.
41
Contact Info
Guy WasherManaging Director
Tel: +441732 356399Mob: +447872024910
Lisa BellaUS Vice President
Tel: 212-539-3214
US Office UK Office
212-539-3214 +441732 356399300 Park Ave South Commotion House11th Floor Morley RoadNew York Tonbridge, KentNY 10010 TN9 1 RA
While Redshift is based in the UK and US, the company works across the globe, across time zones and languages. Our consortium relationships give us access to almost 10 million respondents in 46 countries worldwide. Although Redshift specializes in providing services to Marketing Communications companies (the Crowdology polling panel, for example) it has a long pedigree of full service research project execution across industry sectors. Redshift Research is adept at executing focus groups, face-to-face interviews, telephone interviews, online research, desk research and statistical modelling, to mention just a few techniques.
www.redshiftresearch.co.uk
www. crowdologyresearch.com
© 2014 SOLARWINDS WORLDWIDE, LLC. ALL RIGHTS RESERVED.

Thank You!
The SOLARWINDS and SOLARWINDS & Design marks are the exclusive property of SolarWinds Worldwide, LLC, are registered with the U.S. Patent
and Trademark Office, and may be registered or pending registration in other countries. All other SolarWinds trademarks, service marks, and logos may be common law marks, registered or pending registration in the United
States or in other countries. All other trademarks mentioned herein are used for identification purposes only and may be or are trademarks or
registered trademarks of their respective companies.
© 2014 SOLARWINDS WORLDWIDE, LLC. ALL RIGHTS RESERVED.