Embed Size (px)
Citation preview
Smart Operations Enabling Optimization through Connected Enterprise
2 © 2015 Honeywell International All Rights Reserved
Outline
• What is Smart Operations
• Value Proposition
• Engagement Approach – Examples
• Q & A
3 © 2015 Honeywell International All Rights Reserved
Background
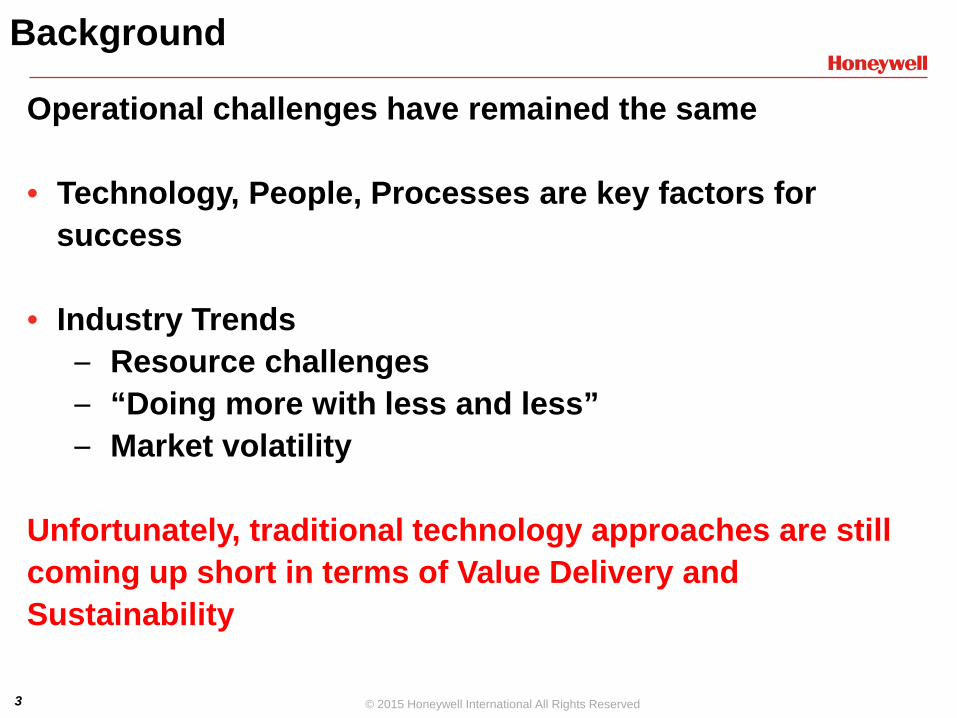
Operational challenges have remained the same
• Technology, People, Processes are key factors for success
• Industry Trends
– Resource challenges – “Doing more with less and less” – Market volatility
Unfortunately, traditional technology approaches are still coming up short in terms of Value Delivery and Sustainability
4 © 2015 Honeywell International All Rights Reserved
Background
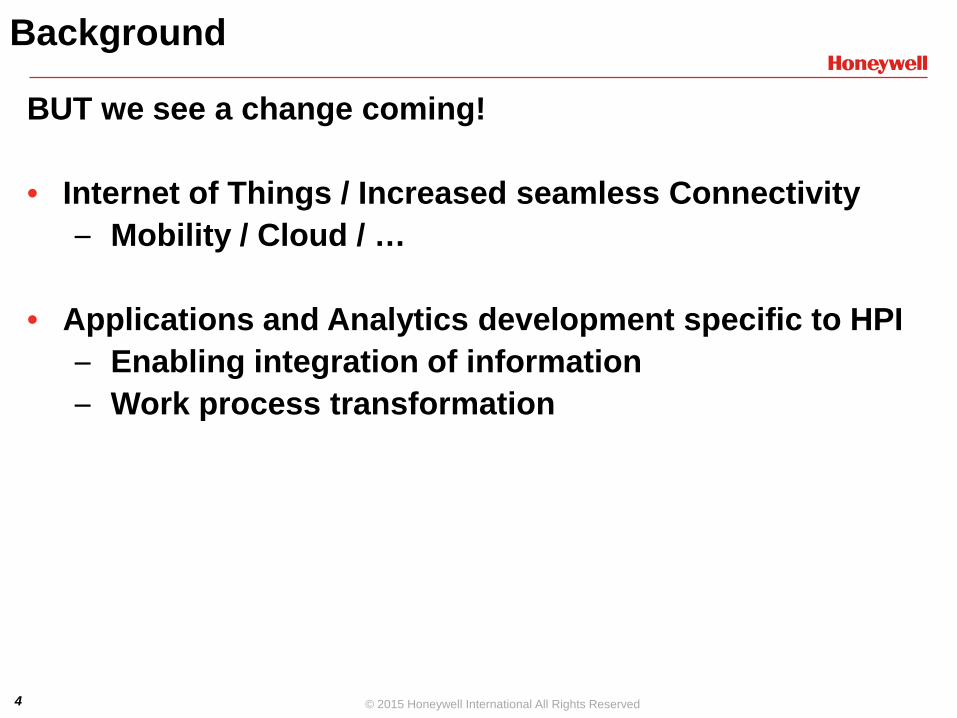
BUT we see a change coming! • Internet of Things / Increased seamless Connectivity
– Mobility / Cloud / … • Applications and Analytics development specific to HPI
– Enabling integration of information – Work process transformation
5 © 2015 Honeywell International All Rights Reserved
Smart Operations
Value-driven, consultative approach to technology deployment for the Enterprise • Connects operational decisions to business objectives
to improve profitability without compromising safety and reliability.
• Transforms existing work processes to ensure sustainable technology deployment
Enabling Optimization through Connected Enterprise
6 © 2015 Honeywell International All Rights Reserved
Enterprise Challenges
• Are you facing challenges in driving the operational performance of your assets and sites to align with overall business goals?
• Can you monitor the performance of these assets in real time to drive actions where you can be competitive and generate value for your shareholders?
• Are you getting the most out of your technology and people investments?
Enabling Optimization through Connected Enterprise
7 © 2015 Honeywell International All Rights Reserved
Typical Operations
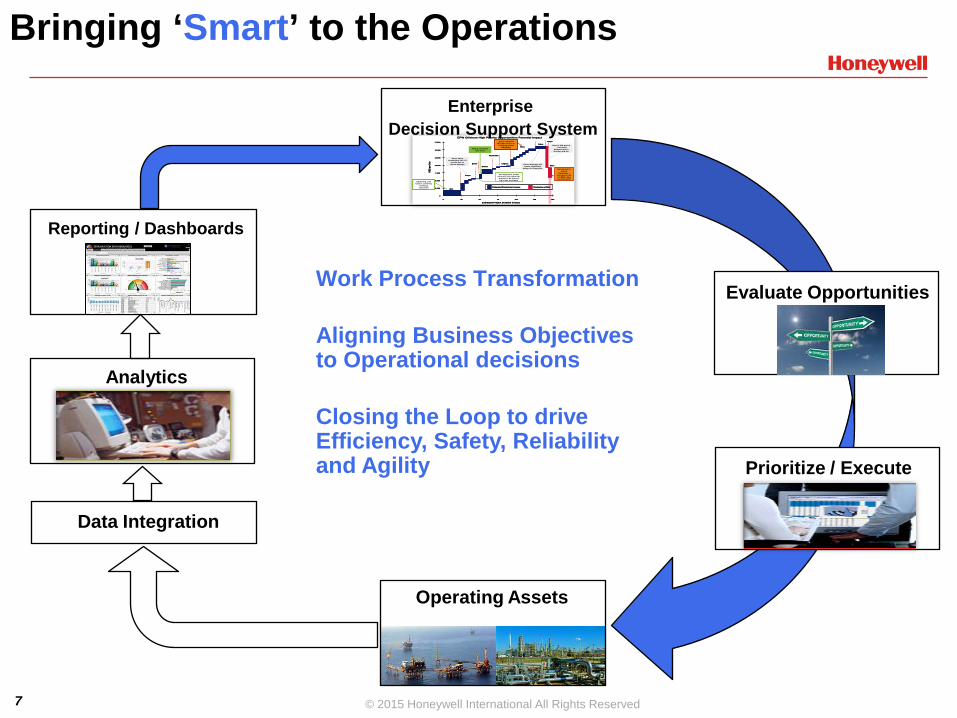
Operating Assets
Bringing ‘Smart’ to the Operations
Data Integration
Analytics
Reporting / Dashboards
EPW Offshore High Priority Opportunities Potential Impact
15,000
0
0
10,000
5,000
12,500
7,500
2,500
1501005025 75 125
Alex
Auger
Boxer
Brutus
Bullwinkle
Cognac
17,500
Mars
Salsa
BEQ
per D
ay
Estimated Project Duration in Days
Auger
Mars
Production at RiskEstimated Production Increase
EPW Offshore High Priority Opportunities Potential Impact
15,000
0
0
10,000
5,000
12,500
7,500
2,500
1501005025 75 125
Alex
Auger
Boxer
Brutus
Bullwinkle
Cognac
17,500
Mars
Salsa
BEQ
per D
ay
Estimated Project Duration in Days
Auger
Mars
Production at RiskEstimated Production Increase
15,000
0
0
10,000
5,000
12,500
7,500
2,500
1501005025 75 125
Alex
Auger
Boxer
Brutus
Bullwinkle
Cognac
17,500
Mars
Salsa
BEQ
per D
ay
Estimated Project Duration in Days
Auger
Mars
Production at RiskEstimated Production Increase Production at RiskEstimated Production Increase
Next in WS queue- Currently
delayed due to Gustav and Ike
Being executed this week
Re-alignment of WS foremen may allow for project to be moved up in the schedule
Asset likely unavailable for 2-3
weeks due to storm damage
Obtaining a lift boat is currently
delaying execution
Can’t complete WS jobs due to A-
8 drilling (2,000 BEQ/day)
Moved out to end of
December -Increased risk of BEQ / day loss by 9,200
Storm damage will create significant
delays in execution
Enterprise Decision Support System
Evaluate Opportunities
Prioritize / Execute
Work Process Transformation Aligning Business Objectives to Operational decisions Closing the Loop to drive Efficiency, Safety, Reliability and Agility
8 © 2015 Honeywell International All Rights Reserved
Who can benefit from Smart Operations
• Multiple, geographically distributed sites/assets
• Large site with multiple processing areas, integrated complex
• Competitive market segment / geographical region
• Culture – Centralized key functions or organization structure to drive
key business initiatives via a corporate team – CRM, ERP,.. – Focus on value delivered – has an organization to support
9 © 2015 Honeywell International All Rights Reserved
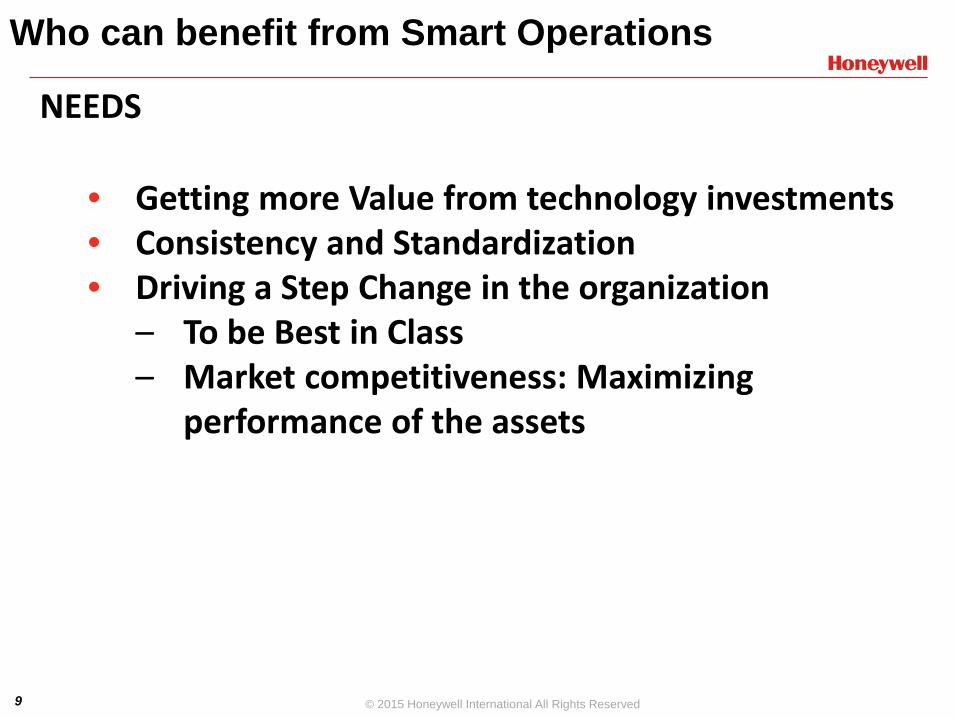
Who can benefit from Smart Operations
NEEDS
• Getting more Value from technology investments • Consistency and Standardization • Driving a Step Change in the organization
– To be Best in Class – Market competitiveness: Maximizing
performance of the assets
10 © 2015 Honeywell International All Rights Reserved
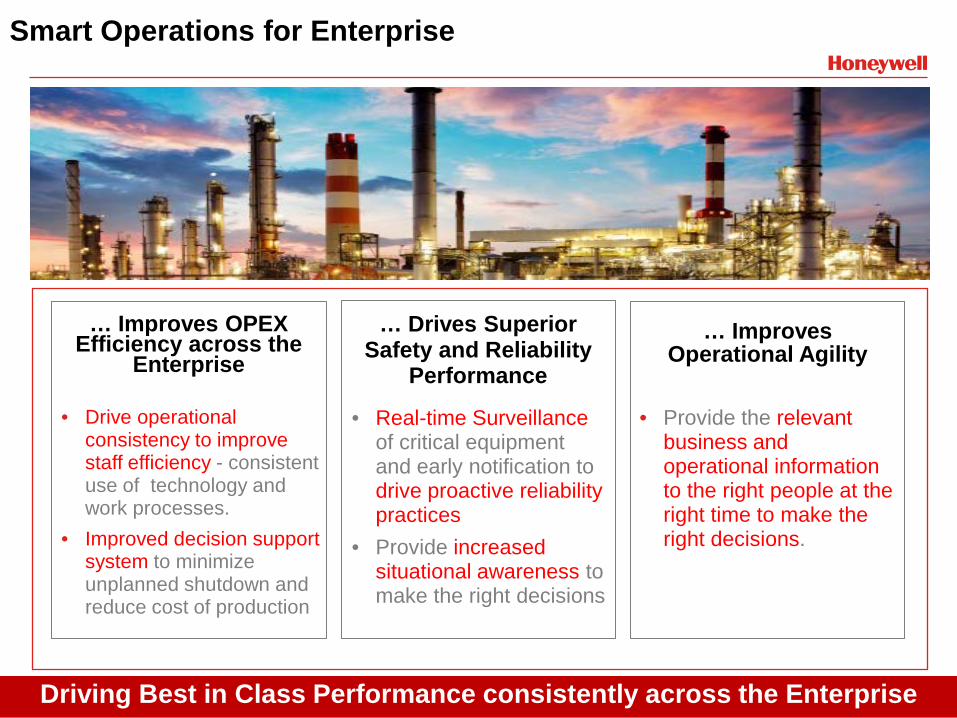
Smart Operations for Enterprise
… Drives Superior Safety and Reliability
Performance
… Improves OPEX Efficiency across the
Enterprise … Improves
Operational Agility
• Drive operational consistency to improve staff efficiency - consistent use of technology and work processes.
• Improved decision support system to minimize unplanned shutdown and reduce cost of production
• Real-time Surveillance of critical equipment and early notification to drive proactive reliability practices
• Provide increased situational awareness to make the right decisions
• Provide the relevant business and operational information to the right people at the right time to make the right decisions.
Driving Best in Class Performance consistently across the Enterprise
11 © 2015 Honeywell International All Rights Reserved
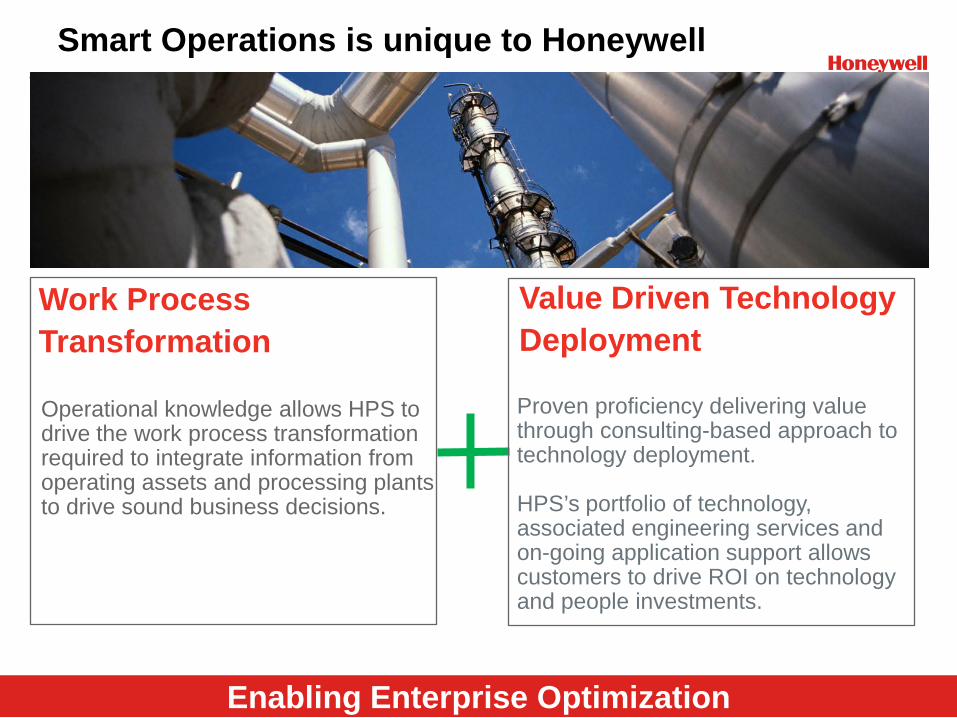
Smart Operations is unique to Honeywell
Value Driven Technology Deployment
Proven proficiency delivering value through consulting-based approach to technology deployment. HPS’s portfolio of technology, associated engineering services and on-going application support allows customers to drive ROI on technology and people investments.
Work Process Transformation
Operational knowledge allows HPS to drive the work process transformation required to integrate information from operating assets and processing plants to drive sound business decisions.
Enabling Enterprise Optimization
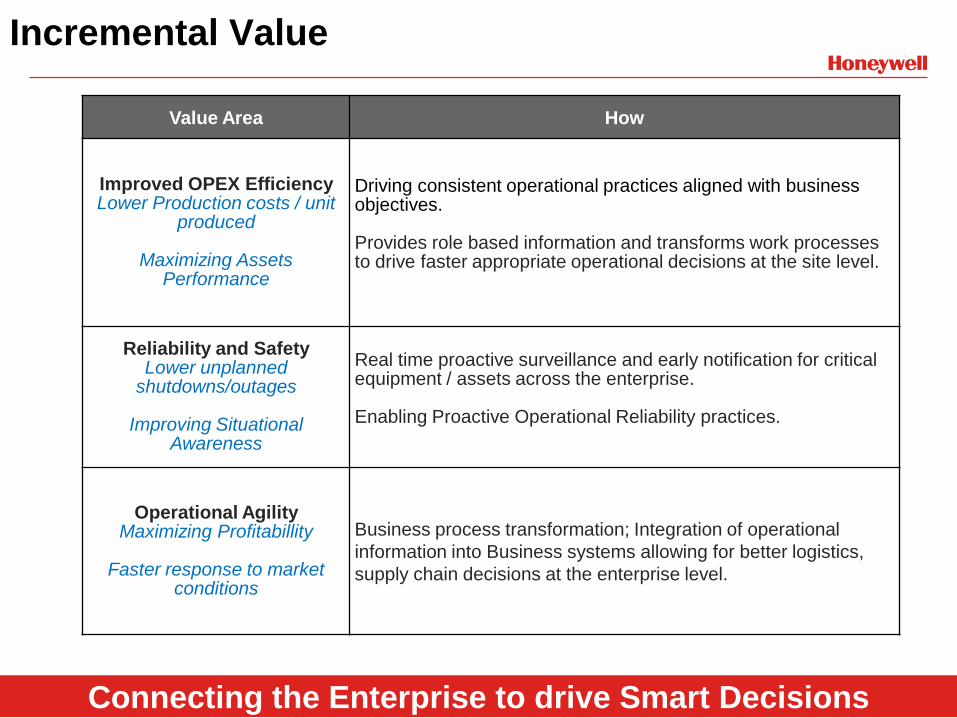
12 © 2015 Honeywell International All Rights Reserved Connecting the Enterprise to drive Smart Decisions
Incremental Value
Value Area How
Improved OPEX Efficiency Lower Production costs / unit
produced
Maximizing Assets Performance
Driving consistent operational practices aligned with business objectives. Provides role based information and transforms work processes to drive faster appropriate operational decisions at the site level.
Reliability and Safety Lower unplanned
shutdowns/outages
Improving Situational Awareness
Real time proactive surveillance and early notification for critical equipment / assets across the enterprise. Enabling Proactive Operational Reliability practices.
Operational Agility Maximizing Profitabillity
Faster response to market
conditions
Business process transformation; Integration of operational information into Business systems allowing for better logistics, supply chain decisions at the enterprise level.
13 © 2015 Honeywell International All Rights Reserved
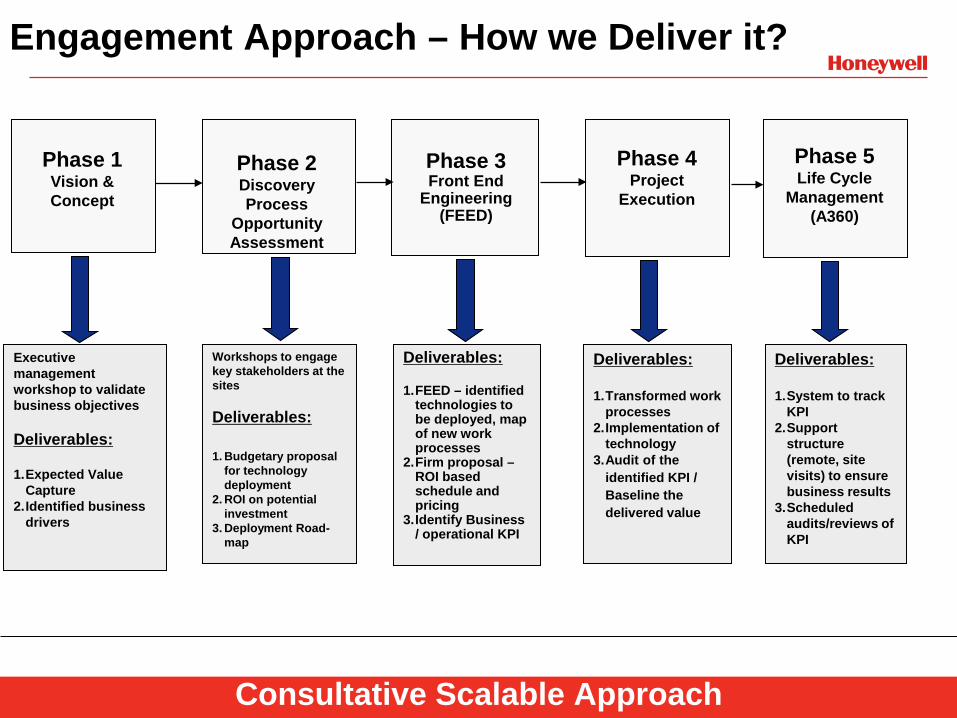
Executive management workshop to validate business objectives Deliverables: 1.Expected Value
Capture 2.Identified business
drivers
Workshops to engage key stakeholders at the sites Deliverables: 1. Budgetary proposal
for technology deployment
2. ROI on potential investment
3. Deployment Road-map
Deliverables: 1.FEED – identified
technologies to be deployed, map of new work processes
2.Firm proposal – ROI based schedule and pricing
3.Identify Business / operational KPI
Deliverables: 1.Transformed work
processes 2.Implementation of
technology 3.Audit of the
identified KPI / Baseline the delivered value
Deliverables: 1.System to track
KPI 2.Support
structure (remote, site visits) to ensure business results
3.Scheduled audits/reviews of KPI
Phase 1 Vision & Concept
Phase 2 Discovery Process
Opportunity Assessment
Phase 3 Front End
Engineering (FEED)
Phase 4 Project
Execution
Phase 5 Life Cycle
Management (A360)
Engagement Approach – How we Deliver it?
Consultative Scalable Approach
14 © 2015 Honeywell International All Rights Reserved
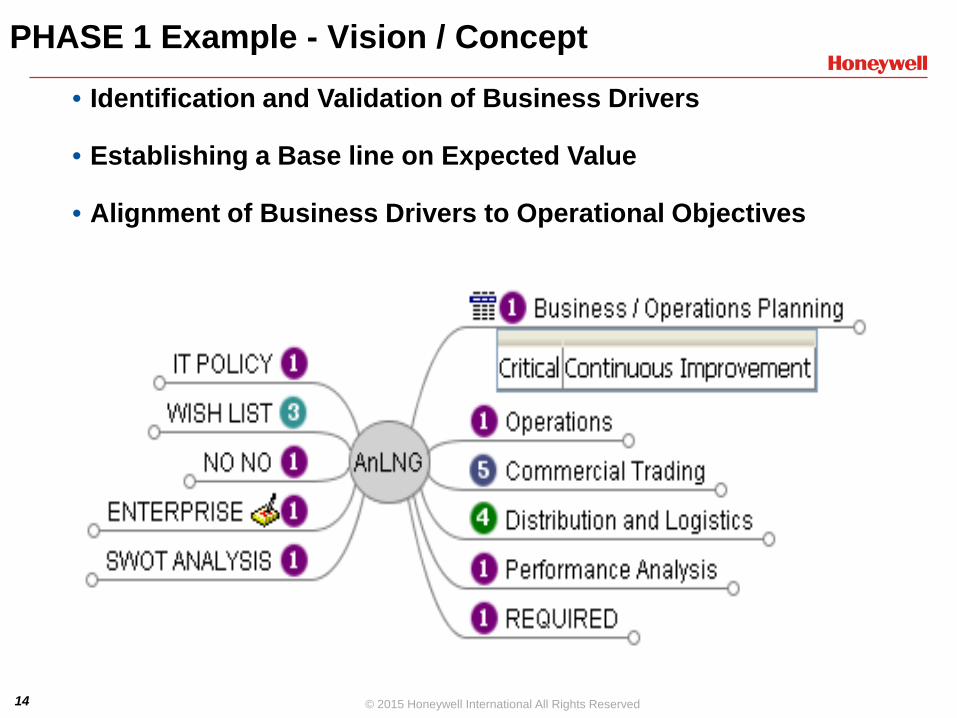
PHASE 1 Example - Vision / Concept
• Identification and Validation of Business Drivers
• Establishing a Base line on Expected Value
• Alignment of Business Drivers to Operational Objectives
15 © 2015 Honeywell International All Rights Reserved
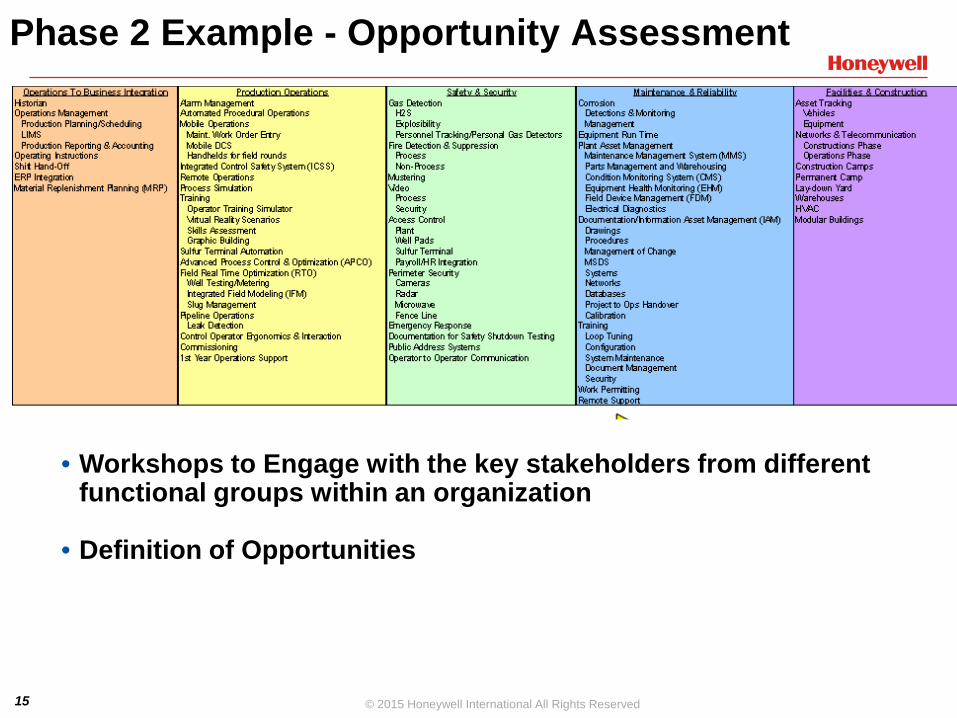
Phase 2 Example - Opportunity Assessment
• Workshops to Engage with the key stakeholders from different
functional groups within an organization
• Definition of Opportunities
16 © 2015 Honeywell International All Rights Reserved
Occ
upat
iona
l Saf
ety
Pro
cess
Saf
ety
Reg
ulat
ory
Com
plia
nce
Ope
ratio
nal E
ffect
iven
ess
Info
rmat
ion
Man
agem
ent
Ope
ratio
ns M
anag
emen
t
Adv
ance
d A
larm
Man
agem
ent
Ass
et M
anag
emen
tO
pera
tors
Tra
inin
g S
imul
ator
s
AP
C (E
arly
Eve
nt D
etec
tion)
Inte
llatra
cO
ne W
irele
ssP
roce
dura
l Ope
ratio
nsA
larm
Per
form
ance
Ass
essm
ent
Ala
rm P
hilo
soph
y W
orks
hop
Ala
rm R
atio
naliz
atio
n S
ervi
ce
Bou
ndar
y A
sses
smen
t
Ben
chm
arki
ng /
Gap
Ana
lysi
s
Pro
cedu
ral C
onsu
lting
Ben
efit
Ana
lysi
s (s
ite A
dult)
Val
ue A
udit
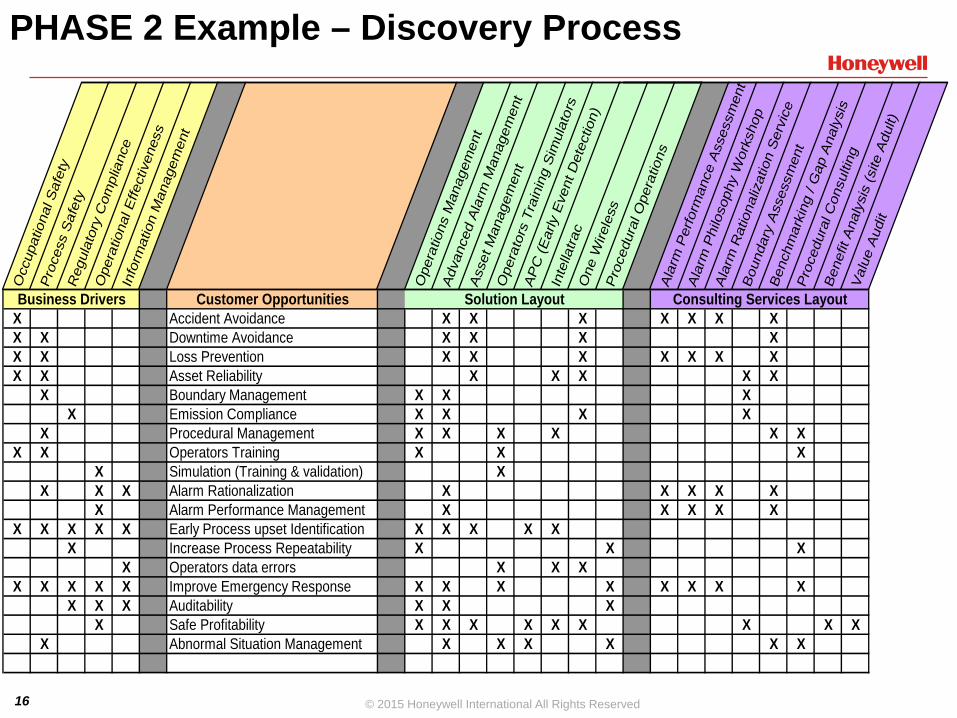
Business Drivers Solution Layout Consulting Services LayoutCustomer OpportunitiesX Accident Avoidance X X X X X X XX X Downtime Avoidance X X X XX X Loss Prevention X X X X X X X X X Asset Reliability X X X X X
X Boundary Management X X XX Emission Compliance X X X X
X Procedural Management X X X X X XX X Operators Training X X X
X Simulation (Training & validation) XX X X Alarm Rationalization X X X X X
X Alarm Performance Management X X X X XX X X X X Early Process upset Identification X X X X X
X Increase Process Repeatability X X XX Operators data errors X X X
X X X X X Improve Emergency Response X X X X X X X XX X X Auditability X X X
X Safe Profitability X X X X X X X X XX Abnormal Situation Management X X X X X X
Business Drivers Solution Layout Consulting Services Layout
PHASE 2 Example – Discovery Process
17 © 2015 Honeywell International All Rights Reserved
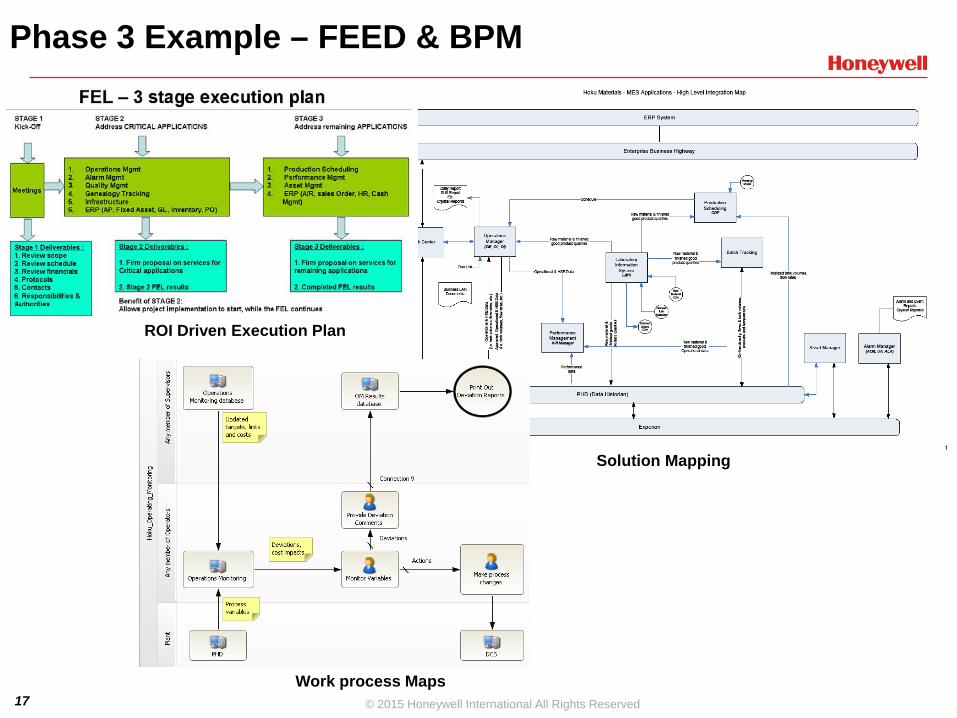
Phase 3 Example – FEED & BPM
Solution Mapping
Work process Maps
ROI Driven Execution Plan
18 © 2015 Honeywell International All Rights Reserved
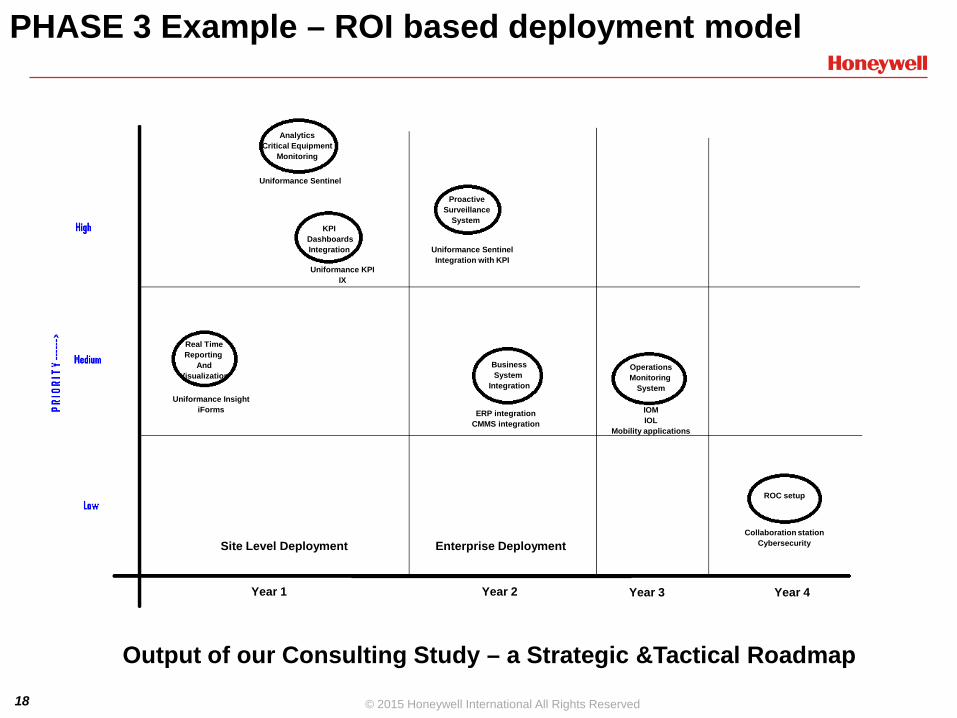
Output of our Consulting Study – a Strategic &Tactical Roadmap
PHASE 3 Example – ROI based deployment model
Real Time Reporting
And Visualization
KPI Dashboards Integration
Analytics Critical Equipment
Monitoring
Year 1 Year 1 Year 2 Year 3 Year 4
Proactive Surveillance
System
Site Level Deployment Enterprise Deployment
Business System
Integration
Operations Monitoring
System
ROC setup
Uniformance Insight iForms
Uniformance KPI IX
Uniformance Sentinel
Uniformance Sentinel Integration with KPI
IOM IOL
Mobility applications
ERP integration CMMS integration
Collaboration station Cybersecurity
19 © 2015 Honeywell International All Rights Reserved
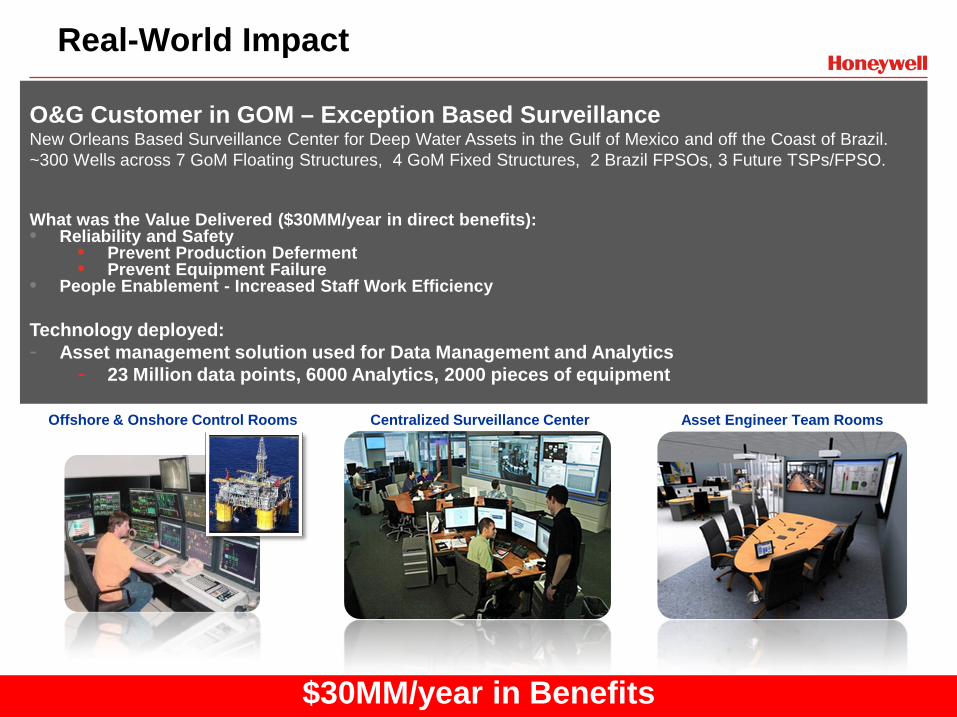
Real-World Impact
O&G Customer in GOM – Exception Based Surveillance New Orleans Based Surveillance Center for Deep Water Assets in the Gulf of Mexico and off the Coast of Brazil. ~300 Wells across 7 GoM Floating Structures, 4 GoM Fixed Structures, 2 Brazil FPSOs, 3 Future TSPs/FPSO. What was the Value Delivered ($30MM/year in direct benefits): • Reliability and Safety
• Prevent Production Deferment • Prevent Equipment Failure
• People Enablement - Increased Staff Work Efficiency Technology deployed: - Asset management solution used for Data Management and Analytics
- 23 Million data points, 6000 Analytics, 2000 pieces of equipment
Offshore & Onshore Control Rooms Centralized Surveillance Center Asset Engineer Team Rooms
$30MM/year in Benefits
20 © 2015 Honeywell International All Rights Reserved
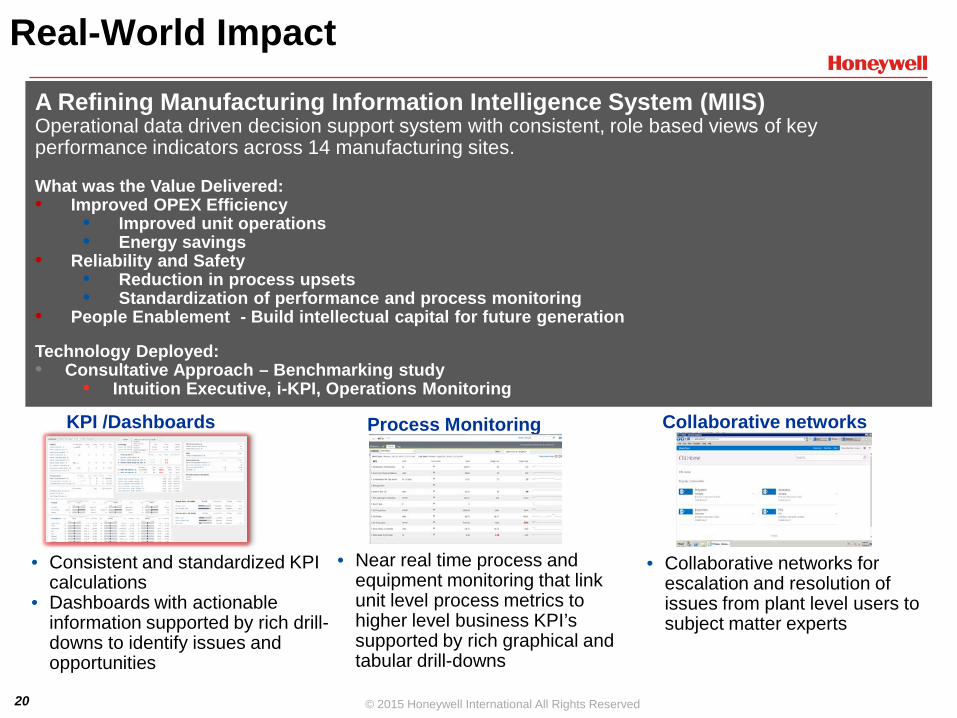
Real-World Impact
A Refining Manufacturing Information Intelligence System (MIIS) Operational data driven decision support system with consistent, role based views of key performance indicators across 14 manufacturing sites. What was the Value Delivered: • Improved OPEX Efficiency
• Improved unit operations • Energy savings
• Reliability and Safety • Reduction in process upsets • Standardization of performance and process monitoring
• People Enablement - Build intellectual capital for future generation Technology Deployed: • Consultative Approach – Benchmarking study
• Intuition Executive, i-KPI, Operations Monitoring
• Consistent and standardized KPI calculations
• Dashboards with actionable information supported by rich drill-downs to identify issues and opportunities
KPI /Dashboards Process Monitoring Collaborative networks
• Near real time process and equipment monitoring that link unit level process metrics to higher level business KPI’s supported by rich graphical and tabular drill-downs
• Collaborative networks for escalation and resolution of issues from plant level users to subject matter experts
21 © 2015 Honeywell International All Rights Reserved
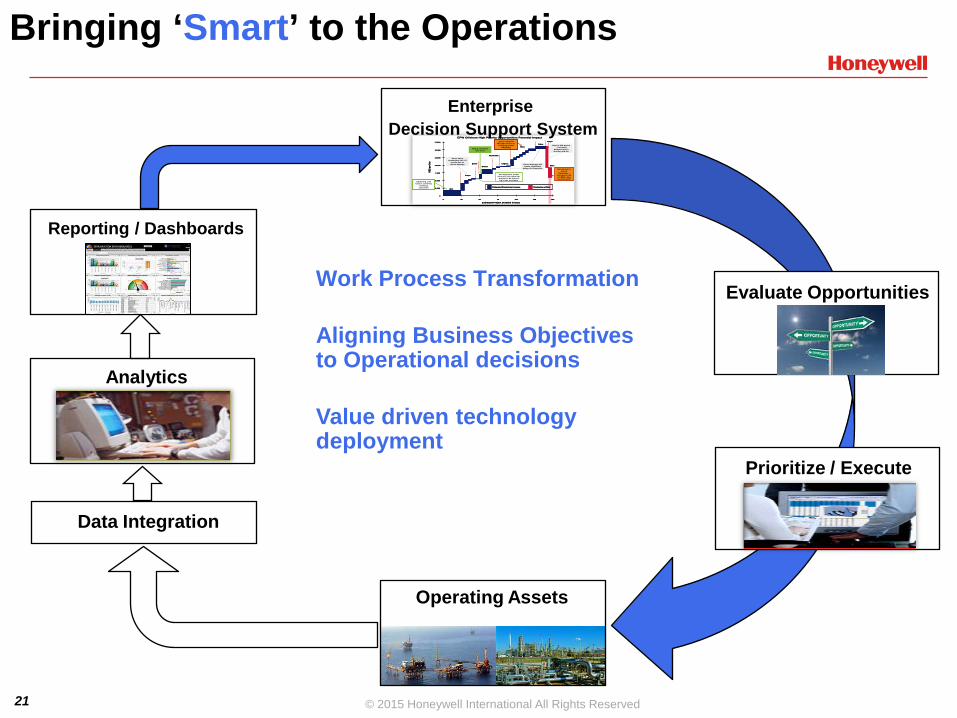
Typical Operations
Operating Assets
Bringing ‘Smart’ to the Operations
Data Integration
Analytics
Reporting / Dashboards
EPW Offshore High Priority Opportunities Potential Impact
15,000
0
0
10,000
5,000
12,500
7,500
2,500
1501005025 75 125
Alex
Auger
Boxer
Brutus
Bullwinkle
Cognac
17,500
Mars
Salsa
BEQ
per D
ay
Estimated Project Duration in Days
Auger
Mars
Production at RiskEstimated Production Increase
EPW Offshore High Priority Opportunities Potential Impact
15,000
0
0
10,000
5,000
12,500
7,500
2,500
1501005025 75 125
Alex
Auger
Boxer
Brutus
Bullwinkle
Cognac
17,500
Mars
Salsa
BEQ
per D
ay
Estimated Project Duration in Days
Auger
Mars
Production at RiskEstimated Production Increase
15,000
0
0
10,000
5,000
12,500
7,500
2,500
1501005025 75 125
Alex
Auger
Boxer
Brutus
Bullwinkle
Cognac
17,500
Mars
Salsa
BEQ
per D
ay
Estimated Project Duration in Days
Auger
Mars
Production at RiskEstimated Production Increase Production at RiskEstimated Production Increase
Next in WS queue- Currently
delayed due to Gustav and Ike
Being executed this week
Re-alignment of WS foremen may allow for project to be moved up in the schedule
Asset likely unavailable for 2-3
weeks due to storm damage
Obtaining a lift boat is currently
delaying execution
Can’t complete WS jobs due to A-
8 drilling (2,000 BEQ/day)
Moved out to end of
December -Increased risk of BEQ / day loss by 9,200
Storm damage will create significant
delays in execution
Enterprise Decision Support System
Evaluate Opportunities
Prioritize / Execute
Work Process Transformation Aligning Business Objectives to Operational decisions Value driven technology deployment