Embed Size (px)
Citation preview
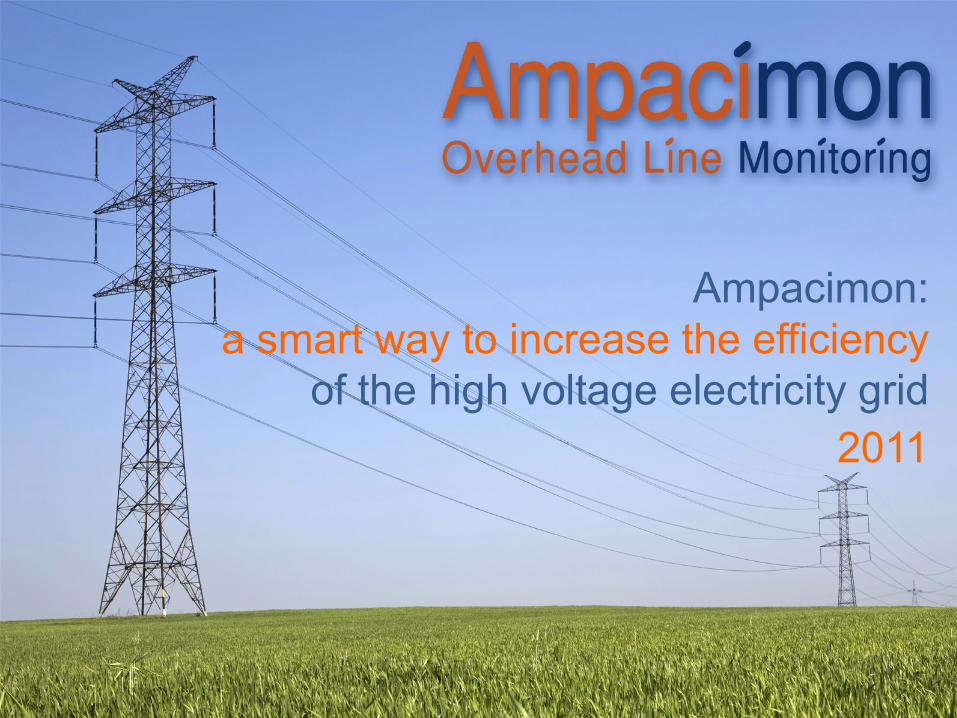
Ampacimon: a smart way to increase the efficiency
of the high voltage electricity grid2011
2011 2
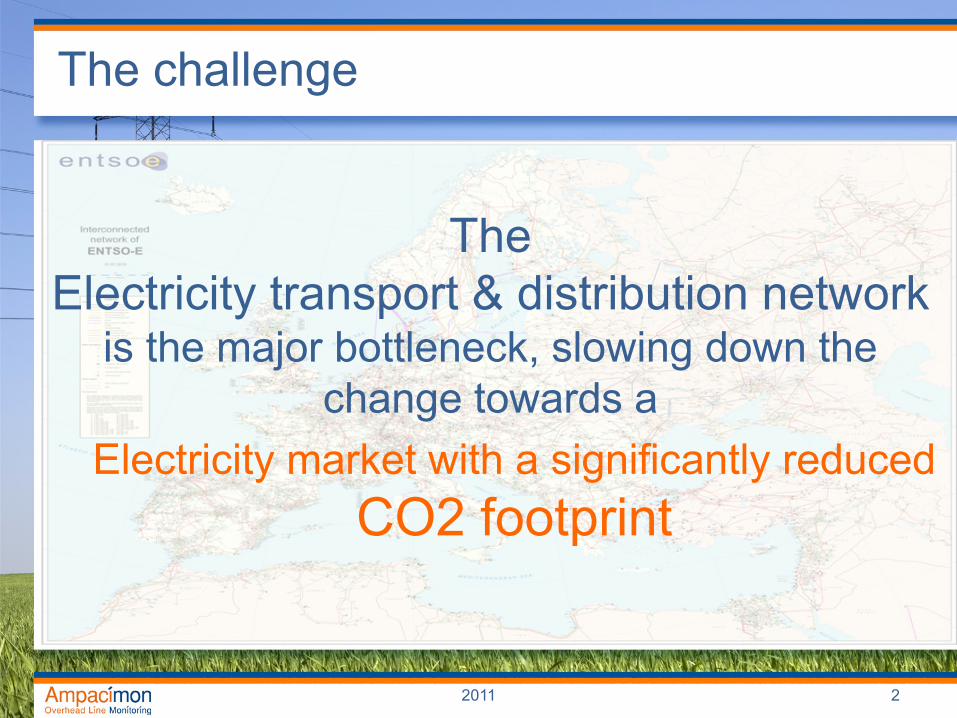
The challenge
The Electricity transport & distribution network
is the major bottleneck, slowing down the change towards a
Electricity market with a significantly reduced CO2 footprint
2011 3
The possible solutions
Within the network the most difficult bottleneck to remove are the lines
• Invest in new transport and distribution lines– Takes at least 10 years– Is extremely expensive: about 1 M€ per Km– Is not well accepted (NIMBY) by the population
• Improve the efficiency of the existing network– Using advances in IT and communication infrastructure to
enable new operating modes– Without decreasing security of supply
2011 4
The current situation
• The maximum current a conductor can carry is a function of the maximum allowable sag
• On overhead lines (the vast majority of the network) the conductors are more or less cooled by the ambient weather conditions strongly influencing the sag
• This effect is currently not taken into account because it is not measured. Worst case assumptions are taken when dimensioning the line:
Static line rating
2011 5
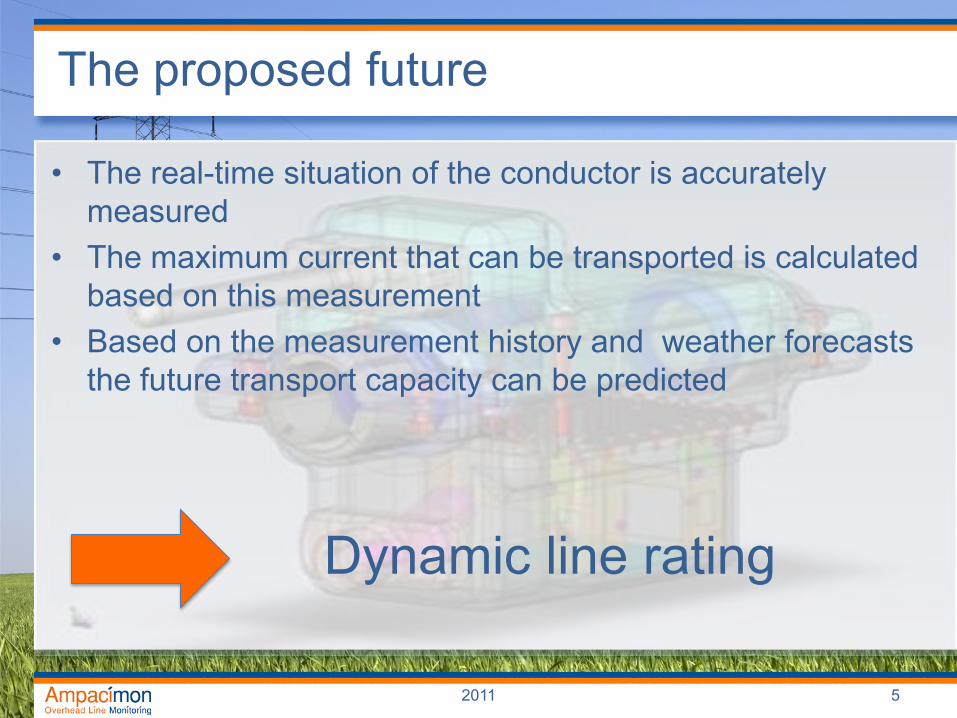
The proposed future
• The real-time situation of the conductor is accurately measured
• The maximum current that can be transported is calculated based on this measurement
• Based on the measurement history and weather forecasts the future transport capacity can be predicted
Dynamic line rating
2011 6
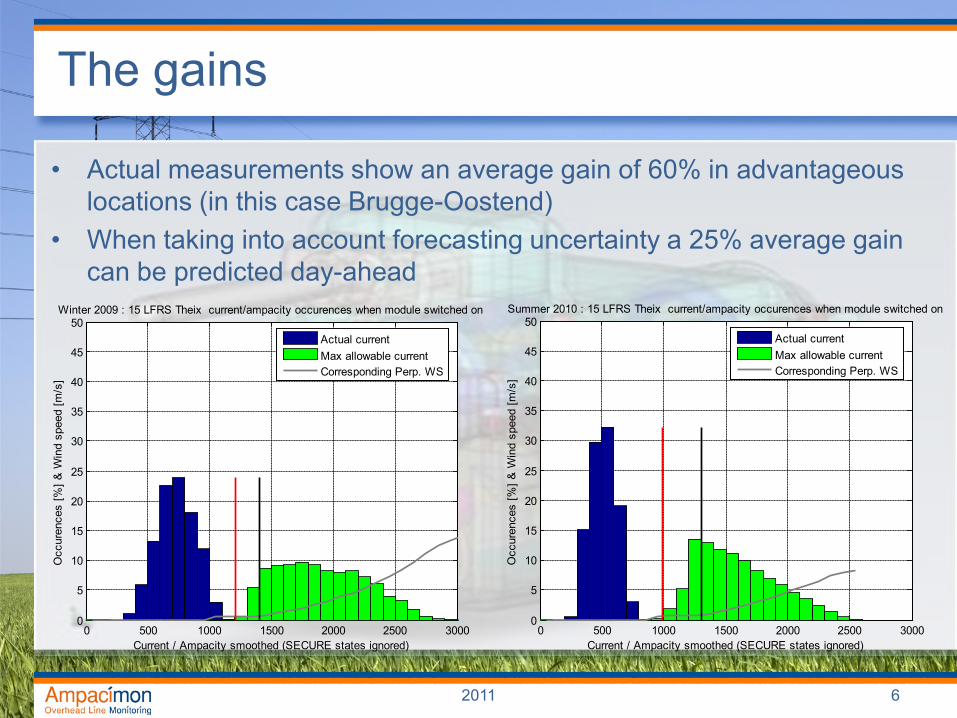
The gains
• Actual measurements show an average gain of 60% in advantageous locations (in this case Brugge-Oostend)
• When taking into account forecasting uncertainty a 25% average gain can be predicted day-ahead
0 500 1000 1500 2000 2500 30000
5
10
15
20
25
30
35
40
45
50Winter 2009 : 15 LFRS Theix current/ampacity occurences when module switched on
Current / Ampacity smoothed (SECURE states ignored)
Occ
uren
ces
[%] &
Win
d sp
eed
[m/s
]
Actual currentMax allowable currentCorresponding Perp. WS
0 500 1000 1500 2000 2500 30000
5
10
15
20
25
30
35
40
45
50Summer 2010 : 15 LFRS Theix current/ampacity occurences when module switched on
Current / Ampacity smoothed (SECURE states ignored)
Occ
uren
ces
[%] &
Win
d sp
eed
[m/s
]
Actual currentMax allowable currentCorresponding Perp. WS
2011 7
The remaining challenge: CHANGE
• Change to the operational and planning processes– Correct assumptions for long-term network planning– Correct assumption for maintenance (mid-term) planning– Increased uncertainty in exploitation
• Part of the general change required to reduce the CO2 footprint– Uncertainty of consumption patterns (pro-sumers, e-vehicles …)– Uncertainty of production patterns (intermittent energy sources)– And now uncertainty of transport & distribution capacity (Dynamic Line
Rating)
Global approach required!
2011 8
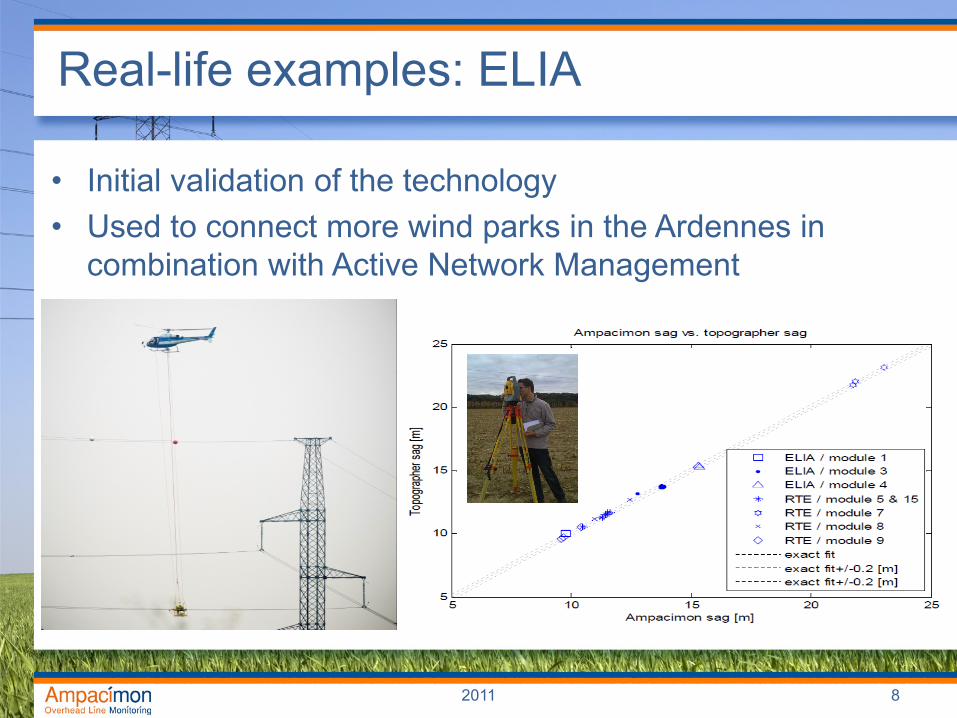
Real-life examples: ELIA
• Initial validation of the technology• Used to connect more wind parks in the Ardennes in
combination with Active Network Management
2011 9
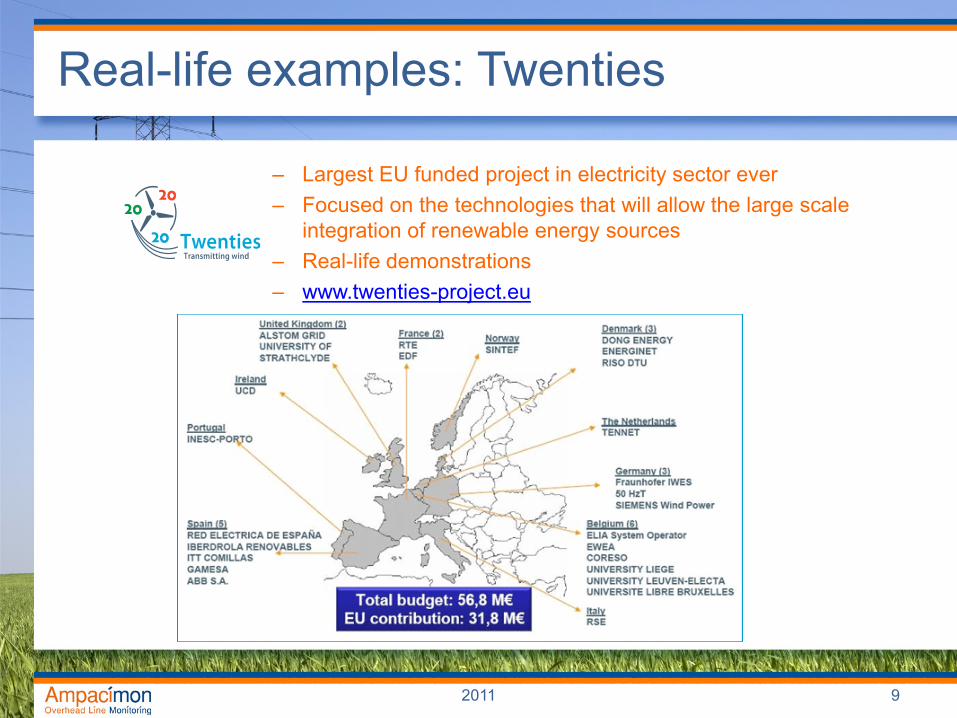
Real-life examples: Twenties
– Largest EU funded project in electricity sector ever– Focused on the technologies that will allow the large scale
integration of renewable energy sources– Real-life demonstrations– www.twenties-project.eu
2011 10
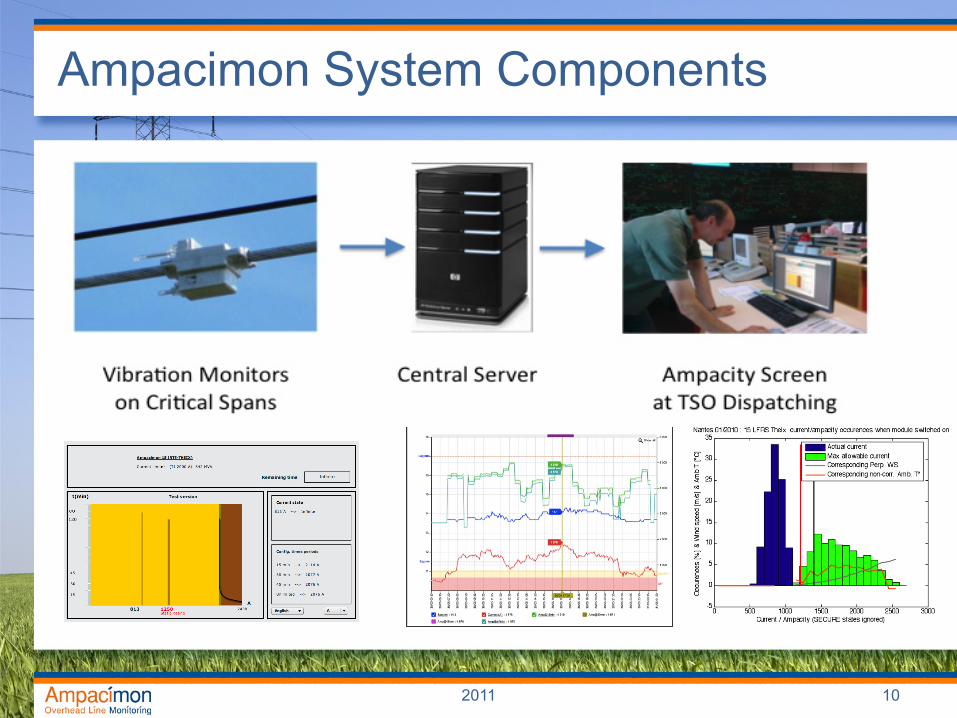
Ampacimon System Components
2011 11
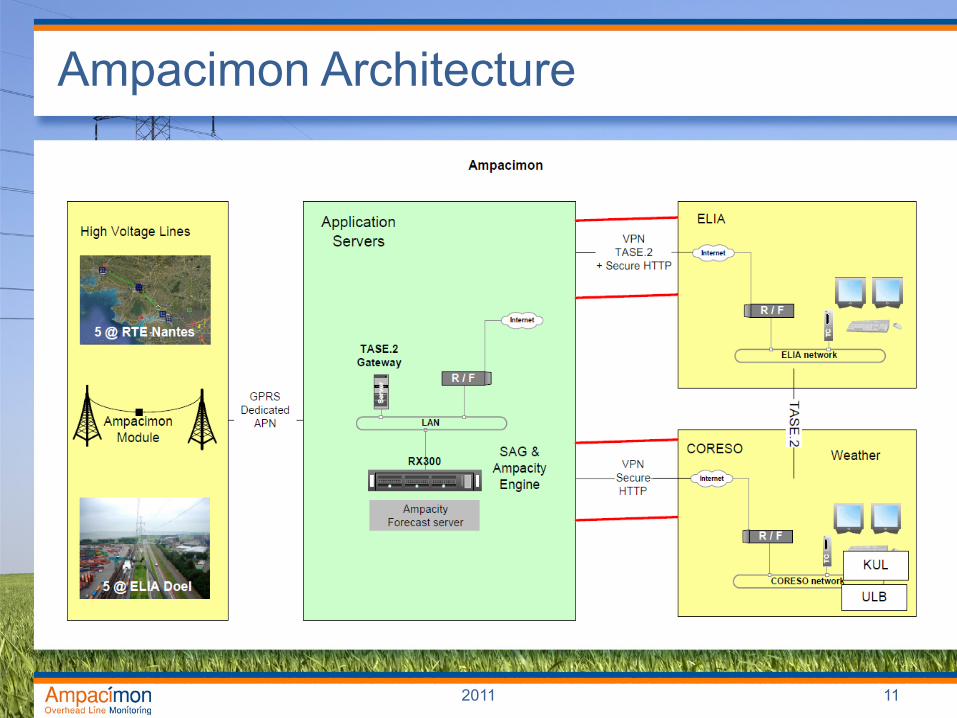
Ampacimon Architecture
2011 12
Conclusions
• Very significant gains (60%) can be achieved with smart technologies
• The remaining challenge is not technology but process and change management
The electricity market will need to evolve towards « just in time » management as the
products market did years ago