Embed Size (px)
Citation preview
Sight, Sound, Numbers, & Us: Data Visualization + Data Sonification = Data Accessibility?
PF Anderson, Emerging Technologies Informationist
August 2, 2016; for the UM Web Accessibility Working Group
PF Anderson, Emerging Technologies Informationist
August 2, 2016; for the UM Web Accessibility Working Group
Data
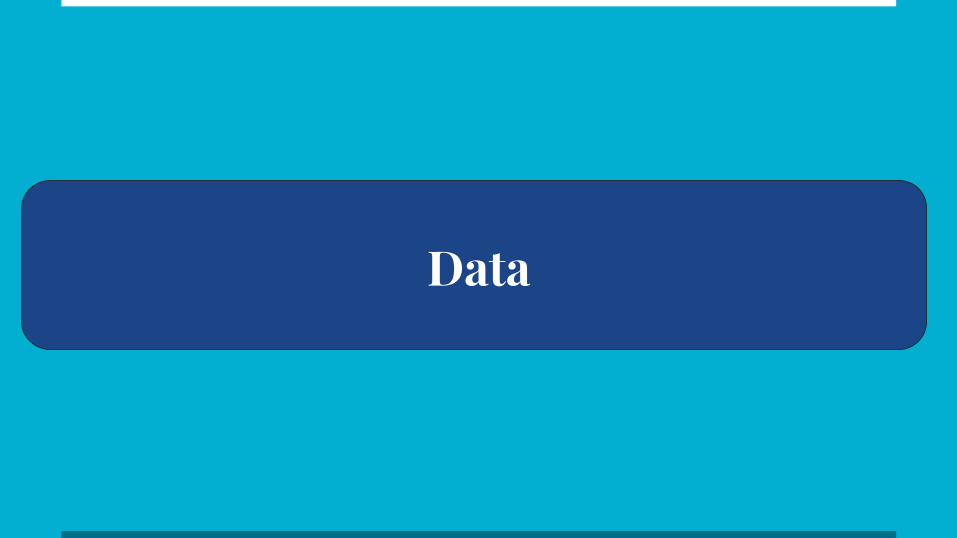
Data: Example
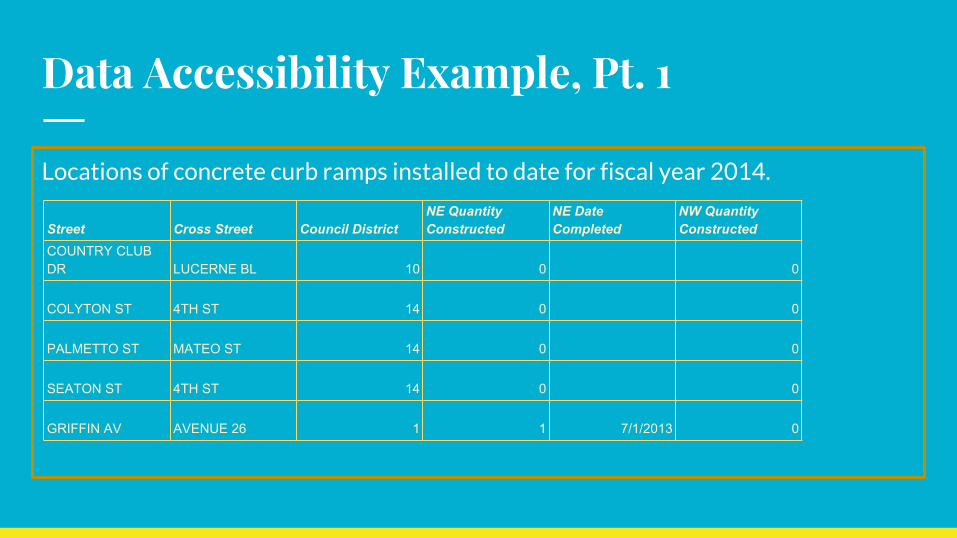
Data Accessibility Example, Pt. 1
Locations of concrete curb ramps installed to date for fiscal year 2014.
Street Cross Street Council DistrictNE Quantity Constructed
NE Date Completed
NW Quantity Constructed
COUNTRY CLUB DR LUCERNE BL 10 0 0
COLYTON ST 4TH ST 14 0 0
PALMETTO ST MATEO ST 14 0 0
SEATON ST 4TH ST 14 0 0
GRIFFIN AV AVENUE 26 1 1 7/1/2013 0
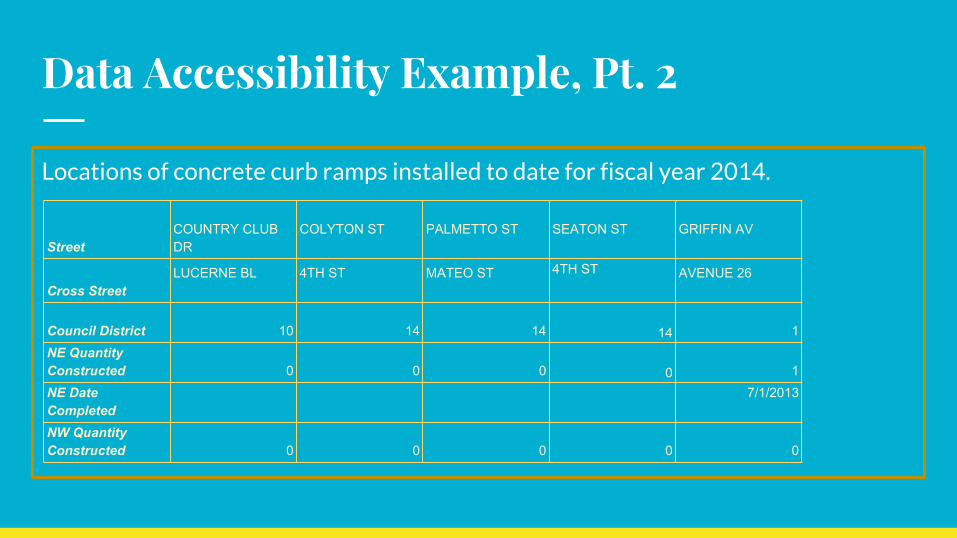
Data Accessibility Example, Pt. 2
Locations of concrete curb ramps installed to date for fiscal year 2014.
StreetCOUNTRY CLUB DR
COLYTON ST PALMETTO ST SEATON ST GRIFFIN AV
Cross StreetLUCERNE BL 4TH ST MATEO ST 4TH ST AVENUE 26
Council District 10 14 14 14 1NE Quantity Constructed 0 0 0 0 1NE Date Completed
7/1/2013
NW Quantity Constructed 0 0 0 0 0
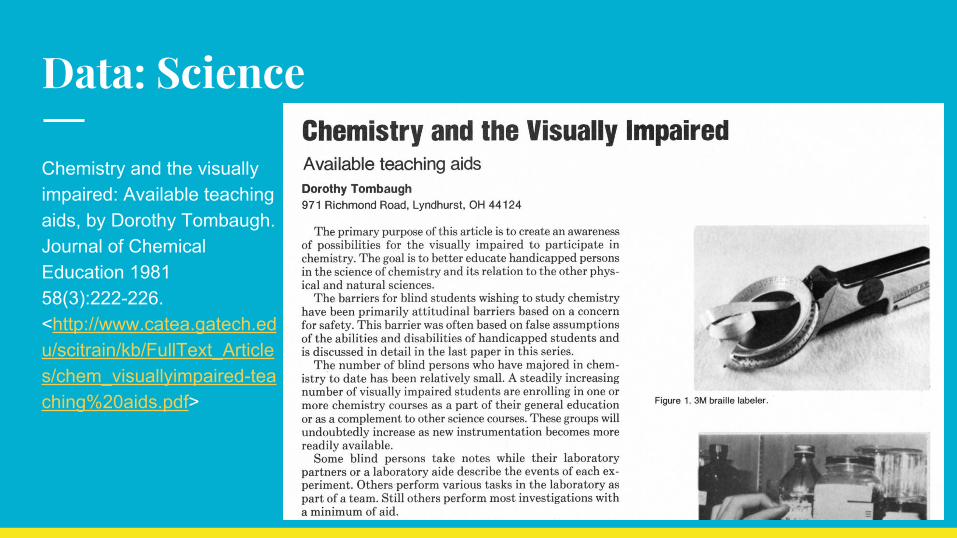
Data: Science
Chemistry and the visually impaired: Available teaching aids, by Dorothy Tombaugh. Journal of Chemical Education 1981 58(3):222-226. <http://www.catea.gatech.edu/scitrain/kb/FullText_Articles/chem_visuallyimpaired-teaching%20aids.pdf>
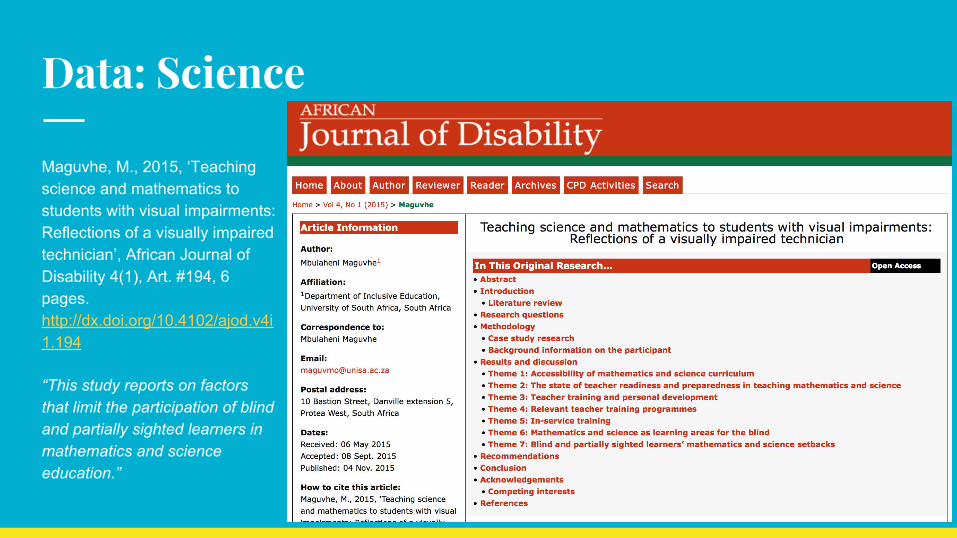
Data: Science
Maguvhe, M., 2015, ‘Teaching science and mathematics to students with visual impairments: Reflections of a visually impaired technician’, African Journal of Disability 4(1), Art. #194, 6 pages. http://dx.doi.org/10.4102/ajod.v4i1.194
“This study reports on factors that limit the participation of blind and partially sighted learners in mathematics and science education.”
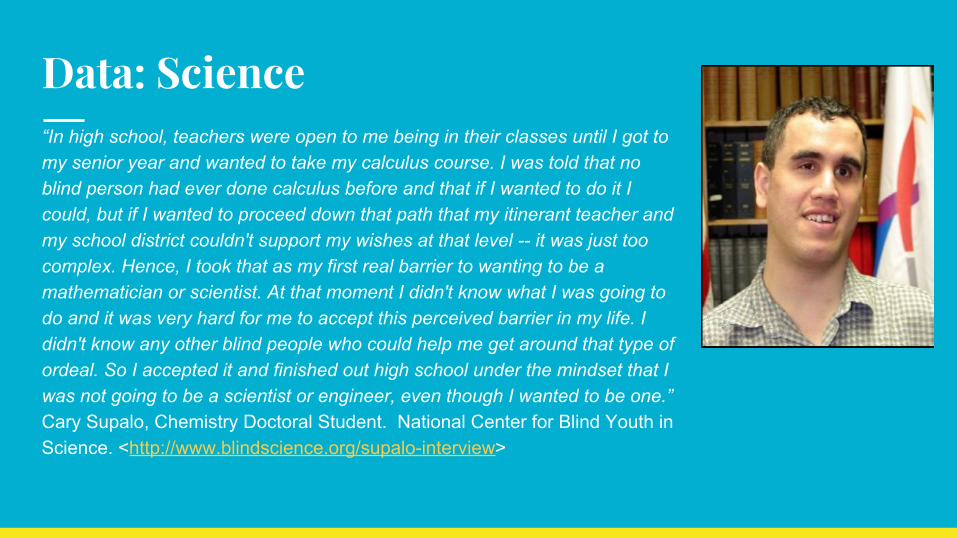
Data: Science “In high school, teachers were open to me being in their classes until I got to my senior year and wanted to take my calculus course. I was told that no blind person had ever done calculus before and that if I wanted to do it I could, but if I wanted to proceed down that path that my itinerant teacher and my school district couldn't support my wishes at that level -- it was just too complex. Hence, I took that as my first real barrier to wanting to be a mathematician or scientist. At that moment I didn't know what I was going to do and it was very hard for me to accept this perceived barrier in my life. I didn't know any other blind people who could help me get around that type of ordeal. So I accepted it and finished out high school under the mindset that I was not going to be a scientist or engineer, even though I wanted to be one.” Cary Supalo, Chemistry Doctoral Student. National Center for Blind Youth in Science. <http://www.blindscience.org/supalo-interview>
Data Accessibility Means Different Things to Different People
● Data Inventory Is Key to Data Sharing and Accessibility, From the Management Team, April 14, 2016
○ <https://financialresearch.gov/from-the-management-team/2016/04/14/data-inventory-is-key-to-data-sharing-and-accessibility/>
○ NOTE: Actually about access in general for data sharing/archiving/collection/distribution etc., not accessibility for persons with access challenges such as vision loss.
● Data.gov: Accessibility: <https://www.data.gov/privacy-policy#accessibility> ○ “Images on the site contain “alt tags”, which aid users who listen to the content of the site by
using a screen reader, rather than reading the site. Likewise, a “skip to” link provides these users with a method for bypassing the header and going directly to the main content each time a page is accessed. Text transcripts accompany audio clips, and closed captioning is available on videos.”
Data Accessibility (Other Resources)
● Teaching students with visual impairments: Measurement and data collection ○ <http://www.teachingvisuallyimpaired.com/measurement--data.html> ○ Mostly devices and tools for manipulation and data generation/collection
● Making your HTML accessible for the visually impaired (E-Consultancy, 2016): <https://econsultancy.com/blog/67625-making-your-html-accessible-for-the-visually-impaired/>
○ In comments: Matt Terrington “One area I'm personally struggling with is how to marry up
fancy data visualisations (https://econsultancy.com/blog/tags/data-visualisation/) with accessibility for visually impaired users.”
About Data Visualization
Data Visualization
“As the saying goes, ‘a picture is worth a thousand words’ - often more - but only when the story is best told graphically rather than verbally and the picture is well designed. You could stare at a table of numbers all day and never see what would be immediately obvious when looking at a good picture of those same numbers.” Stephen Few. 35. Data Visualization for Human Perception. Encyclopedia of Human Computer Interaction, 2nd Ed. <https://www.interaction-design.org/literature/book/the-encyclopedia-of-human-computer-interaction-2nd-ed/data-visualization-for-human-perception>
Data Visualization & Accessibility“Information graphics such as plots, maps, plans, charts, tables and diagrams form an integral part of the student learning experience in many disciplines. However, for a vision impaired student accessing such graphical materials can be problematic. … We found that difficulty in accessing graphical materials was a barrier to many vision-impaired students and that there were systemic problems with current processes for accessible graphics provision. Recommendations are made on ways to address these concerns in order to provide a more equitable higher education experience.” Butler M, Holloway L, Mariott K, Goncu C. Understanding the graphical challenges faced by vision-impaired students in Australian universities. Higher Education Research & Development. Published online: 16 May 2016 DOI:10.1080/07294360.2016.1177001 <http://www.tandfonline.com/doi/abs/10.1080/07294360.2016.1177001>
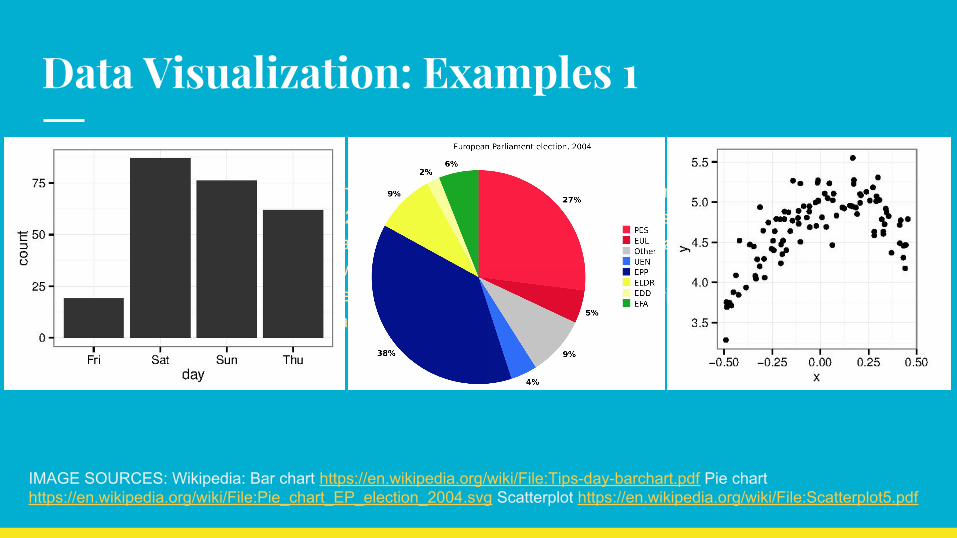
Data Visualization: Examples 1Examples shown (simple):
1) A simple black and white bar chart showing four bars with counts against the days of the week: approximate values are Friday 22, Saturday 79, Sunday 75, and Thursday 60).
2) A pie chart for the European Parliament election, 2004, with 8 percentage values shown in 8 bright colors, tagged with acronyms which may not be clear, such as PES, EUL, UEN, etc.
3) A scatter plot in black and white showing an arc of dots against numeric values which are not described other than as the X axis and the Y axis.
IMAGE SOURCES: Wikipedia: Bar chart https://en.wikipedia.org/wiki/File:Tips-day-barchart.pdf Pie chart https://en.wikipedia.org/wiki/File:Pie_chart_EP_election_2004.svg Scatterplot https://en.wikipedia.org/wiki/File:Scatterplot5.pdf
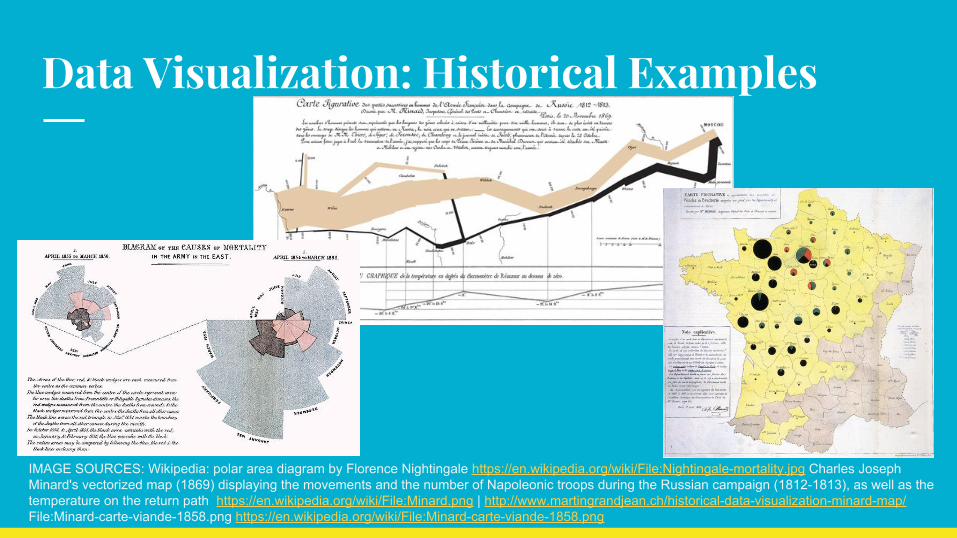
Data Visualization: Historical ExamplesThree data visualization examples from the early to mid-1800s.
1) Florence Nightingale. “This ‘Diagram of the causes of mortality in the army in the East’ was published in Notes on Matters Affecting the Health, Efficiency, and Hospital Administration of the British Army and sent to Queen Victoria in 1858. This graphic indicates the number of deaths that occured from preventable diseases (in blue), those that were the results of wounds (in red), and those due to other causes (in black).” The graph appears in wedges from a central point moving outward, with size variations based on the numberes represented.
2) The famous diagram from Minard showing the death rate on the march of the French Army during Napolean’s invasion of Russia, and how the deaths correlated inversely with the termperature during the Russian winter. . The chart resembles two tree branches, overlaid, with the wide end at opposite ends.
3) Another chart from Minard, illustrating an early use of pie-charts combined with mapping.
IMAGE SOURCES: Wikipedia: polar area diagram by Florence Nightingale https://en.wikipedia.org/wiki/File:Nightingale-mortality.jpg Charles Joseph Minard's vectorized map (1869) displaying the movements and the number of Napoleonic troops during the Russian campaign (1812-1813), as well as the temperature on the return path https://en.wikipedia.org/wiki/File:Minard.png | http://www.martingrandjean.ch/historical-data-visualization-minard-map/ File:Minard-carte-viande-1858.png https://en.wikipedia.org/wiki/File:Minard-carte-viande-1858.png
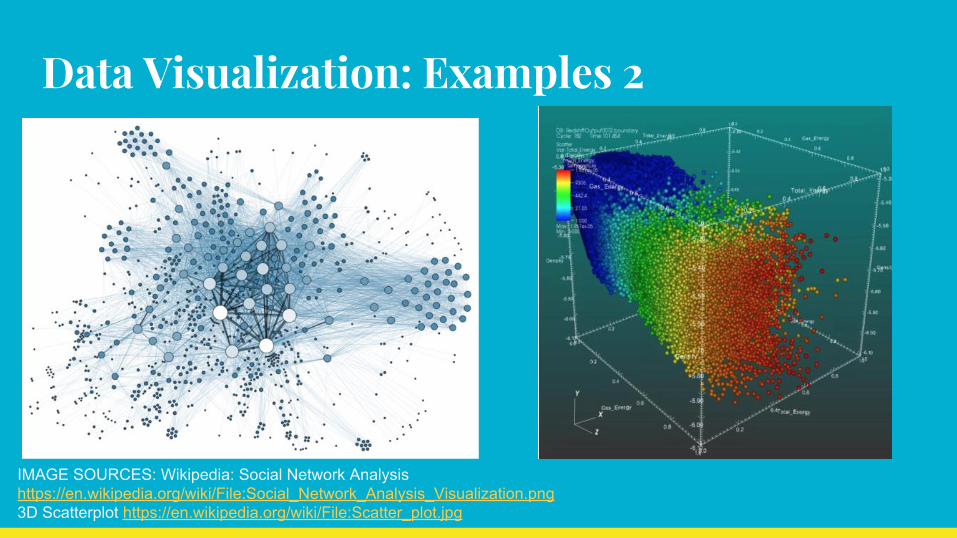
Data Visualization: Examples 2Examples shown (complex);
1) Social network analysis visualization of dots of varying sizes in shades of blue on white background, revealing a central cluster of roughly 20 large dots and showing how those connect to other clusters of medium-sized dots among a variety of scattered isolated small dots.
2) A three-dimensional scatterplot showing a dense cloud of dots describing energy sources (gas and solar) colored in a rainbow.
IMAGE SOURCES: Wikipedia: Social Network Analysis https://en.wikipedia.org/wiki/File:Social_Network_Analysis_Visualization.png 3D Scatterplot https://en.wikipedia.org/wiki/File:Scatter_plot.jpg
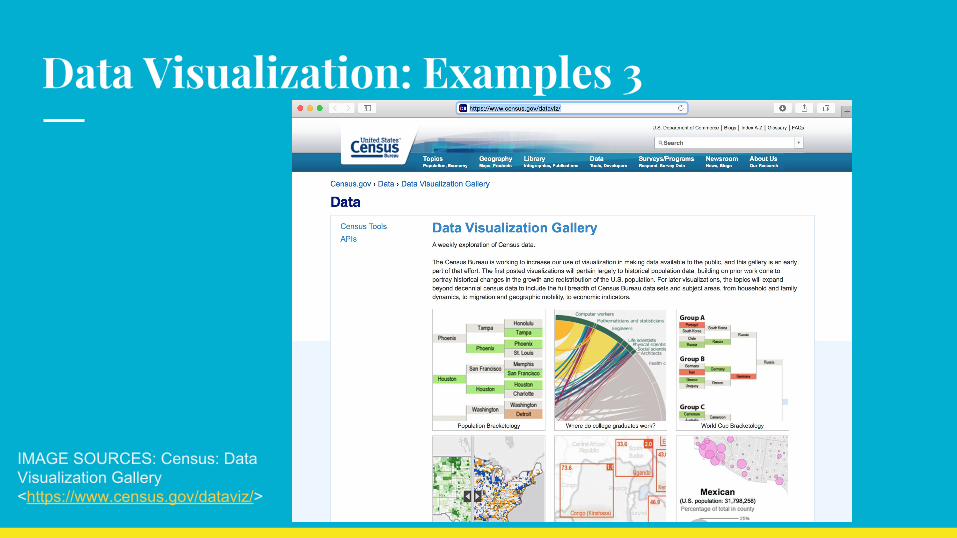
Data Visualization: Examples 3
1) Screenshot of the Data Visualization Gallery from Census.Gov. Screenshot includes images of a variety of data visualization techniques, including mapping, bubble displays, tree structures, social network maps, and more.
IMAGE SOURCES: Census: Data Visualization Gallery <https://www.census.gov/dataviz/>
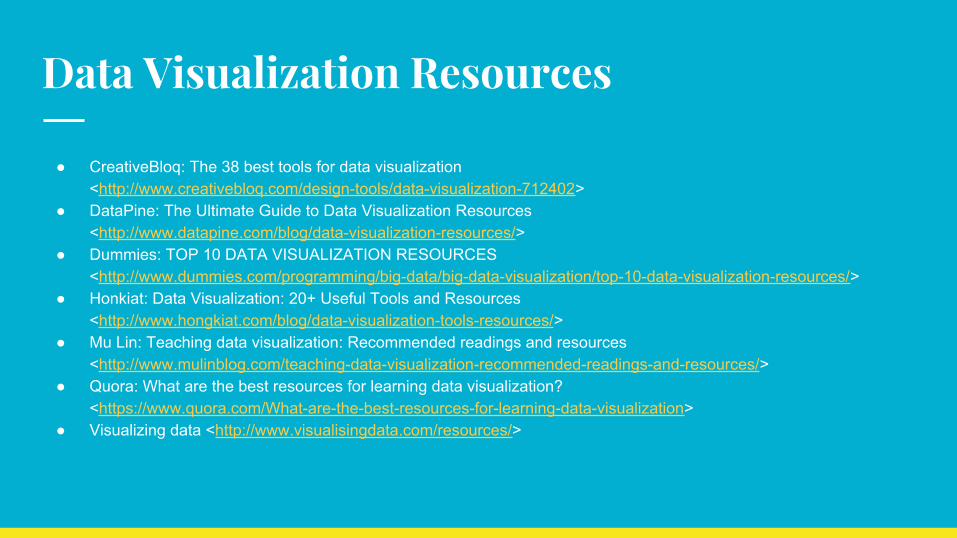
Data Visualization Resources
● CreativeBloq: The 38 best tools for data visualization <http://www.creativebloq.com/design-tools/data-visualization-712402>
● DataPine: The Ultimate Guide to Data Visualization Resources <http://www.datapine.com/blog/data-visualization-resources/>
● Dummies: TOP 10 DATA VISUALIZATION RESOURCES <http://www.dummies.com/programming/big-data/big-data-visualization/top-10-data-visualization-resources/>
● Honkiat: Data Visualization: 20+ Useful Tools and Resources <http://www.hongkiat.com/blog/data-visualization-tools-resources/>
● Mu Lin: Teaching data visualization: Recommended readings and resources <http://www.mulinblog.com/teaching-data-visualization-recommended-readings-and-resources/>
● Quora: What are the best resources for learning data visualization? <https://www.quora.com/What-are-the-best-resources-for-learning-data-visualization>
● Visualizing data <http://www.visualisingdata.com/resources/>
About Data Sonification
Data Sonification: Definitions
“Sonification is the use of non-speech audio to convey information.” Goddard Space Flight Center. <http://spdf.sci.gsfc.nasa.gov/research/sonification/>
“Sonification is the data-dependent generation of sound, if the transformation is systematic, objective and reproducible, so that it can be used as scientific method.” Thomas Hermann <http://sonification.de/son/definition>
Data Sonification: What Is It?
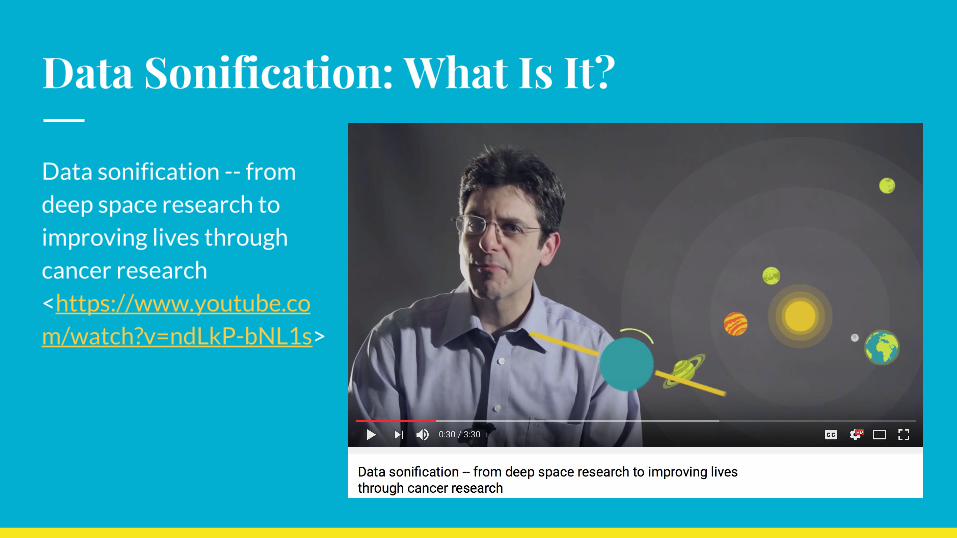
Data sonification -- from deep space research to improving lives through cancer research <https://www.youtube.com/watch?v=ndLkP-bNL1s>
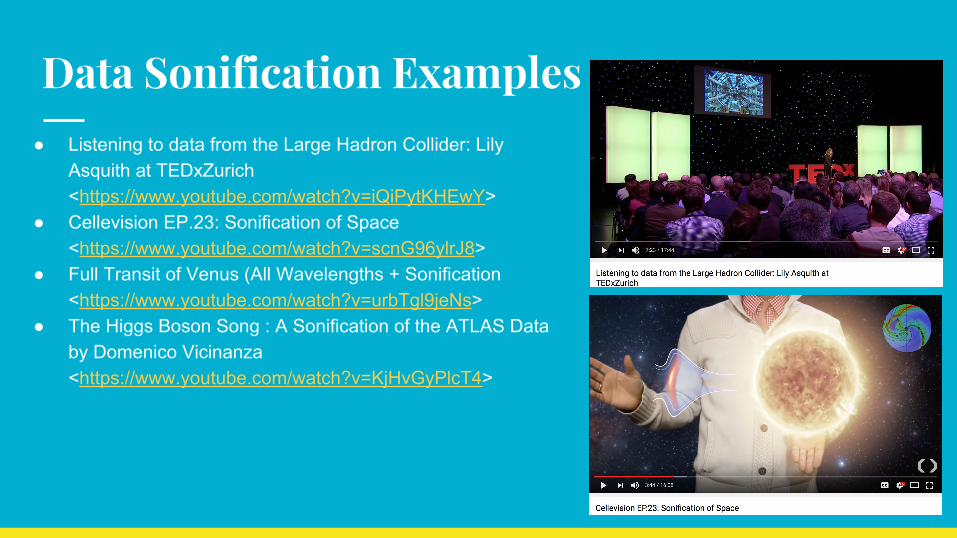
Data Sonification Examples● Listening to data from the Large Hadron Collider: Lily
Asquith at TEDxZurich <https://www.youtube.com/watch?v=iQiPytKHEwY>
● Cellevision EP.23: Sonification of Space <https://www.youtube.com/watch?v=scnG96ylrJ8>
● Full Transit of Venus (All Wavelengths + Sonification <https://www.youtube.com/watch?v=urbTgl9jeNs>
● The Higgs Boson Song : A Sonification of the ATLAS Data by Domenico Vicinanza <https://www.youtube.com/watch?v=KjHvGyPlcT4>
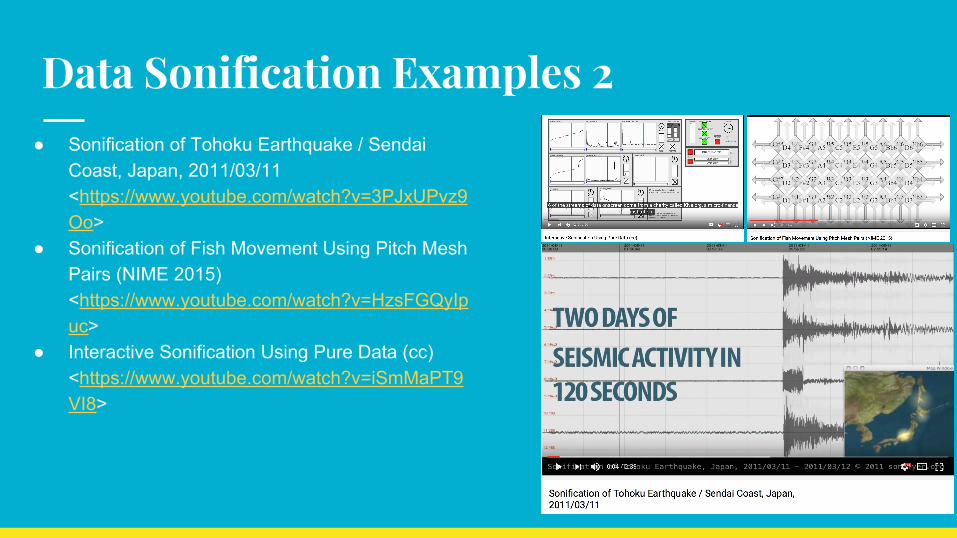
Data Sonification Examples 2● Sonification of Tohoku Earthquake / Sendai
Coast, Japan, 2011/03/11 <https://www.youtube.com/watch?v=3PJxUPvz9Oo>
● Sonification of Fish Movement Using Pitch Mesh Pairs (NIME 2015) <https://www.youtube.com/watch?v=HzsFGQyIpuc>
● Interactive Sonification Using Pure Data (cc) <https://www.youtube.com/watch?v=iSmMaPT9VI8>
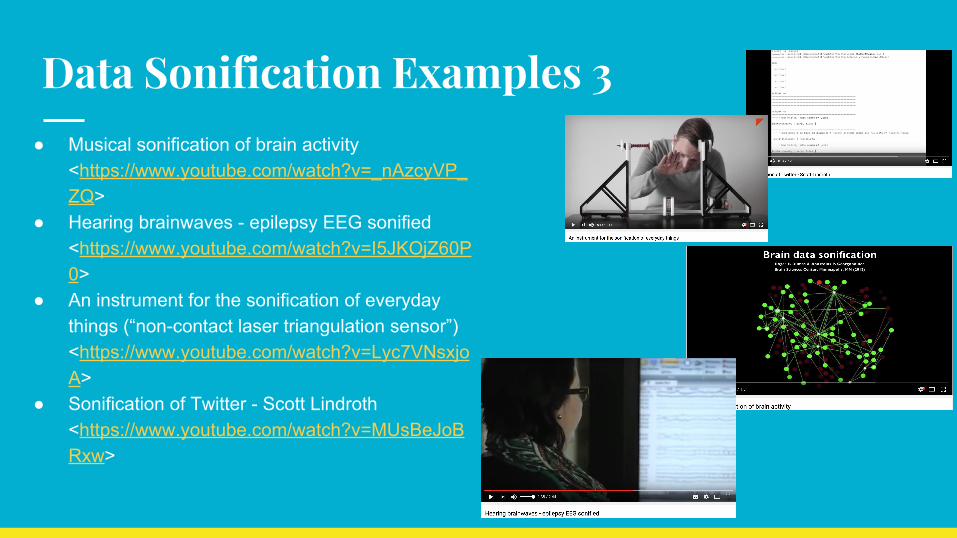
Data Sonification Examples 3● Musical sonification of brain activity
<https://www.youtube.com/watch?v=_nAzcyVP_ZQ>
● Hearing brainwaves - epilepsy EEG sonified <https://www.youtube.com/watch?v=I5JKOjZ60P0>
● An instrument for the sonification of everyday things (“non-contact laser triangulation sensor”) <https://www.youtube.com/watch?v=Lyc7VNsxjoA>
● Sonification of Twitter - Scott Lindroth <https://www.youtube.com/watch?v=MUsBeJoBRxw>
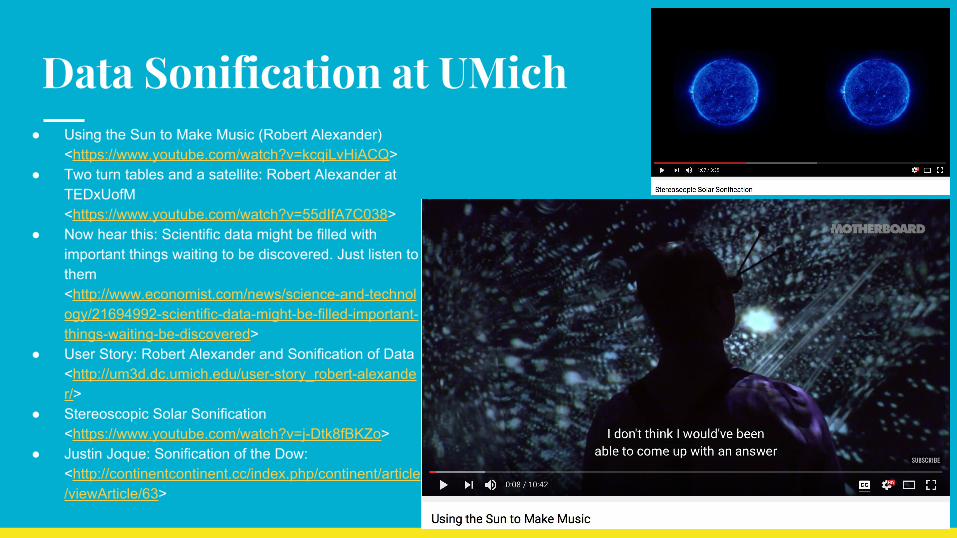
Data Sonification at UMich● Using the Sun to Make Music (Robert Alexander)
<https://www.youtube.com/watch?v=kcqiLvHiACQ> ● Two turn tables and a satellite: Robert Alexander at
TEDxUofM <https://www.youtube.com/watch?v=55dIfA7C038>
● Now hear this: Scientific data might be filled with important things waiting to be discovered. Just listen to them <http://www.economist.com/news/science-and-technology/21694992-scientific-data-might-be-filled-important-things-waiting-be-discovered>
● User Story: Robert Alexander and Sonification of Data <http://um3d.dc.umich.edu/user-story_robert-alexander/>
● Stereoscopic Solar Sonification <https://www.youtube.com/watch?v=j-Dtk8fBKZo>
● Justin Joque: Sonification of the Dow: <http://continentcontinent.cc/index.php/continent/article/viewArticle/63>
Data Sonification: Who, How, Where, & Why
Audio Engineering Society (AES) <http://www.aes.org>
International Community for Auditory Display (ICAD) <http://www.icad.org>
Georgia Tech Sonification Lab (Bruce Waker) <http://sonify.psych.gatech.edu>
Thomas Hermann's research on Sonification, Data Mining and Ambient Intelligence <http://sonification.de>
Berkeley Sonification Links <http://cse.ssl.berkeley.edu/stereo_solarwind/sounds_links.html>
Data Sonification: Selected Terms
● Acoustic technics / acoustic diagnosis / acoustic analysis ● Data composer ● Data sound engineer ● Acoustic ecology● Audification (audify, audified, audificate, etc.)● Auditory Display ● Non-visual overview of data ● Sonic information design● Sonification (sonify, sonified, sonificate, etc.)● Sound design
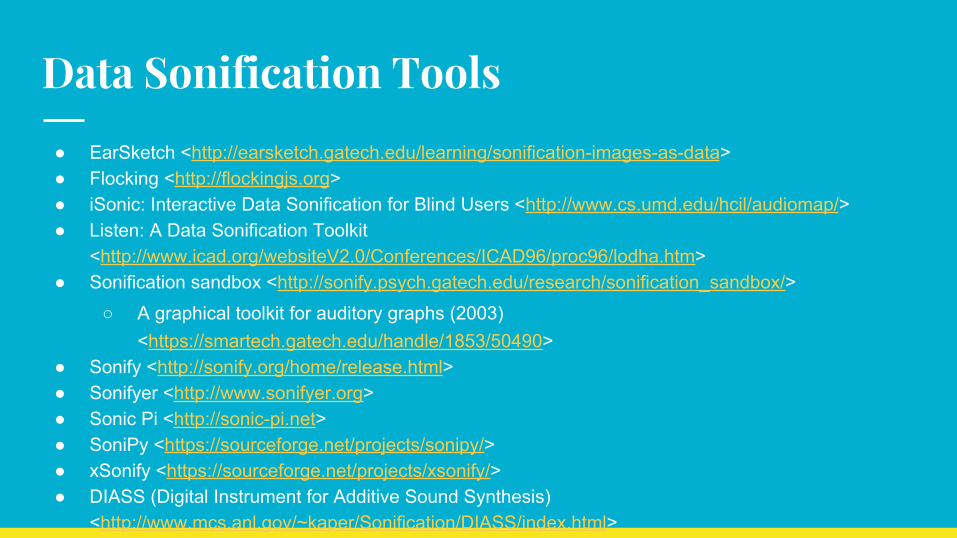
Data Sonification Tools
● EarSketch <http://earsketch.gatech.edu/learning/sonification-images-as-data> ● Flocking <http://flockingjs.org> ● iSonic: Interactive Data Sonification for Blind Users <http://www.cs.umd.edu/hcil/audiomap/> ● Listen: A Data Sonification Toolkit
<http://www.icad.org/websiteV2.0/Conferences/ICAD96/proc96/lodha.htm> ● Sonification sandbox <http://sonify.psych.gatech.edu/research/sonification_sandbox/>
○ A graphical toolkit for auditory graphs (2003) <https://smartech.gatech.edu/handle/1853/50490>
● Sonify <http://sonify.org/home/release.html> ● Sonifyer <http://www.sonifyer.org> ● Sonic Pi <http://sonic-pi.net> ● SoniPy <https://sourceforge.net/projects/sonipy/> ● xSonify <https://sourceforge.net/projects/xsonify/> ● DIASS (Digital Instrument for Additive Sound Synthesis)
<http://www.mcs.anl.gov/~kaper/Sonification/DIASS/index.html>
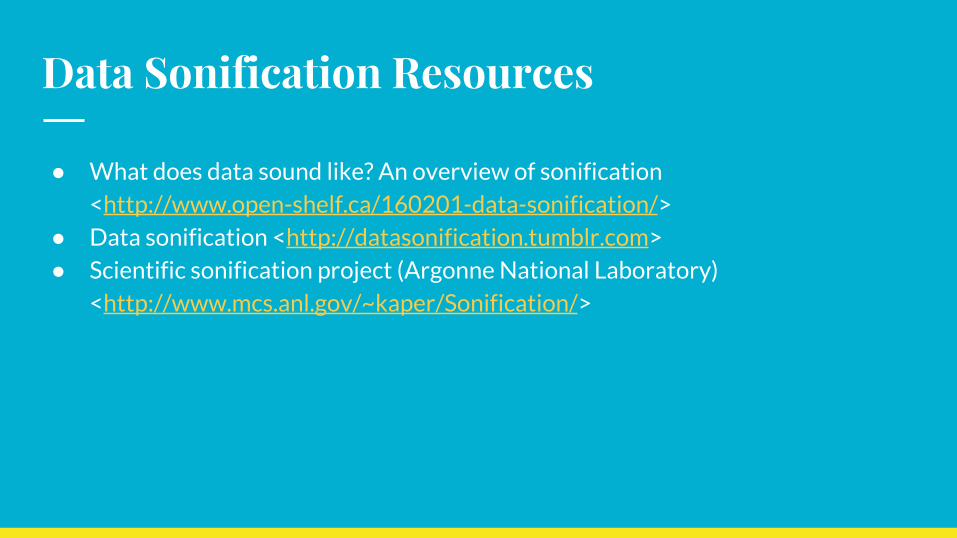
Data Sonification Resources
● What does data sound like? An overview of sonification <http://www.open-shelf.ca/160201-data-sonification/>
● Data sonification <http://datasonification.tumblr.com> ● Scientific sonification project (Argonne National Laboratory)
<http://www.mcs.anl.gov/~kaper/Sonification/>
Data Visualization, Sonification, & Access
Sonification for Accessibility
“An obvious strength of sonification is its utility for people with visual impairments. Sonification has been used by many researchers to make information about objects, colours, and even maps perceivable to visually-impaired users. Representing information in multiple ways that can be understood by those with different perceptual abilities is vital for accessibility.” Jack Jamieson, WHAT DOES DATA SOUND LIKE? AN OVERVIEW OF DATA SONIFICATION, February 1, 2016. <http://www.open-shelf.ca/160201-data-sonification/>
Sonification for Accessibility
“Sonification's most obvious audience would seem to be the learner with visual impairments, but it can also be appreciated by those with cognitive impairments, learning disabilities, or a preference for audio presentation. It can help supplement data visualizations or open new areas for discussion, research and learning.” The Case for Sonification in Open Educational Resources, FLOE Project <http://handbook.floeproject.org/Sonification.html>
Sonification for Access
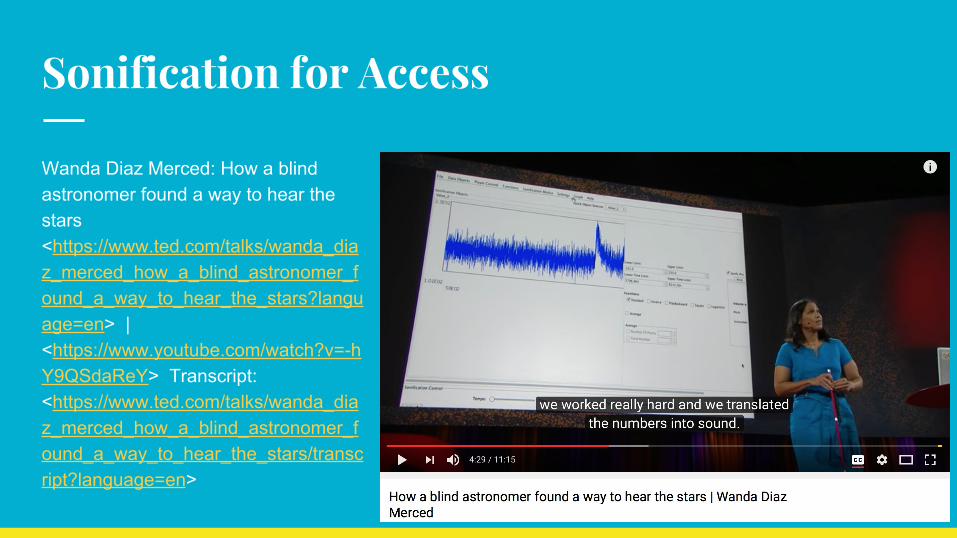
Wanda Diaz Merced: How a blind astronomer found a way to hear the stars <https://www.ted.com/talks/wanda_diaz_merced_how_a_blind_astronomer_found_a_way_to_hear_the_stars?language=en> | <https://www.youtube.com/watch?v=-hY9QSdaReY> Transcript: <https://www.ted.com/talks/wanda_diaz_merced_how_a_blind_astronomer_found_a_way_to_hear_the_stars/transcript?language=en>
Sonification for Access: Examples
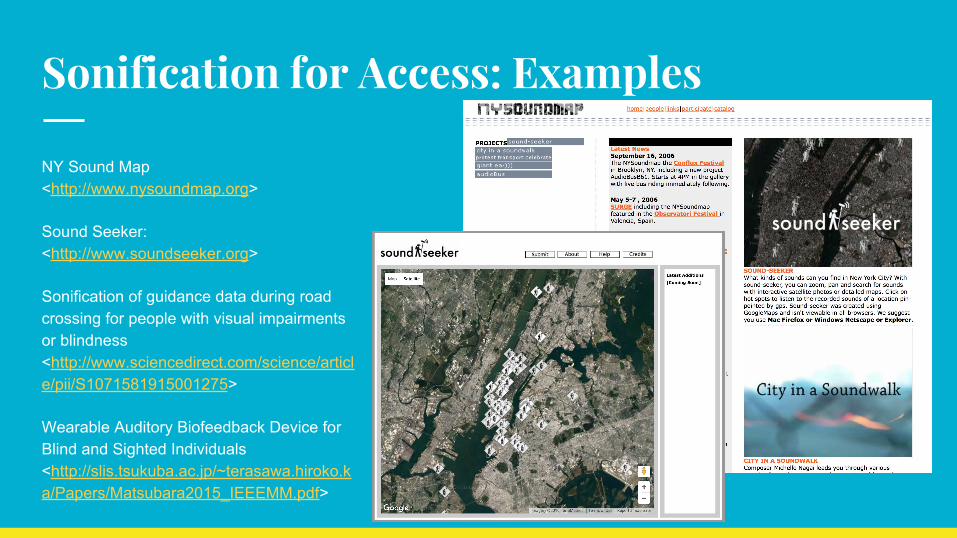
NY Sound Map <http://www.nysoundmap.org>
Sound Seeker: <http://www.soundseeker.org>
Sonification of guidance data during road crossing for people with visual impairments or blindness <http://www.sciencedirect.com/science/article/pii/S1071581915001275>
Wearable Auditory Biofeedback Device for Blind and Sighted Individuals <http://slis.tsukuba.ac.jp/~terasawa.hiroko.ka/Papers/Matsubara2015_IEEEMM.pdf>
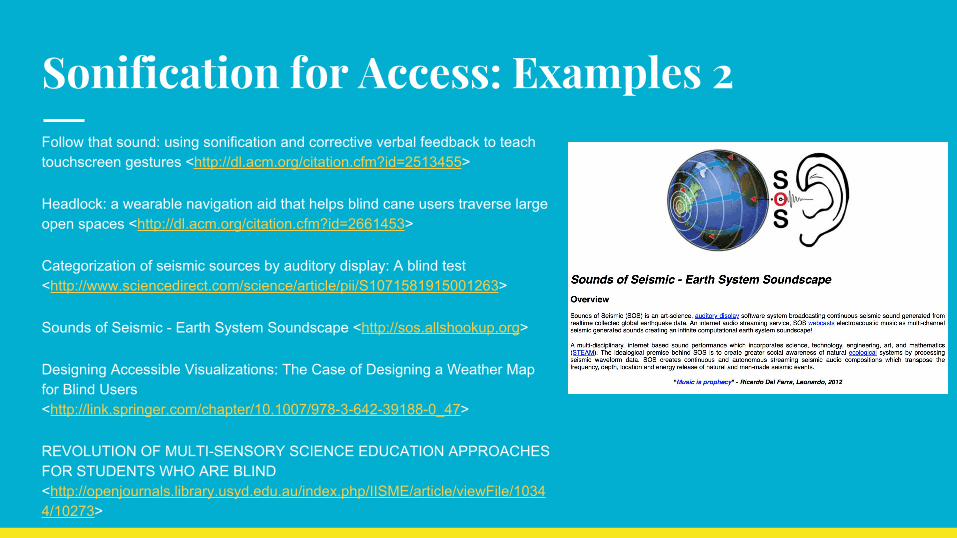
Sonification for Access: Examples 2 Follow that sound: using sonification and corrective verbal feedback to teach touchscreen gestures <http://dl.acm.org/citation.cfm?id=2513455>
Headlock: a wearable navigation aid that helps blind cane users traverse large open spaces <http://dl.acm.org/citation.cfm?id=2661453>
Categorization of seismic sources by auditory display: A blind test <http://www.sciencedirect.com/science/article/pii/S1071581915001263>
Sounds of Seismic - Earth System Soundscape <http://sos.allshookup.org>
Designing Accessible Visualizations: The Case of Designing a Weather Map for Blind Users <http://link.springer.com/chapter/10.1007/978-3-642-39188-0_47>
REVOLUTION OF MULTI-SENSORY SCIENCE EDUCATION APPROACHES FOR STUDENTS WHO ARE BLIND <http://openjournals.library.usyd.edu.au/index.php/IISME/article/viewFile/10344/10273>
Sonification for Access: Examples 3
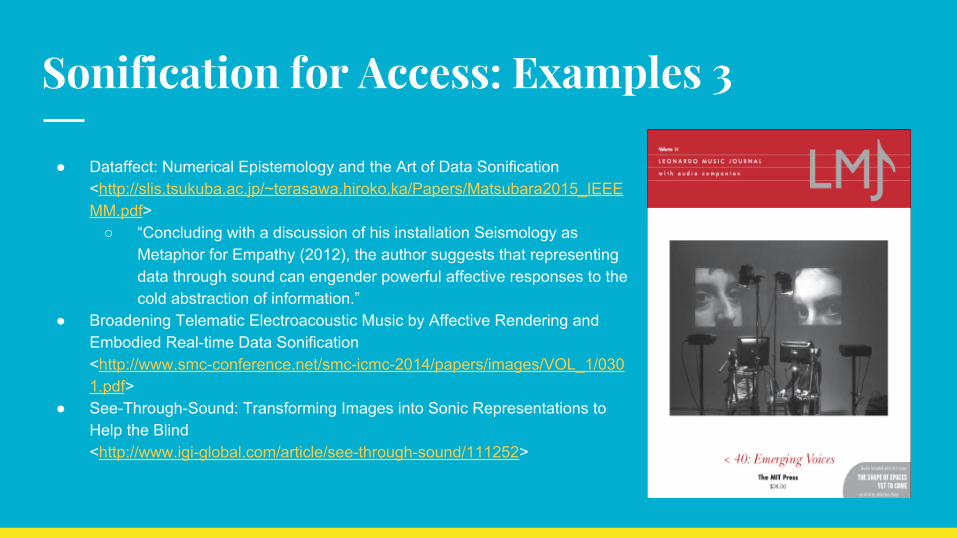
● Dataffect: Numerical Epistemology and the Art of Data Sonification <http://slis.tsukuba.ac.jp/~terasawa.hiroko.ka/Papers/Matsubara2015_IEEEMM.pdf>
○ “Concluding with a discussion of his installation Seismology as Metaphor for Empathy (2012), the author suggests that representing data through sound can engender powerful affective responses to the cold abstraction of information.”
● Broadening Telematic Electroacoustic Music by Affective Rendering and Embodied Real-time Data Sonification <http://www.smc-conference.net/smc-icmc-2014/papers/images/VOL_1/0301.pdf>
● See-Through-Sound: Transforming Images into Sonic Representations to Help the Blind <http://www.igi-global.com/article/see-through-sound/111252>
Data Sonification for Cognitive Differences
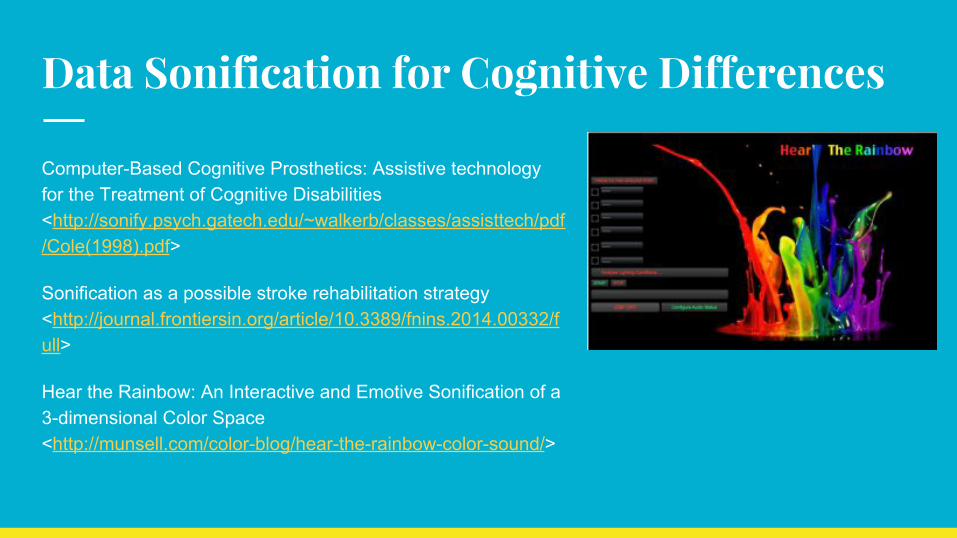
Computer-Based Cognitive Prosthetics: Assistive technology for the Treatment of Cognitive Disabilities <http://sonify.psych.gatech.edu/~walkerb/classes/assisttech/pdf/Cole(1998).pdf>
Sonification as a possible stroke rehabilitation strategy <http://journal.frontiersin.org/article/10.3389/fnins.2014.00332/full>
Hear the Rainbow: An Interactive and Emotive Sonification of a 3-dimensional Color Space <http://munsell.com/color-blog/hear-the-rainbow-color-sound/>
Data Sonification for Access
● Data sonification from the desktop: Should sound be part of standard data analysis software? <http://dl.acm.org/citation.cfm?id=1101544>
● FLOE Project: Inclusive Learning Design Handbook <http://handbook.floeproject.org/index.html> ○ Sonification: What is Sonification? <http://handbook.floeproject.org/Sonification.html>○ FLOE: Sonification Wiki: <https://wiki.fluidproject.org/display/fluid/%28Floe%29+Sonification> ○ Sonificaton Literature Review
<https://docs.google.com/document/d/1tnQyScm86Vj9rFKEogxPeP3x8A79A2dg6yLZ_ARuZtg/edit> ● The Sonification Handbook <http://sonification.de/handbook/> ● Sonification Special Issue <http://www.open-shelf.ca/columns/sonification-special-issue/> ● Quora: How can we make big data accessible to blind people?
<https://www.quora.com/How-can-we-make-big-data-accessible-to-blind-people> ● Universal Usability: Designing Computer Interfaces for Diverse User Populations, Section 5.2.5 Data Sonification
<https://books.google.com/books?id=BeHo0XPylDAC&dq=data+sonification+blind&source=gbs_navlinks_s>
And What About Touch?
And what about touch?
Constructing sonified haptic line graphs for the blind student: first steps <http://dl.acm.org/citation.cfm?id=354330>
Supporting blind navigation using depth sensing and sonification <http://dl.acm.org/citation.cfm?id=2494173> [Kinect]
Sonification of guidance data during road crossing for people with visual impairments or blindness <http://www.sciencedirect.com/science/article/pii/S1071581915001275>
Open Touch/Sound Maps: A system to convey street data through haptic and auditory feedback <http://www.sciencedirect.com/science/article/pii/S0098300413000666>