Embed Size (px)
Citation preview
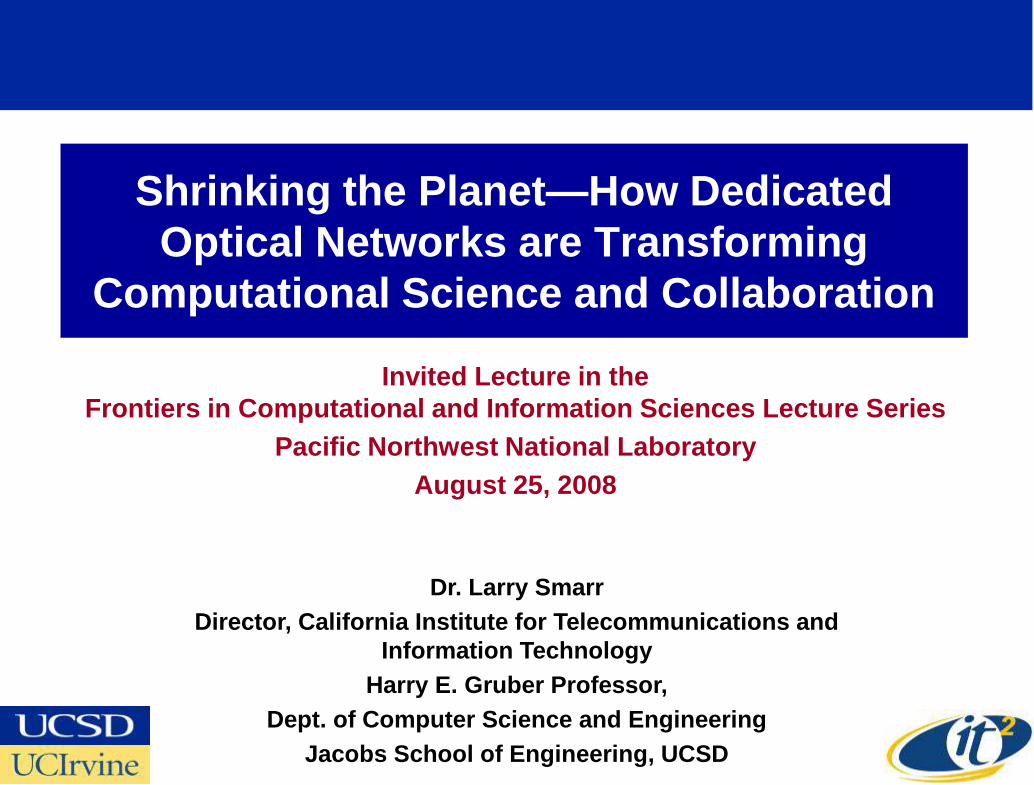
Shrinking the Planet—How Dedicated Optical Networks are Transforming
Computational Science and Collaboration
Invited Lecture in the Frontiers in Computational and Information Sciences Lecture Series
Pacific Northwest National LaboratoryAugust 25, 2008
Dr. Larry SmarrDirector, California Institute for Telecommunications and
Information TechnologyHarry E. Gruber Professor,
Dept. of Computer Science and EngineeringJacobs School of Engineering, UCSD
Abstract
During the last few years, a radical restructuring of global optical networks supporting e-Science projects has caused a paradigm shift in computational science and collaboration technologies. From a scalable tiled display wall in a researcher's campus laboratory, one can experience global Telepresence, augmented by minimized latency to remote global data repositories, scientific instruments, and computational resources. Calit2 is using its two campuses at UCSD and UCI to prototype the “research campus of the future” by deploying campus-scale “Green” research cyberinfrastructure, providing “on-ramps” to the National LambdaRail and the Global Integrated Lambda Facility. I will describe how this user configurable "OptIPuter" global platform opens new frontiers in many disciplines of science, such as interactive environmental observatories, climate change simulations, brain imaging, and marine microbial metagenomics, as well as in collaborative work environments, digital cinema, and visual cultural analytics. Specifically, I will discuss how PNNL and UCSD could set up an OptIPuter collaboratory to support their new joint Aerosol Chemistry and Climate Institute (ACCI).
.
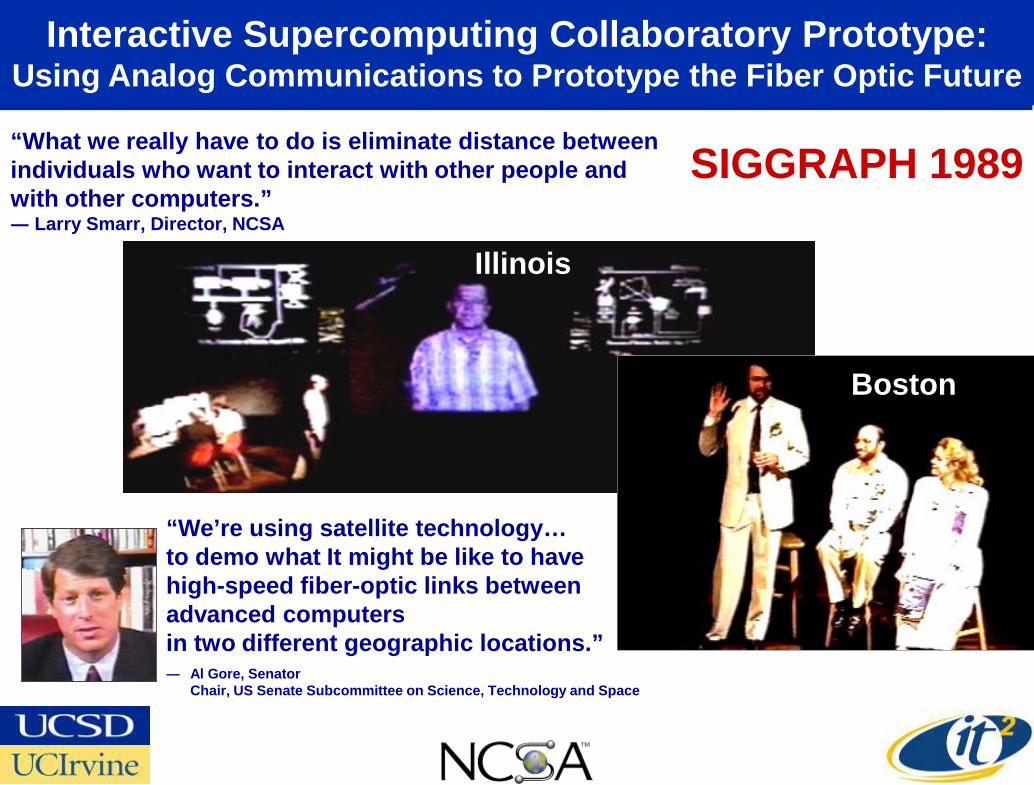
Interactive Supercomputing Collaboratory Prototype: Using Analog Communications to Prototype the Fiber Optic Future
“We’re using satellite technology…to demo what It might be like to have high-speed fiber-optic links between advanced computers in two different geographic locations.”― Al Gore, Senator
Chair, US Senate Subcommittee on Science, Technology and Space
Illinois
Boston
SIGGRAPH 1989“What we really have to do is eliminate distance between individuals who want to interact with other people and with other computers.”― Larry Smarr, Director, NCSA
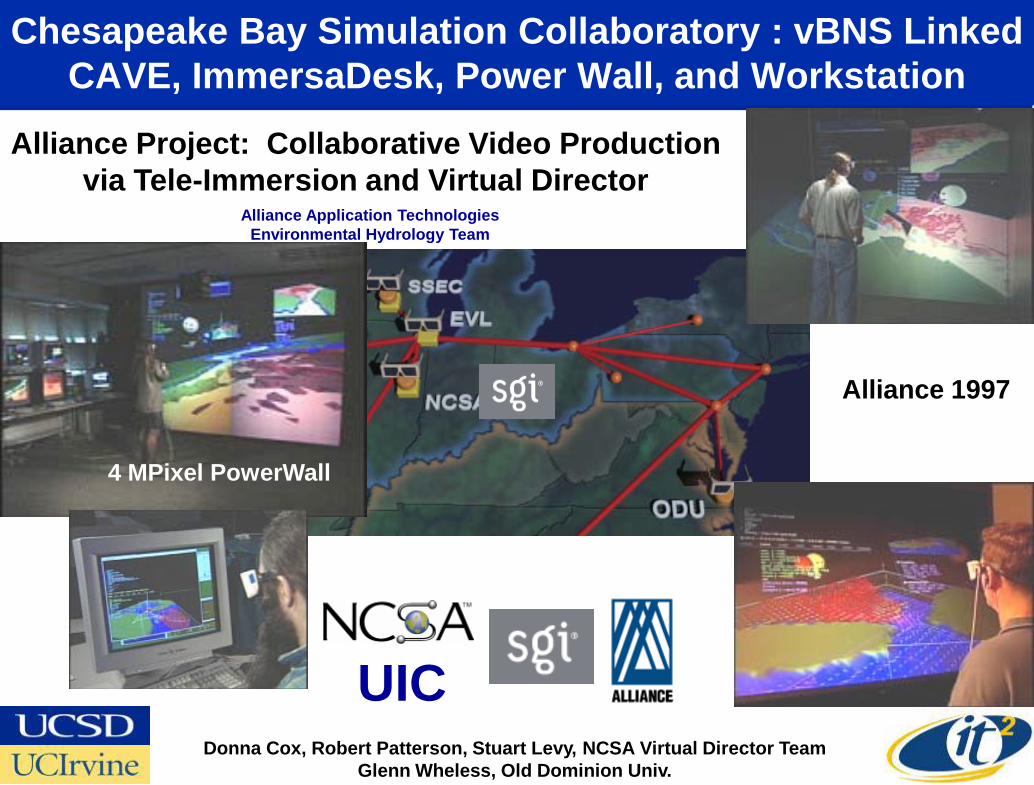
Chesapeake Bay Simulation Collaboratory : vBNS Linked CAVE, ImmersaDesk, Power Wall, and Workstation
Alliance Project: Collaborative Video Productionvia Tele-Immersion and Virtual Director
UICDonna Cox, Robert Patterson, Stuart Levy, NCSA Virtual Director Team
Glenn Wheless, Old Dominion Univ.
Alliance Application TechnologiesEnvironmental Hydrology Team
4 MPixel PowerWall
Alliance 1997
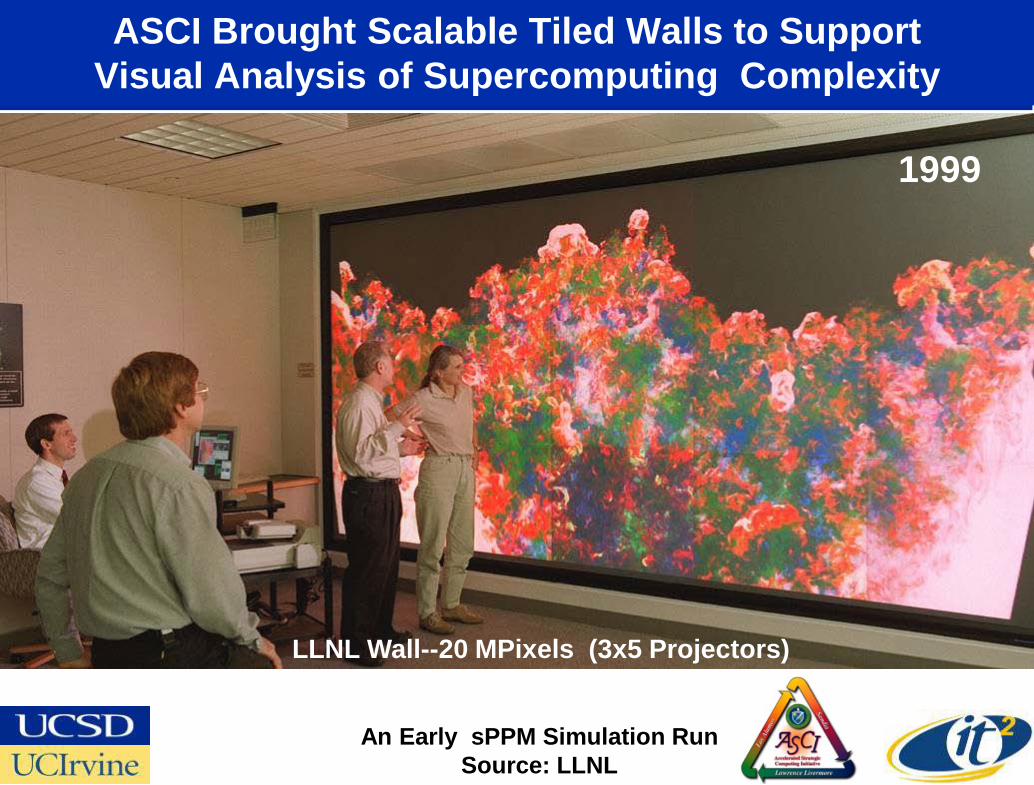
ASCI Brought Scalable Tiled Walls to Support Visual Analysis of Supercomputing Complexity
An Early sPPM Simulation RunSource: LLNL
1999
LLNL Wall--20 MPixels (3x5 Projectors)
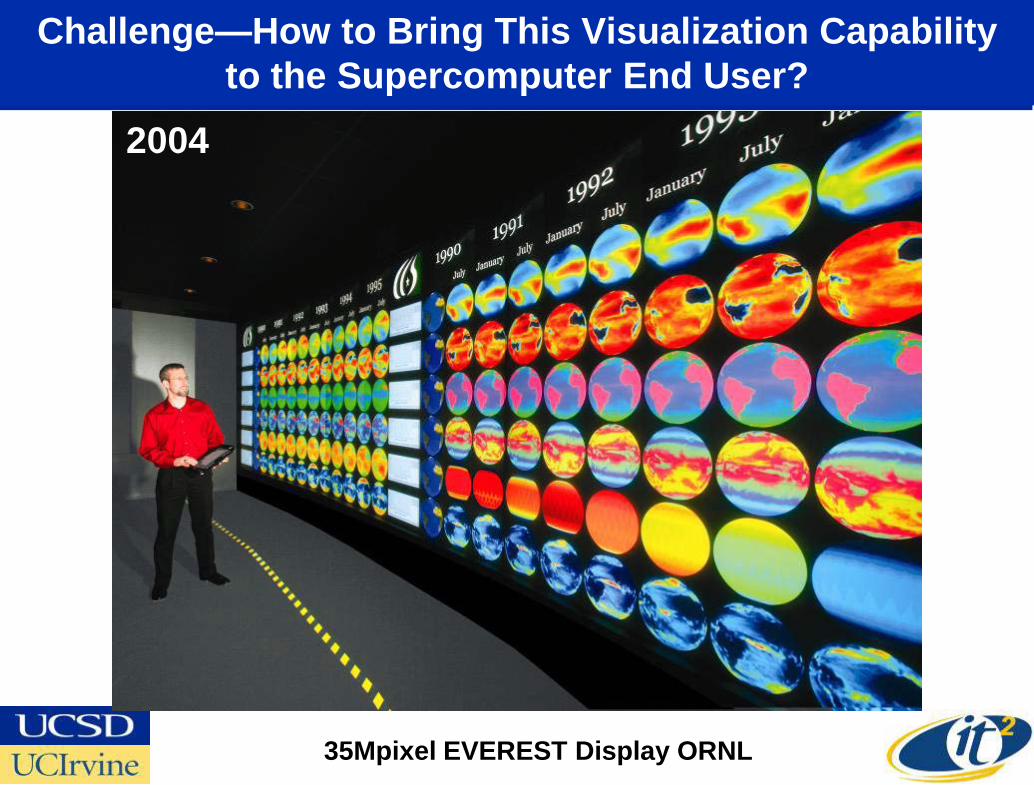
Challenge—How to Bring This Visualization Capability to the Supercomputer End User?
35Mpixel EVEREST Display ORNL
2004
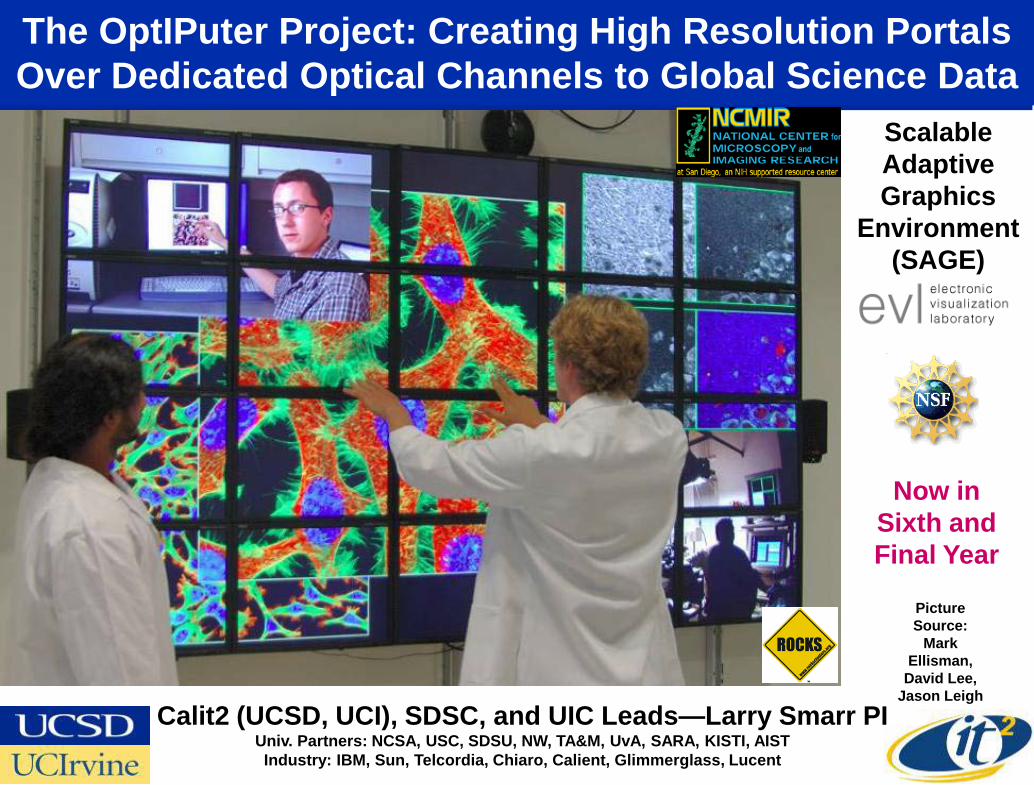
The OptIPuter Project: Creating High Resolution Portals Over Dedicated Optical Channels to Global Science Data
Picture Source:
Mark Ellisman,
David Lee, Jason Leigh
Calit2 (UCSD, UCI), SDSC, and UIC Leads—Larry Smarr PIUniv. Partners: NCSA, USC, SDSU, NW, TA&M, UvA, SARA, KISTI, AISTIndustry: IBM, Sun, Telcordia, Chiaro, Calient, Glimmerglass, Lucent
Now in Sixth and Final Year
Scalable Adaptive Graphics
Environment (SAGE)
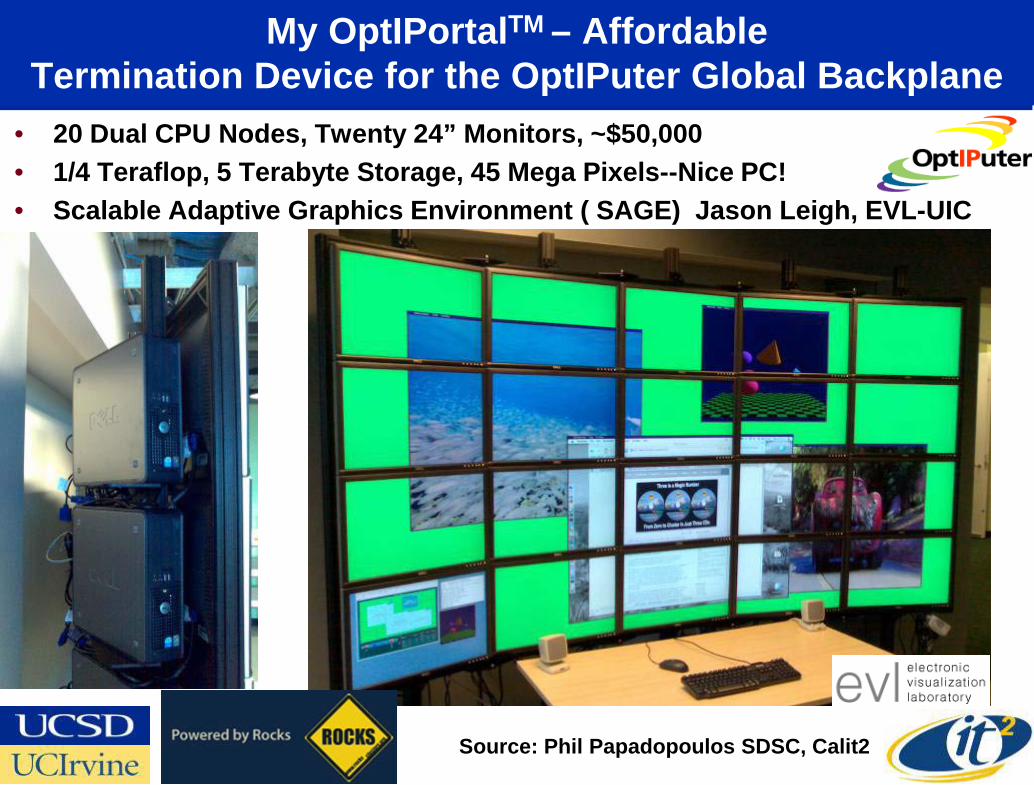
My OptIPortalTM – AffordableTermination Device for the OptIPuter Global Backplane
• 20 Dual CPU Nodes, Twenty 24” Monitors, ~$50,000• 1/4 Teraflop, 5 Terabyte Storage, 45 Mega Pixels--Nice PC!• Scalable Adaptive Graphics Environment ( SAGE) Jason Leigh, EVL-UIC
Source: Phil Papadopoulos SDSC, Calit2
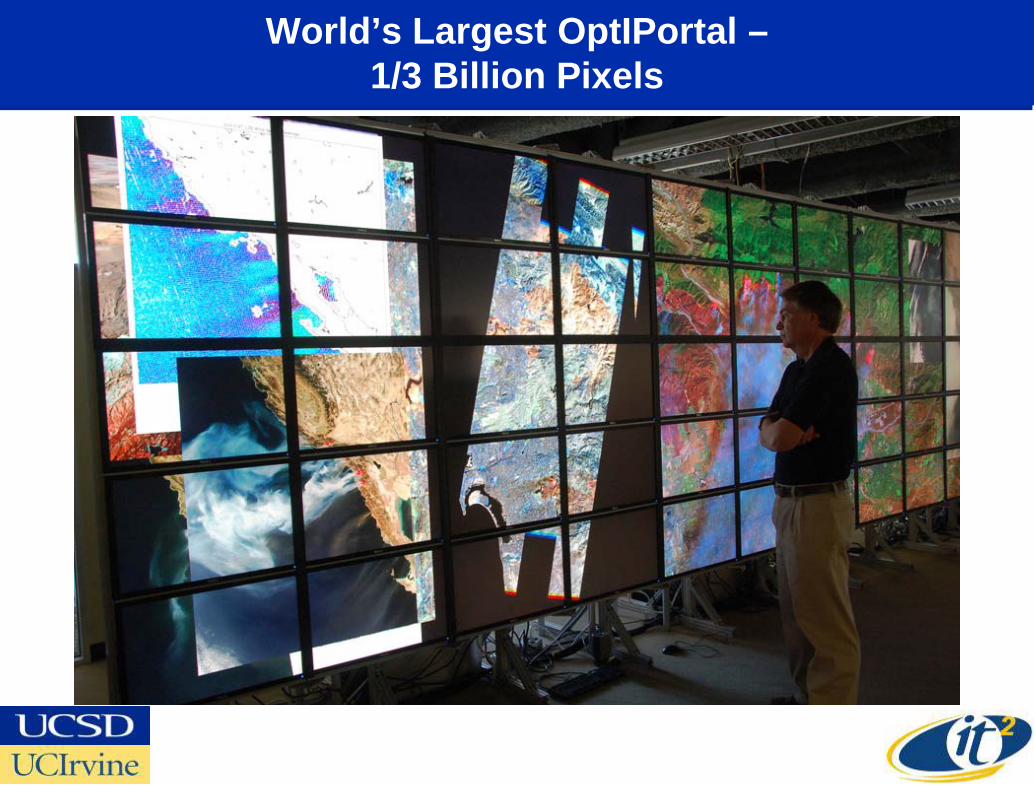
World’s Largest OptIPortal –1/3 Billion Pixels
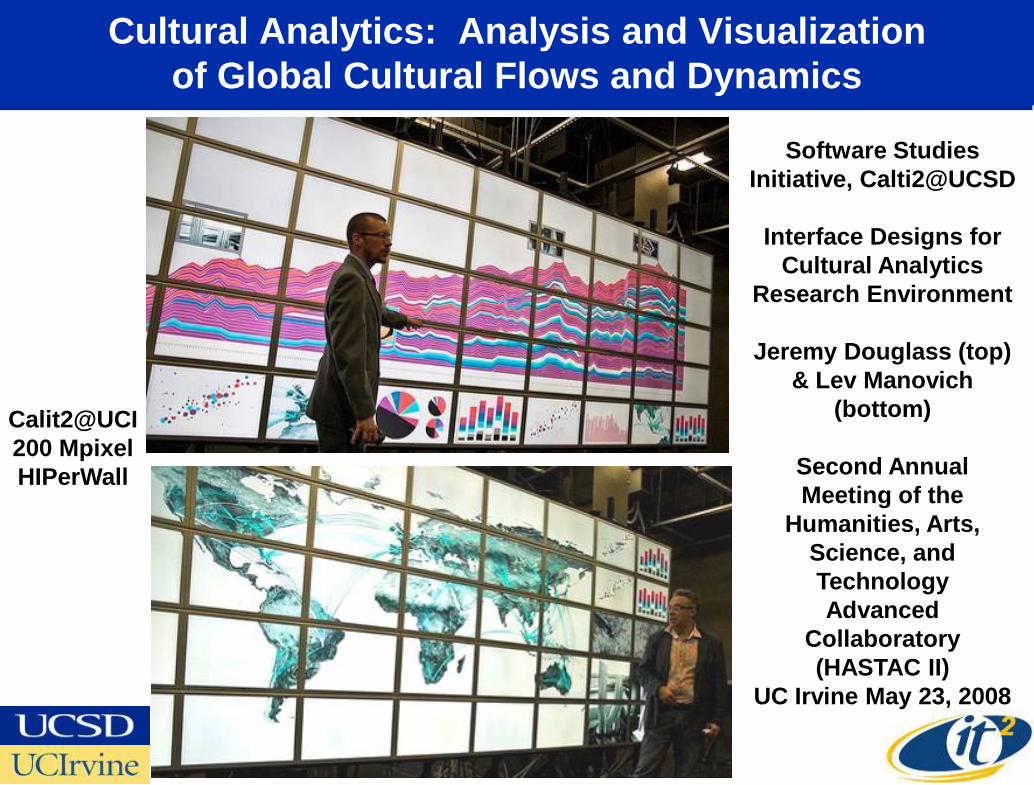
Cultural Analytics: Analysis and Visualization of Global Cultural Flows and Dynamics
Software Studies Initiative, Calti2@UCSD
Interface Designs for Cultural Analytics
Research Environment
Jeremy Douglass (top) & Lev Manovich
(bottom)
Second Annual Meeting of the
Humanities, Arts, Science, and Technology Advanced
Collaboratory(HASTAC II)
UC Irvine May 23, 2008
Calit2@UCI200 MpixelHIPerWall
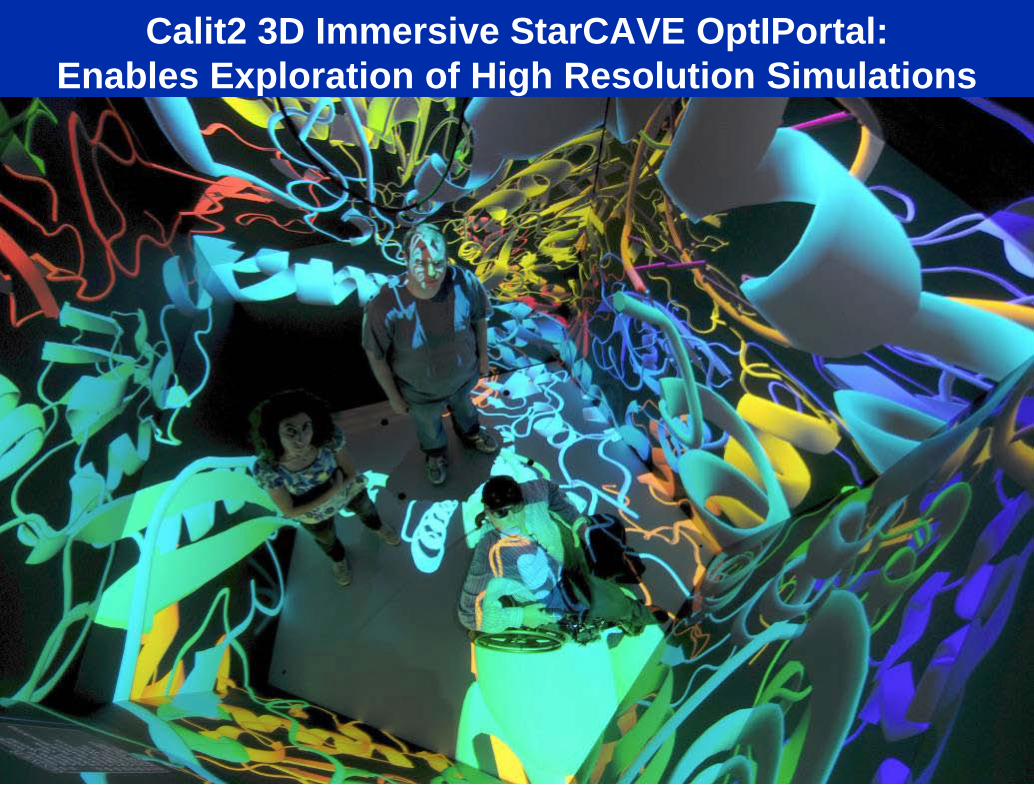
Calit2 3D Immersive StarCAVE OptIPortal:Enables Exploration of High Resolution Simulations
Cluster with 30 Nvidia 5600 cards-60 GB Texture Memory
Source: Tom DeFanti, Greg Dawe, Calit2
Connected at 50 Gb/s to Quartzite
30 HD Projectors!
15 Meyer Sound Speakers + Subwoofer
Passive Polarization--Optimized the
Polarization Separation and Minimized Attenuation
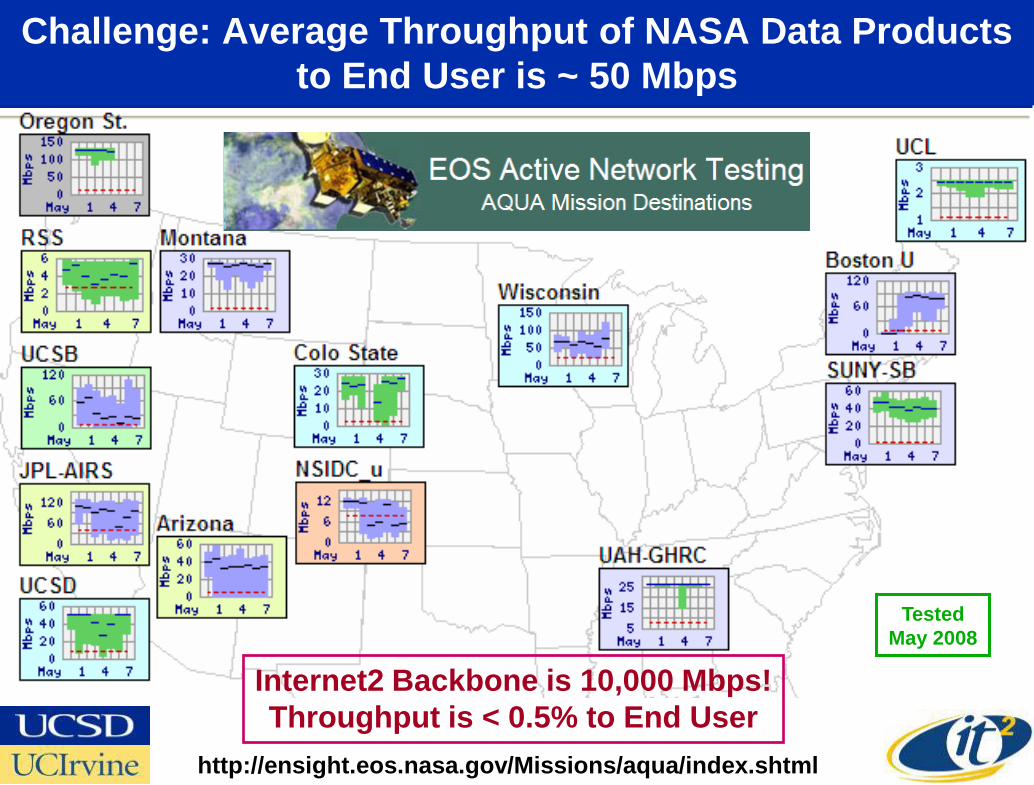
Challenge: Average Throughput of NASA Data Products to End User is ~ 50 Mbps
Internet2 Backbone is 10,000 Mbps!Throughput is < 0.5% to End User
TestedMay 2008
http://ensight.eos.nasa.gov/Missions/aqua/index.shtml
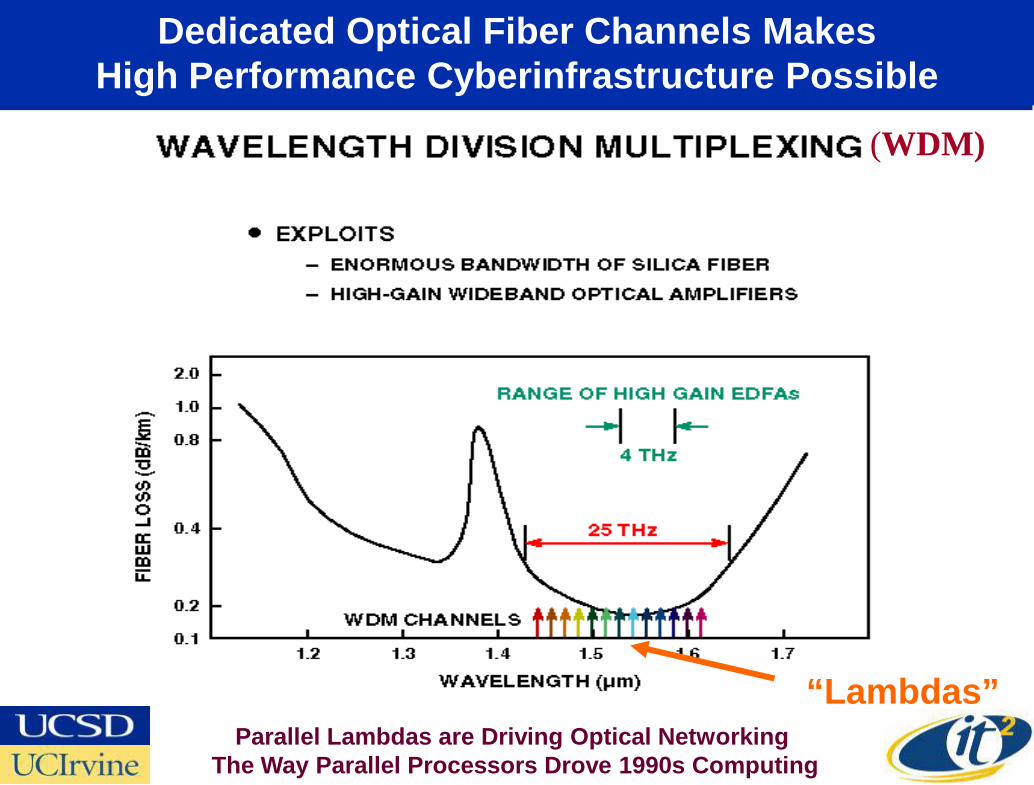
fc *λ=
Dedicated Optical Fiber Channels Makes High Performance Cyberinfrastructure Possible
(WDM)
“Lambdas”Parallel Lambdas are Driving Optical Networking
The Way Parallel Processors Drove 1990s Computing
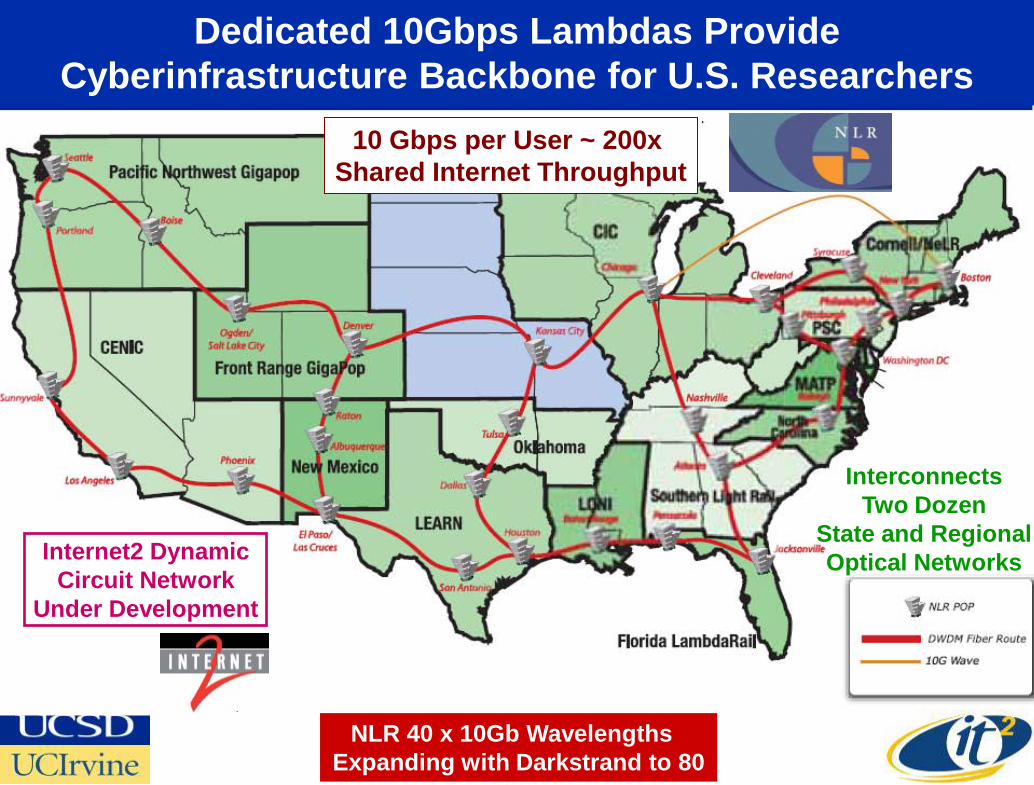
Dedicated 10Gbps Lambdas Provide Cyberinfrastructure Backbone for U.S. Researchers
NLR 40 x 10Gb Wavelengths Expanding with Darkstrand to 80
Interconnects Two Dozen
State and Regional Optical NetworksInternet2 Dynamic
Circuit Network Under Development
10 Gbps per User ~ 200x Shared Internet Throughput
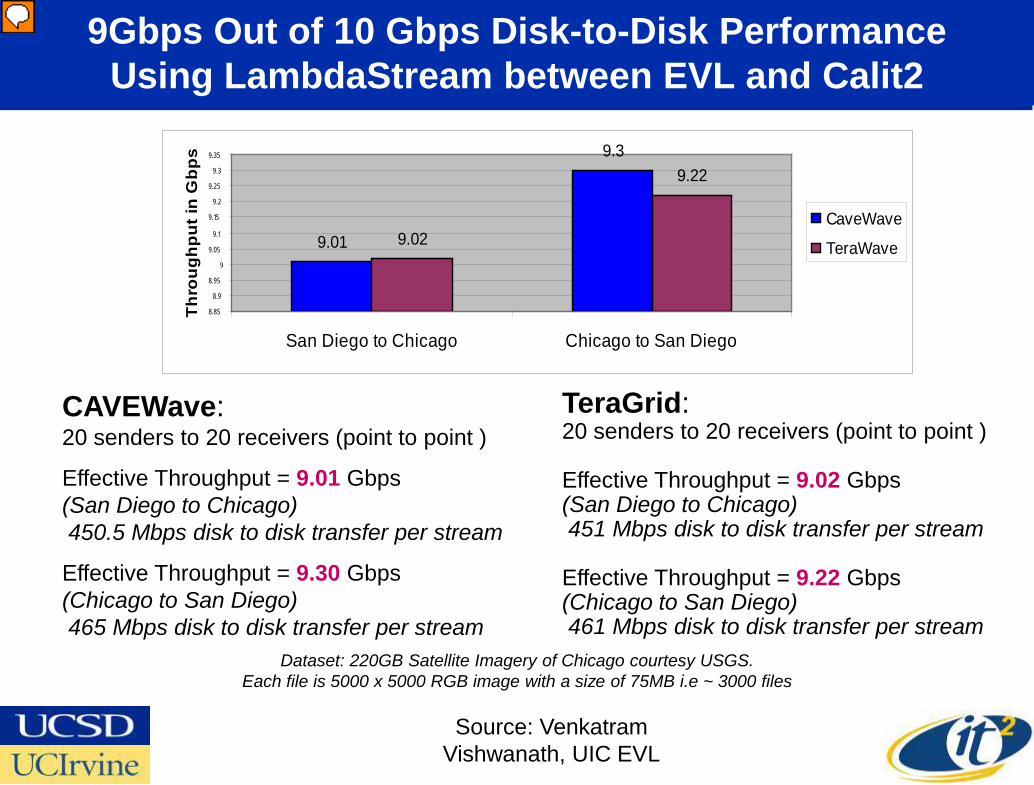
9Gbps Out of 10 Gbps Disk-to-Disk Performance Using LambdaStream between EVL and Calit2
CAVEWave:20 senders to 20 receivers (point to point )
Effective Throughput = 9.01 Gbps(San Diego to Chicago)450.5 Mbps disk to disk transfer per stream
Effective Throughput = 9.30 Gbps(Chicago to San Diego)465 Mbps disk to disk transfer per stream
TeraGrid:20 senders to 20 receivers (point to point )
Effective Throughput = 9.02 Gbps(San Diego to Chicago)451 Mbps disk to disk transfer per stream
Effective Throughput = 9.22 Gbps(Chicago to San Diego)461 Mbps disk to disk transfer per stream
9.01
9.3
9.02
9.22
8.85
8.9
8.95
9
9.05
9.1
9.15
9.2
9.25
9.3
9.35
San Diego to Chicago Chicago to San Diego
Thro
ughp
ut in
Gbp
s
CaveWave
TeraWave
Dataset: 220GB Satellite Imagery of Chicago courtesy USGS.Each file is 5000 x 5000 RGB image with a size of 75MB i.e ~ 3000 files
Source: Venkatram Vishwanath, UIC EVL
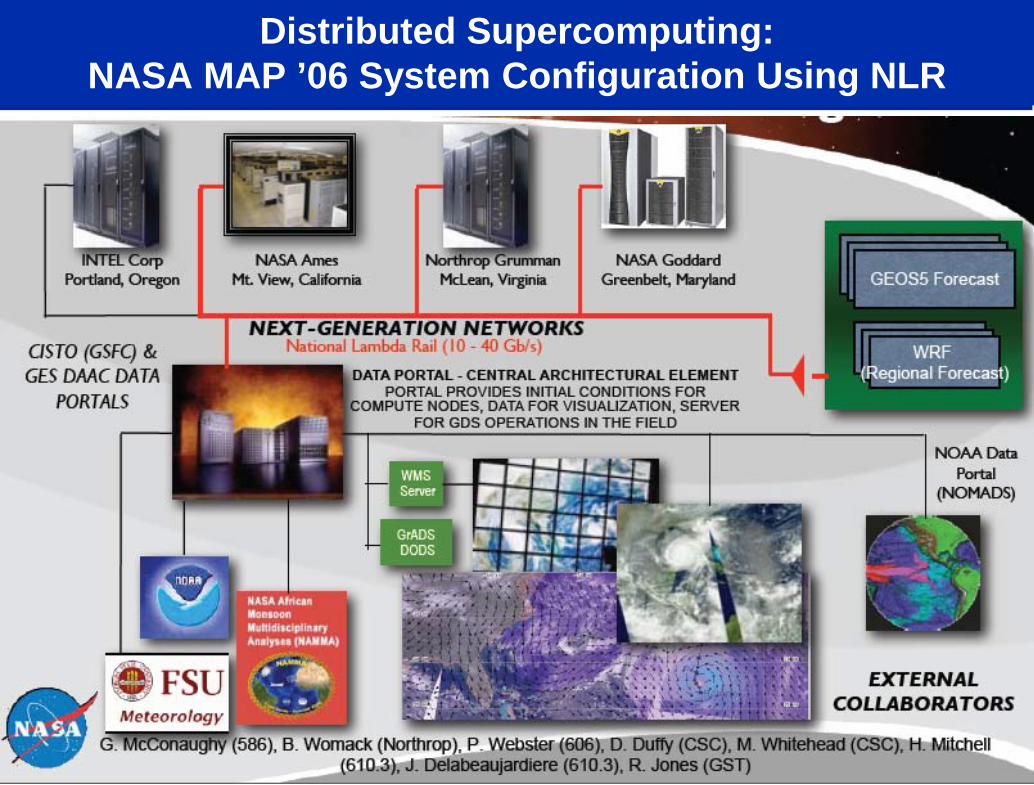
Distributed Supercomputing: NASA MAP ’06 System Configuration Using NLR
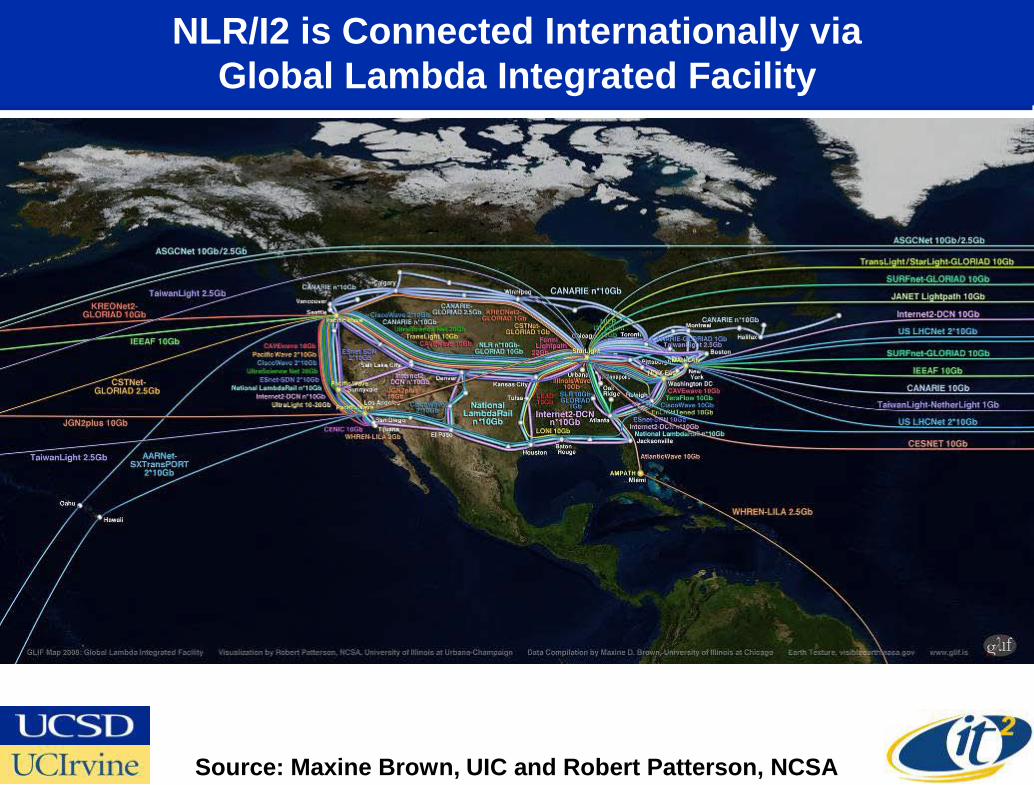
NLR/I2 is Connected Internationally viaGlobal Lambda Integrated Facility
Source: Maxine Brown, UIC and Robert Patterson, NCSA
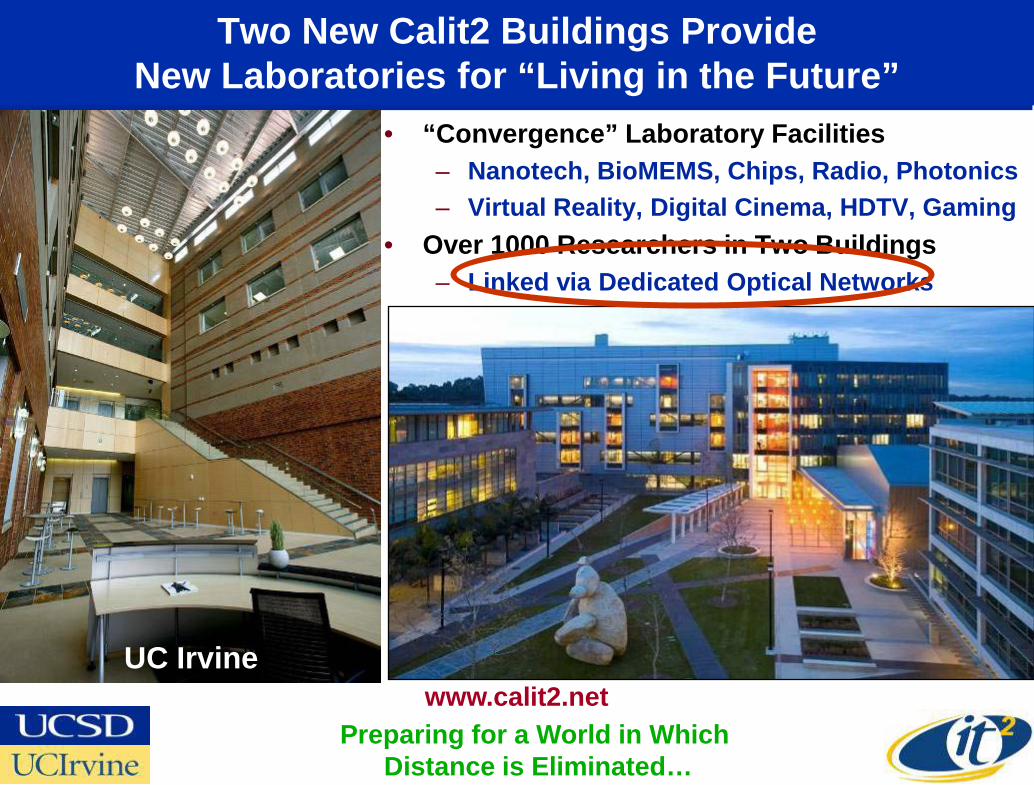
Two New Calit2 Buildings Provide New Laboratories for “Living in the Future”
• “Convergence” Laboratory Facilities– Nanotech, BioMEMS, Chips, Radio, Photonics– Virtual Reality, Digital Cinema, HDTV, Gaming
• Over 1000 Researchers in Two Buildings– Linked via Dedicated Optical Networks
UC Irvinewww.calit2.net
Preparing for a World in Which Distance is Eliminated…
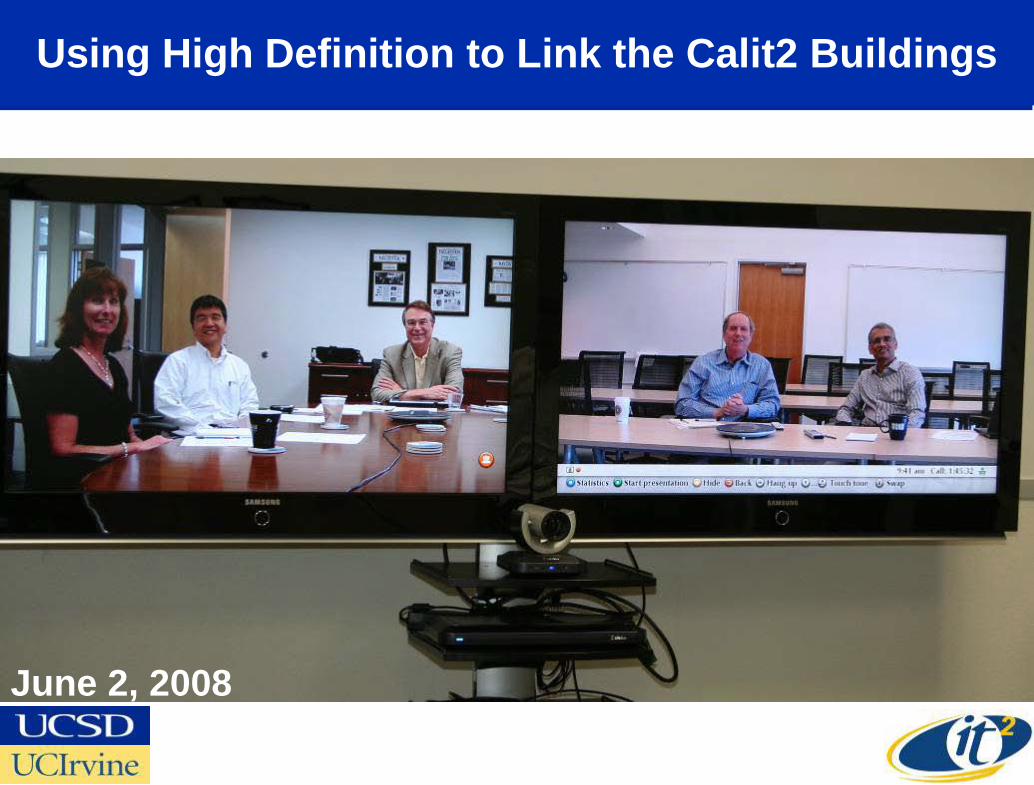
Using High Definition to Link the Calit2 Buildings
June 2, 2008
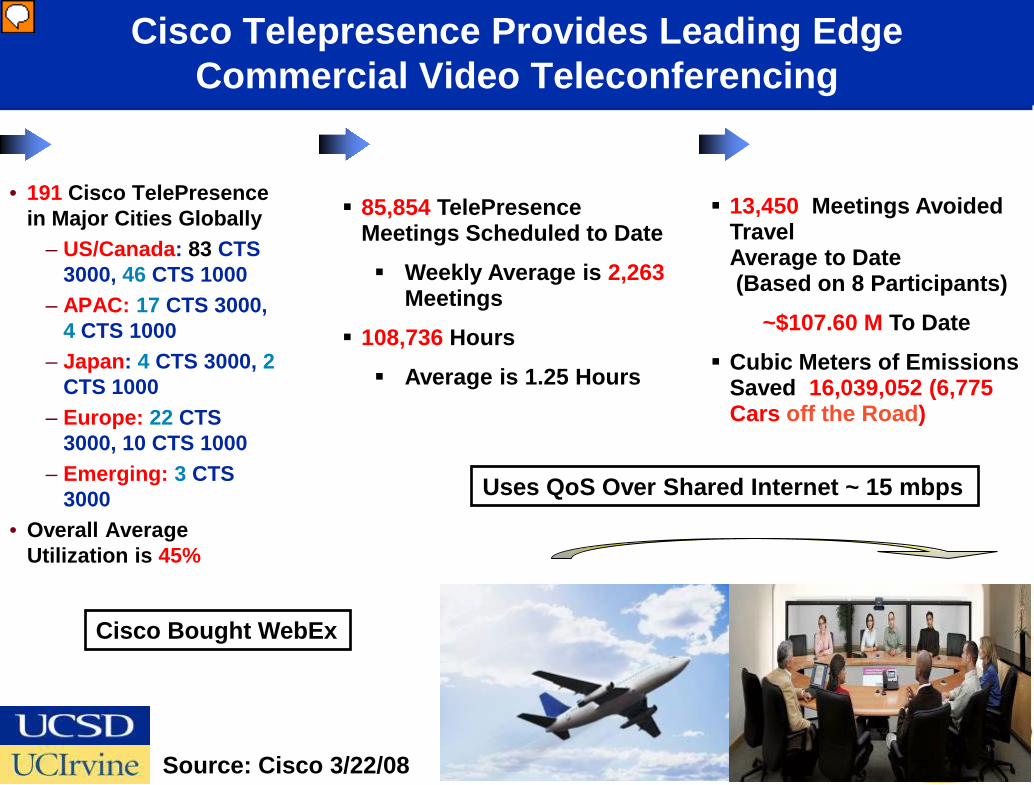
Cisco Telepresence Provides Leading Edge Commercial Video Teleconferencing
• 191 Cisco TelePresence in Major Cities Globally
– US/Canada: 83 CTS 3000, 46 CTS 1000
– APAC: 17 CTS 3000, 4 CTS 1000
– Japan: 4 CTS 3000, 2CTS 1000
– Europe: 22 CTS 3000, 10 CTS 1000
– Emerging: 3 CTS 3000
• Overall Average Utilization is 45%
85,854 TelePresence Meetings Scheduled to Date Weekly Average is 2,263
Meetings 108,736 Hours Average is 1.25 Hours
13,450 Meetings Avoided Travel Average to Date(Based on 8 Participants)
~$107.60 M To Date Cubic Meters of Emissions
Saved 16,039,052 (6,775 Cars off the Road)
Source: Cisco 3/22/08
Cisco Bought WebEx
Uses QoS Over Shared Internet ~ 15 mbps
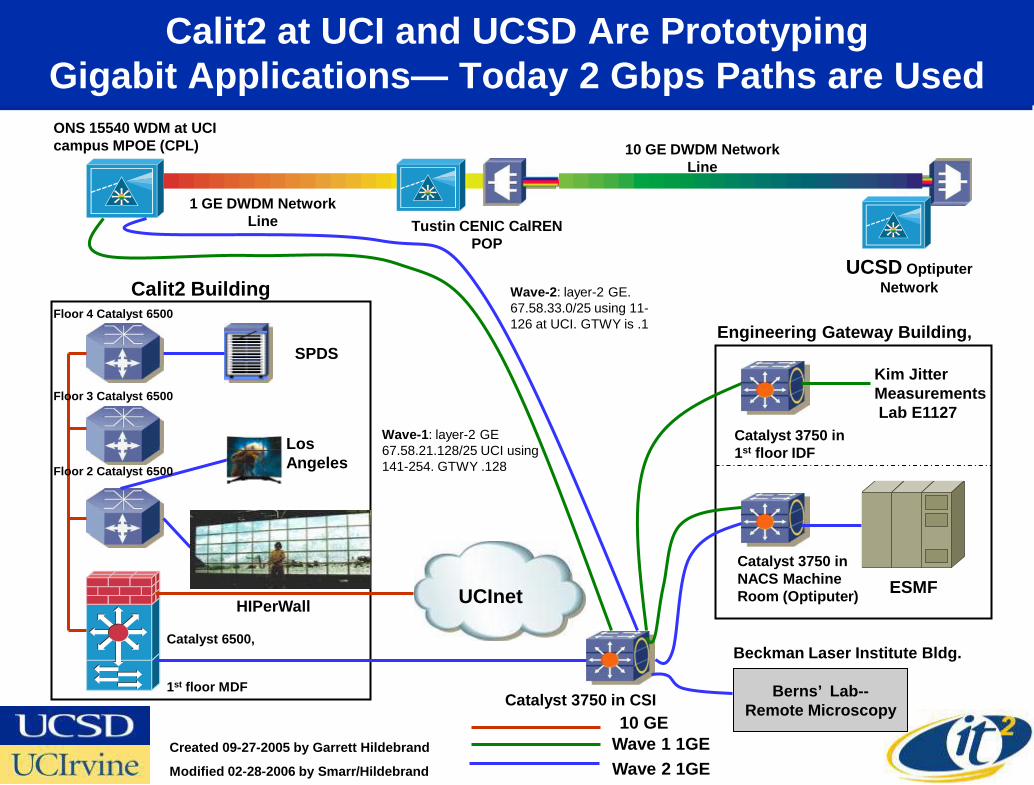
Created 09-27-2005 by Garrett Hildebrand
Modified 02-28-2006 by Smarr/Hildebrand
Calit2 Building
UCInet
10 GE
HIPerWall
LosAngeles
SPDS
Catalyst 3750 in CSI
ONS 15540 WDM at UCI campus MPOE (CPL)
1 GE DWDM Network Line Tustin CENIC CalREN
POPUCSD Optiputer
Network
10 GE DWDM Network Line
Engineering Gateway Building,
Catalyst 3750 in 1st floor IDF
Catalyst 6500,
1st floor MDF
Wave-2: layer-2 GE. 67.58.33.0/25 using 11-126 at UCI. GTWY is .1
Floor 2 Catalyst 6500
Floor 3 Catalyst 6500
Floor 4 Catalyst 6500
Wave-1: layer-2 GE 67.58.21.128/25 UCI using 141-254. GTWY .128
ESMFCatalyst 3750 in NACS Machine Room (Optiputer)
Kim JitterMeasurementsLab E1127
Wave 1 1GEWave 2 1GE
Calit2 at UCI and UCSD Are Prototyping Gigabit Applications— Today 2 Gbps Paths are Used
Berns’ Lab--Remote Microscopy
Beckman Laser Institute Bldg.
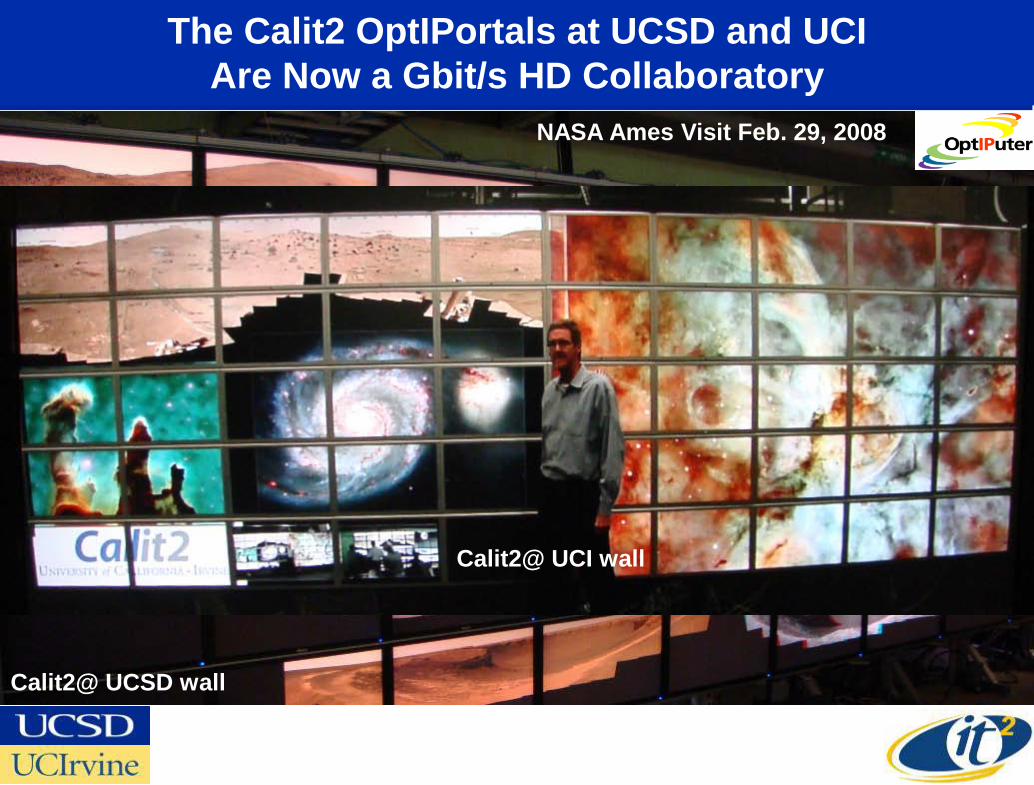
The Calit2 OptIPortals at UCSD and UCI Are Now a Gbit/s HD Collaboratory
Calit2@ UCSD wall
Calit2@ UCI wall
NASA Ames Visit Feb. 29, 2008
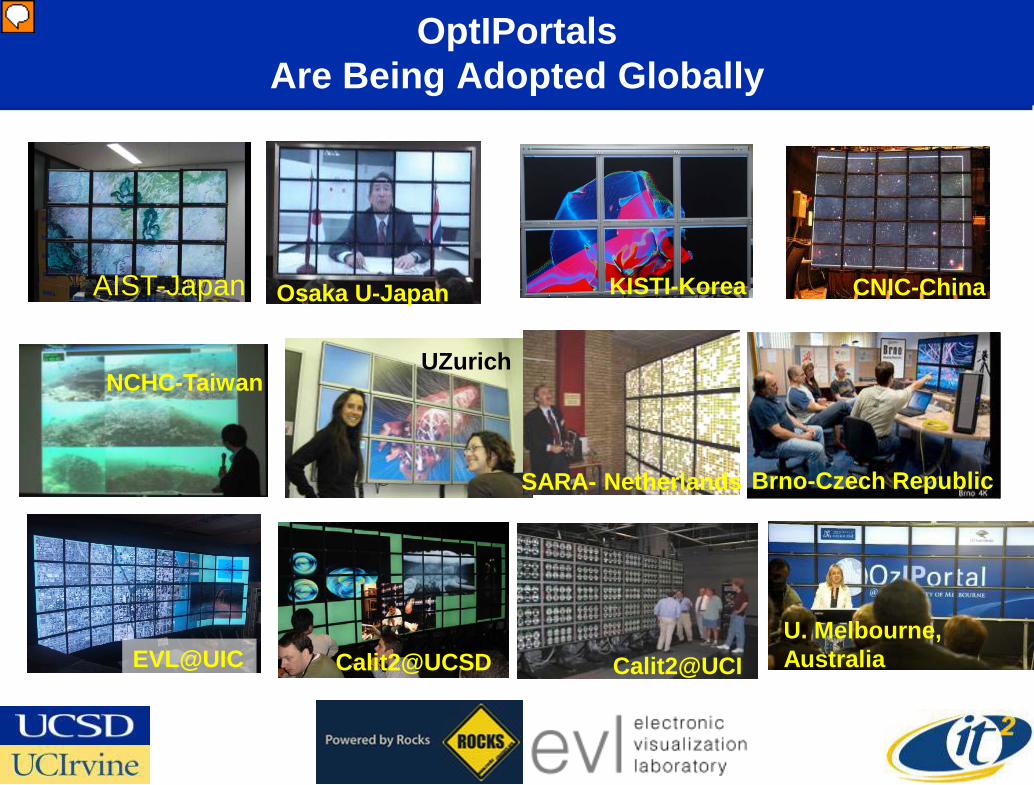
OptIPortalsAre Being Adopted Globally
EVL@UIC Calit2@UCI
KISTI-Korea
Calit2@UCSD
AIST-Japan
UZurich
CNIC-China
NCHC-Taiwan
Osaka U-Japan
SARA- Netherlands Brno-Czech Republic
Calit2@UCIU. Melbourne, Australia
Source: Maxine Brown, OptIPuter Project Manager
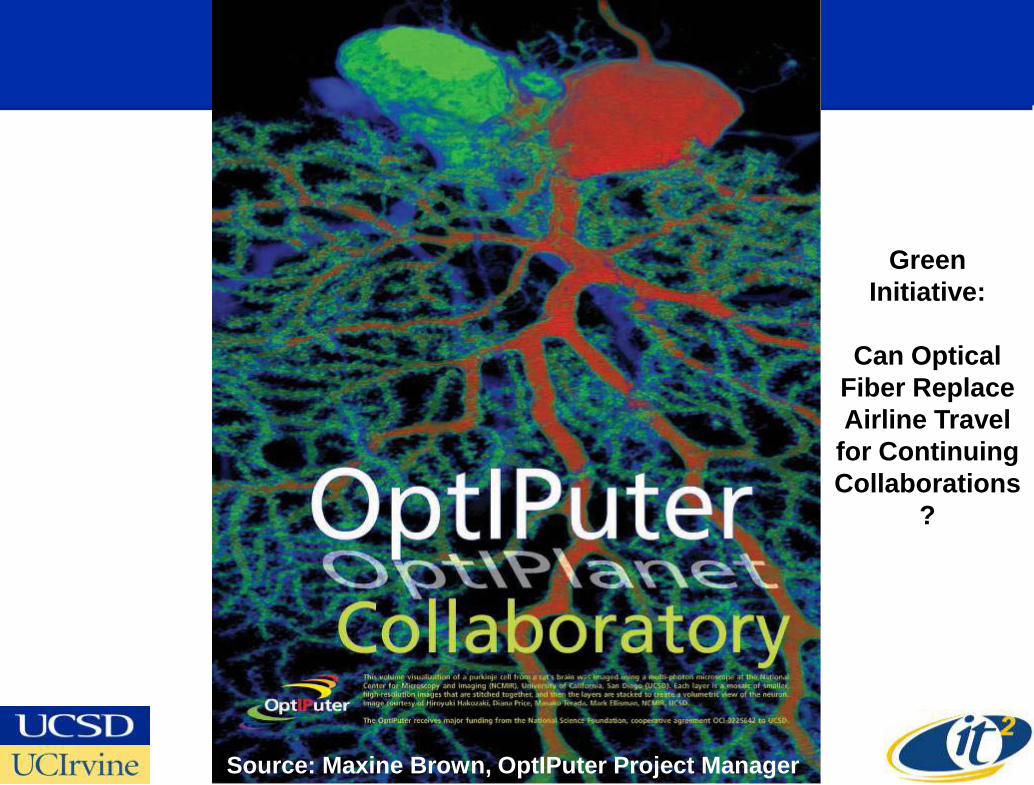
GreenInitiative:
Can Optical Fiber Replace Airline Travel
for Continuing Collaborations
?
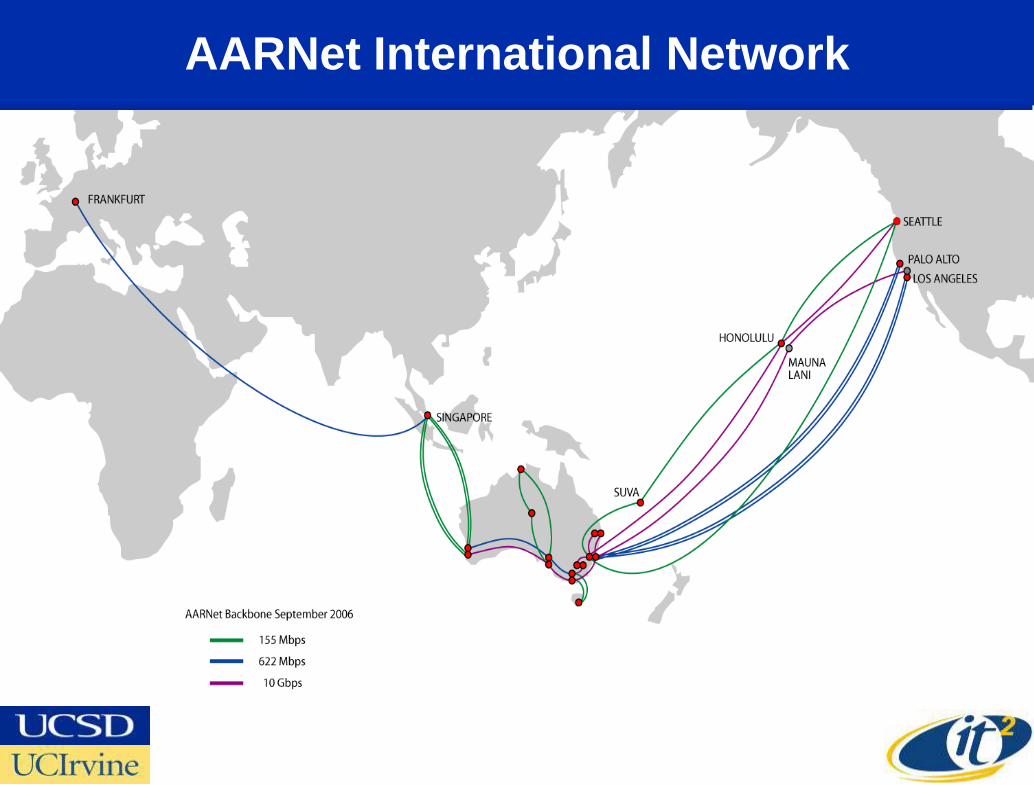
AARNet International Network
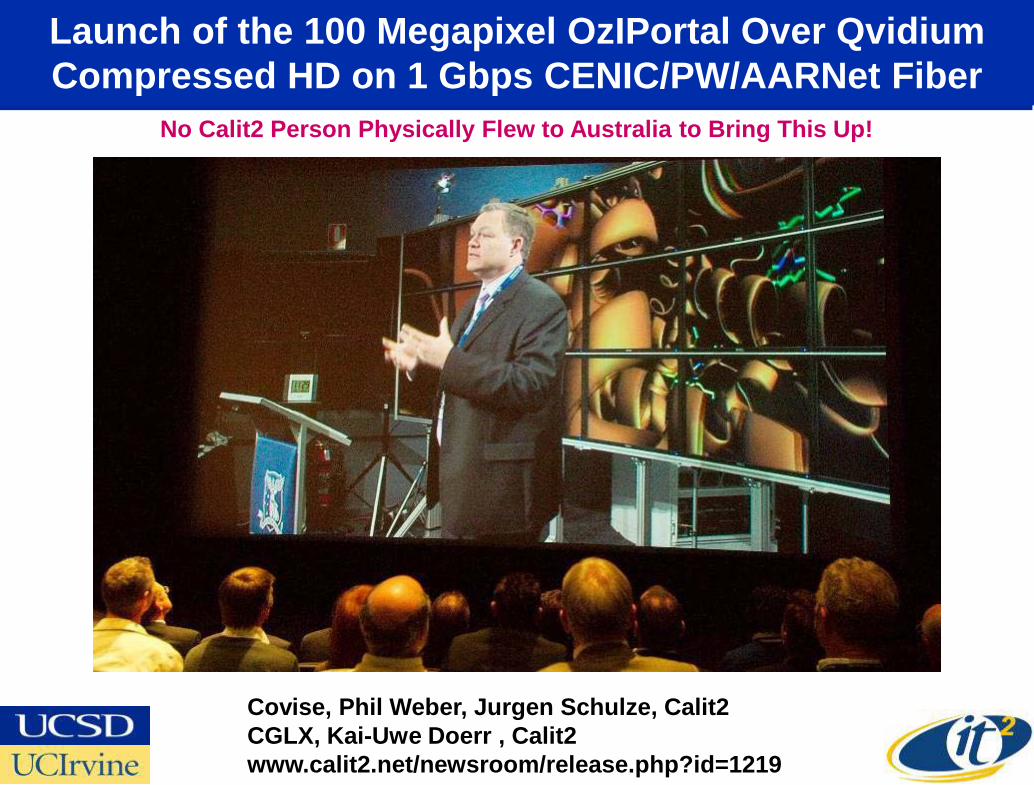
Launch of the 100 Megapixel OzIPortal Over Qvidium Compressed HD on 1 Gbps CENIC/PW/AARNet Fiber
Covise, Phil Weber, Jurgen Schulze, Calit2CGLX, Kai-Uwe Doerr , Calit2www.calit2.net/newsroom/release.php?id=1219
No Calit2 Person Physically Flew to Australia to Bring This Up!
January 15, 2008

Victoria Premier and Australian Deputy Prime Minister Asking Questions
www.calit2.net/newsroom/release.php?id=1219

University of Melbourne Vice Chancellor Glyn Davis in Calit2 Replies to Question from Australia
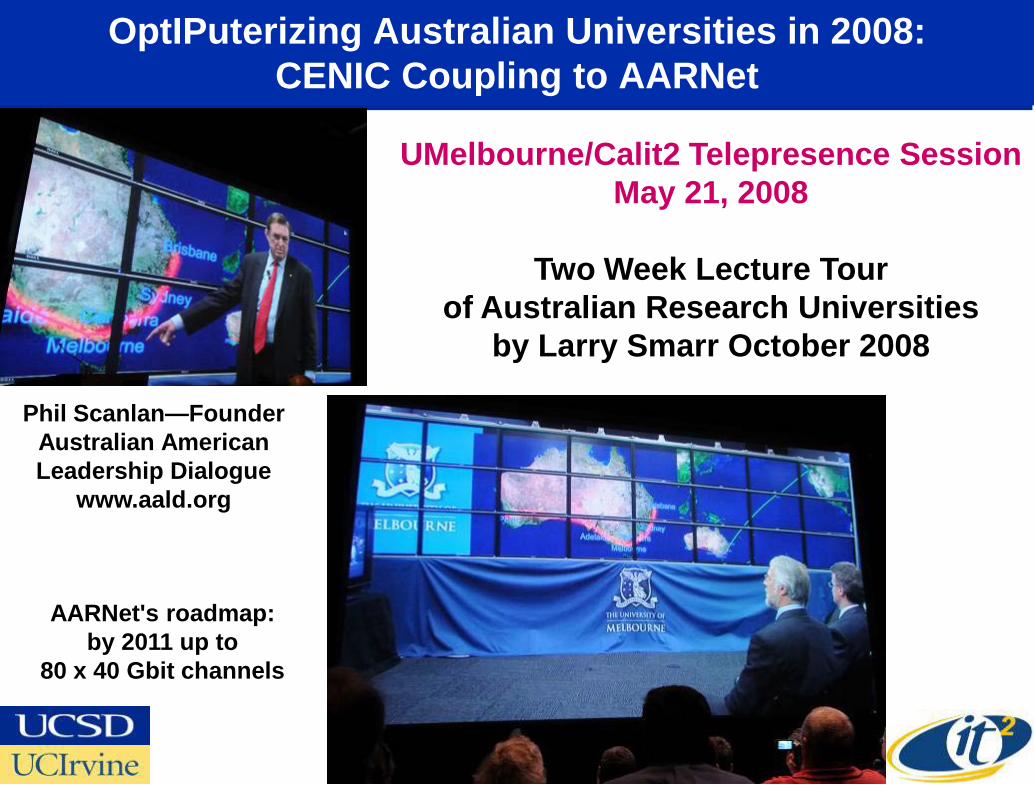
OptIPuterizing Australian Universities in 2008:CENIC Coupling to AARNet
UMelbourne/Calit2 Telepresence Session May 21, 2008
Two Week Lecture Tour of Australian Research Universities
by Larry Smarr October 2008
Phil Scanlan—Founder Australian American Leadership Dialogue
www.aald.org
AARNet's roadmap:by 2011 up to
80 x 40 Gbit channels
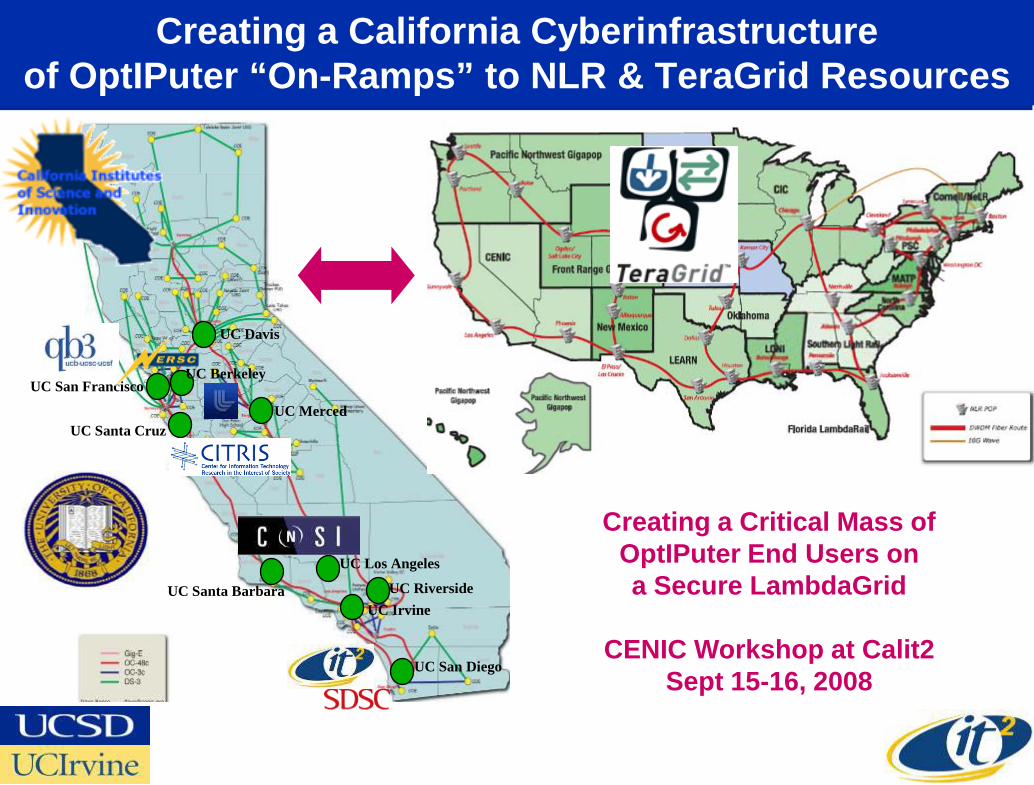
Creating a California Cyberinfrastructure of OptIPuter “On-Ramps” to NLR & TeraGrid Resources
UC San Francisco
UC San Diego
UC Riverside UC Irvine
UC Davis
UC Berkeley
UC Santa Cruz
UC Santa Barbara
UC Los Angeles
UC Merced
Creating a Critical Mass of OptIPuter End Users on a Secure LambdaGrid
CENIC Workshop at Calit2Sept 15-16, 2008
Source: Jim Dolgonas, CENIC
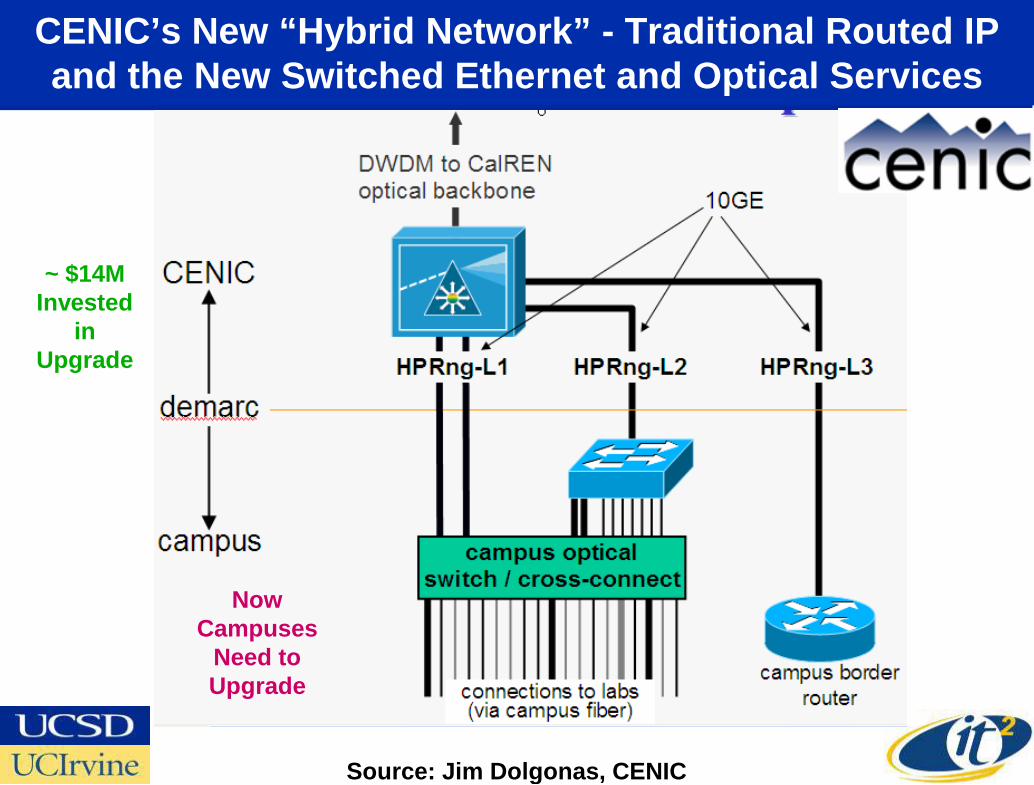
CENIC’s New “Hybrid Network” - Traditional Routed IP and the New Switched Ethernet and Optical Services
~ $14MInvested
in Upgrade
Now Campuses
Need to Upgrade
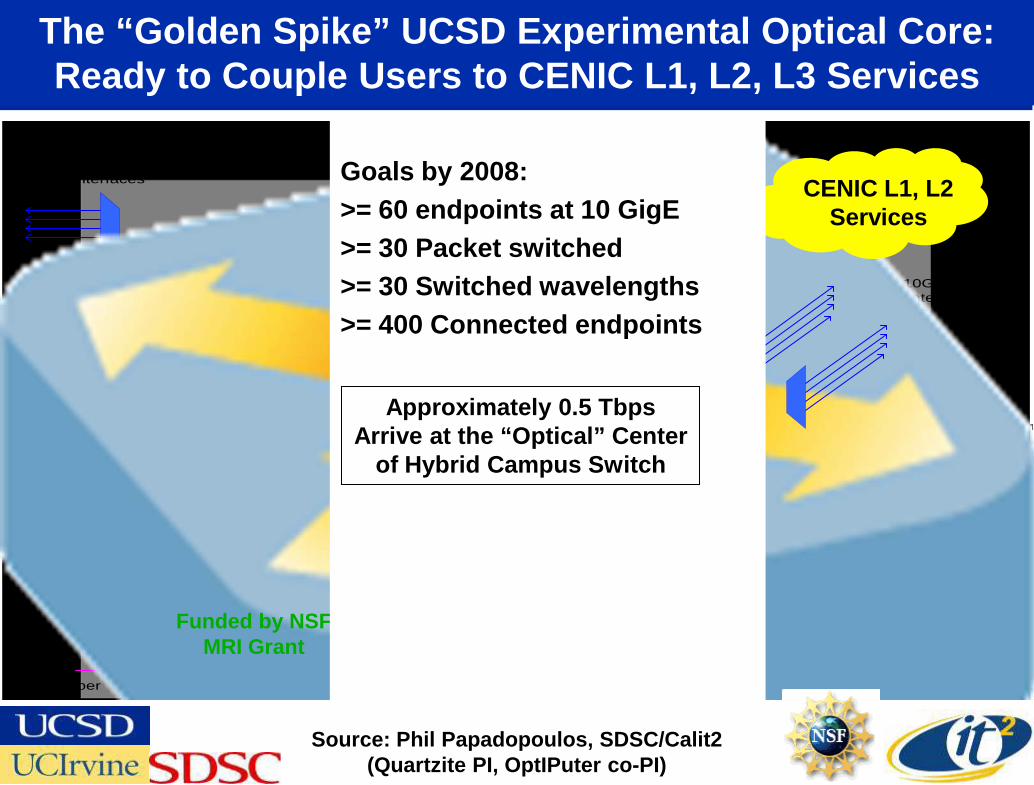
The “Golden Spike” UCSD Experimental Optical Core:Ready to Couple Users to CENIC L1, L2, L3 Services
QuartziteCore
CalREN-HPRResearch
Cloud
Campus ResearchCloud
GigE Switch withDual 10GigE Upliks
.....To cluster nodes
GigE Switch withDual 10GigE Upliks
.....To cluster nodes
GigE Switch withDual 10GigE Upliks
.....To cluster nodes
GigE
10GigE
...Toothernodes
Quartzite CommunicationsCore Year 3
ProductionOOO
Switch
Juniper T3204 GigE4 pair fiber
Wavelength Selective
Switch
To 10GigE clusternode interfaces
..... To 10GigE clusternode interfaces and
other switches
Packet Switch
32 10GigE
Source: Phil Papadopoulos, SDSC/Calit2 (Quartzite PI, OptIPuter co-PI)
Funded by NSF MRI Grant
Lucent
Glimmerglass
Force10
OptIPuter Border Router
CENIC L1, L2Services
Cisco 6509
Goals by 2008:>= 60 endpoints at 10 GigE>= 30 Packet switched>= 30 Switched wavelengths>= 400 Connected endpoints
Approximately 0.5 Tbps Arrive at the “Optical” Center
of Hybrid Campus Switch
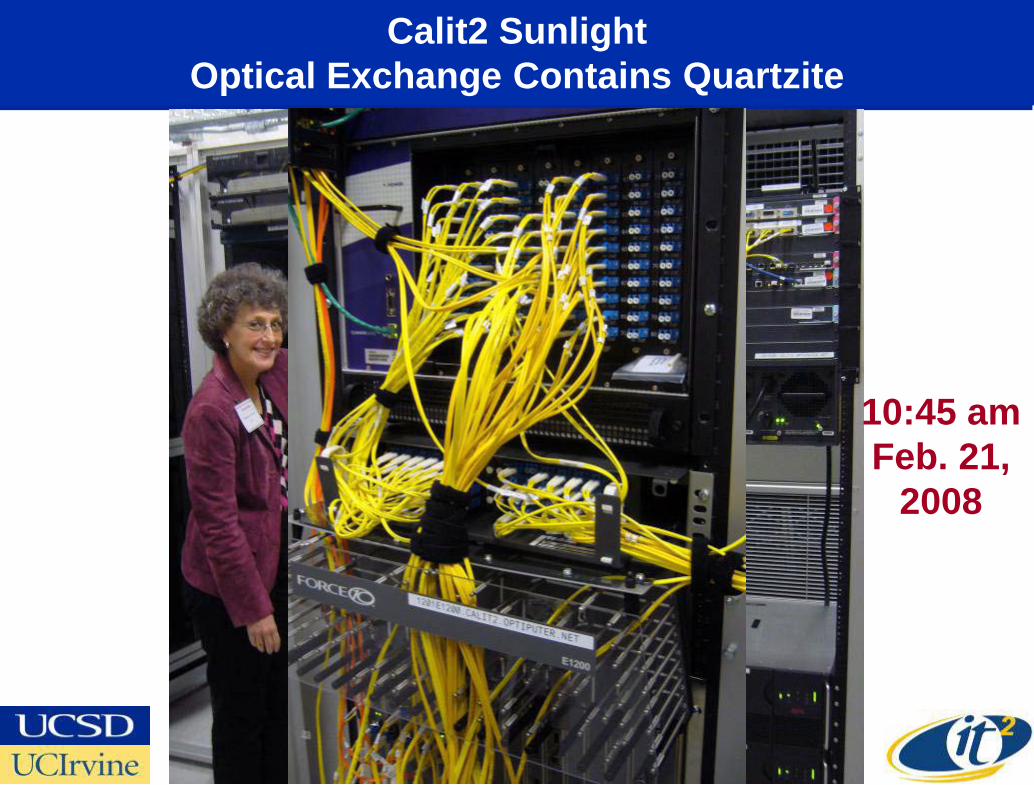
Calit2 SunlightOptical Exchange Contains Quartzite
10:45 am Feb. 21,
2008
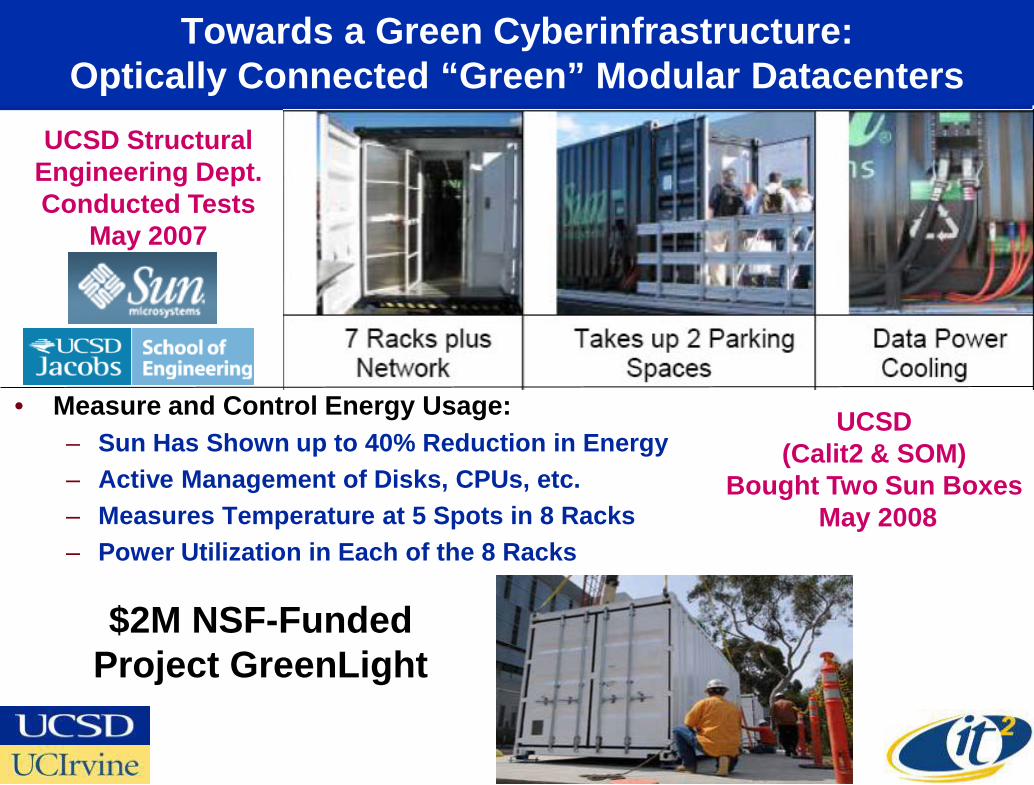
Towards a Green Cyberinfrastructure:Optically Connected “Green” Modular Datacenters
• Measure and Control Energy Usage:– Sun Has Shown up to 40% Reduction in Energy– Active Management of Disks, CPUs, etc.– Measures Temperature at 5 Spots in 8 Racks– Power Utilization in Each of the 8 Racks
UCSD Structural Engineering Dept. Conducted Tests
May 2007
UCSD (Calit2 & SOM)
Bought Two Sun BoxesMay 2008
$2M NSF-Funded Project GreenLight
Project GreenLight--Two Main Approaches to Improving Energy Efficiency by Exploiting Parallelism• Multiprocessing as in Multiple Cores that can be
Shutdown or Slowdown Based on Workloads• Co-Processing that uses Specialized Functional Units
for a Given Application• The Challenge in Co-Processing is the Hand-Crafting
that is Needed in Building such Machines– Application-Specific Co-Processor Constructed
from Work-Load Analysis– The Co-Processor is Able to Keep up with
the Host Processor in Exploiting Fine-Grain Parallel Execution Opportunities
Source: Rajesh Gupta, UCSD CSE; Calit2
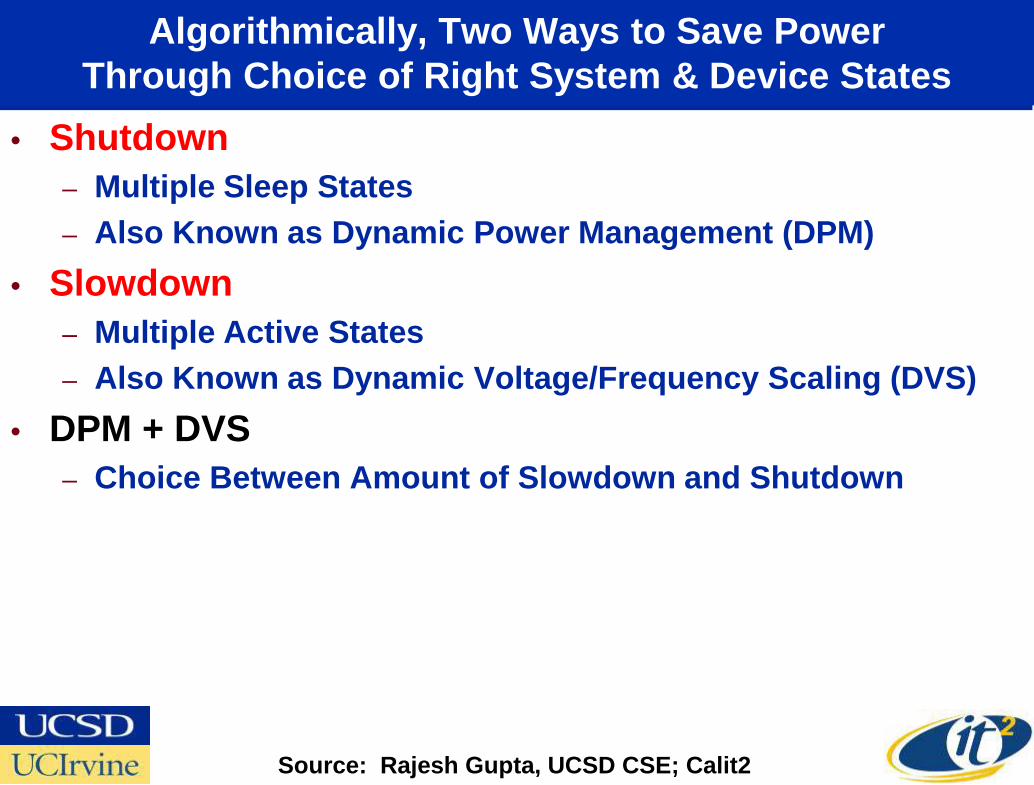
Algorithmically, Two Ways to Save Power Through Choice of Right System & Device States
• Shutdown– Multiple Sleep States – Also Known as Dynamic Power Management (DPM)
• Slowdown– Multiple Active States– Also Known as Dynamic Voltage/Frequency Scaling (DVS)
• DPM + DVS– Choice Between Amount of Slowdown and Shutdown
Source: Rajesh Gupta, UCSD CSE; Calit2
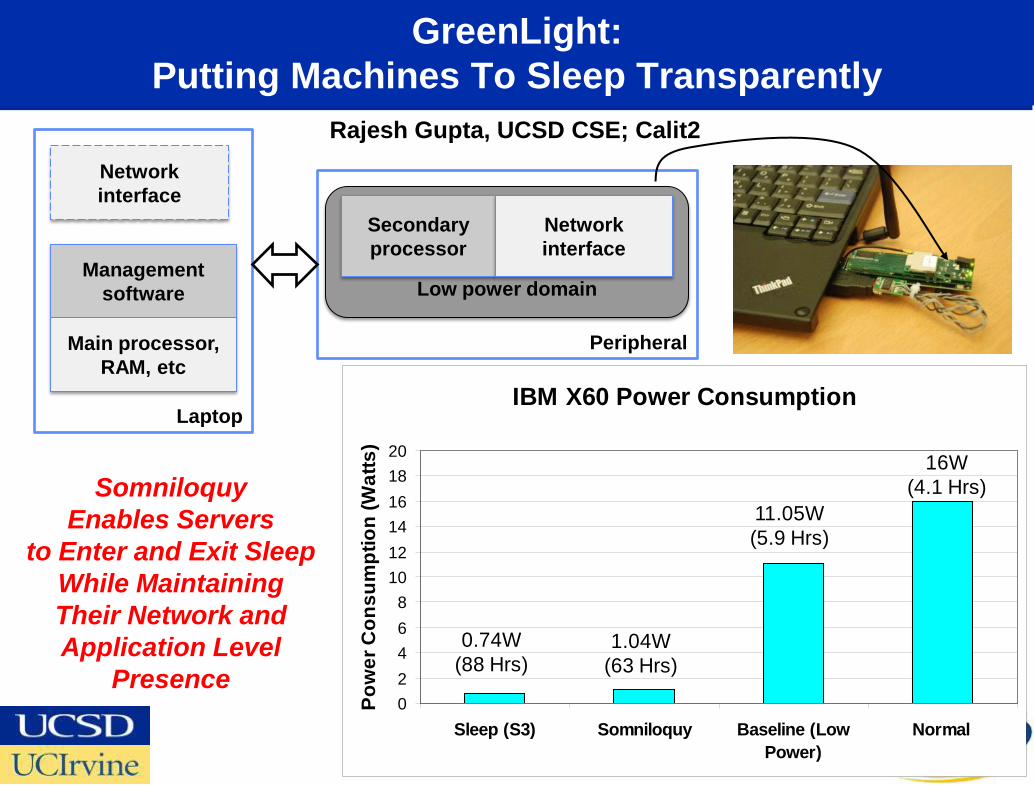
GreenLight: Putting Machines To Sleep Transparently
37
Peripheral
Laptop
Low power domain
Network interface
Secondary processor
Network interface
Managementsoftware
Main processor,RAM, etc
IBM X60 Power Consumption
02468
101214161820
Sleep (S3) Somniloquy Baseline (LowPower)
Normal
Pow
er C
onsu
mpt
ion
(Wat
ts)
0.74W(88 Hrs)
1.04W(63 Hrs)
16W(4.1 Hrs)
11.05W(5.9 Hrs)
Somniloquy Enables Servers
to Enter and Exit Sleep While Maintaining Their Network and Application Level
Presence
Rajesh Gupta, UCSD CSE; Calit2
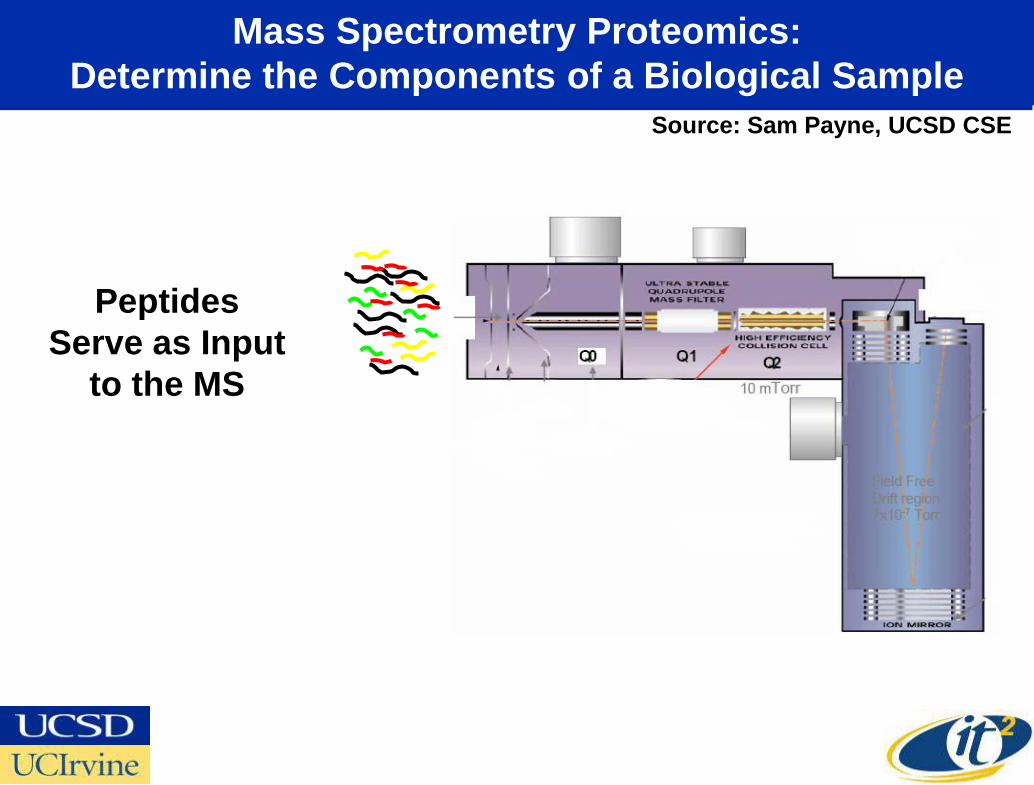
Mass Spectrometry Proteomics:Determine the Components of a Biological Sample
Peptides Serve as Input
to the MS
Source: Sam Payne, UCSD CSE
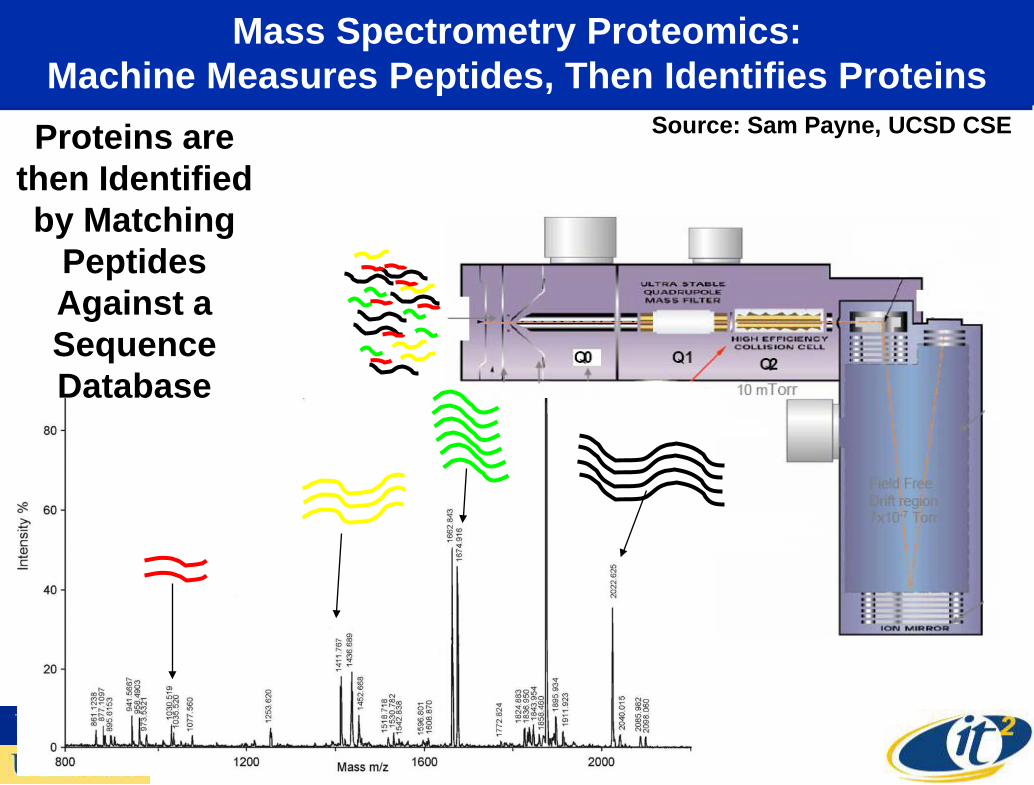
Mass Spectrometry Proteomics:Machine Measures Peptides, Then Identifies Proteins
Proteins are then Identified by Matching
Peptides Against a Sequence Database
Source: Sam Payne, UCSD CSE
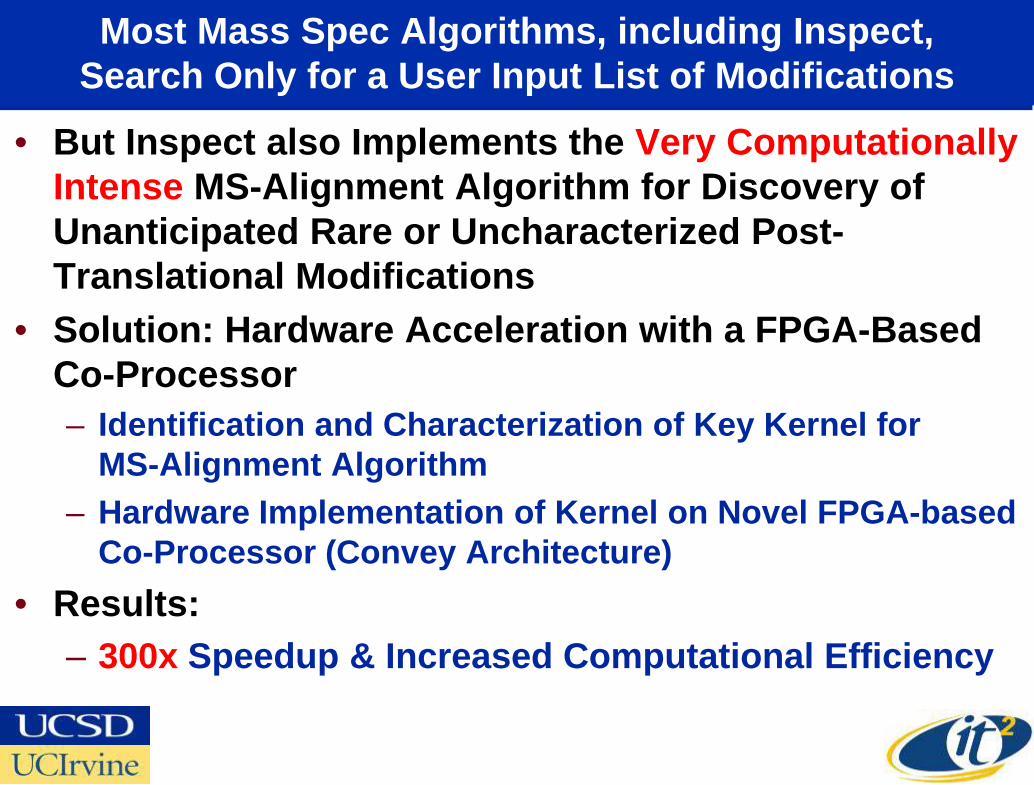
Most Mass Spec Algorithms, including Inspect, Search Only for a User Input List of Modifications
• But Inspect also Implements the Very Computationally Intense MS-Alignment Algorithm for Discovery of Unanticipated Rare or Uncharacterized Post-Translational Modifications
• Solution: Hardware Acceleration with a FPGA-Based Co-Processor– Identification and Characterization of Key Kernel for
MS-Alignment Algorithm– Hardware Implementation of Kernel on Novel FPGA-based
Co-Processor (Convey Architecture)• Results:
– 300x Speedup & Increased Computational Efficiency
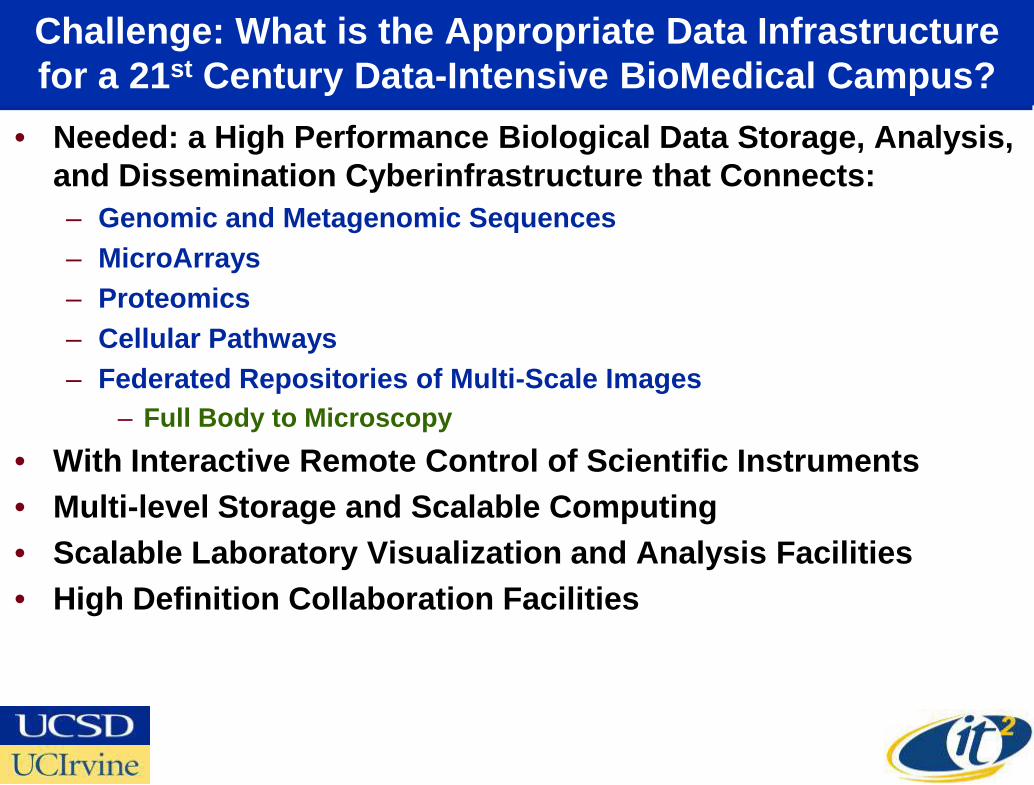
Challenge: What is the Appropriate Data Infrastructure for a 21st Century Data-Intensive BioMedical Campus?
• Needed: a High Performance Biological Data Storage, Analysis, and Dissemination Cyberinfrastructure that Connects: – Genomic and Metagenomic Sequences– MicroArrays– Proteomics– Cellular Pathways– Federated Repositories of Multi-Scale Images
– Full Body to Microscopy • With Interactive Remote Control of Scientific Instruments• Multi-level Storage and Scalable Computing• Scalable Laboratory Visualization and Analysis Facilities• High Definition Collaboration Facilities
10 Gigabit L2/L3 Switch
Eco-Friendly Storage and Compute
Microarray
Your Lab Here
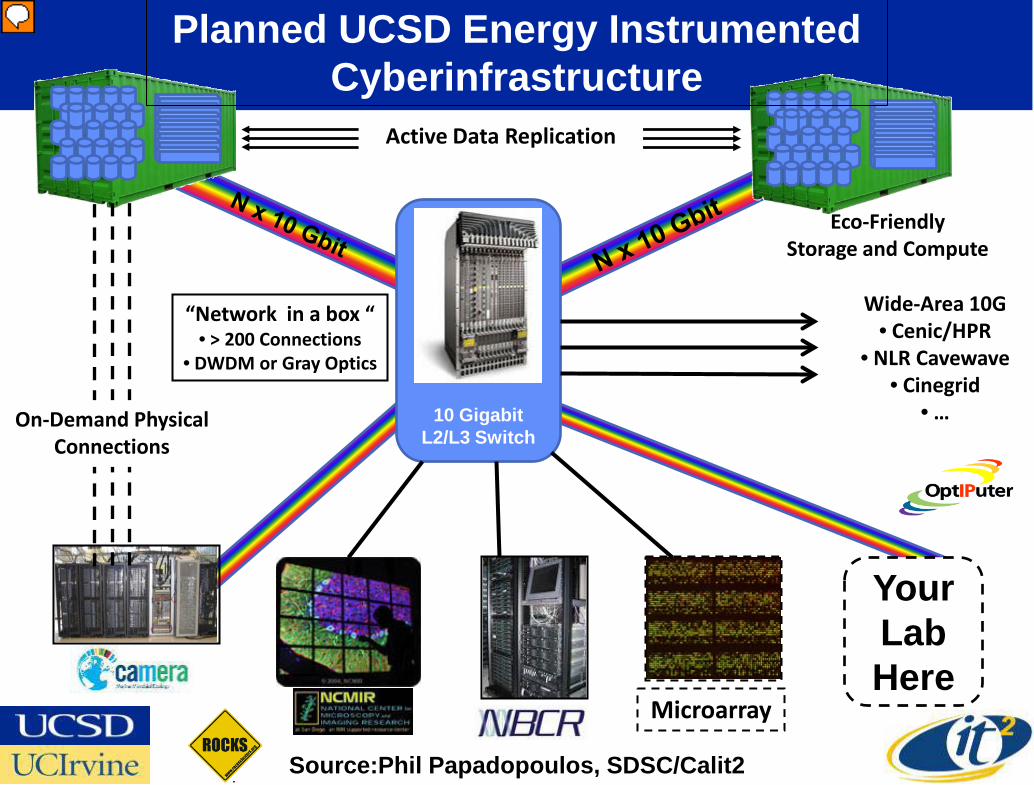
Planned UCSD Energy Instrumented Cyberinfrastructure
On-Demand Physical Connections
“Network in a box “• > 200 Connections
• DWDM or Gray Optics
Active Data Replication
Source:Phil Papadopoulos, SDSC/Calit2
Wide-Area 10G• Cenic/HPR
• NLR Cavewave• Cinegrid
• …
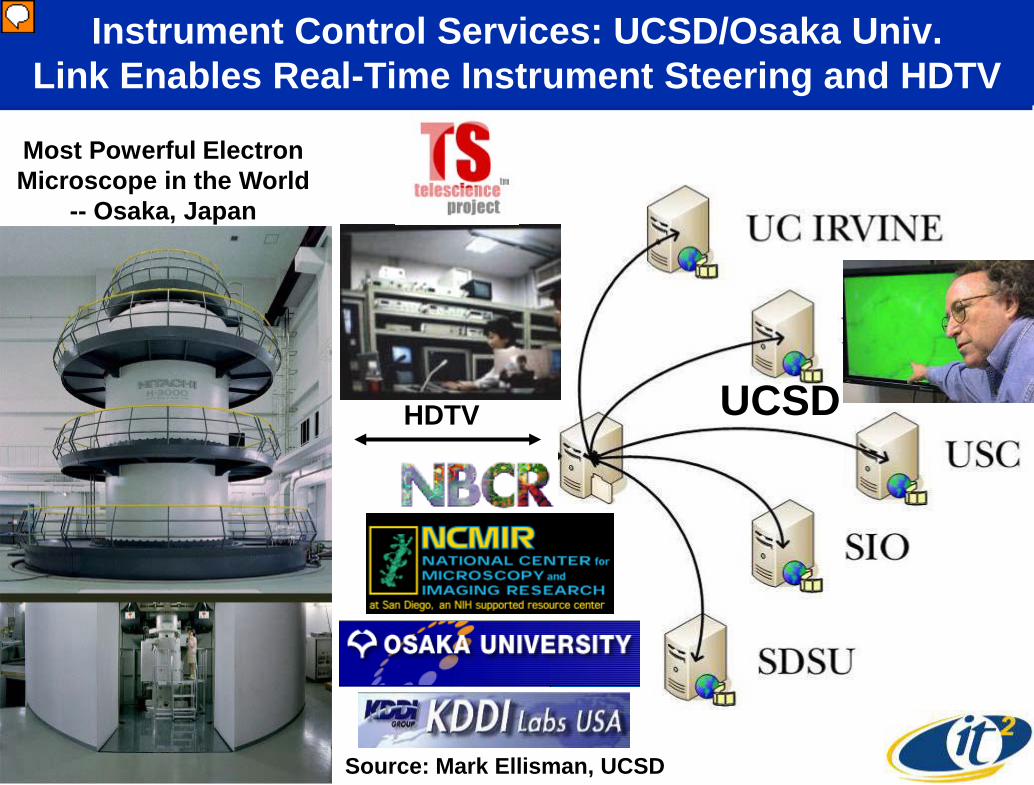
Instrument Control Services: UCSD/Osaka Univ. Link Enables Real-Time Instrument Steering and HDTV
Most Powerful Electron Microscope in the World
-- Osaka, Japan
Source: Mark Ellisman, UCSD
UCSDHDTV
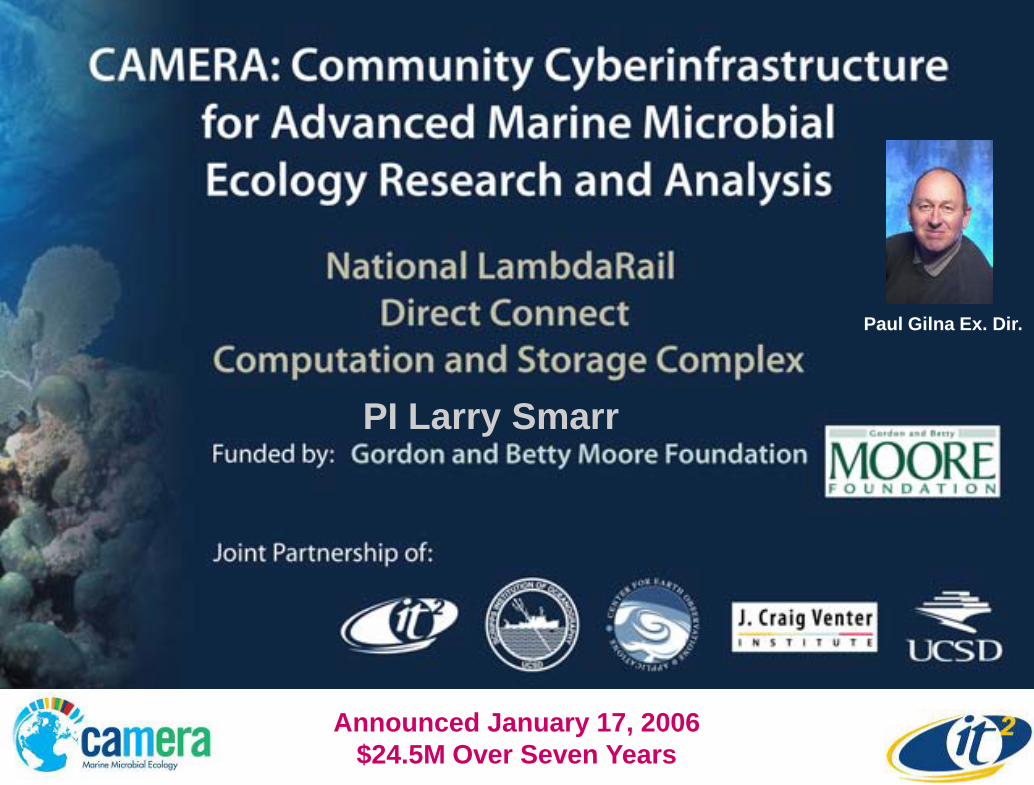
PI Larry Smarr
Paul Gilna Ex. Dir.
Announced January 17, 2006$24.5M Over Seven Years
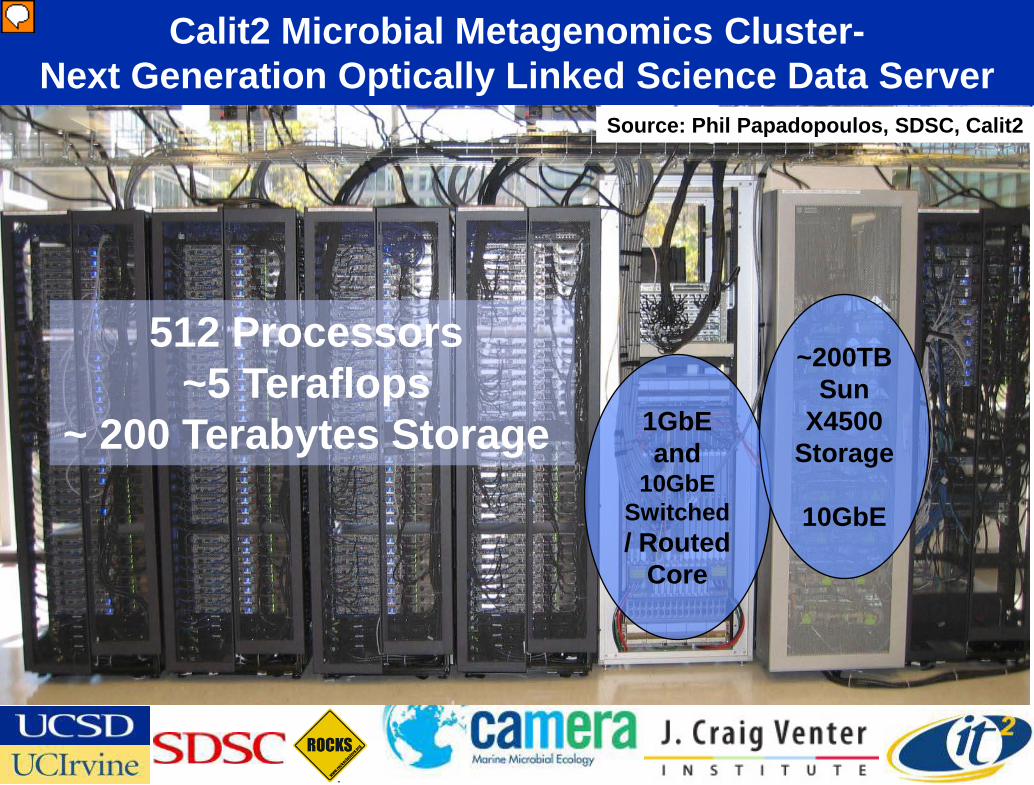
Calit2 Microbial Metagenomics Cluster-Next Generation Optically Linked Science Data Server
512 Processors ~5 Teraflops
~ 200 Terabytes Storage 1GbE and
10GbESwitched/ Routed
Core
~200TB Sun
X4500 Storage
10GbE
Source: Phil Papadopoulos, SDSC, Calit2
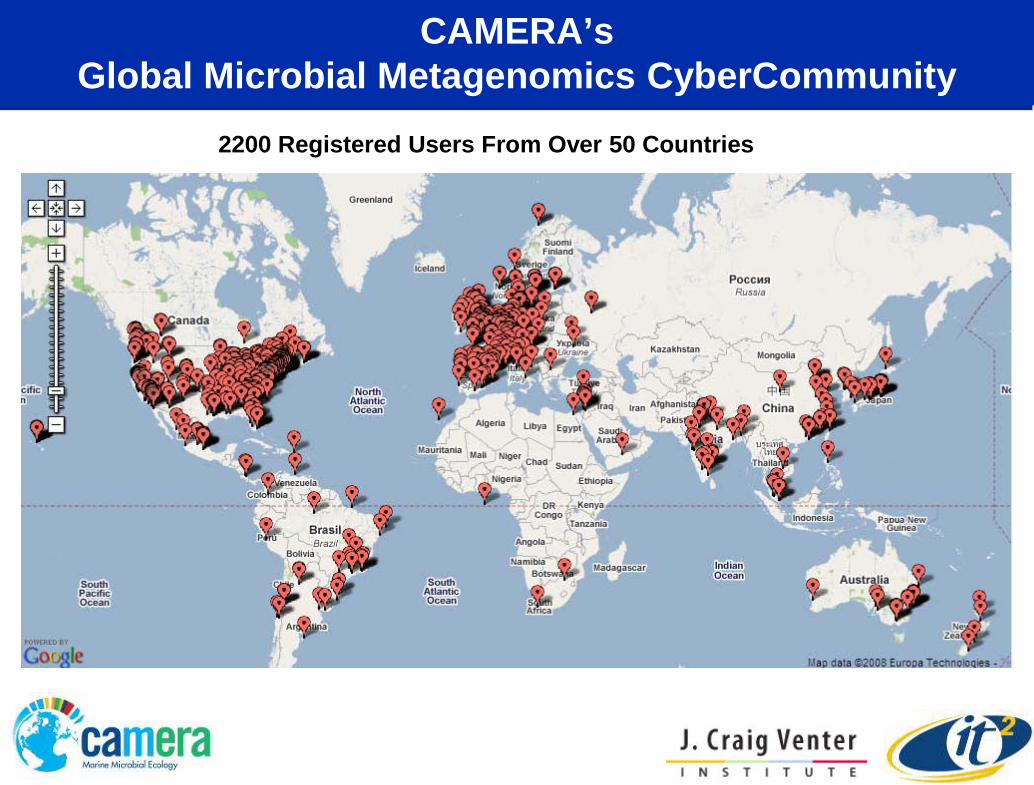
CAMERA’s Global Microbial Metagenomics CyberCommunity
2200 Registered Users From Over 50 Countries
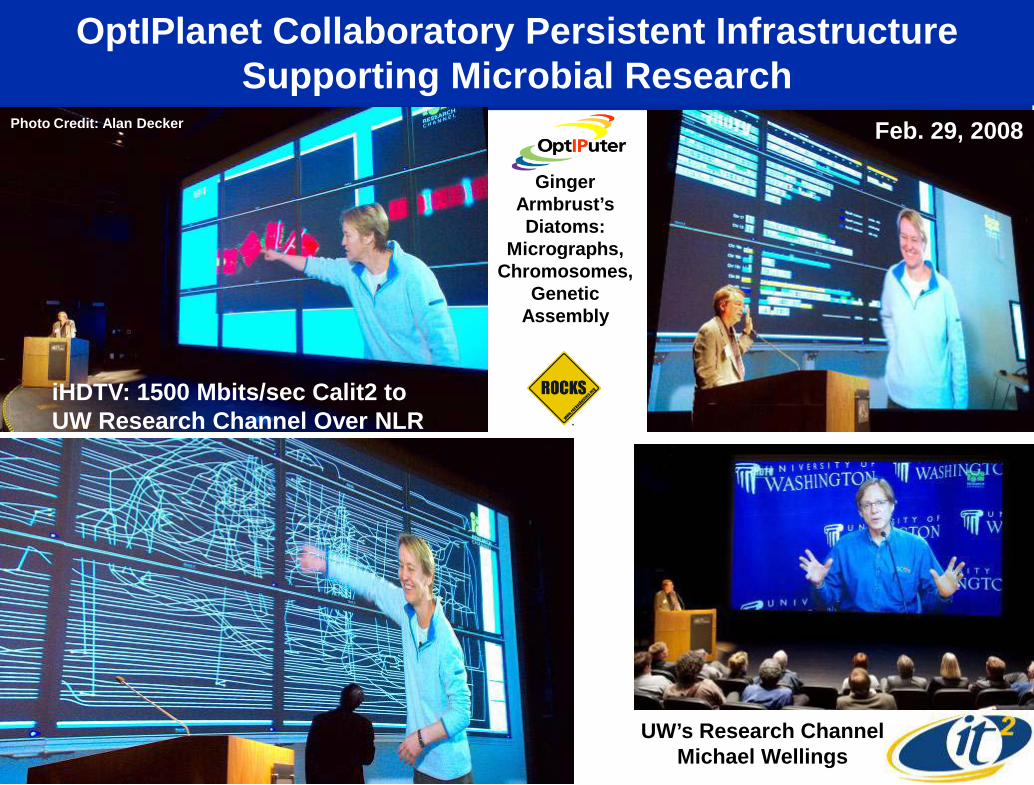
OptIPlanet Collaboratory Persistent Infrastructure Supporting Microbial Research
Ginger Armbrust’s Diatoms:
Micrographs, Chromosomes,
Genetic Assembly
Photo Credit: Alan Decker
UW’s Research Channel Michael Wellings
Feb. 29, 2008
iHDTV: 1500 Mbits/sec Calit2 to UW Research Channel Over NLR
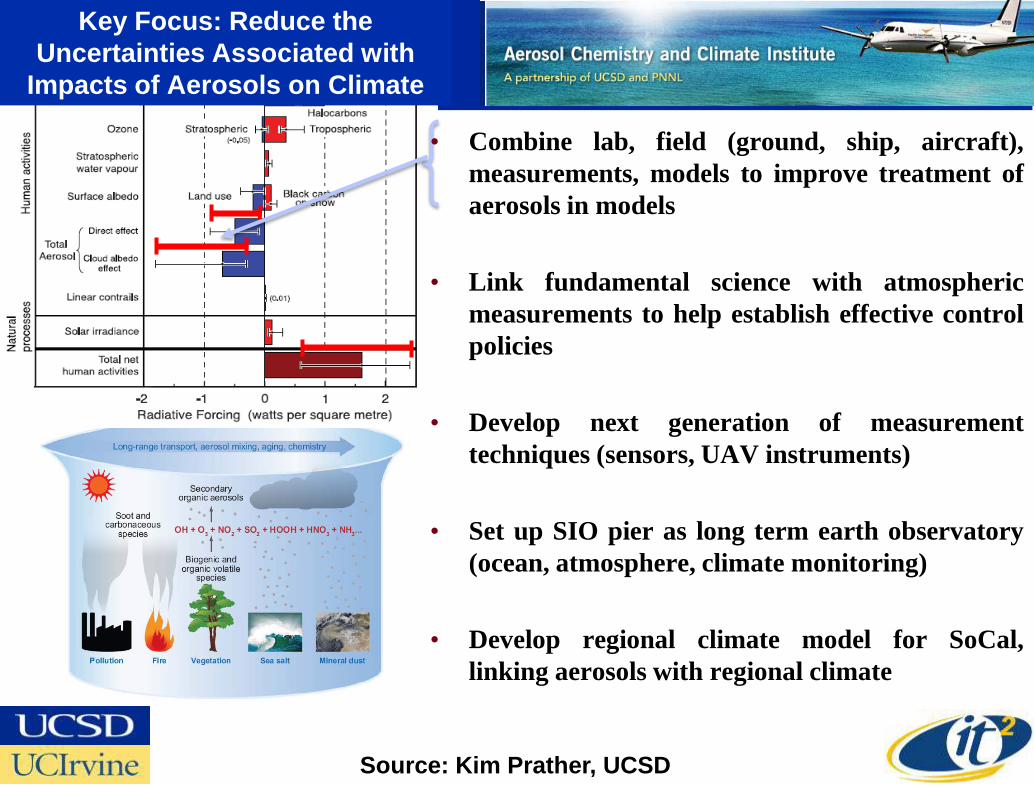
Source: Kim Prather, UCSD
Key Focus: Reduce the Uncertainties Associated with
Impacts of Aerosols on Climate
• Combine lab, field (ground, ship, aircraft),measurements, models to improve treatment ofaerosols in models
• Link fundamental science with atmosphericmeasurements to help establish effective controlpolicies
• Develop next generation of measurementtechniques (sensors, UAV instruments)
• Set up SIO pier as long term earth observatory(ocean, atmosphere, climate monitoring)
• Develop regional climate model for SoCal,linking aerosols with regional climate