Embed Size (px)
Citation preview
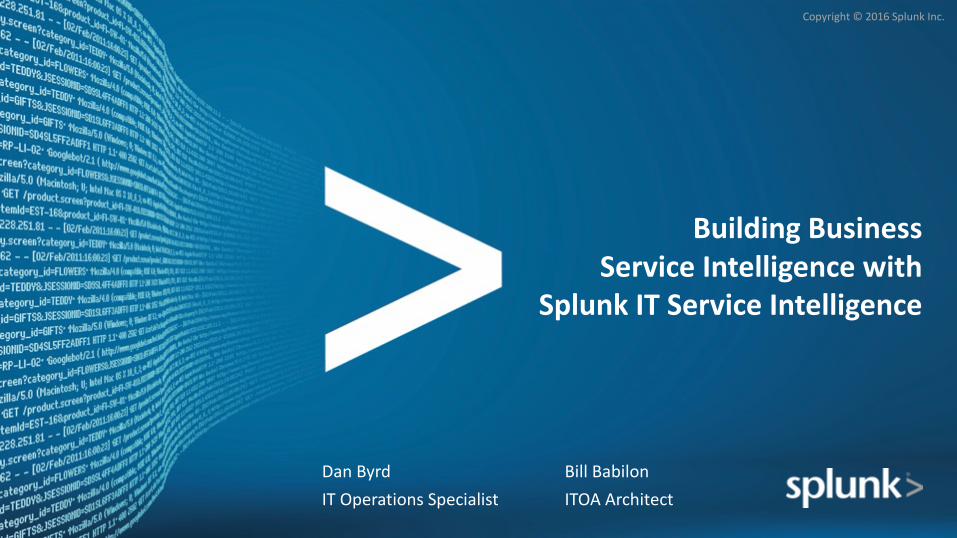
Copyright©2016SplunkInc.
BuildingBusinessServiceIntelligencewith
SplunkITServiceIntelligence
DanByrdITOperationsSpecialist
BillBabilonITOAArchitect
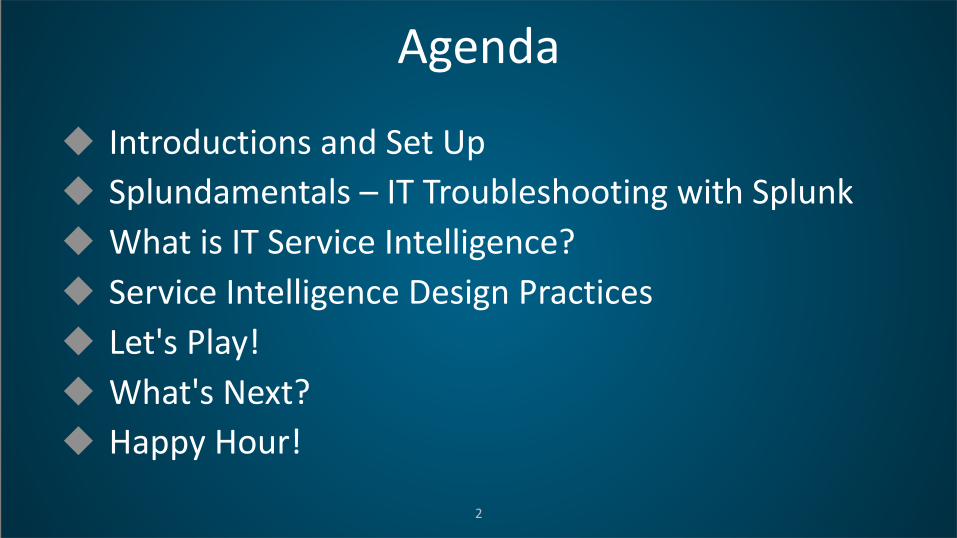
Agenda
2
u IntroductionsandSetUpu Splundamentals – ITTroubleshootingwithSplunku WhatisITServiceIntelligence?u ServiceIntelligenceDesignPracticesu Let'sPlay!u What'sNext?u HappyHour!
SafeHarborStatementDuring the course of this presentation, wemaymake forward looking statements regarding future eventsor the expected performance of the company. We caution you that such statements reflect our currentexpectations and estimates based on factors currently known to us and that actual events or results coulddiffermaterially. For important factors that may cause actual results to differ from those contained in ourforward-looking statements, please review our filings with the SEC. The forward-looking statementsmade in this presentation are being made as of the time and date of its live presentation. If reviewedafter its live presentation, this presentationmay not contain current or accurate information. We do notassume any obligation to update any forward looking statements we may make. In addition, anyinformation about our roadmap outlines our general product direction and is subject to change at anytime without notice. It is for informational purposes only and shall not be incorporated into any contractor other commitment. Splunk undertakes no obligation either to develop the features or functionalitydescribed or to include any such feature or functionality in a future release.
3
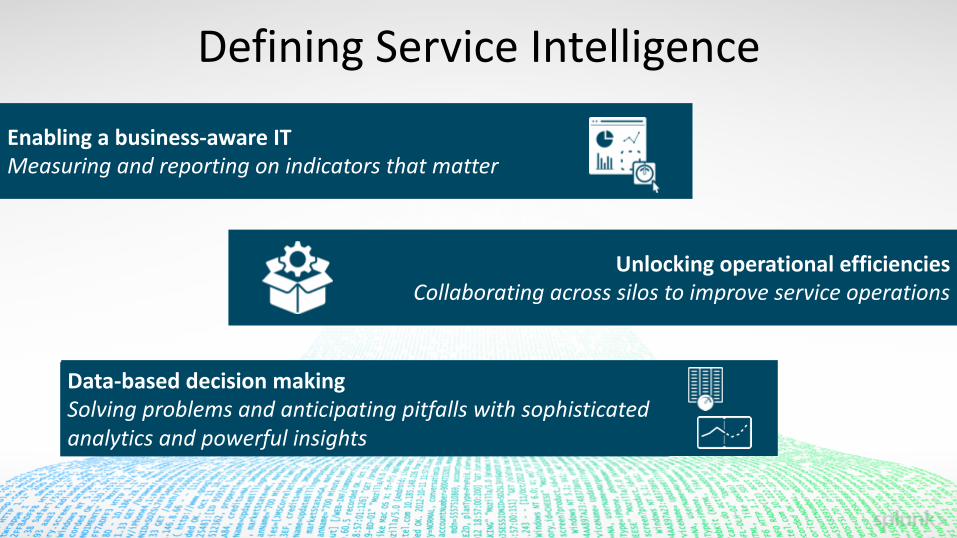
DefiningServiceIntelligence
Enablingabusiness-awareITMeasuringandreportingonindicatorsthatmatter
UnlockingoperationalefficienciesCollaboratingacrosssilostoimproveserviceoperations
Data-baseddecisionmakingSolvingproblemsandanticipatingpitfallswithsophisticatedanalyticsandpowerfulinsights
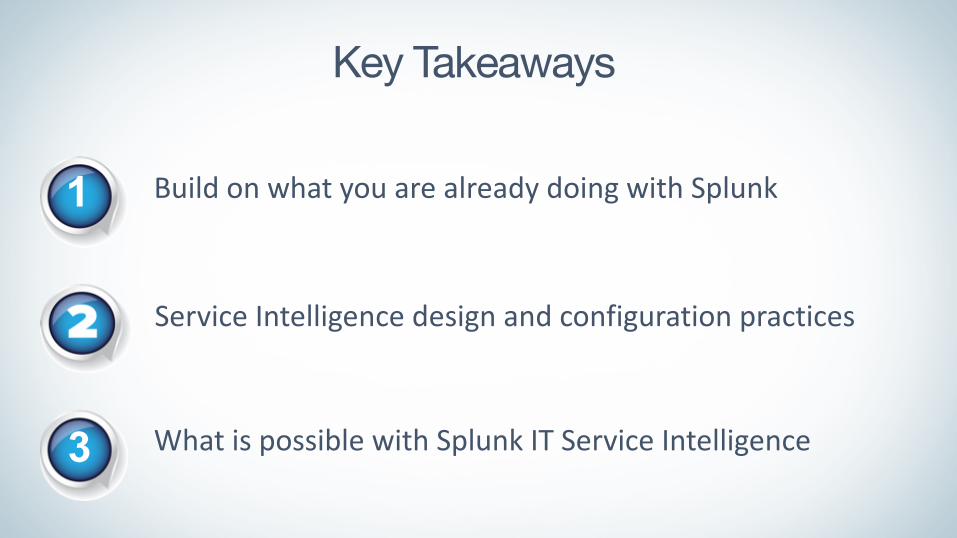
Key Takeaways
1 BuildonwhatyouarealreadydoingwithSplunk
ServiceIntelligencedesignandconfigurationpractices
3 WhatispossiblewithSplunk ITServiceIntelligence
Splundamentals – ITTroubleshootingwithSplunk
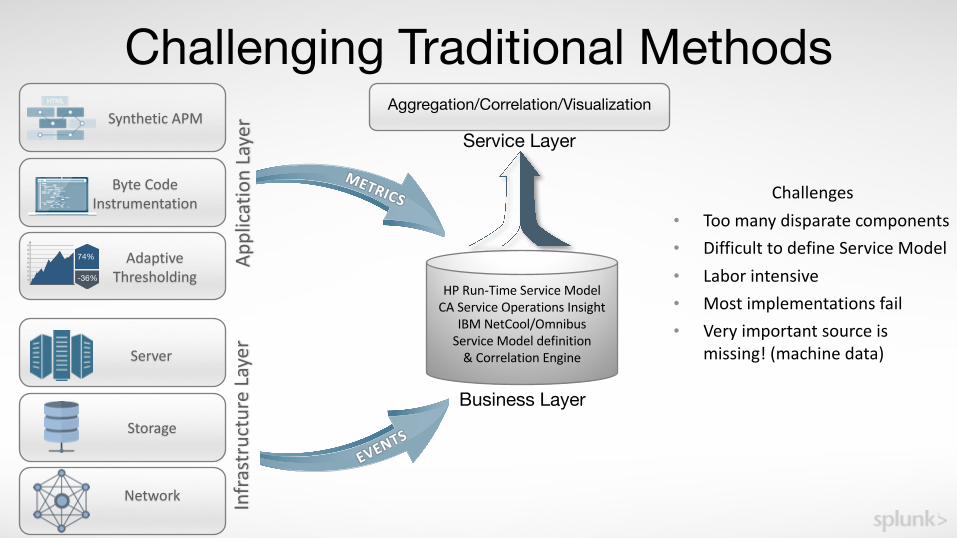
Challenging Traditional Methods
Network Infra
structureLayer
Storage
Server
74%
-36%
Applica
tionLayerSyntheticAPM
ByteCodeInstrumentation
AdaptiveThresholding
HPRun-TimeServiceModelCAServiceOperationsInsight
IBMNetCool/OmnibusServiceModeldefinition&CorrelationEngine
Business Layer
Aggregation/Correlation/Visualization
Service Layer
Challenges• Toomanydisparatecomponents• DifficulttodefineServiceModel• Laborintensive• Mostimplementationsfail• Veryimportantsourceis
missing!(machinedata)
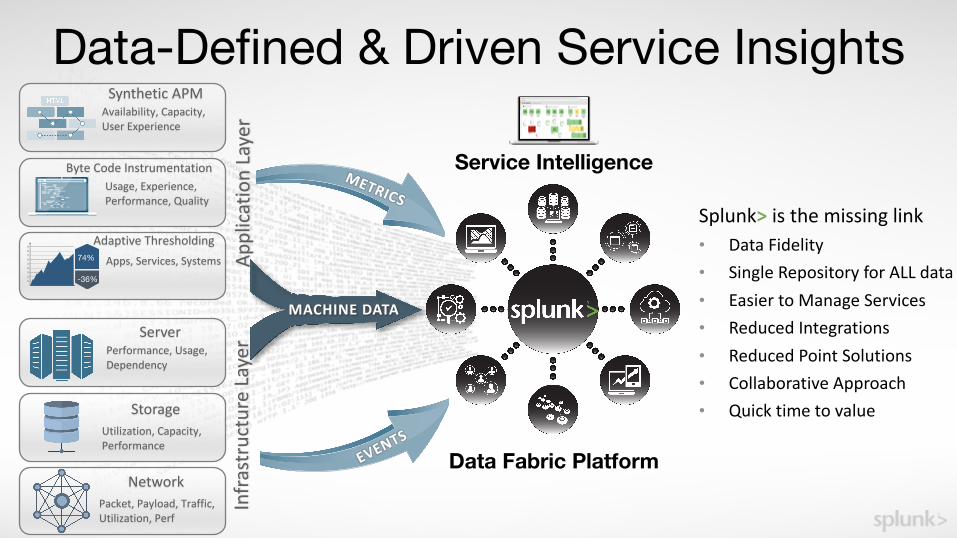
Data-Defined & Driven Service Insights
Infra
structureLayer
Applica
tionLayer
Splunk> isthemissinglink• DataFidelity• SingleRepositoryforALLdata• EasiertoManageServices• ReducedIntegrations• ReducedPointSolutions• CollaborativeApproach• Quicktimetovalue
Data Fabric Platform
Service Intelligence
NetworkPacket,Payload,Traffic,Utilization,Perf
SyntheticAPMAvailability,Capacity,UserExperience
ByteCodeInstrumentationUsage,Experience,Performance,Quality
AdaptiveThresholdingApps,Services,Systems74%
-36%
ServerPerformance,Usage,Dependency
StorageUtilization,Capacity,Performance
MACHINEDATA
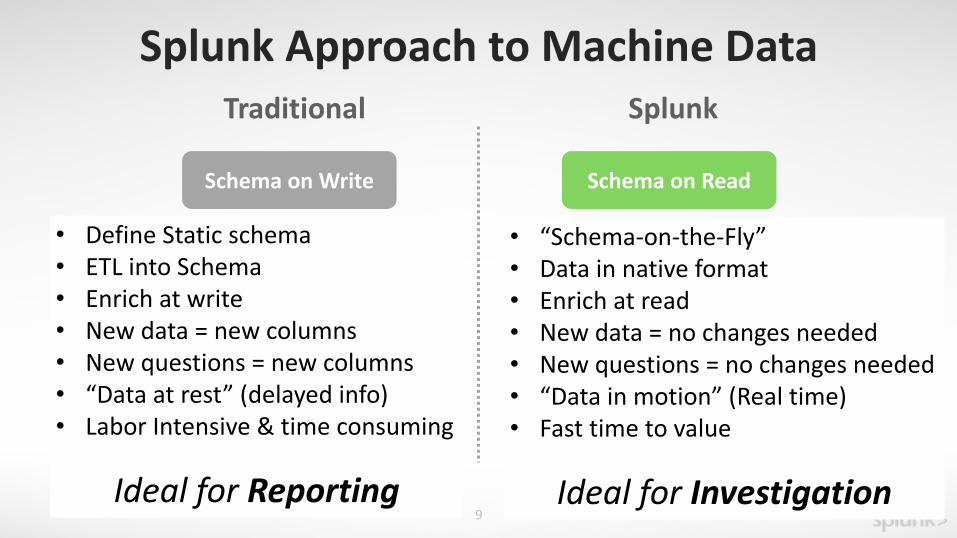
SplunkApproachtoMachineData
9
StructuredRDBMS
SQL
SchemaonWrite
Traditional
ETL
Search
SchemaonRead
Splunk
UniversalIndexing
Volume Velocity Variety
Unstructured
• DefineStaticschema• ETLintoSchema• Enrichatwrite• Newdata=newcolumns• Newquestions=newcolumns• “Dataatrest”(delayedinfo)• LaborIntensive&timeconsuming
IdealforReporting
• “Schema-on-the-Fly”• Datainnativeformat• Enrichatread• Newdata=nochangesneeded• Newquestions=nochangesneeded• “Datainmotion”(Realtime)• Fasttimetovalue
IdealforInvestigation
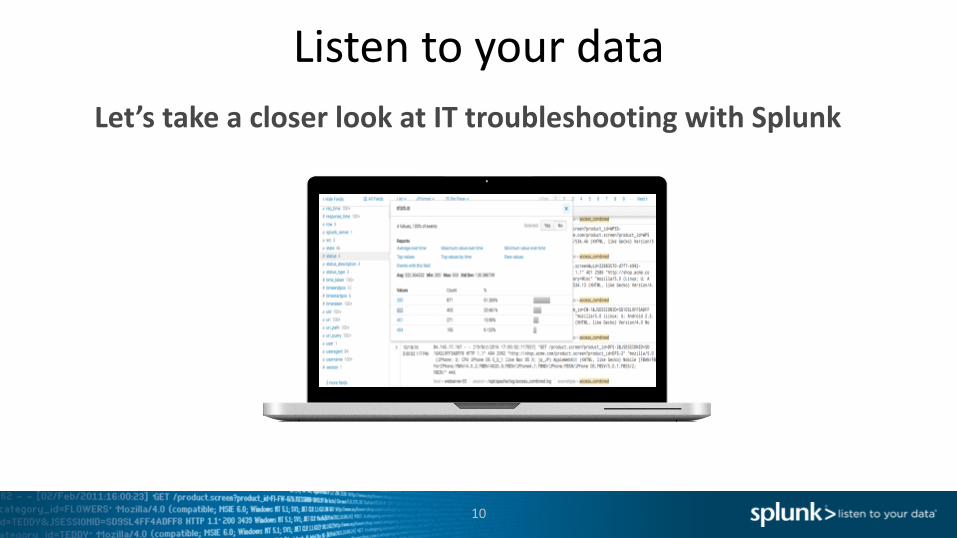
ListentoyourdataLet’stakeacloserlookatITtroubleshootingwithSplunk
10
Machinelearning-poweredanalyticsforreal-timeserviceinsights,simplifiedoperationsandroot-causeisolation
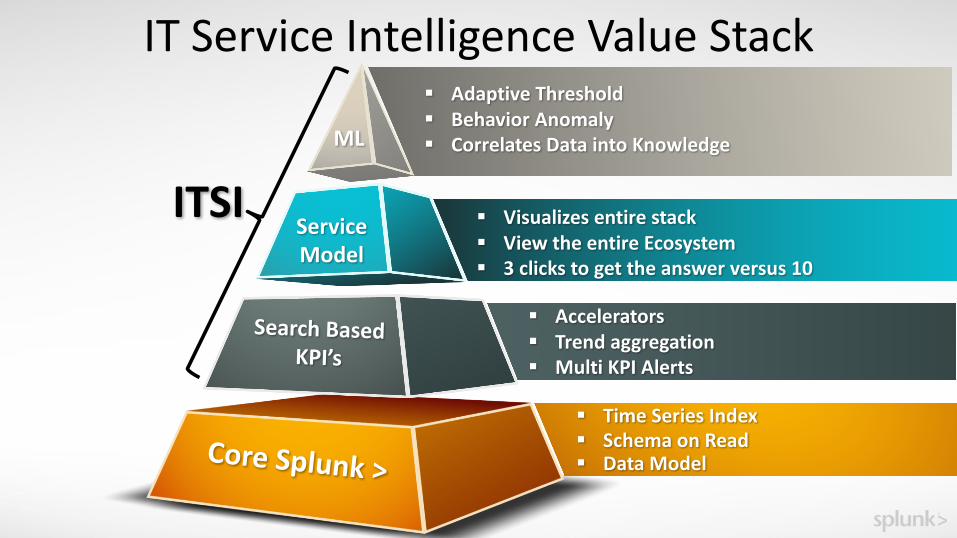
ITServiceIntelligenceValueStack§ AdaptiveThreshold§ BehaviorAnomaly§ CorrelatesDataintoKnowledge
§ Visualizesentirestack§ ViewtheentireEcosystem§ 3clickstogettheanswerversus10
§ TimeSeriesIndex§ SchemaonRead§ DataModel
ServiceModel
ML
§ Accelerators§ Trendaggregation§ MultiKPIAlerts
ITSI
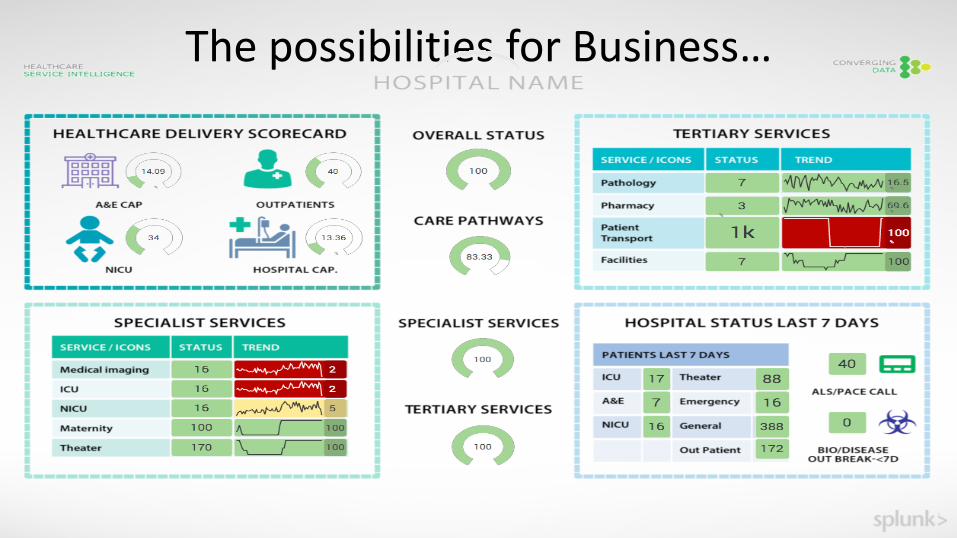
ThepossibilitiesforBusiness…
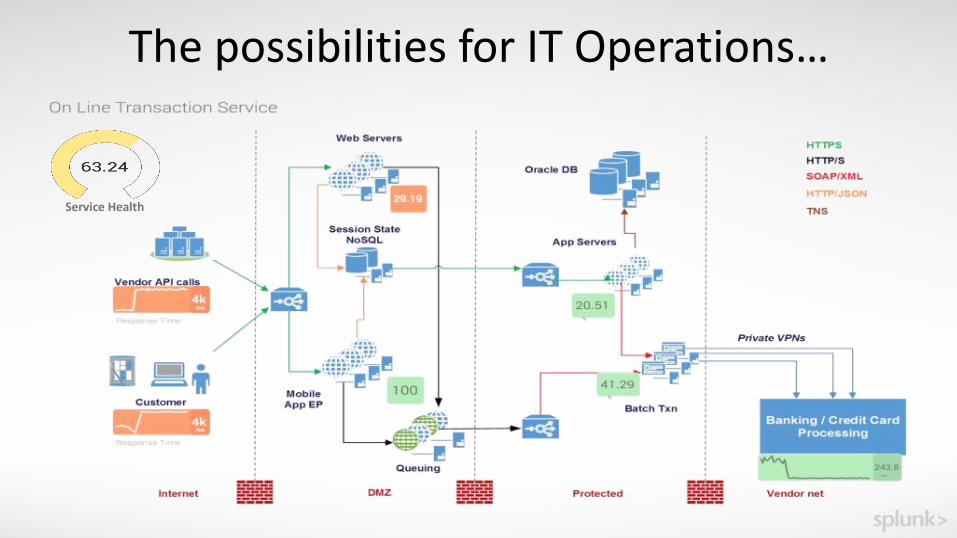
ThepossibilitiesforITOperations…
ServiceHealth
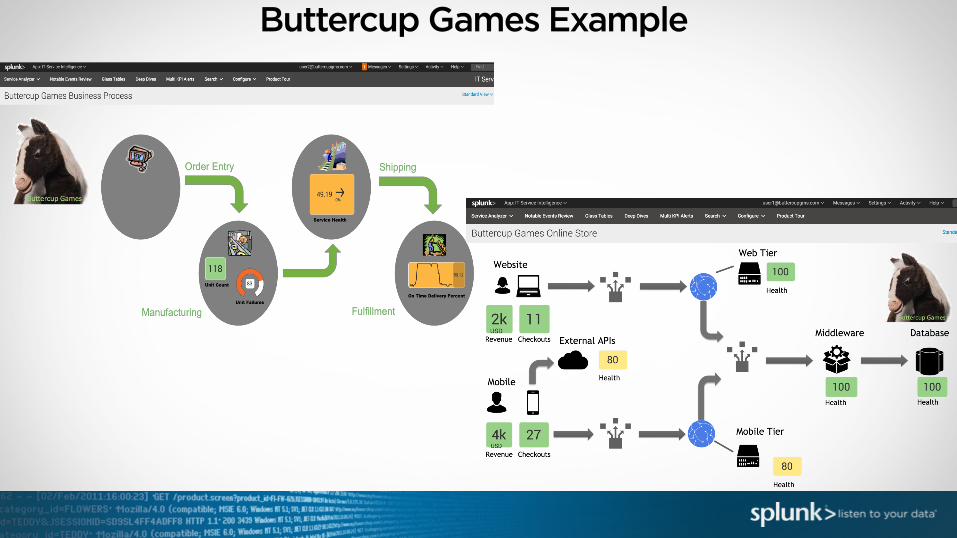
Buttercup Games Example
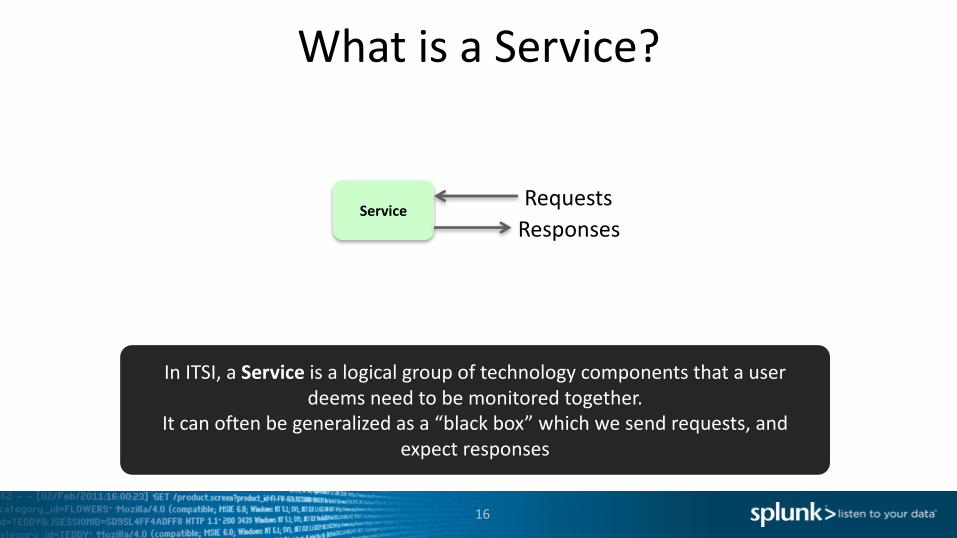
WhatisaService?
ServiceRequestsResponses
InITSI,aService isalogicalgroupoftechnologycomponentsthatauserdeemsneedtobemonitoredtogether.
Itcanoftenbegeneralizedasa“blackbox”whichwesendrequests,andexpectresponses
16
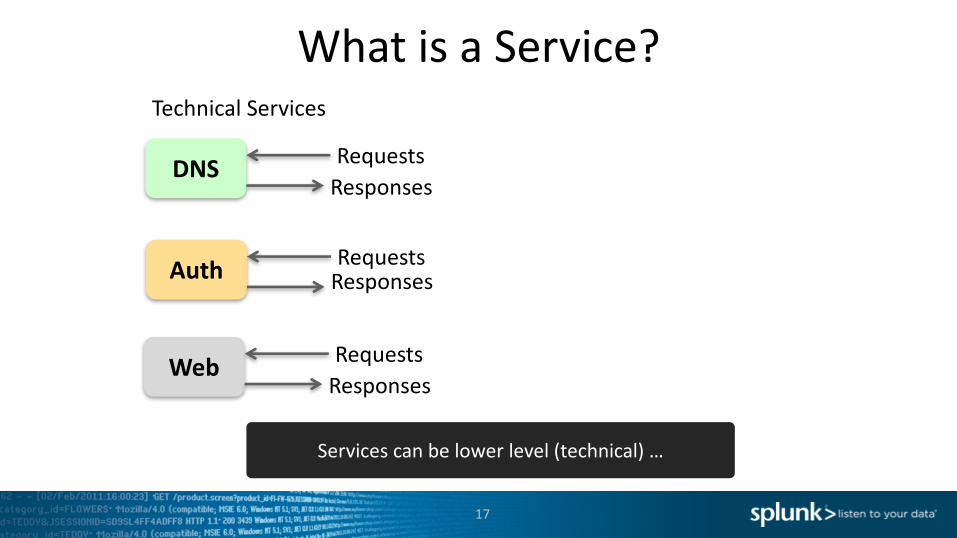
WhatisaService?
DNS RequestsResponses
TechnicalServices
Auth RequestsResponses
Web RequestsResponses
Servicescanbelowerlevel(technical)…
17
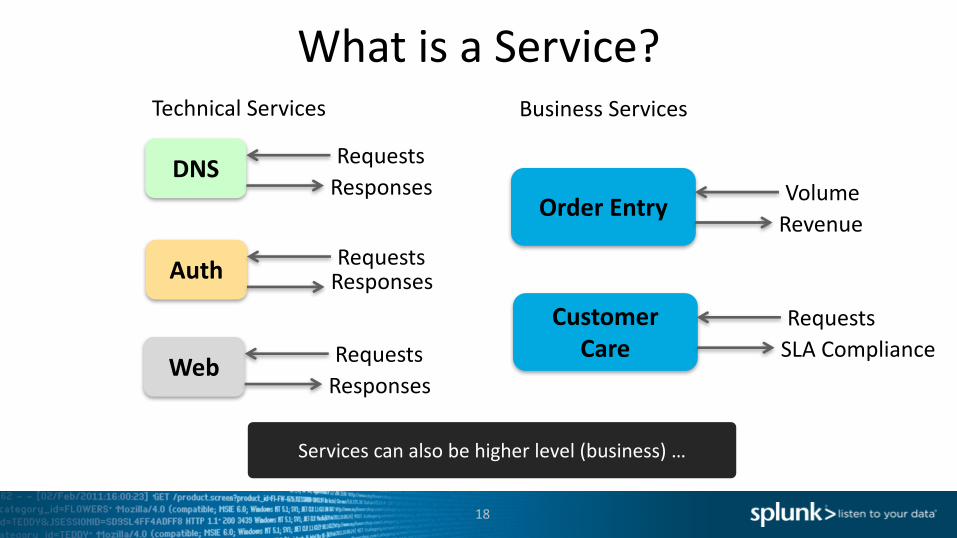
WhatisaService?
DNS RequestsResponses
TechnicalServices
OrderEntry VolumeRevenue
BusinessServices
Auth RequestsResponses
Web RequestsResponses
CustomerCare
RequestsSLACompliance
Servicescanalsobehigherlevel(business)…
18
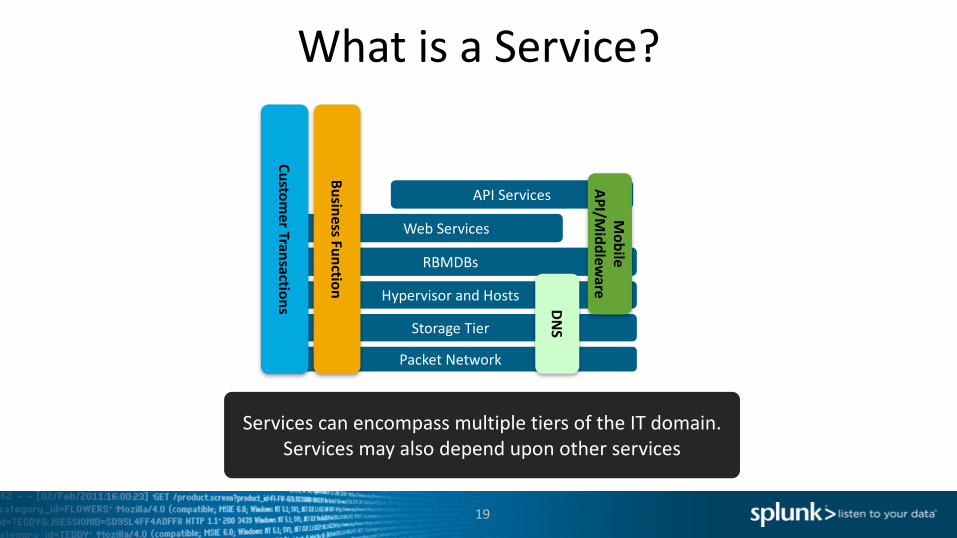
WhatisaService?
PacketNetwork
HypervisorandHosts
RBMDBs
StorageTier
APIServices
WebServices
CustomerTransactions
Mobile
API/Middlew
are
BusinessFunction
DNS
ServicescanencompassmultipletiersoftheITdomain.Servicesmayalsodependuponotherservices
19
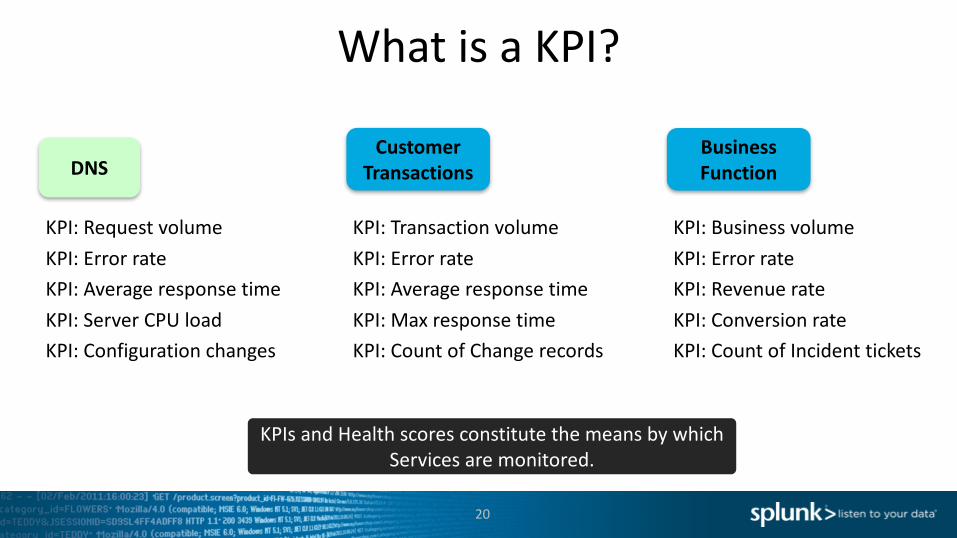
WhatisaKPI?
DNS
KPI:RequestvolumeKPI:ErrorrateKPI:AverageresponsetimeKPI:ServerCPUloadKPI:Configurationchanges
CustomerTransactions
KPI:TransactionvolumeKPI:ErrorrateKPI:AverageresponsetimeKPI:MaxresponsetimeKPI:CountofChangerecords
KPIsandHealthscoresconstitutethemeansbywhichServicesaremonitored.
20
BusinessFunction
KPI:BusinessvolumeKPI:ErrorrateKPI:RevenuerateKPI:ConversionrateKPI:CountofIncidenttickets
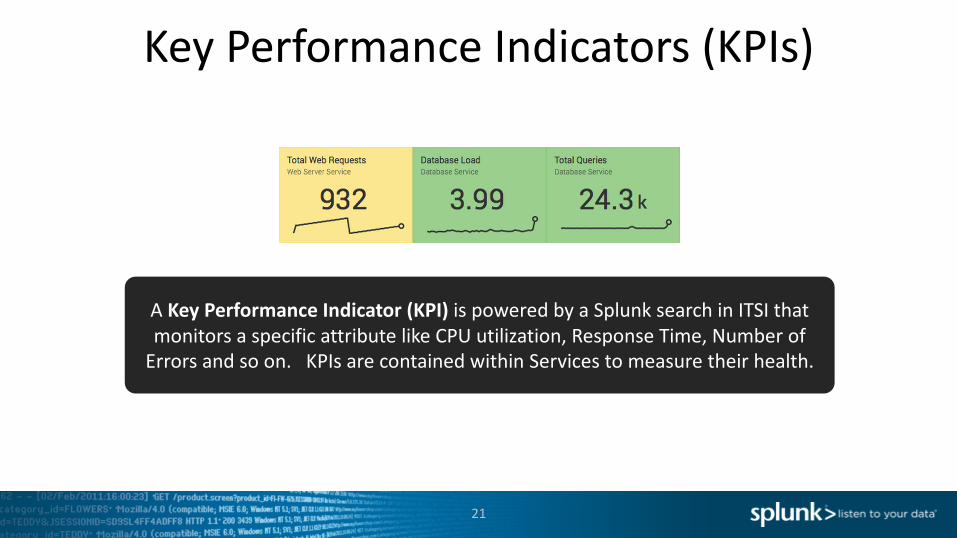
KeyPerformanceIndicators(KPIs)
21
AKeyPerformanceIndicator(KPI)ispoweredbyaSplunk searchinITSIthatmonitorsaspecificattributelikeCPUutilization,ResponseTime,NumberofErrorsandsoon.KPIsarecontainedwithinServicestomeasuretheirhealth.
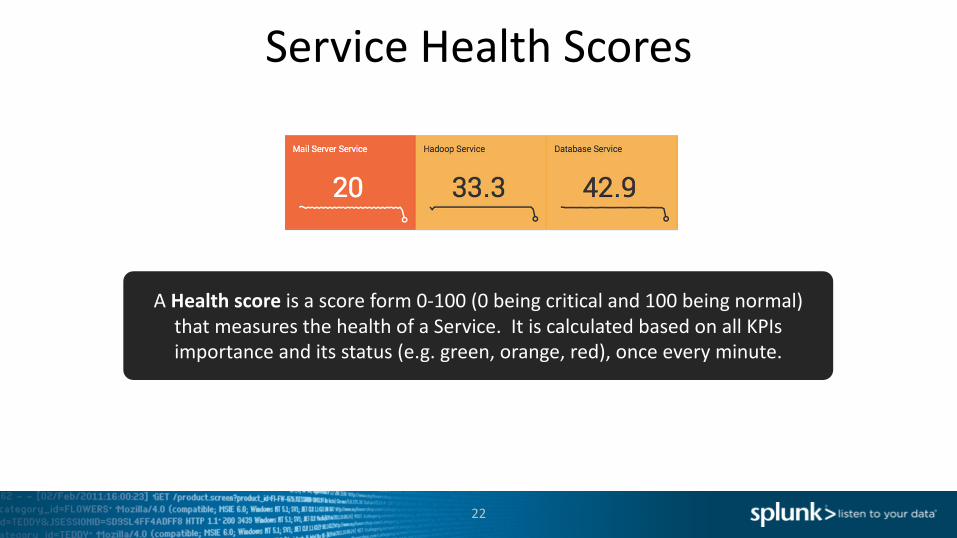
ServiceHealthScores
22
AHealthscoreisascoreform0-100(0beingcriticaland100beingnormal)thatmeasuresthehealthofaService.ItiscalculatedbasedonallKPIsimportanceanditsstatus(e.g.green,orange,red),onceeveryminute.
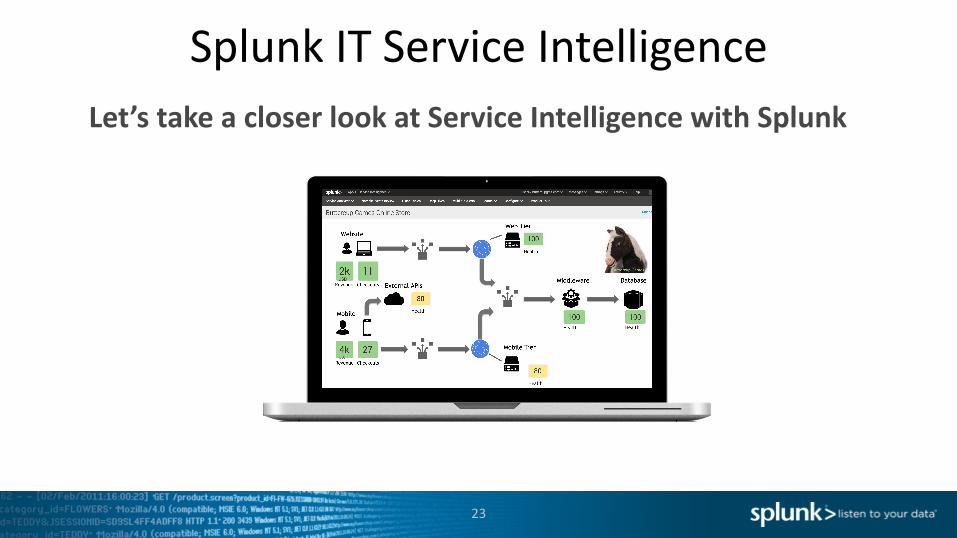
Splunk ITServiceIntelligenceLet’stakeacloserlookatServiceIntelligencewithSplunk
23
ServiceIntelligenceDesignPractices
24
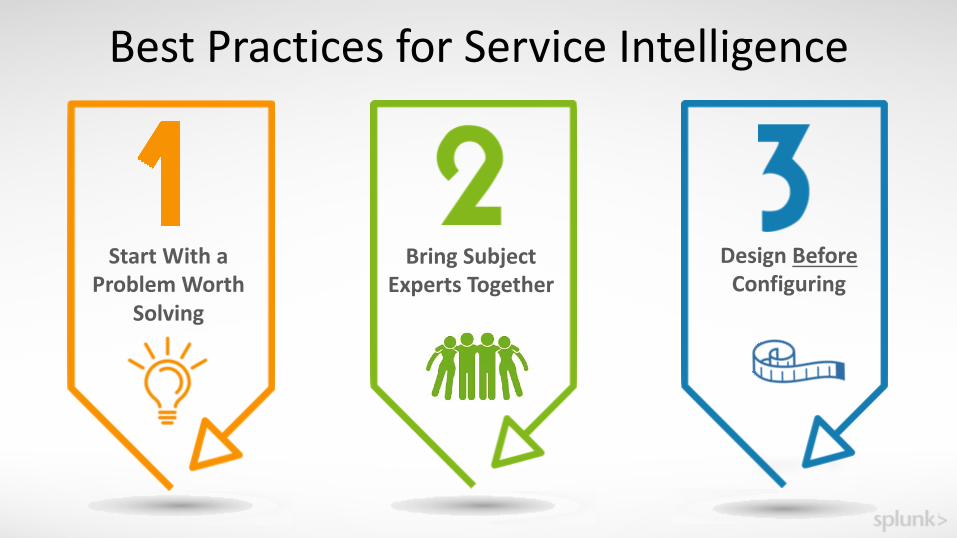
BringSubjectExpertsTogether
DesignBeforeConfiguring
BestPracticesforServiceIntelligence
StartWithaProblemWorth
Solving
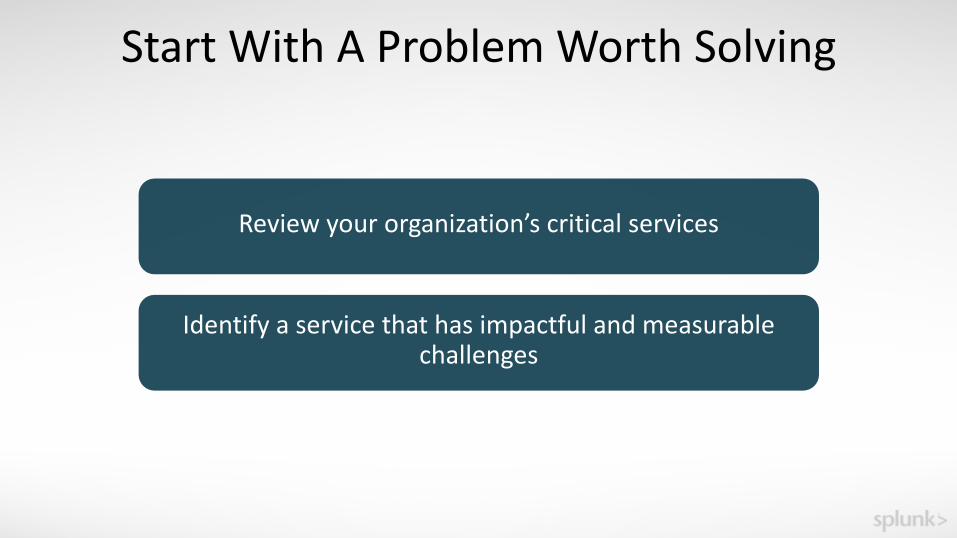
StartWithAProblemWorthSolving
Reviewyourorganization’scriticalservices
Identifyaservicethathasimpactfulandmeasurablechallenges
ButtercupGames– HowCanWeHelp?
Manufactureroftoysandgames
Desiretoimprovesupplychainefficiencyandcustomersatisfaction
Newonlinestorehasissuesthatimpactcustomerexperienceandrevenue
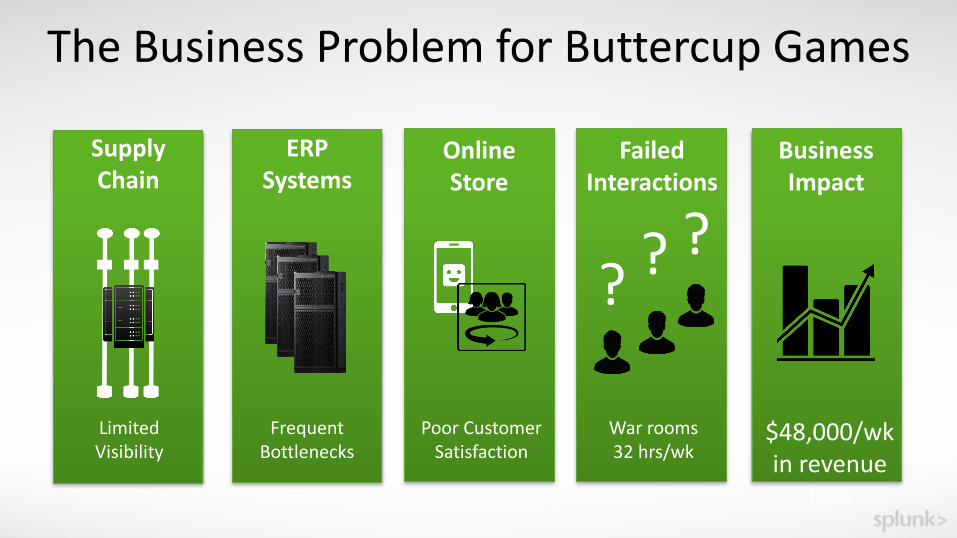
TheBusinessProblemforButtercupGames
SupplyChain
LimitedVisibility
FrequentBottlenecks
ERPSystems
BusinessImpact
$48,000/wkinrevenue
loss
Warrooms32hrs/wk
???
FailedInteractions
OnlineStore
PoorCustomerSatisfaction
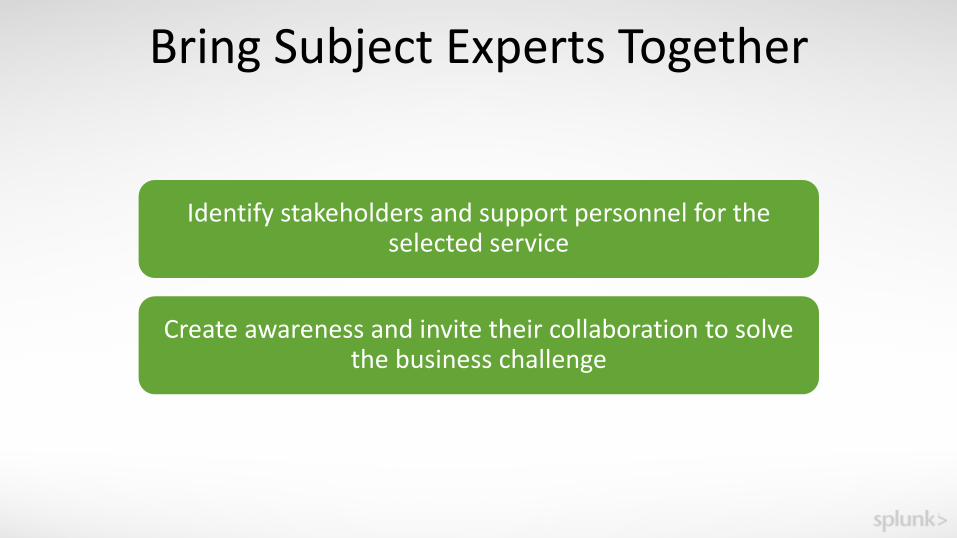
BringSubjectExpertsTogether
Identifystakeholdersandsupportpersonnelfortheselectedservice
Createawarenessandinvitetheircollaborationtosolvethebusinesschallenge
30
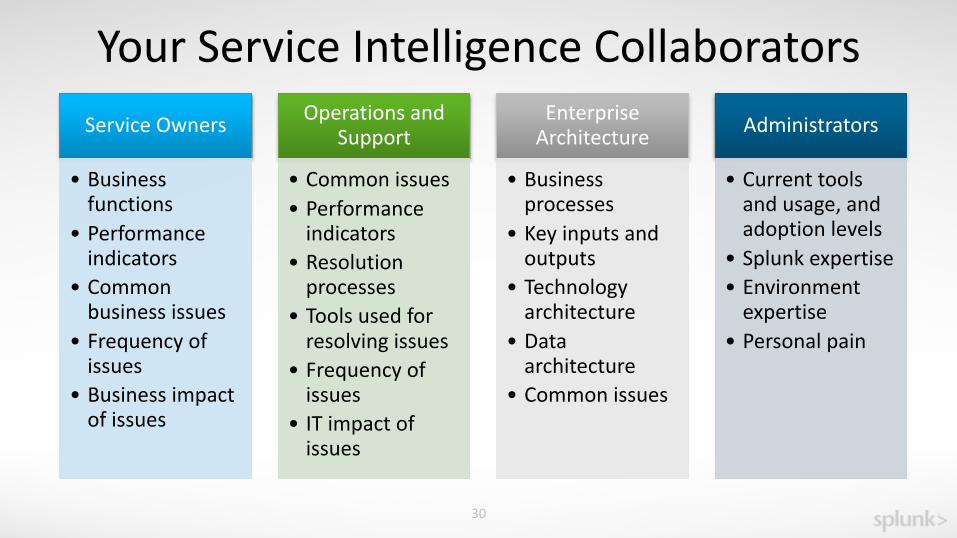
YourServiceIntelligenceCollaboratorsServiceOwners
• Businessfunctions
• Performanceindicators
• Commonbusinessissues
• Frequencyofissues
• Businessimpactofissues
OperationsandSupport
• Commonissues• Performanceindicators
• Resolutionprocesses
• Toolsusedforresolvingissues
• Frequencyofissues
• ITimpactofissues
EnterpriseArchitecture
• Businessprocesses
• Keyinputsandoutputs
• Technologyarchitecture
• Dataarchitecture
• Commonissues
Administrators
• Currenttoolsandusage,andadoptionlevels
• Splunkexpertise• Environmentexpertise
• Personalpain
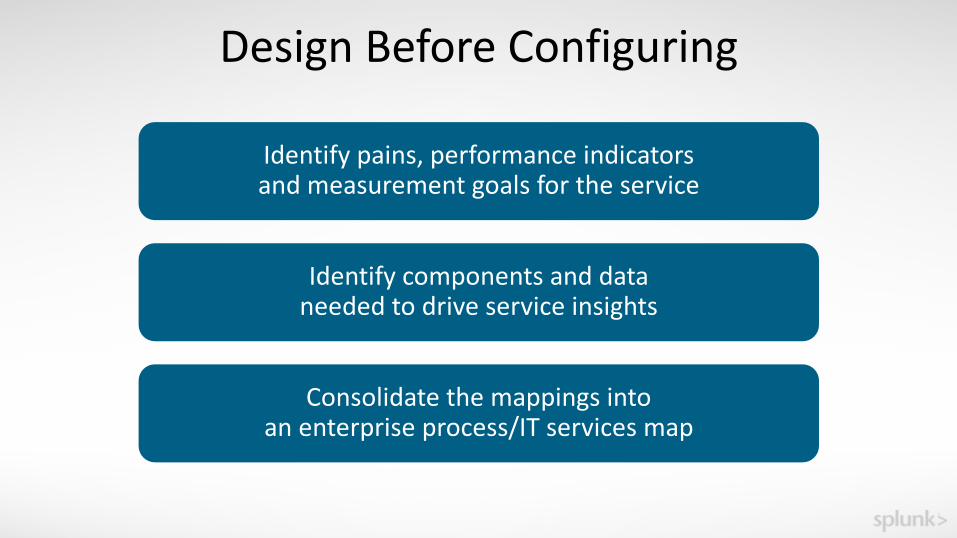
DesignBeforeConfiguring
Identifypains,performanceindicatorsandmeasurementgoalsfortheservice
Identifycomponentsanddataneededtodriveserviceinsights
Consolidatethemappingsintoanenterpriseprocess/ITservicesmap
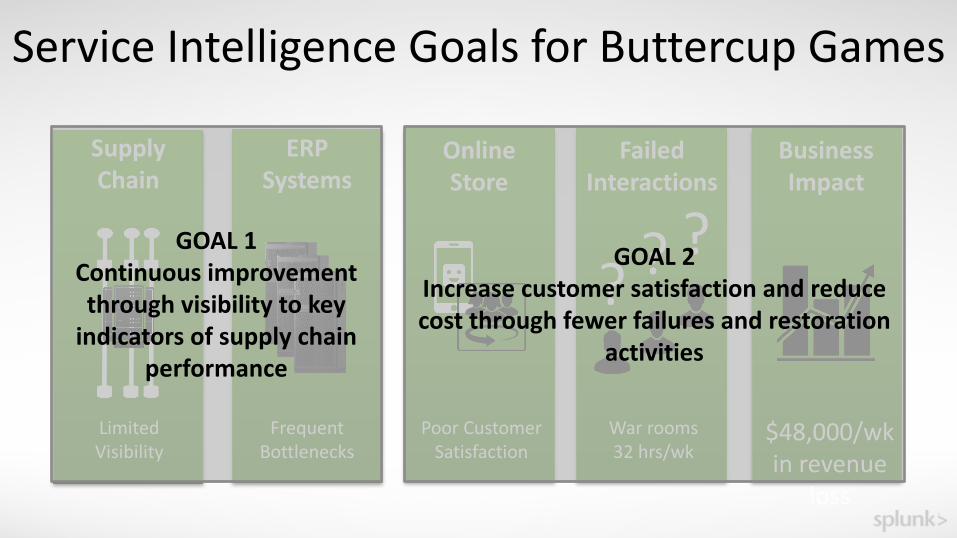
ServiceIntelligenceGoalsforButtercupGames
SupplyChain
LimitedVisibility
FrequentBottlenecks
ERPSystems
BusinessImpact
$48,000/wkinrevenue
loss
Warrooms32hrs/wk
???
FailedInteractions
OnlineStore
PoorCustomerSatisfaction
GOAL1Continuousimprovementthroughvisibilitytokeyindicatorsofsupplychain
performance
GOAL2Increasecustomersatisfactionandreducecostthroughfewerfailuresandrestoration
activities
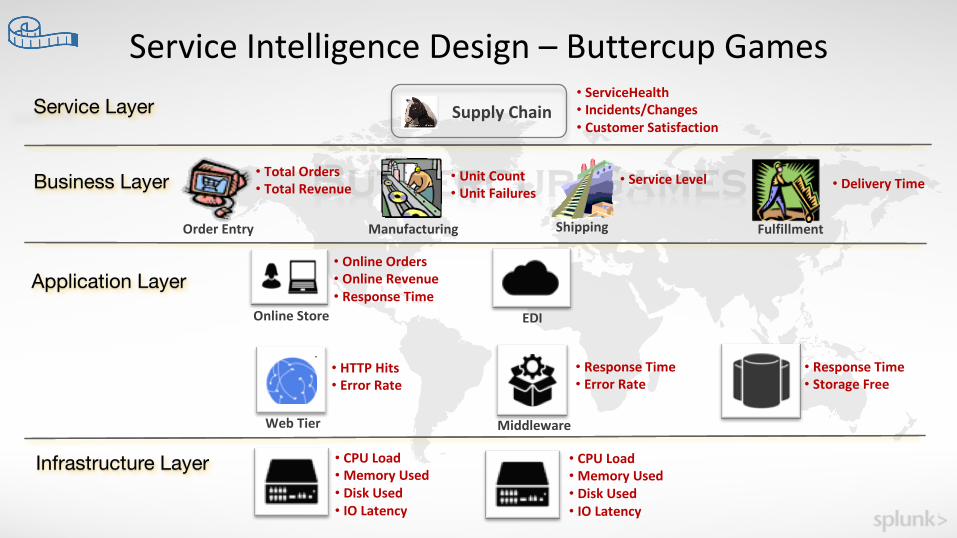
ServiceIntelligenceDesign– ButtercupGames
Infrastructure Layer
Application Layer
Business Layer
Service Layer
OrderEntry Manufacturing Shipping Fulfillment
SupplyChain
OnlineStore EDI
WebTier Middleware
• TotalOrders• TotalRevenue
• UnitCount• UnitFailures
• ServiceLevel • DeliveryTime
• OnlineOrders• OnlineRevenue• ResponseTime
• ServiceHealth• Incidents/Changes• CustomerSatisfaction
• HTTPHits• ErrorRate
• CPULoad•MemoryUsed• DiskUsed• IOLatency
• CPULoad•MemoryUsed• DiskUsed• IOLatency
• ResponseTime• ErrorRate
• ResponseTime• StorageFree
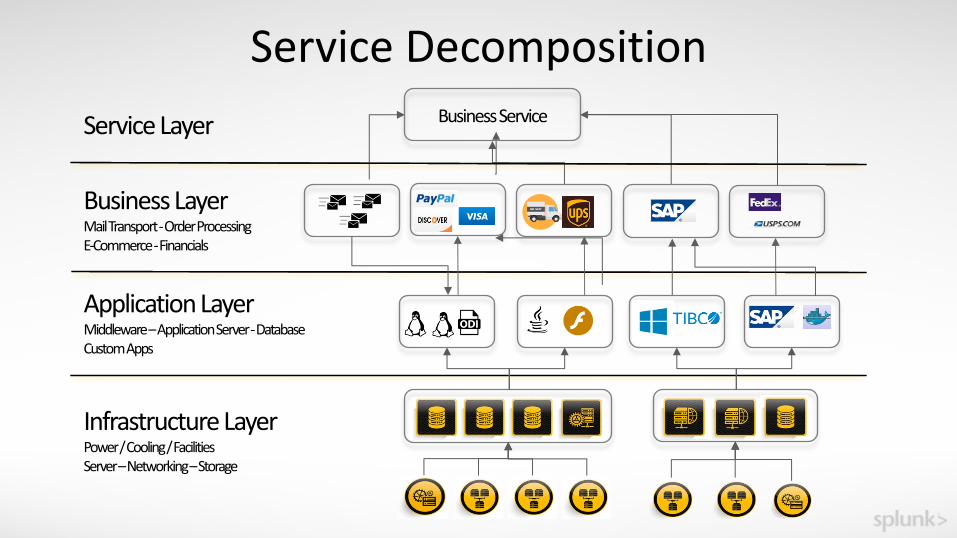
ServiceDecomposition
InfrastructureLayerPower/Cooling/FacilitiesServer–Networking–Storage
ServiceLayer BusinessService
ApplicationLayerMiddleware–ApplicationServer-DatabaseCustomApps
BusinessLayerMailTransport-OrderProcessingE-Commerce-Financials
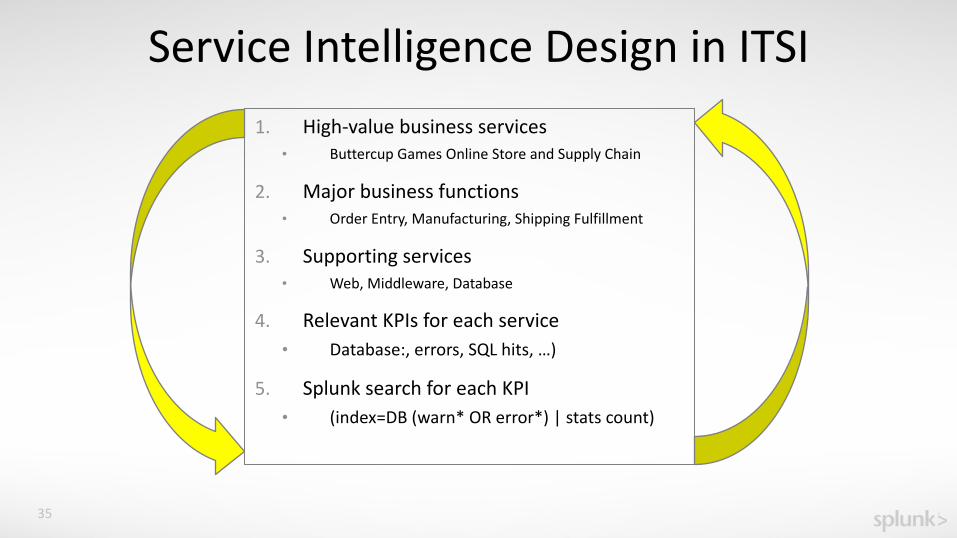
ServiceIntelligenceDesigninITSI1. High-valuebusinessservices
• ButtercupGamesOnlineStoreandSupplyChain
2. Majorbusinessfunctions• OrderEntry,Manufacturing,ShippingFulfillment
3. Supportingservices• Web,Middleware,Database
4. RelevantKPIsforeachservice• Database:,errors,SQLhits,…)
5. Splunk searchforeachKPI• (index=DB(warn*ORerror*)|statscount)
35
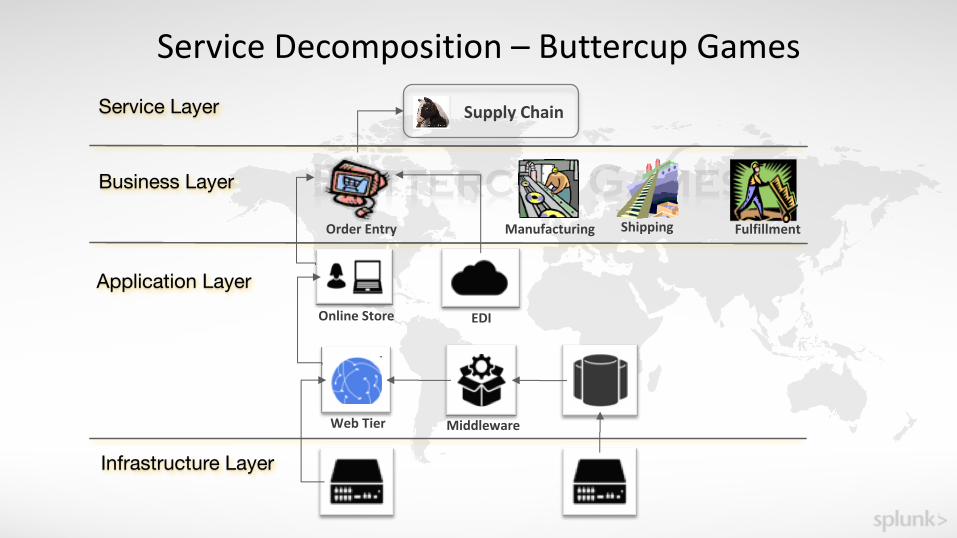
ServiceDecomposition– ButtercupGames
Infrastructure Layer
Application Layer
Business Layer
Service Layer
OrderEntry Manufacturing Shipping Fulfillment
SupplyChain
OnlineStore EDI
WebTier Middleware
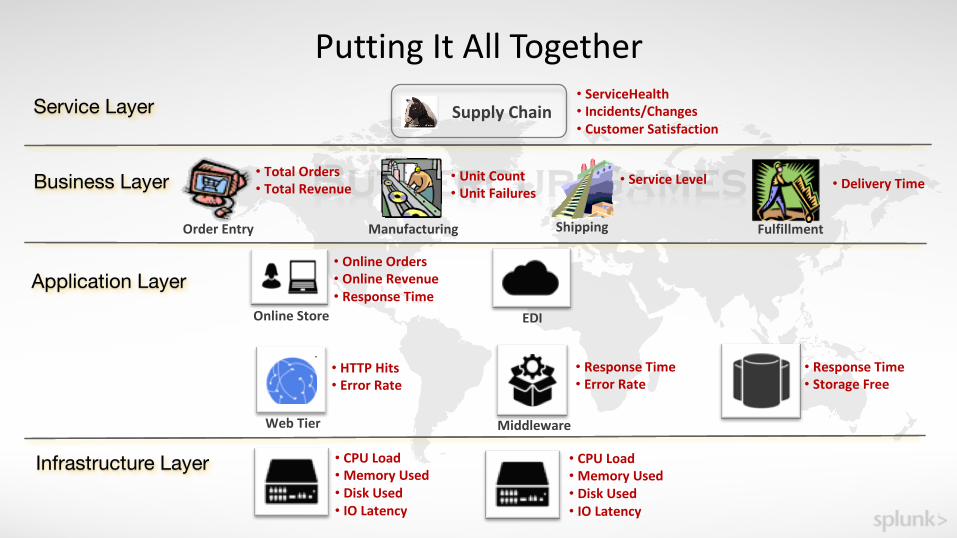
PuttingItAllTogether
Infrastructure Layer
Application Layer
Business Layer
Service Layer
OrderEntry Manufacturing Shipping Fulfillment
SupplyChain
OnlineStore EDI
WebTier Middleware
• TotalOrders• TotalRevenue
• UnitCount• UnitFailures
• ServiceLevel • DeliveryTime
• OnlineOrders• OnlineRevenue• ResponseTime
• ServiceHealth• Incidents/Changes• CustomerSatisfaction
• HTTPHits• ErrorRate
• CPULoad•MemoryUsed• DiskUsed• IOLatency
• CPULoad•MemoryUsed• DiskUsed• IOLatency
• ResponseTime• ErrorRate
• ResponseTime• StorageFree
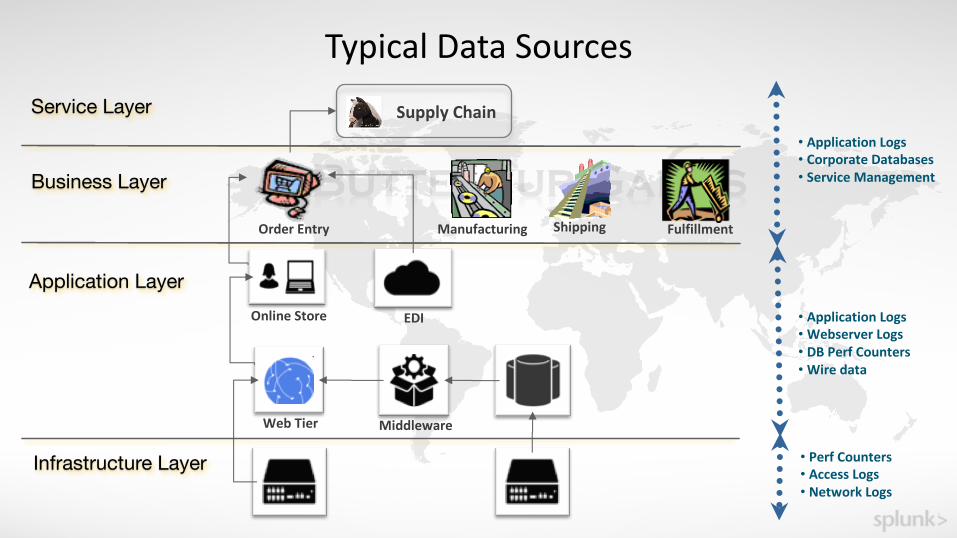
TypicalDataSources
Infrastructure Layer
Application Layer
Business Layer
Service Layer
OrderEntry Manufacturing Shipping Fulfillment
SupplyChain
OnlineStore EDI
WebTier Middleware
• ApplicationLogs• CorporateDatabases• ServiceManagement
• ApplicationLogs•WebserverLogs• DBPerf Counters•Wiredata
• Perf Counters• AccessLogs• NetworkLogs
Copyright©2016SplunkInc.
Let’sPlay!
SettingupServiceIntelligence
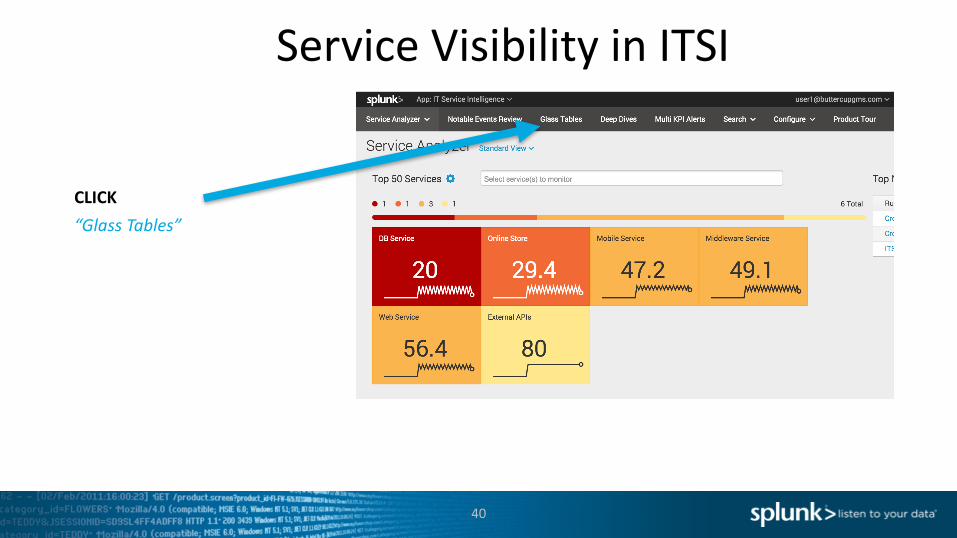
ServiceVisibilityinITSI
40
CLICK“GlassTables”
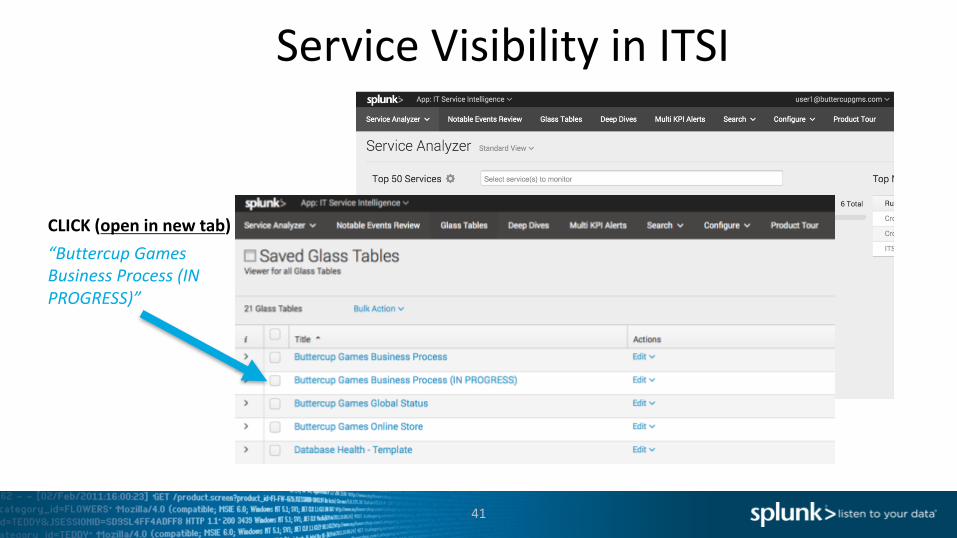
ServiceVisibilityinITSI
41
CLICK(openinnewtab)“ButtercupGamesBusinessProcess(INPROGRESS)”
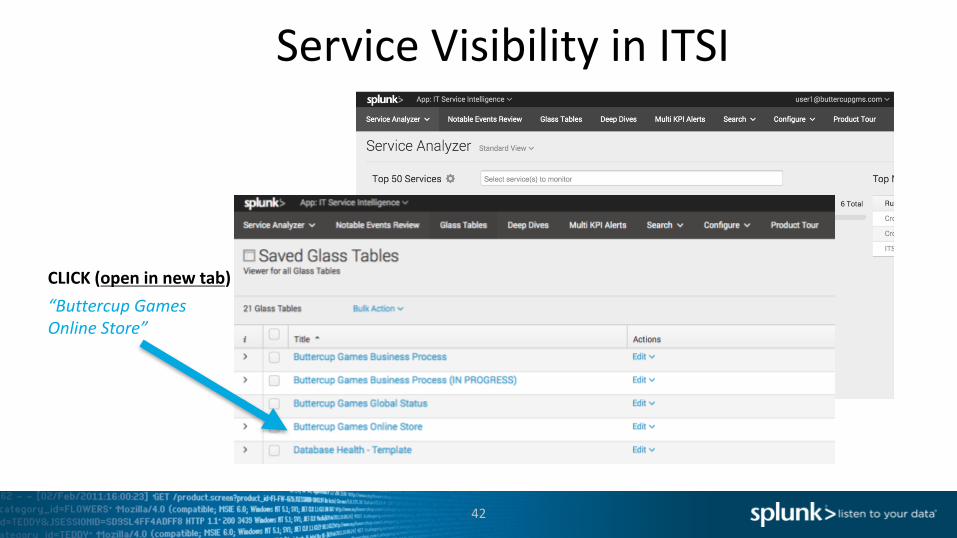
ServiceVisibilityinITSI
42
CLICK(openinnewtab)“ButtercupGamesOnlineStore”
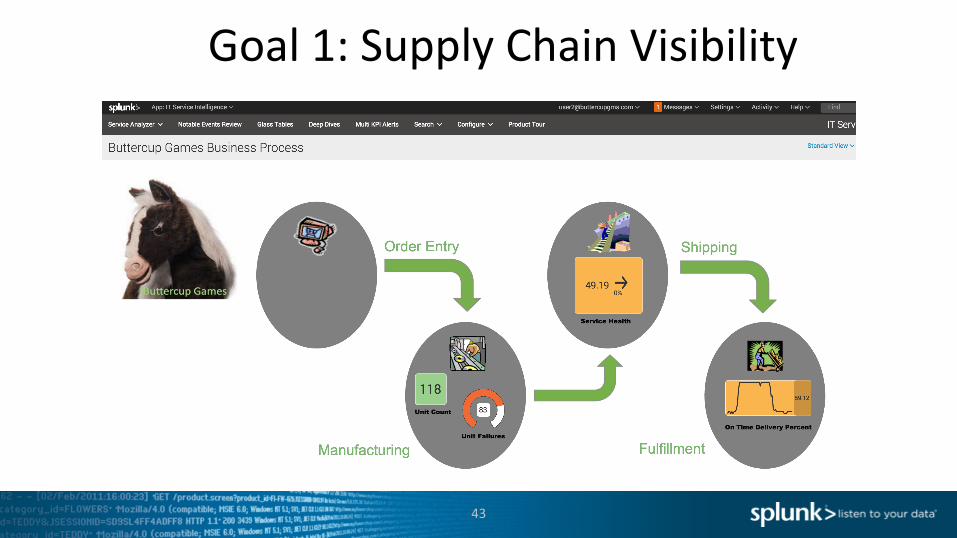
Goal1:SupplyChainVisibility
43
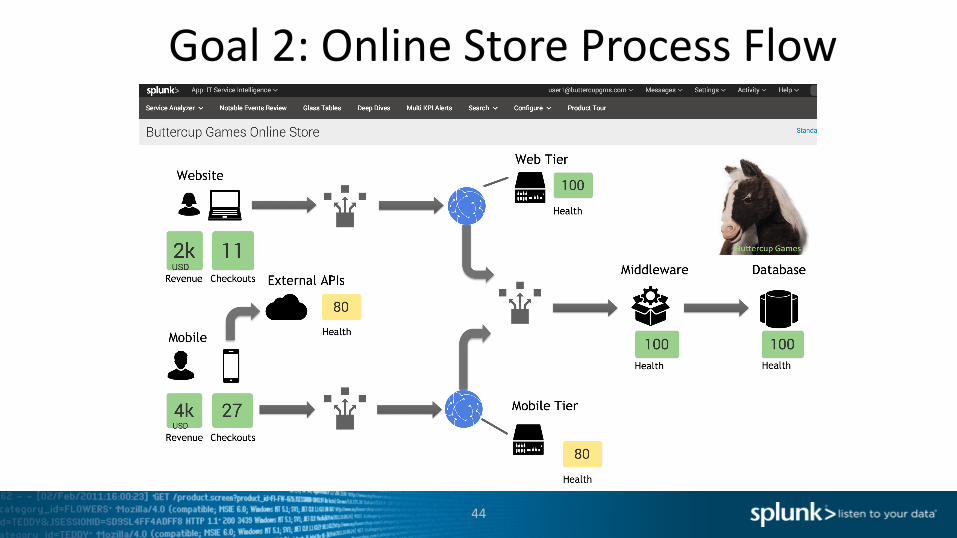
Goal2:OnlineStoreProcessFlow
44
NewRequirements!
45
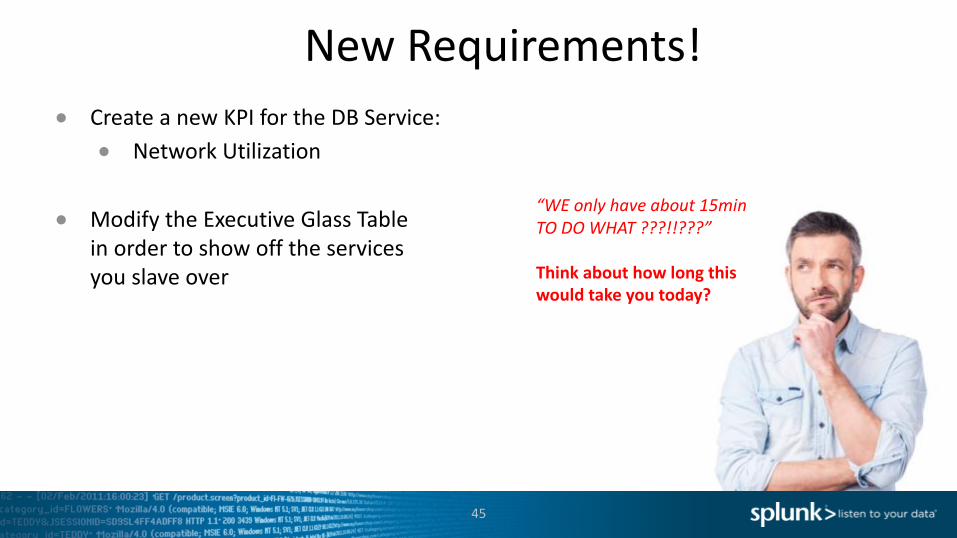
● CreateanewKPIfortheDBService:● NetworkUtilization
● ModifytheExecutiveGlassTableinordertoshowofftheservicesyouslaveover
“WEonlyhaveabout15minTODOWHAT???!!???”
Thinkabouthowlongthiswouldtakeyoutoday?
46
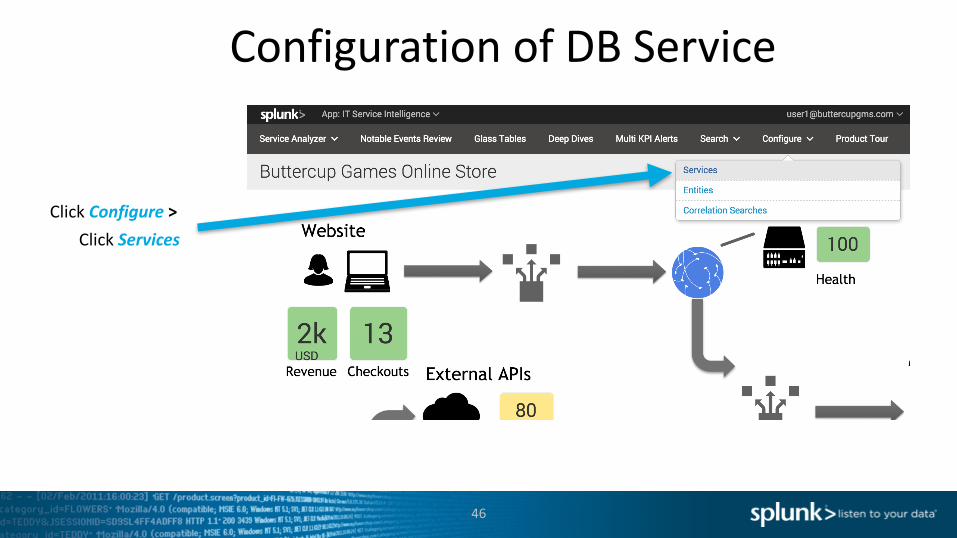
ConfigurationofDBService
Click Configure >Click Services
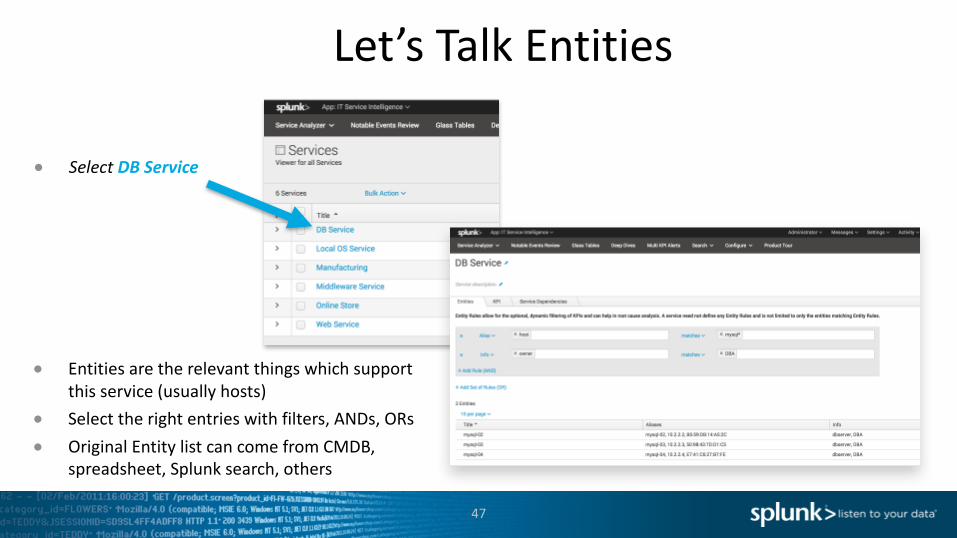
Let’sTalkEntities
47
● Select DBService
● Entitiesaretherelevantthingswhichsupportthisservice(usuallyhosts)
● Selecttherightentrieswithfilters,ANDs,ORs● OriginalEntitylistcancomefromCMDB,
spreadsheet,Splunksearch,others
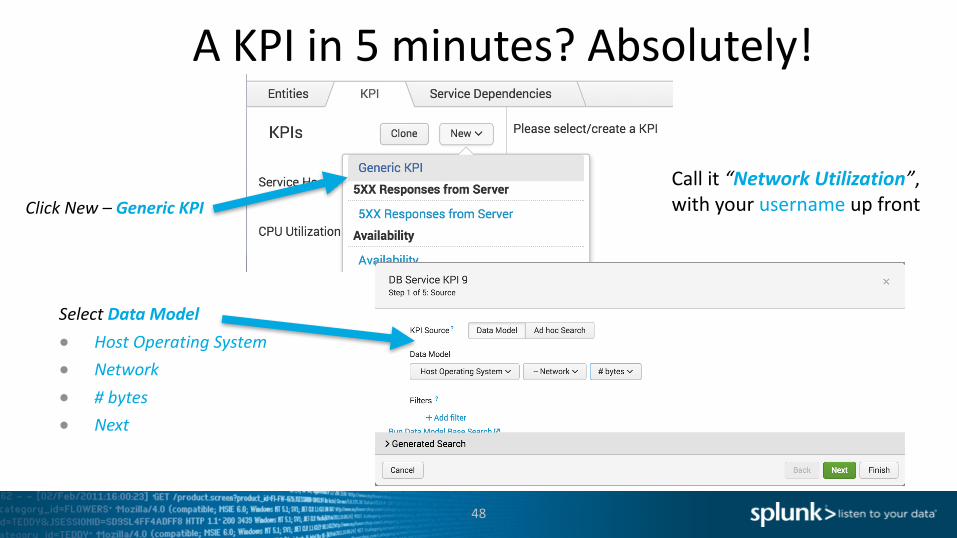
AKPIin5minutes?Absolutely!
48
ClickNew– GenericKPI
Select DataModel● HostOperatingSystem● Network● #bytes● Next
Callit“NetworkUtilization”,withyourusername upfront
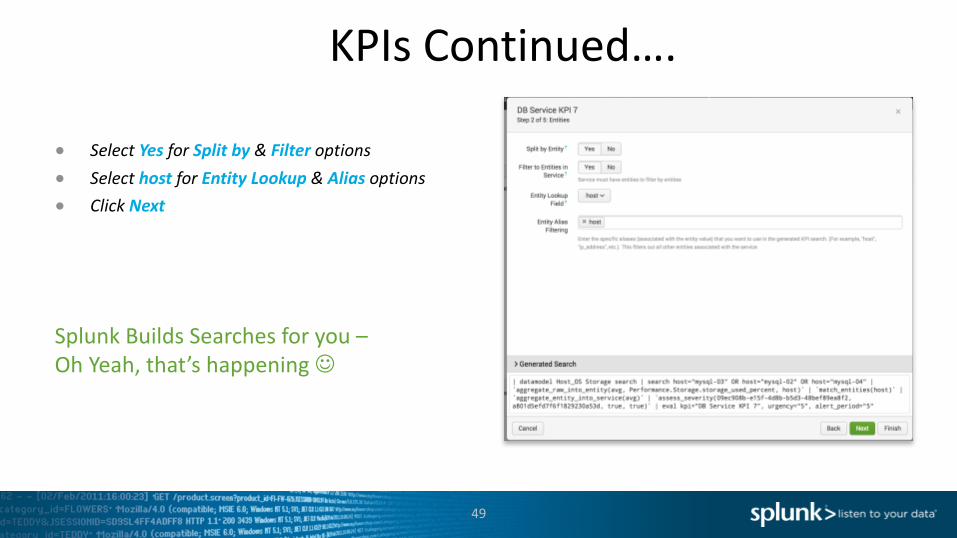
KPIsContinued….
49
SplunkBuildsSearchesforyou–OhYeah,that’shappeningJ
● Select Yesfor Splitby& Filteroptions● Select hostfor EntityLookup& Aliasoptions● Click Next
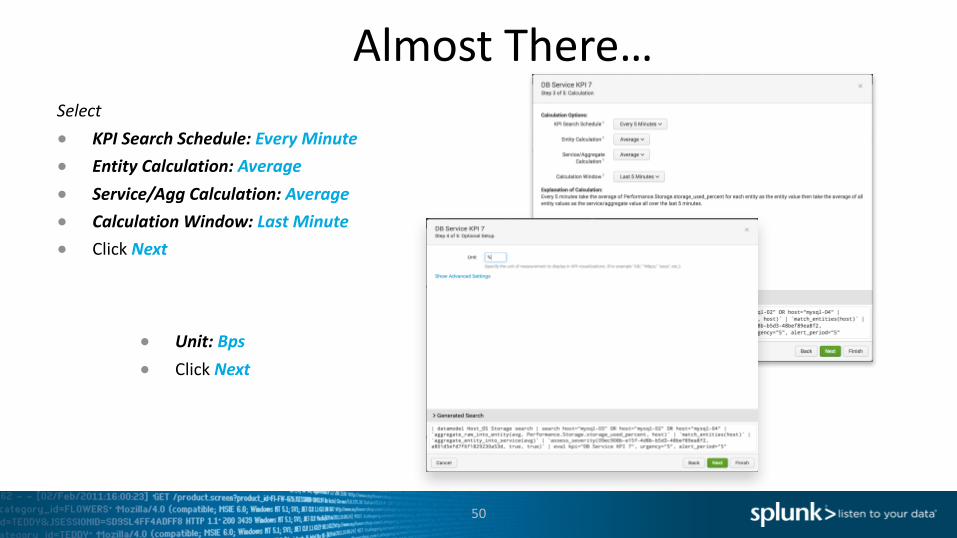
AlmostThere…
50
Select● KPISearchSchedule:EveryMinute● EntityCalculation:Average● Service/AggCalculation:Average● CalculationWindow:LastMinute● Click Next
● Unit:Bps● Click Next
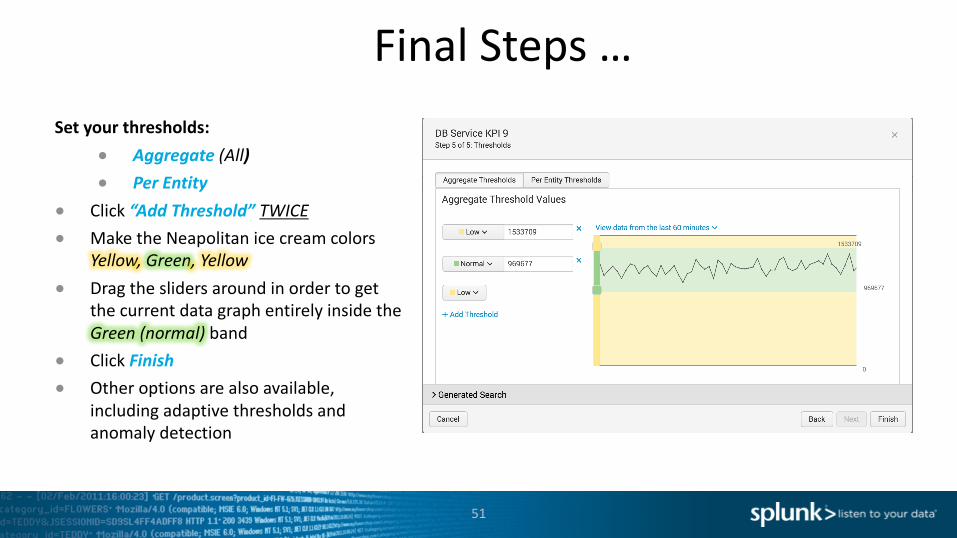
FinalSteps…
51
Setyourthresholds:● Aggregate(All)● PerEntity
● Click “AddThreshold”TWICE● MaketheNeapolitanicecreamcolors
Yellow,Green,Yellow● Dragtheslidersaroundinordertoget
thecurrentdatagraphentirelyinsidetheGreen(normal) band
● Click Finish● Otheroptionsarealsoavailable,
includingadaptivethresholdsandanomalydetection
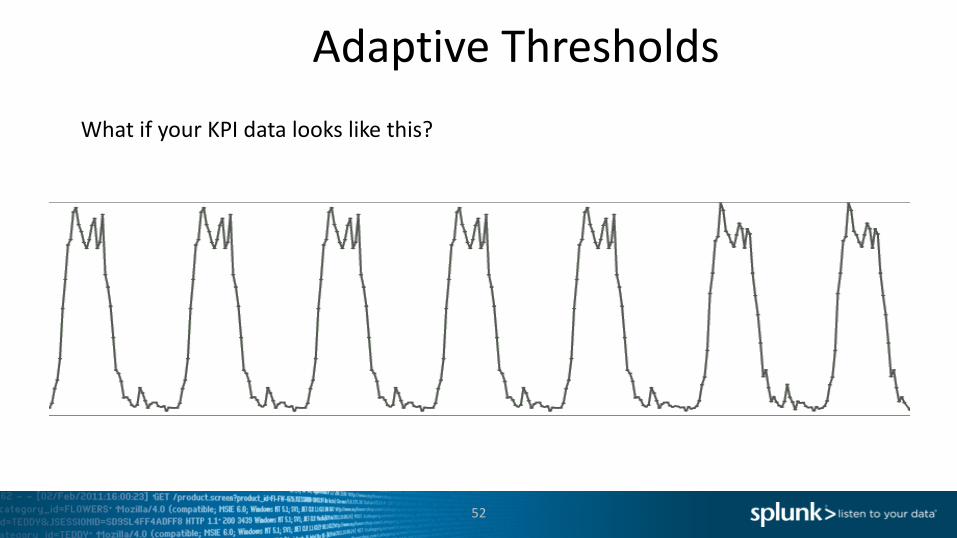
AdaptiveThresholds
52
WhatifyourKPIdatalookslikethis?
53
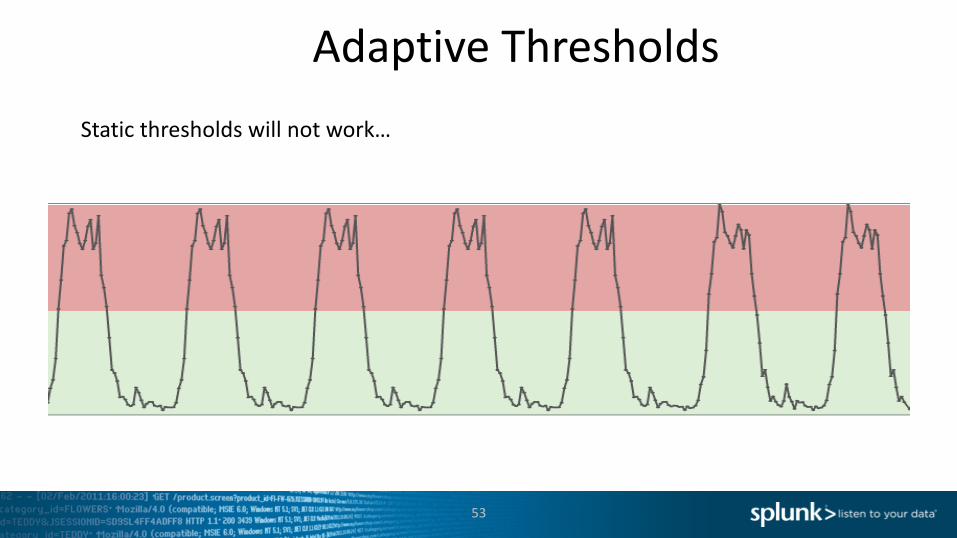
AdaptiveThresholdsStaticthresholdswillnotwork…
54
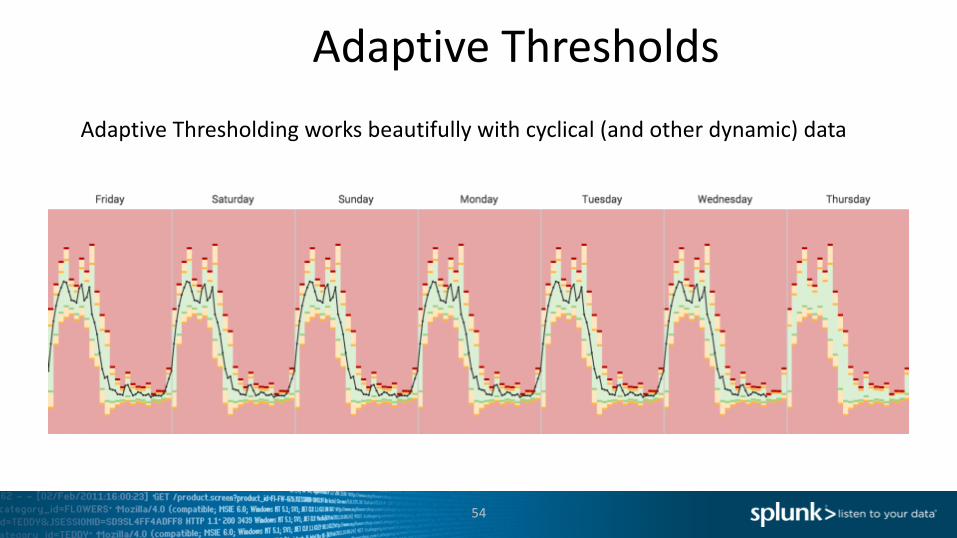
AdaptiveThresholdsAdaptiveThresholdingworksbeautifullywithcyclical(andotherdynamic)data
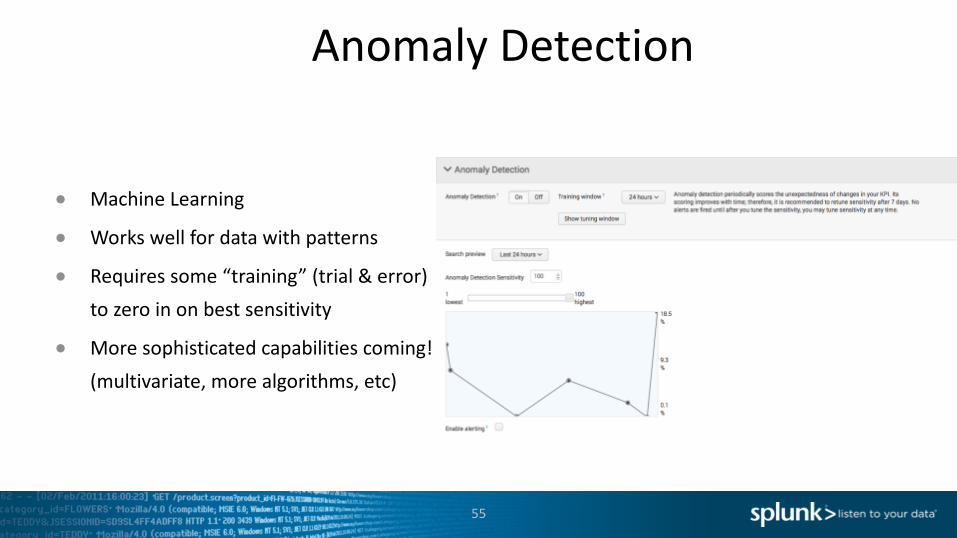
AnomalyDetection
55
● MachineLearning
● Workswellfordatawithpatterns
● Requiressome“training”(trial&error)tozeroinonbestsensitivity
● Moresophisticatedcapabilitiescoming!(multivariate,morealgorithms,etc)
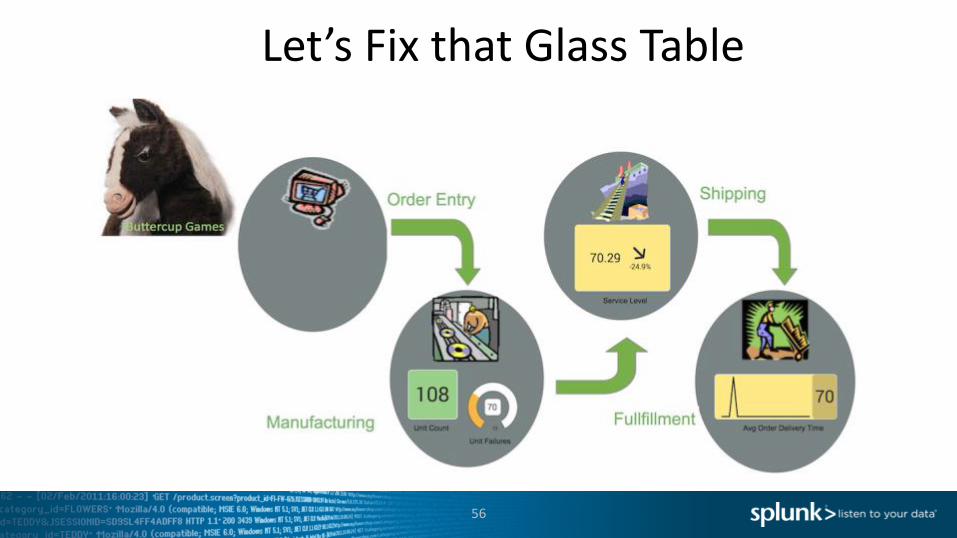
Let’sFixthatGlassTable
56
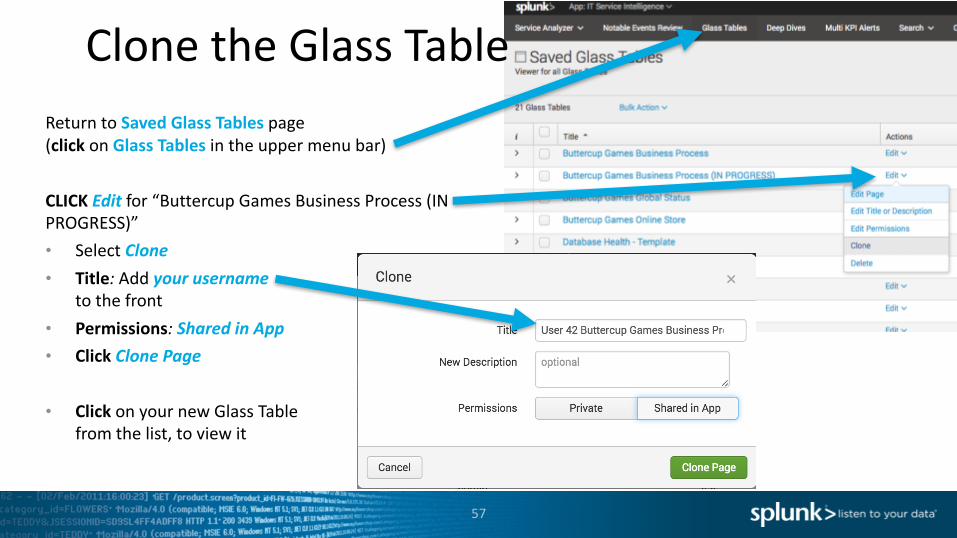
ClonetheGlassTable
57
ReturntoSavedGlassTablespage(click onGlassTablesintheuppermenubar)
CLICKEdit for“ButtercupGamesBusinessProcess(INPROGRESS)”• Select Clone• Title:Add yourusername
tothefront• Permissions:SharedinApp• Click ClonePage
• Click onyournewGlassTablefromthelist,toviewit
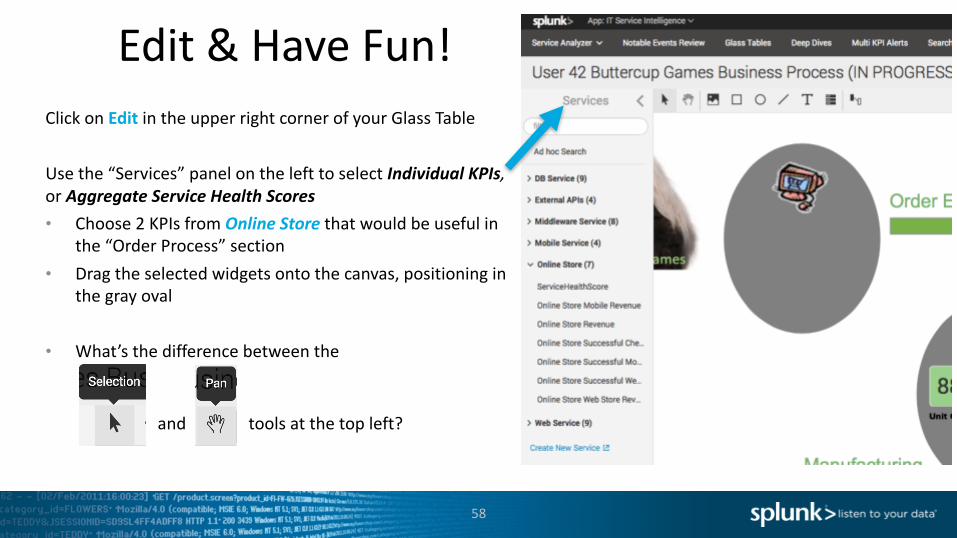
Edit&HaveFun!
58
ClickonEdit intheupperrightcornerofyourGlassTable
Usethe“Services”panelonthelefttoselectIndividualKPIs,or AggregateServiceHealthScores• Choose2KPIsfromOnlineStore thatwouldbeusefulin
the“OrderProcess”section• Dragtheselectedwidgetsontothecanvas,positioningin
thegrayoval
• What’sthedifferencebetweenthe
and toolsatthetopleft?
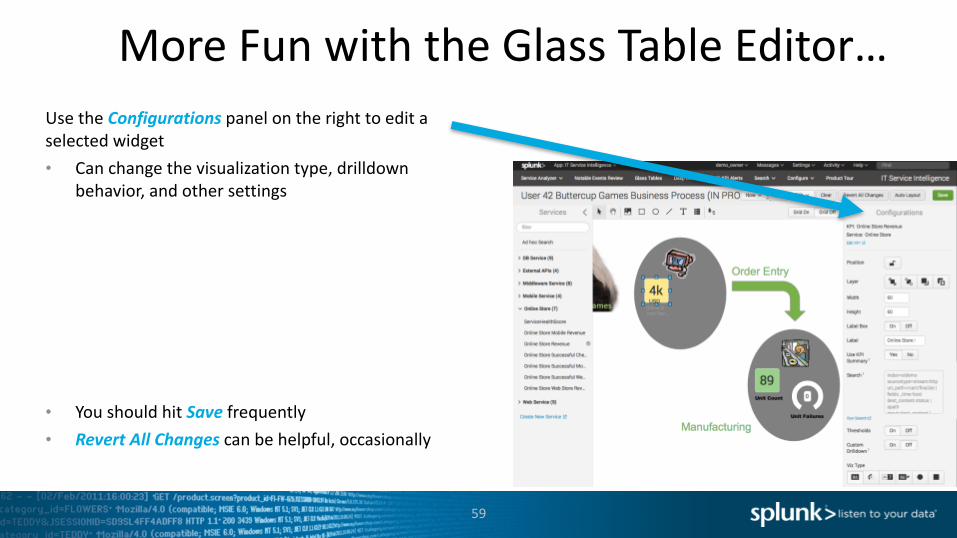
MoreFunwiththeGlassTableEditor…
59
UsetheConfigurations panelontherighttoeditaselectedwidget• Canchangethevisualizationtype,drilldown
behavior,andothersettings
• YoushouldhitSave frequently• RevertAllChangescanbehelpful,occasionally
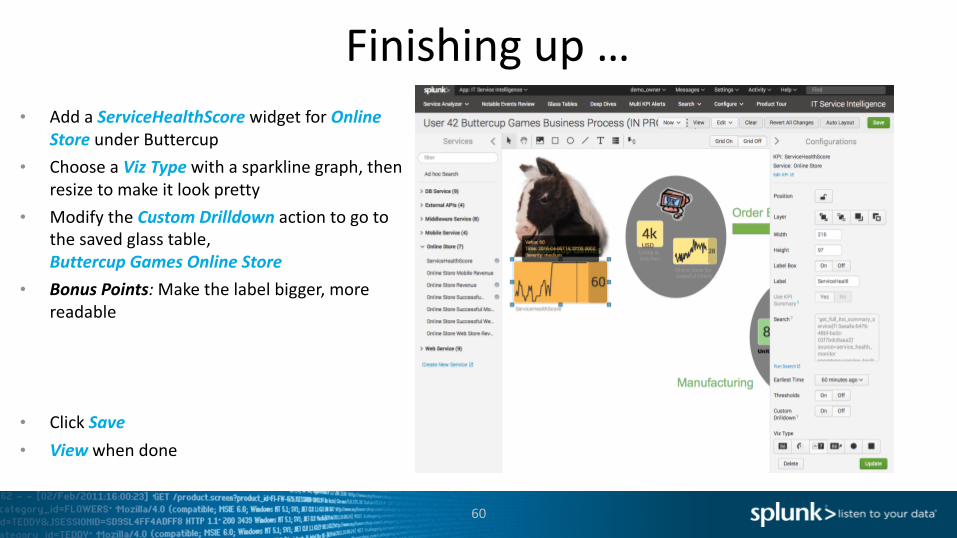
Finishingup…
60
• AddaServiceHealthScore widgetforOnlineStoreunderButtercup
• ChooseaVizTypewithasparklinegraph,thenresizetomakeitlookpretty
• ModifytheCustomDrilldownactiontogotothesavedglasstable,ButtercupGamesOnlineStore
• BonusPoints:Makethelabelbigger,morereadable
• Click Save• View whendone
Copyright©2016SplunkInc.
Let’sPlay!
ATroubleshootingExercise
ATroubleshootingExercise
62
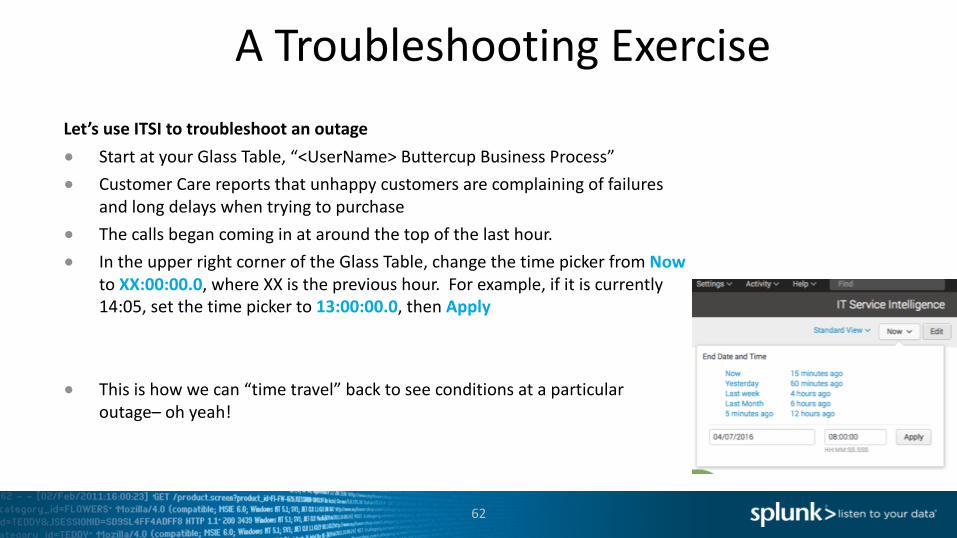
Let’suseITSItotroubleshootanoutage● StartatyourGlassTable,“<UserName>ButtercupBusinessProcess”● CustomerCarereportsthatunhappycustomersarecomplainingoffailures
andlongdelayswhentryingtopurchase● Thecallsbegancominginataroundthetopofthelasthour.● IntheupperrightcorneroftheGlassTable,changethetimepickerfromNow
toXX:00:00.0,whereXXistheprevioushour.Forexample,ifitiscurrently14:05,setthetimepickerto13:00:00.0,thenApply
● Thisishowwecan“timetravel”backtoseeconditionsataparticularoutage– ohyeah!
ATroubleshootingExercise,cont’d
63
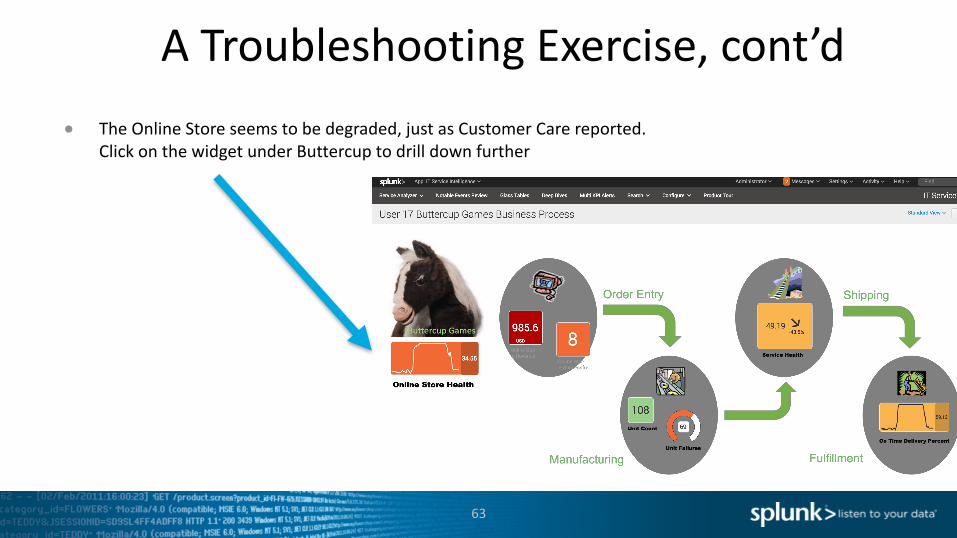
● TheOnlineStoreseemstobedegraded,justasCustomerCarereported.ClickonthewidgetunderButtercuptodrilldownfurther
ATroubleshootingExercise,cont’d.
64
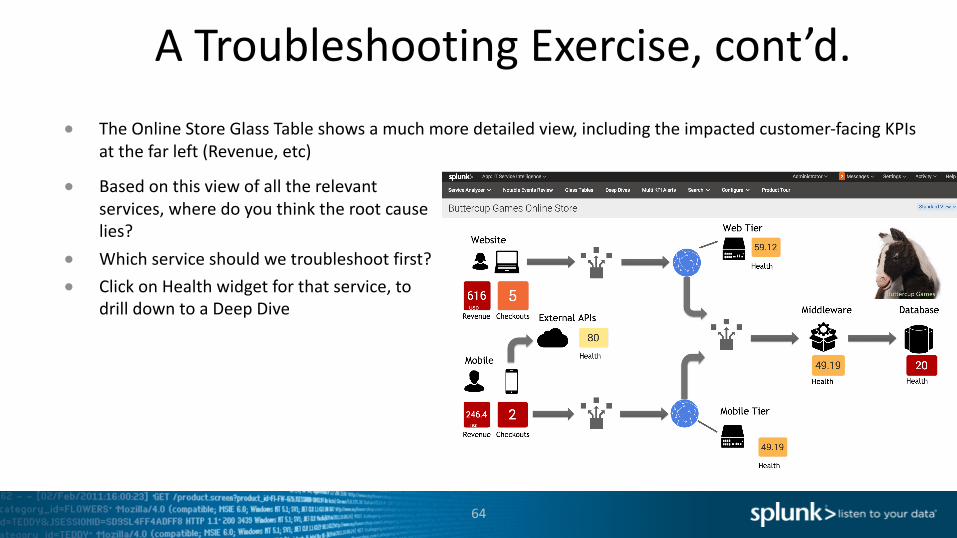
● TheOnlineStoreGlassTableshowsamuchmoredetailedview,includingtheimpactedcustomer-facingKPIsatthefarleft(Revenue,etc)
● Basedonthisviewofalltherelevantservices,wheredoyouthinktherootcauselies?
● Whichserviceshouldwetroubleshootfirst?● ClickonHealthwidgetforthatservice,to
drilldowntoaDeepDive
DeepDive
65
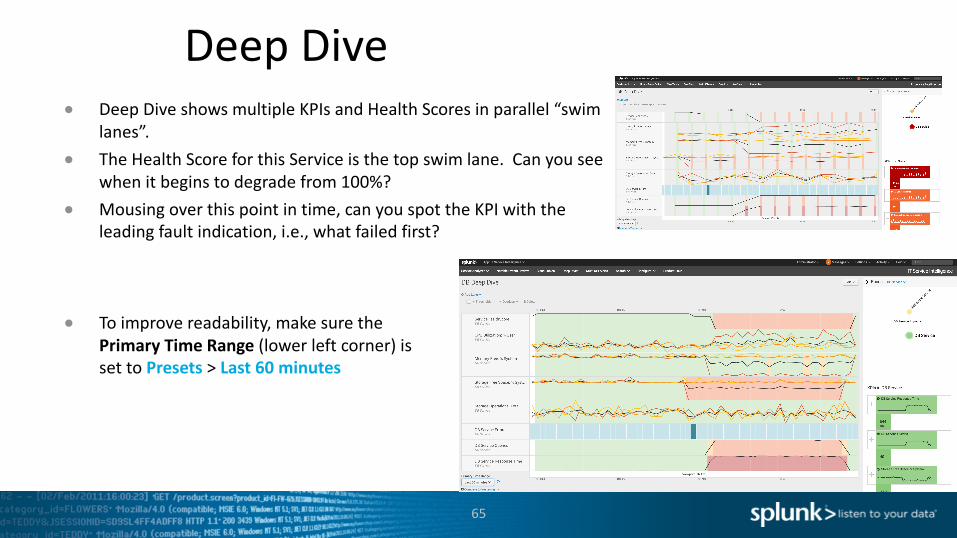
● DeepDiveshowsmultipleKPIsandHealthScoresinparallel“swimlanes”.
● TheHealthScoreforthisServiceisthetopswimlane.Canyouseewhenitbeginstodegradefrom100%?
● Mousingoverthispointintime,canyouspottheKPIwiththeleadingfaultindication,i.e.,whatfailedfirst?
● Toimprovereadability,makesurethePrimaryTimeRange(lowerleftcorner)issettoPresets >Last60minutes
Multi-KPIAlertsandNotableEvents
66
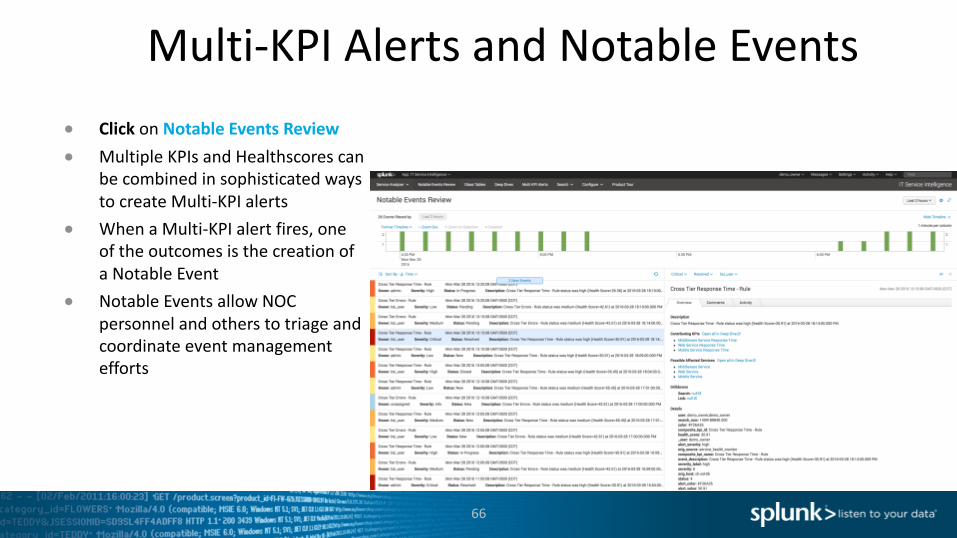
● Click onNotableEventsReview● MultipleKPIsandHealthscorescan
becombinedinsophisticatedwaystocreateMulti-KPIalerts
● WhenaMulti-KPIalertfires,oneoftheoutcomesisthecreationofaNotableEvent
● NotableEventsallowNOCpersonnelandotherstotriageandcoordinateeventmanagementefforts
ServiceAnalyzer
67
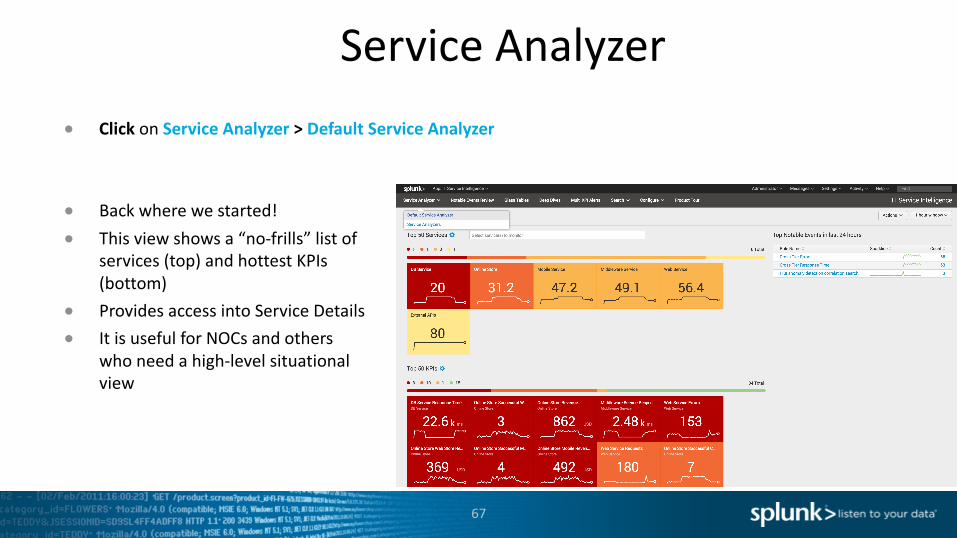
● Click onServiceAnalyzer> DefaultServiceAnalyzer
● Backwherewestarted!● Thisviewshowsa“no-frills”listof
services(top)andhottestKPIs(bottom)
● ProvidesaccessintoServiceDetails● ItisusefulforNOCsandothers
whoneedahigh-levelsituationalview
Copyright©2016SplunkInc.
Let’sPlay!
AdvancedExercises
Summary
69
● High-valueservicescanbedecomposedandmodeledinITSI,usingmachinedatafromtherelevantsystems
● Services andKPIs canbecreatedinminutes,withsophisticatedthresholdingtechniquestodistinguish“normal”from“notnormal”
● GlassTablesallowservicehealthandKPImetricstobedisplayedinawaythatmakessensetospecificgroups,suchasExecutiveLeadership,BusinessServiceOwners,theNOC,DevOps&Others
● DeepDivesallowKPIstobecomparedside-by-sideacrossanytimerange,acceleratingrootcauseanalysisandsignificantlyreducingMTTR
● Multi-KPIAlertsandNotableEventsreducealertnoise,producingactionableeventsandameanstomanagethem
● …andit’sfast+fun tobuild!
WhatourITSICustomersaredoing
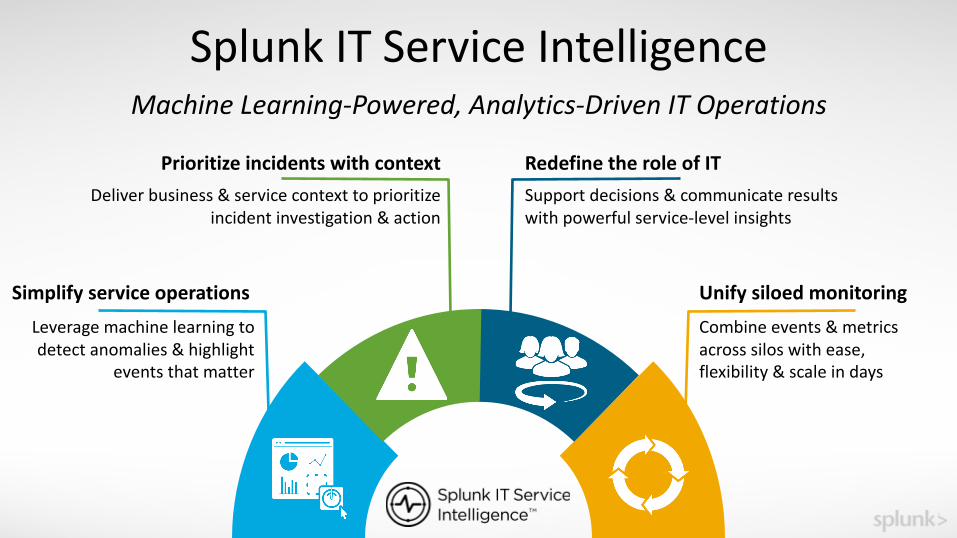
Splunk ITServiceIntelligenceMachineLearning-Powered,Analytics-DrivenITOperations
Simplifyserviceoperations
Prioritizeincidentswithcontext RedefinetheroleofIT
Combineevents&metricsacrosssiloswithease,flexibility&scaleindays
Unifysiloed monitoringLeveragemachinelearningtodetectanomalies&highlight
eventsthatmatter
Deliverbusiness&servicecontexttoprioritizeincidentinvestigation&action
Supportdecisions&communicateresultswithpowerfulservice-levelinsights
Copyright©2016Splunk,Inc.
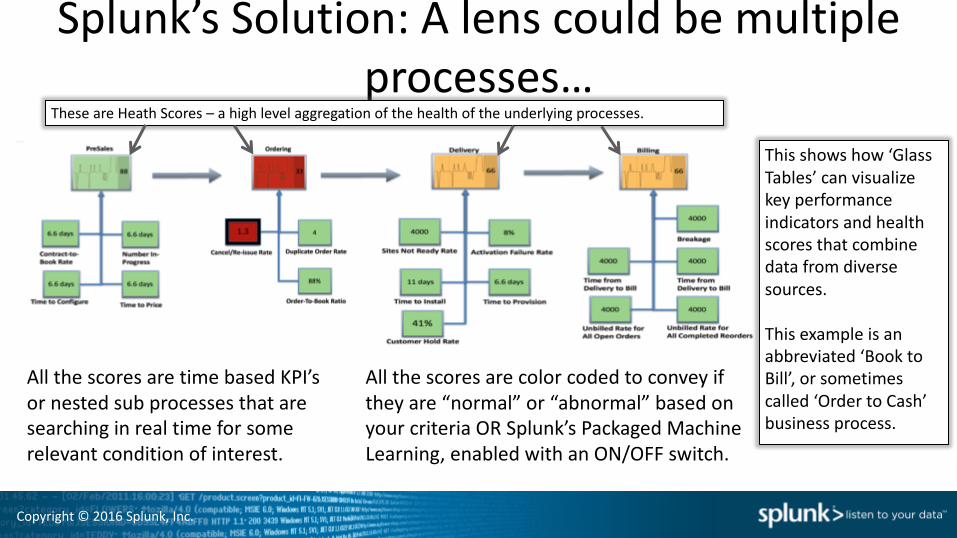
Splunk’sSolution:Alenscouldbemultipleprocesses…
AllthescoresaretimebasedKPI’sornestedsubprocessesthataresearchinginrealtimeforsomerelevantconditionofinterest.
TheseareHeathScores– ahighlevelaggregationofthehealthoftheunderlyingprocesses.
Allthescoresarecolorcodedtoconveyiftheyare“normal”or“abnormal”basedonyourcriteriaORSplunk’s PackagedMachineLearning,enabledwithanON/OFFswitch.
Thisshowshow‘GlassTables’canvisualizekeyperformanceindicatorsandhealthscoresthatcombinedatafromdiversesources.
Thisexampleisanabbreviated‘BooktoBill’,orsometimescalled‘OrdertoCash’businessprocess.
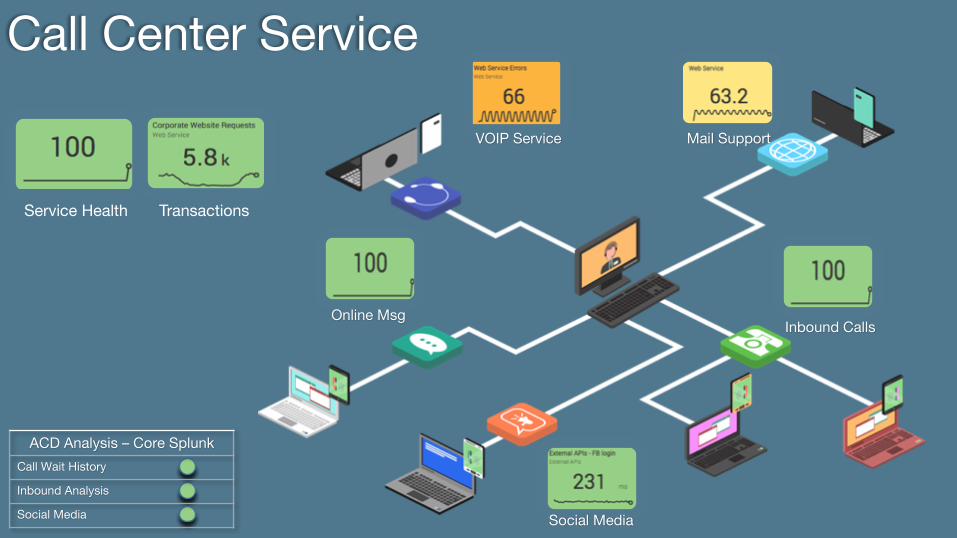
Call Center Service
Service Health Transactions
ACD Analysis – Core SplunkCall Wait History
Inbound Analysis
Social Media
Online Msg
Social Media
Mail SupportVOIP Service
Inbound Calls
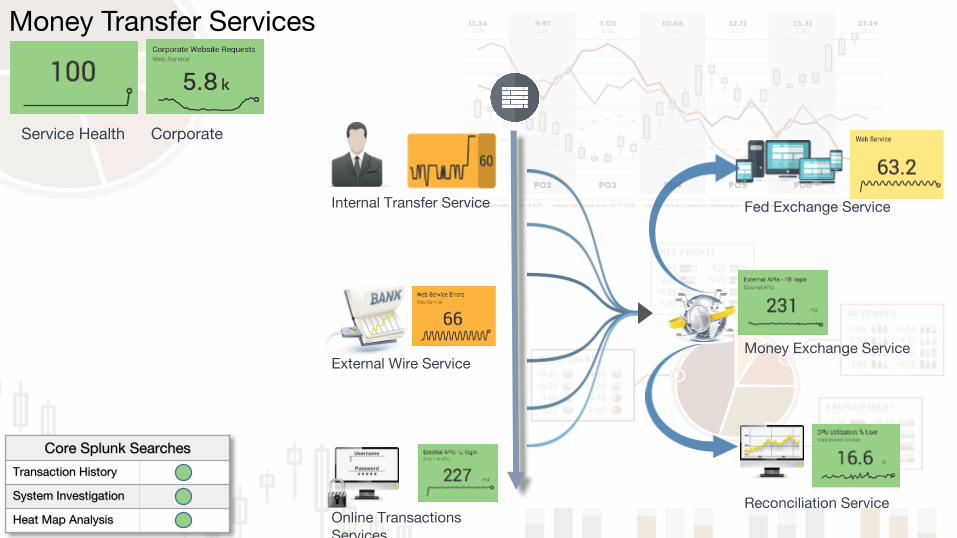
Online Transactions Services
Internal Transfer Service
External Wire ServiceMoney Exchange Service
Money Transfer Services
Service Health Corporate
Reconciliation Service
Fed Exchange Service
Core Splunk SearchesTransaction History
System Investigation
Heat Map Analysis
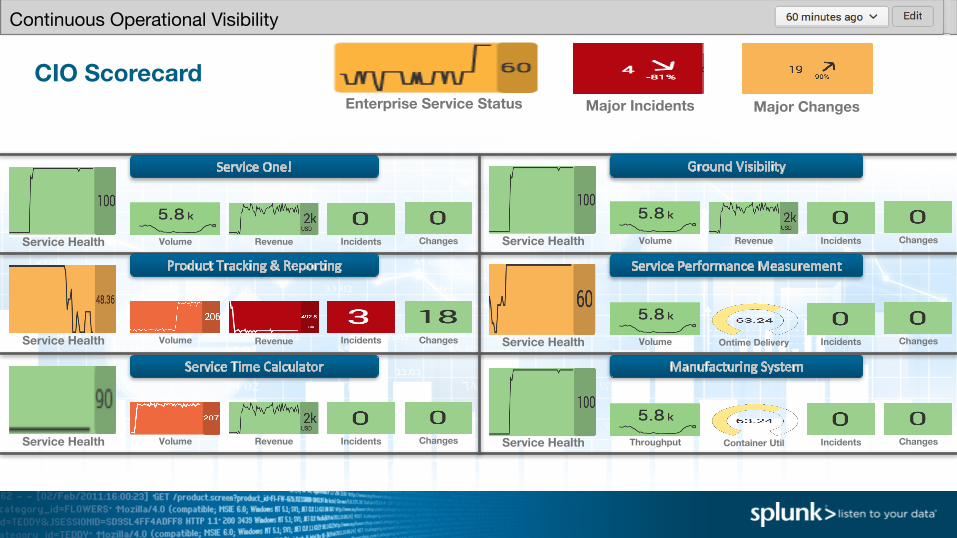
CIO ScorecardEnterprise Service Status Major Incidents
Service Health
Continuous Operational Visibility
Volume Revenue Incidents Changes
Major Changes
Service Health Volume Revenue Incidents Changes
Service Health Volume Ontime DeliveryIncidents Changes Service Health VolumeRevenue Incidents Changes
Service Health Volume Revenue Incidents Changes Container UtilService Health Throughput Incidents Changes
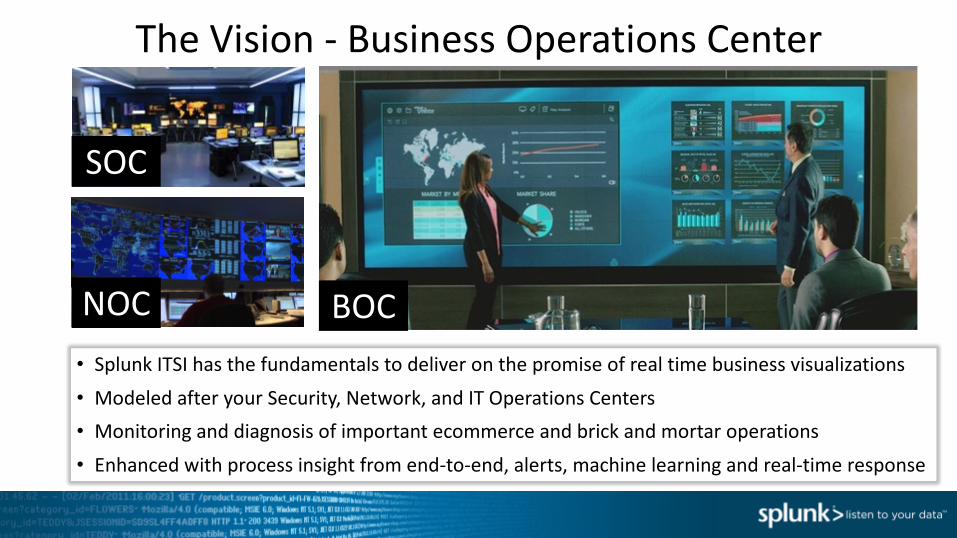
TheVision- BusinessOperationsCenter
• SplunkITSIhasthefundamentalstodeliveronthepromiseofrealtimebusinessvisualizations• ModeledafteryourSecurity,Network,andITOperationsCenters• Monitoringanddiagnosisofimportantecommerceandbrickandmortaroperations• Enhancedwithprocessinsightfromend-to-end,alerts,machinelearningandreal-timeresponse
NOC
SOC
BOC
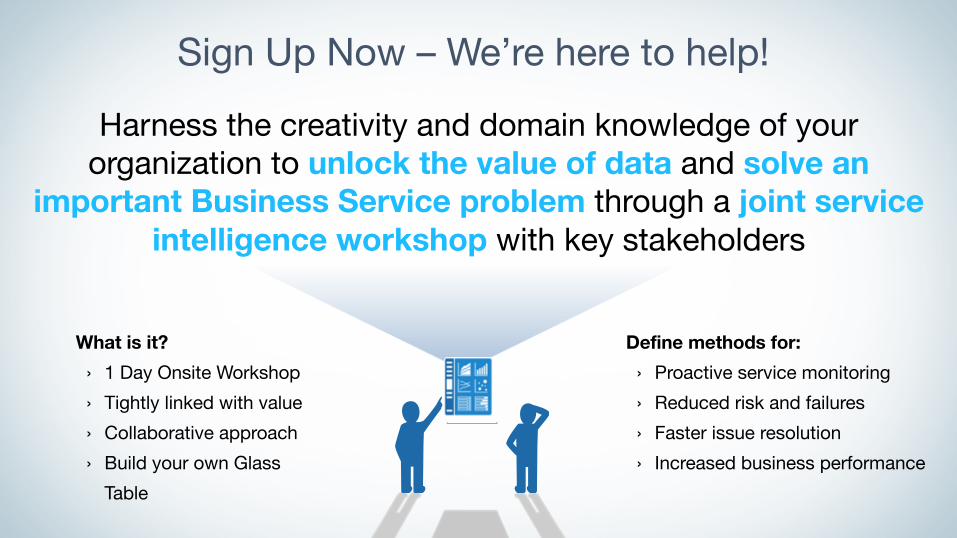
Sign Up Now – We’re here to help!
Harness the creativity and domain knowledge of your organization to unlock the value of data and solve an
important Business Service problem through a joint service intelligence workshop with key stakeholders
Define methods for:› Proactive service monitoring› Reduced risk and failures› Faster issue resolution› Increased business performance
What is it? › 1 Day Onsite Workshop› Tightly linked with value› Collaborative approach› Build your own Glass
Table
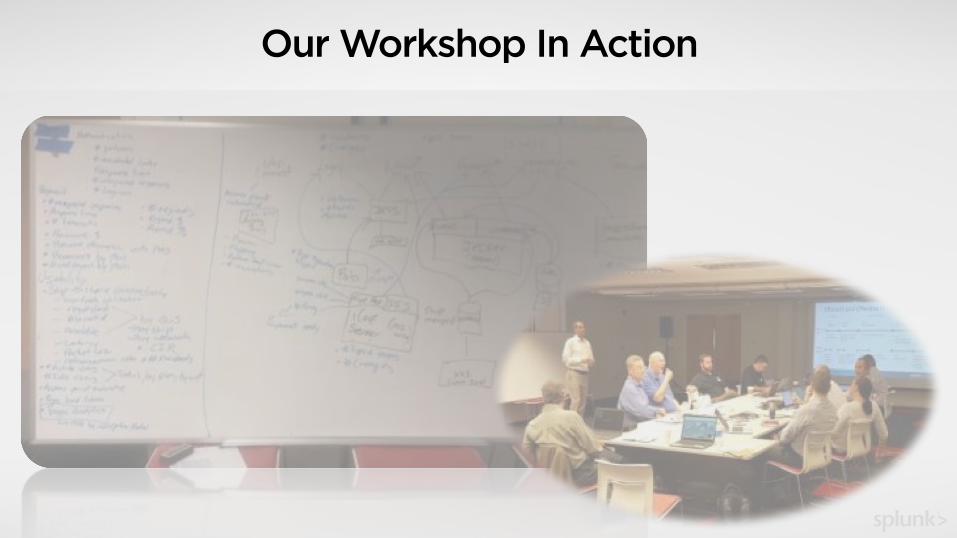
Our Workshop In Action
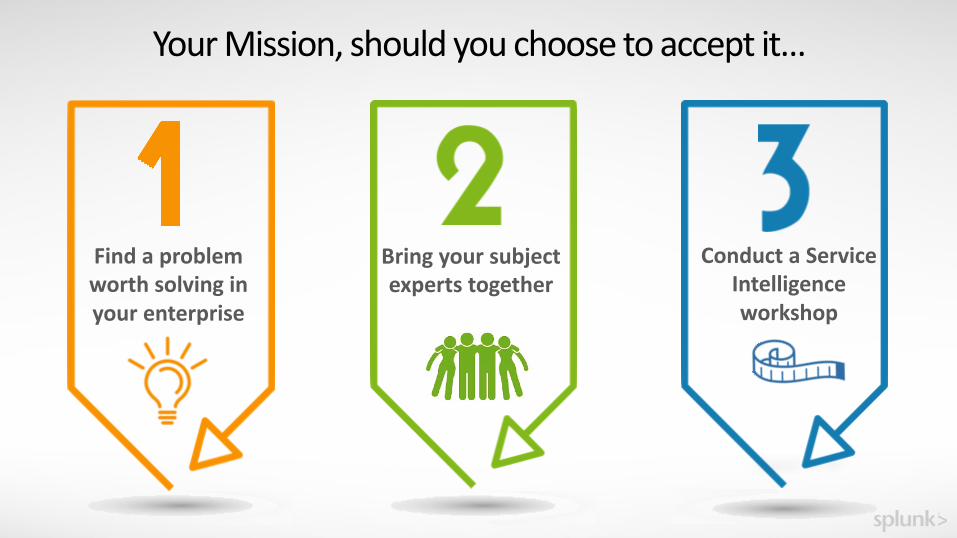
Bringyoursubjectexpertstogether
ConductaServiceIntelligenceworkshop
YourMission,shouldyouchoosetoacceptit…
Findaproblemworthsolvinginyourenterprise
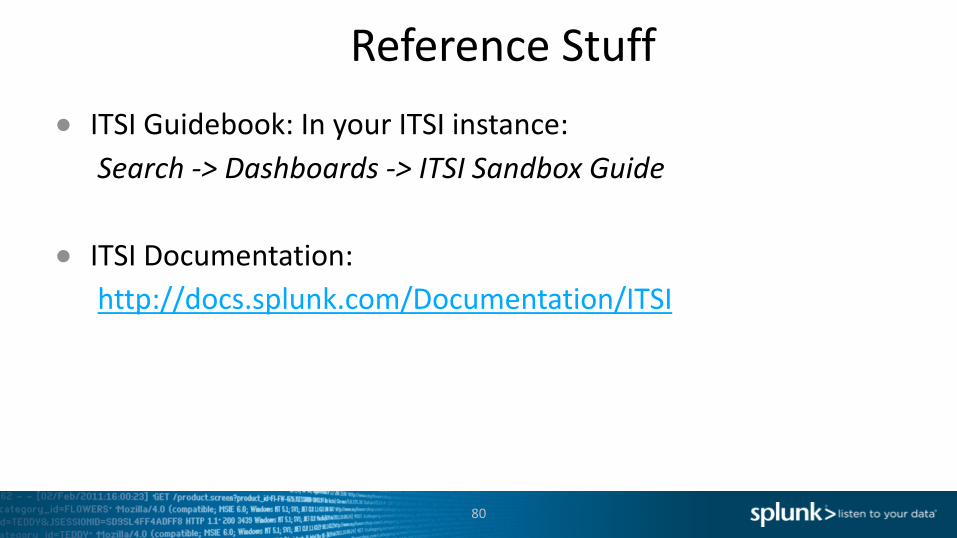
ReferenceStuff
80
● ITSIGuidebook:InyourITSIinstance:Search->Dashboards->ITSISandboxGuide
● ITSIDocumentation:http://docs.splunk.com/Documentation/ITSI
ThankYouPleasefillouttheSurveyhttps://www.surveymonkey.com/r/NBXBYCG