Embed Size (px)
Citation preview
Real-time pasture biomass
estimation
Mark Trotter, Karl Andersson, Andrew Robson, Derek Schneider, Ashley Saint, Lucy Frizell
Participant teams: Lewis Kahn, Paul Reynolds, Tony Butler, Brad Wooldridge, Chris Blore, Peter Schroder, Jim Shovelton,
Ian Gamble
B.GSM.0010, P4.18Real Time Pasture Biomass Estimation
Aims and whyWhat we’re doingSome resultsMobile appFuture directions
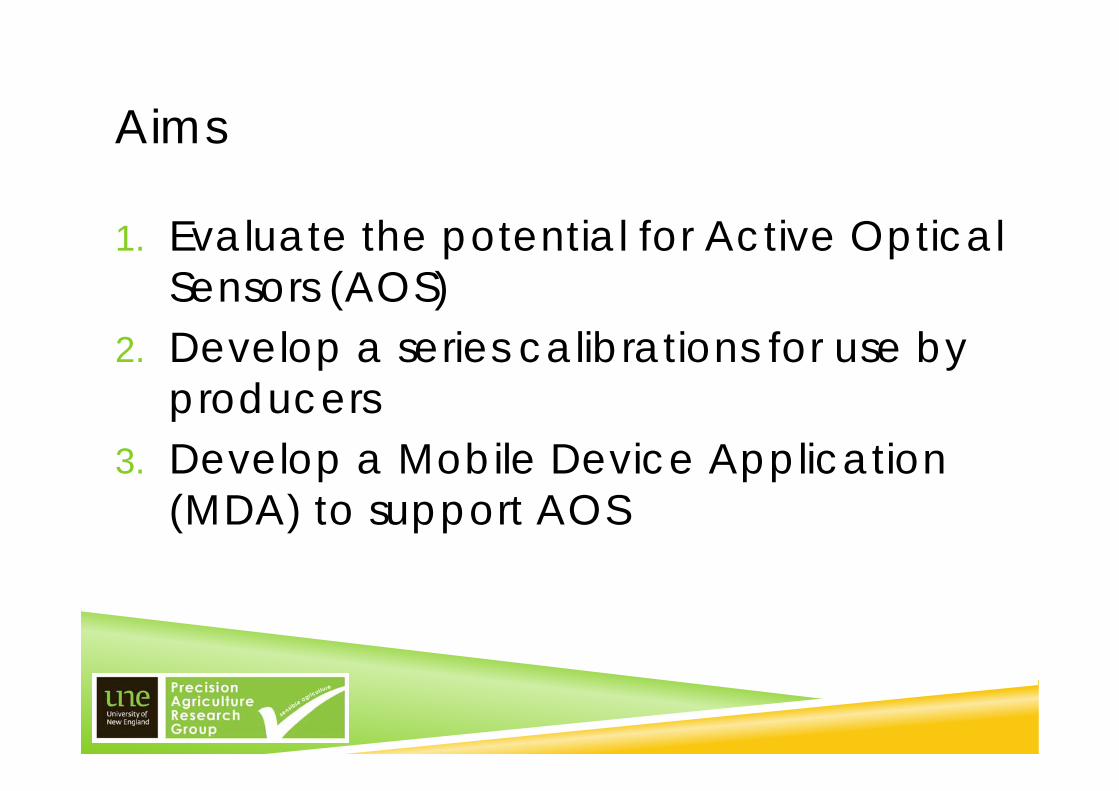
Aims
1. Evaluate the potential for Active Optical Sensors (AOS)
2. Develop a series calibrations for use by producers
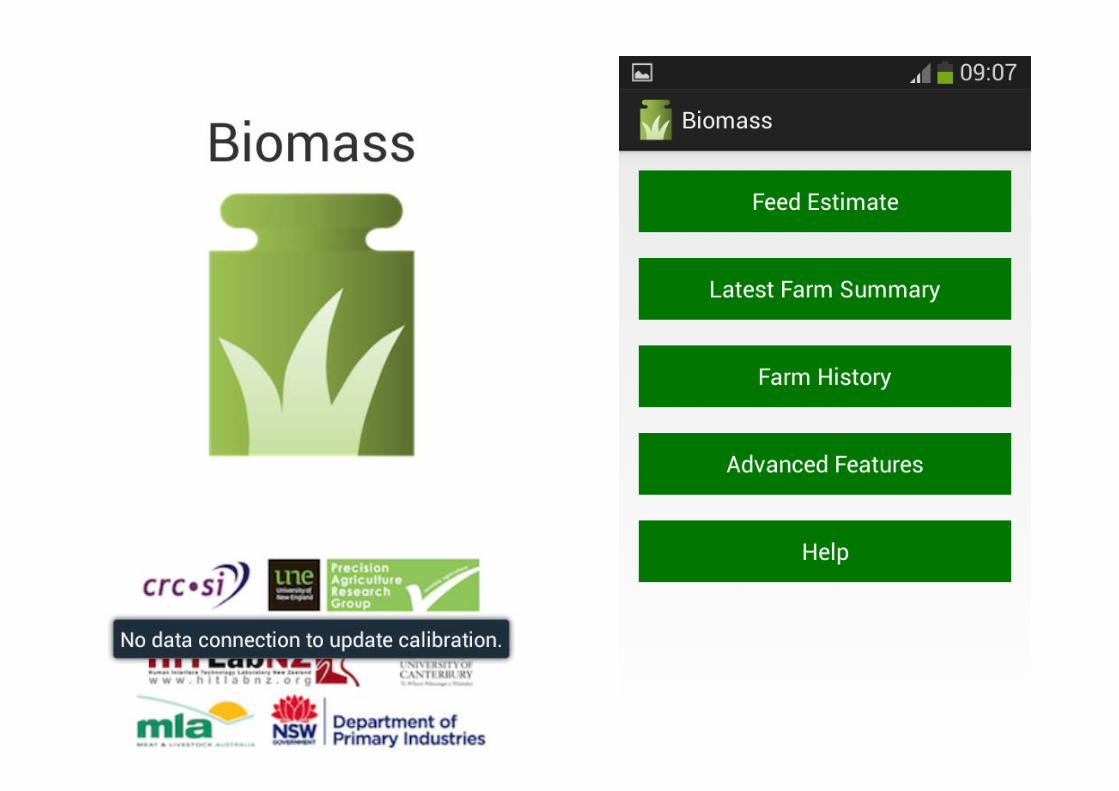
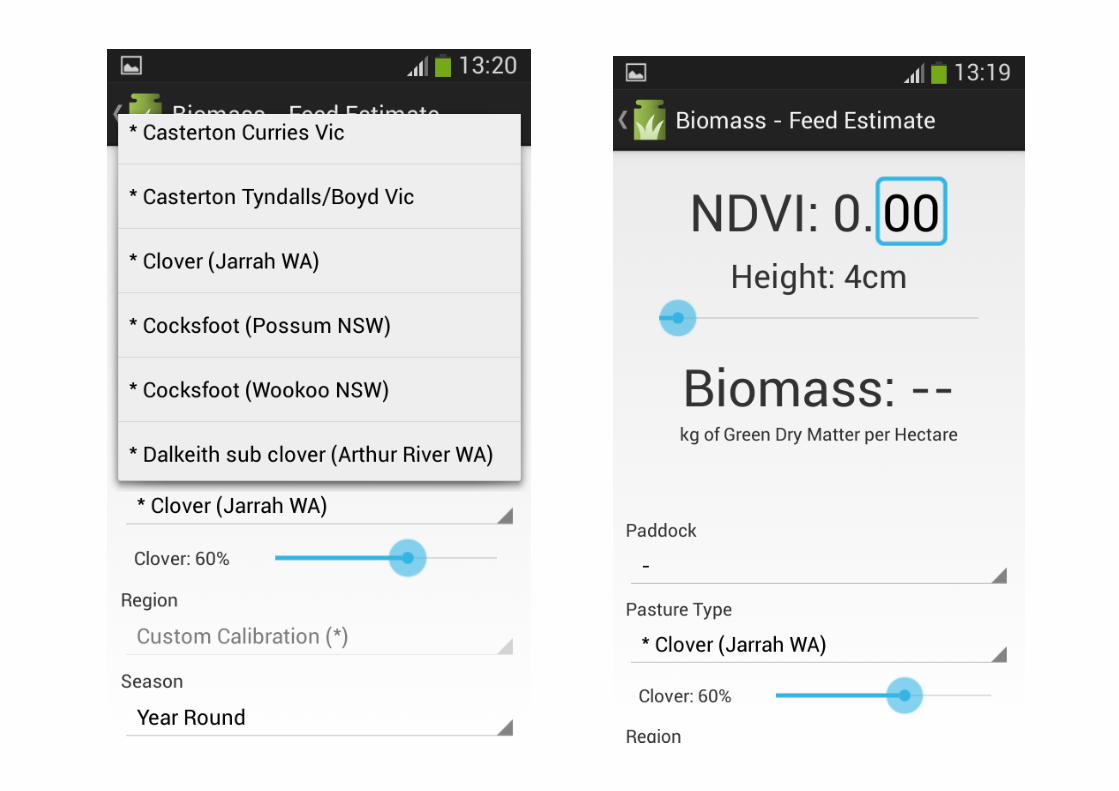
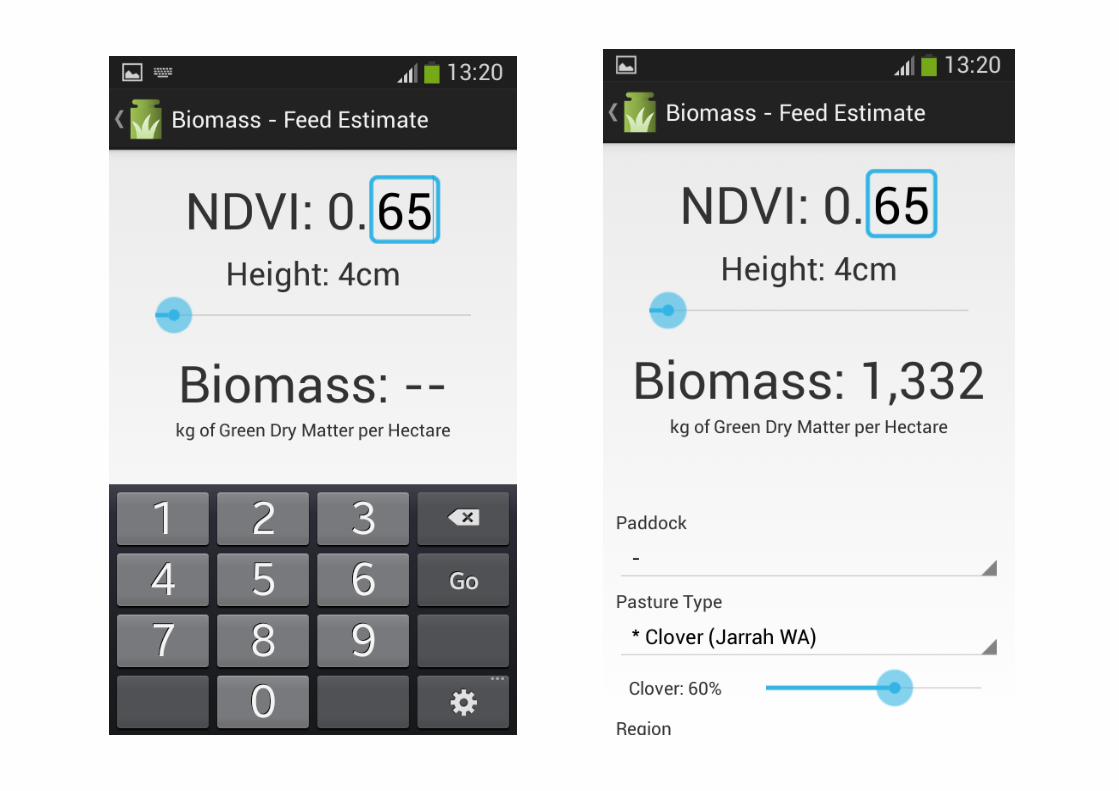
3. Develop a Mobile Device Application (MDA) to support AOS

Aims:
Current biomass
Growth rate
Paddock 963 23Black leg 750 21Plumb tree 894 25Parkers 675 11Parkers west 762 18Gumtree 1 1256 31Gumtree 2 1766 34
500
1000
1500
Export data
Why?
Pasture utilisationEstimate biomass compared to benchmarksHelp make objective decisions on stocking ratesCalibrate other methods (e.g. pastures from
space)
Why?Pasture utilisationHelp make objective decisions on stocking ratesEstimate biomass compared to benchmarksCalibrate other methods (e.g. pastures from space)
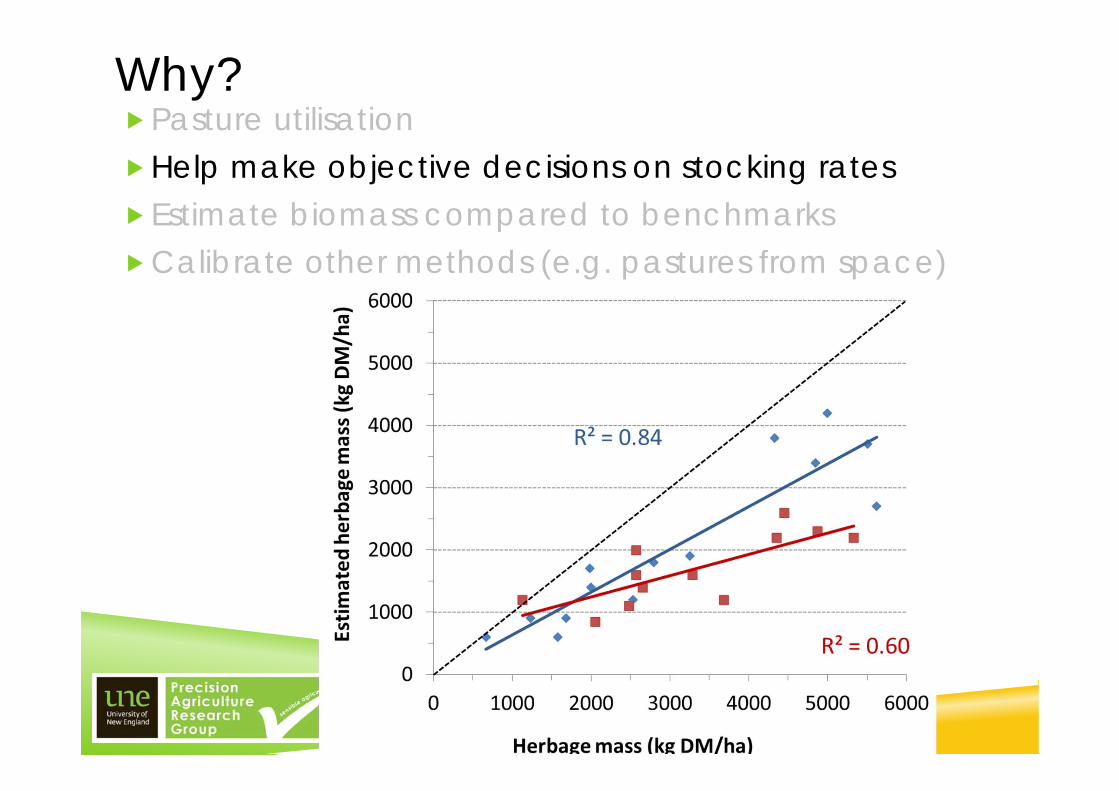
Why?Pasture utilisationHelp make objective decisions on stocking ratesEstimate biomass compared to benchmarksCalibrate other methods (e.g. pastures from space)
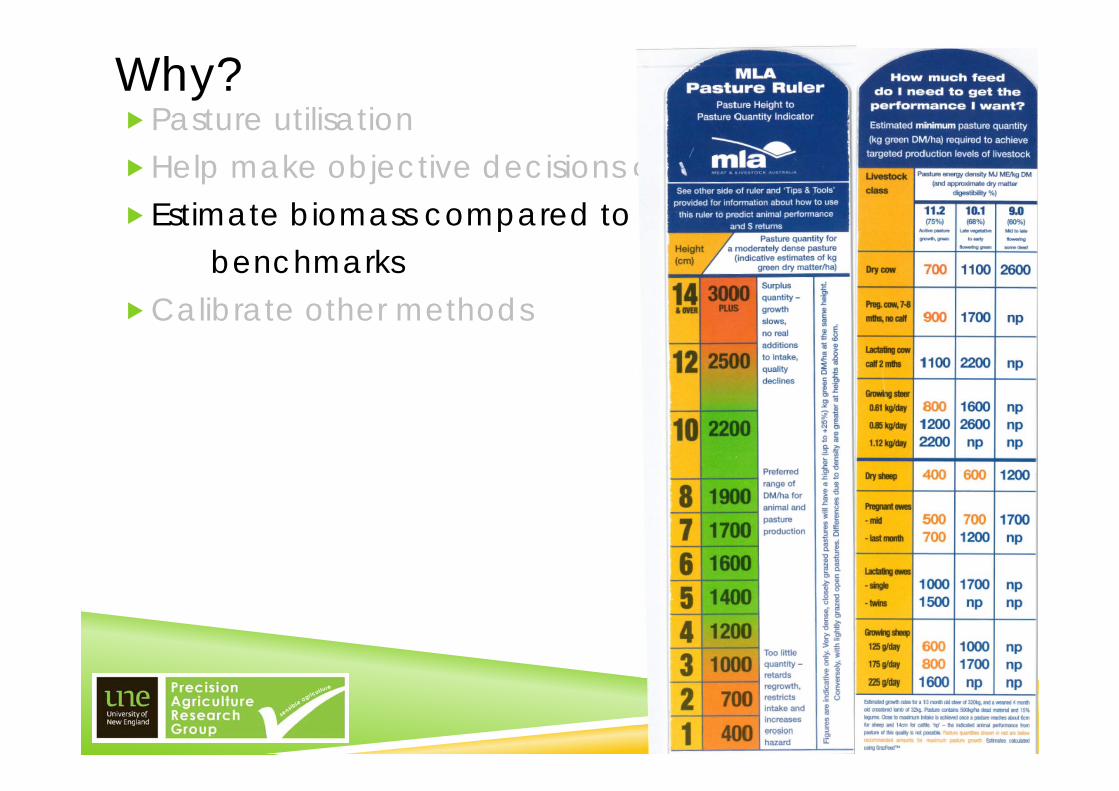
Why?Pasture utilisationHelp make objective decisions on stocking ratesEstimate biomass compared to
benchmarksCalibrate other methods
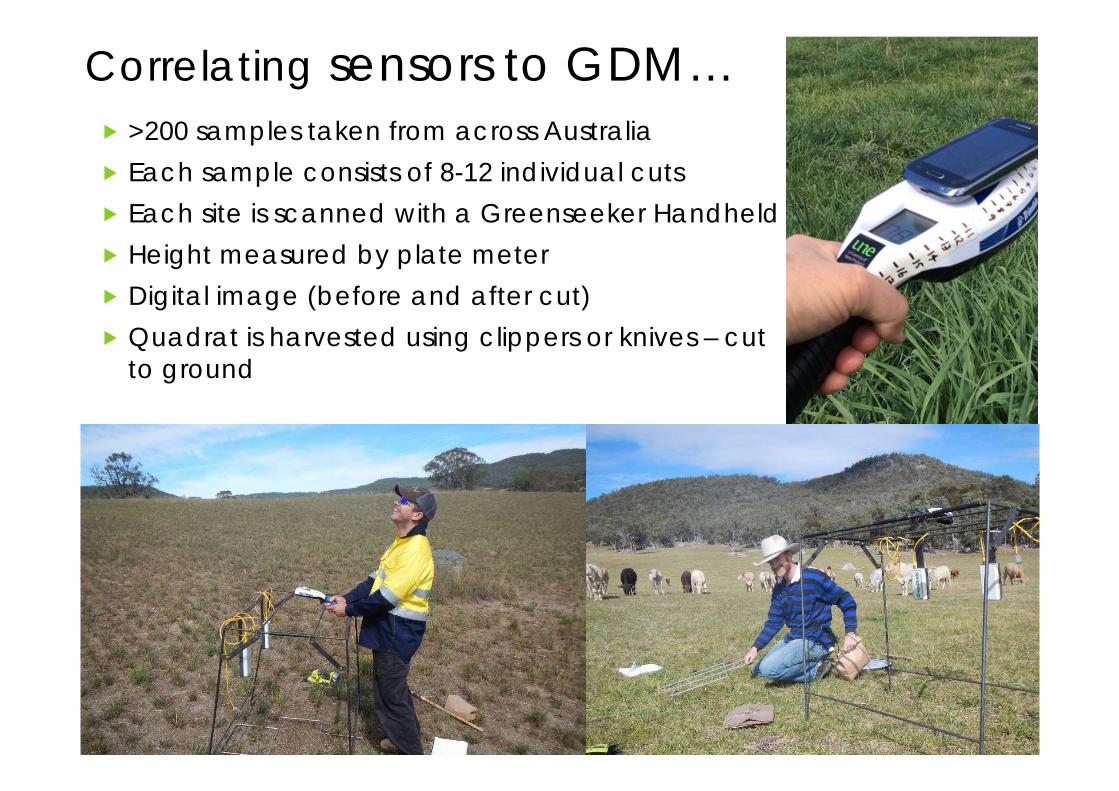
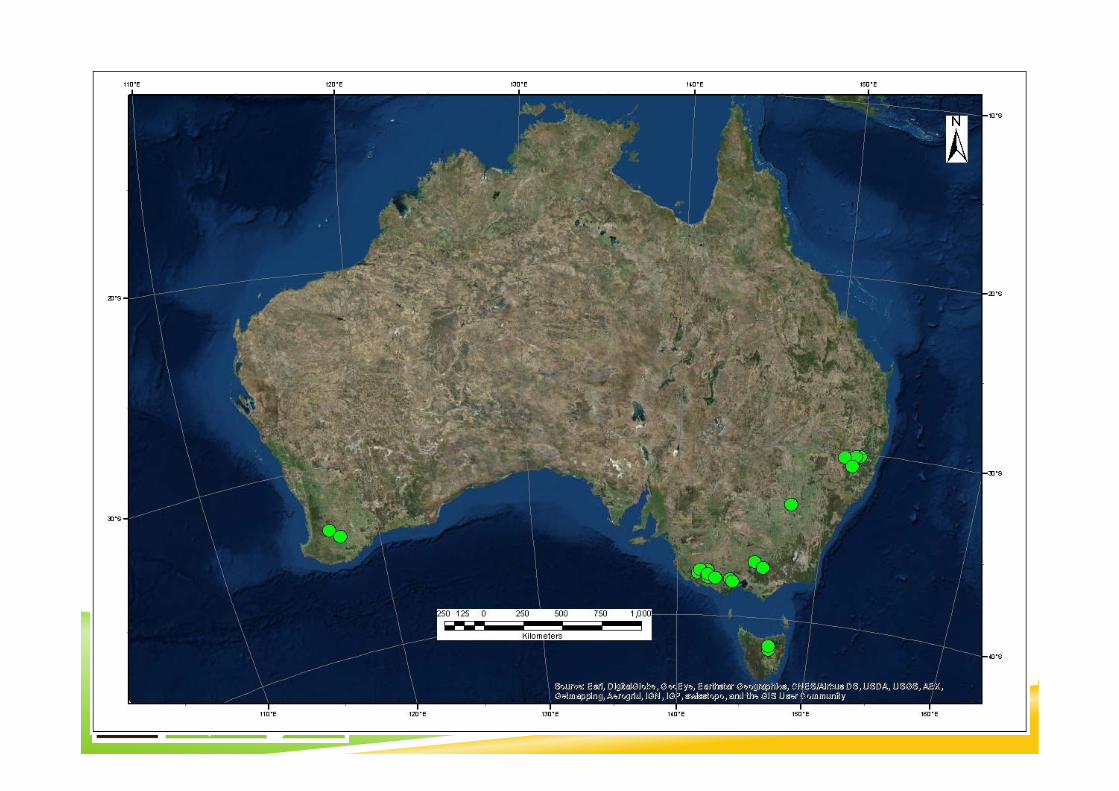
Correlating sensors to GDM… >200 samples taken from across Australia Each sample consists of 8-12 individual cuts Each site is scanned with a Greenseeker Handheld Height measured by plate meter Digital image (before and after cut) Quadrat is harvested using clippers or knives – cut
to ground
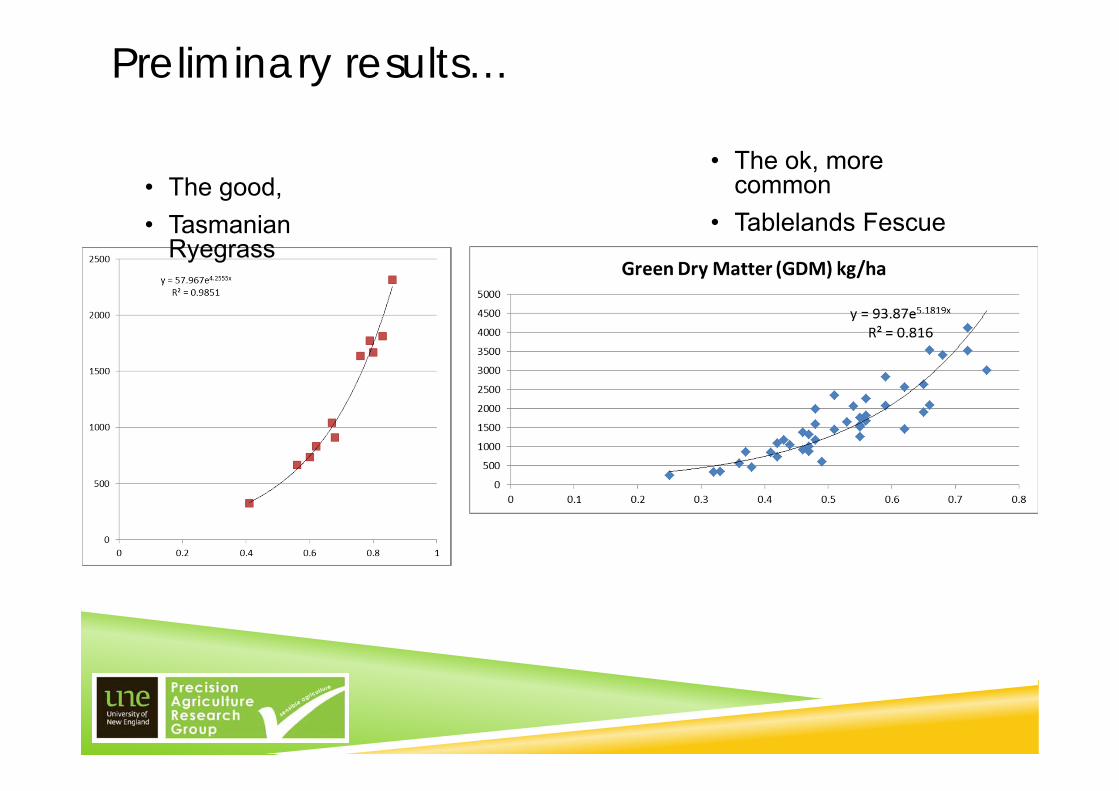
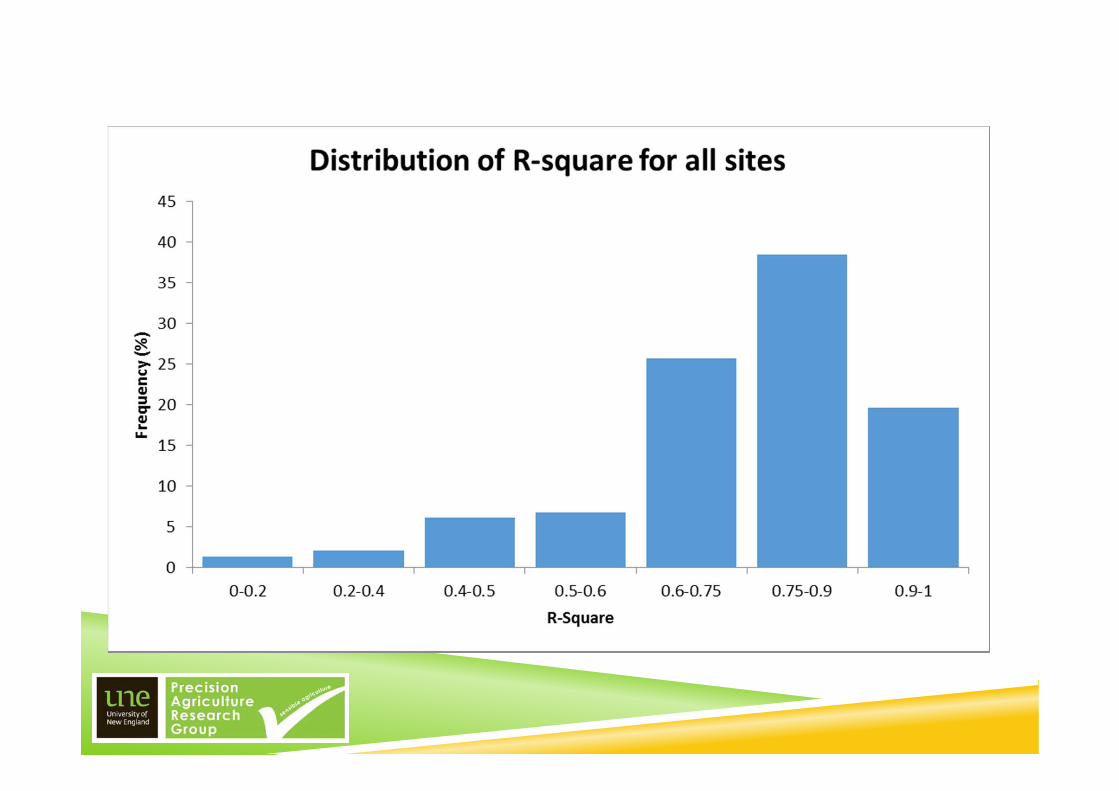
Preliminary results…
• The ok, more common
• Tablelands Fescue• The good,• Tasmanian
Ryegrass
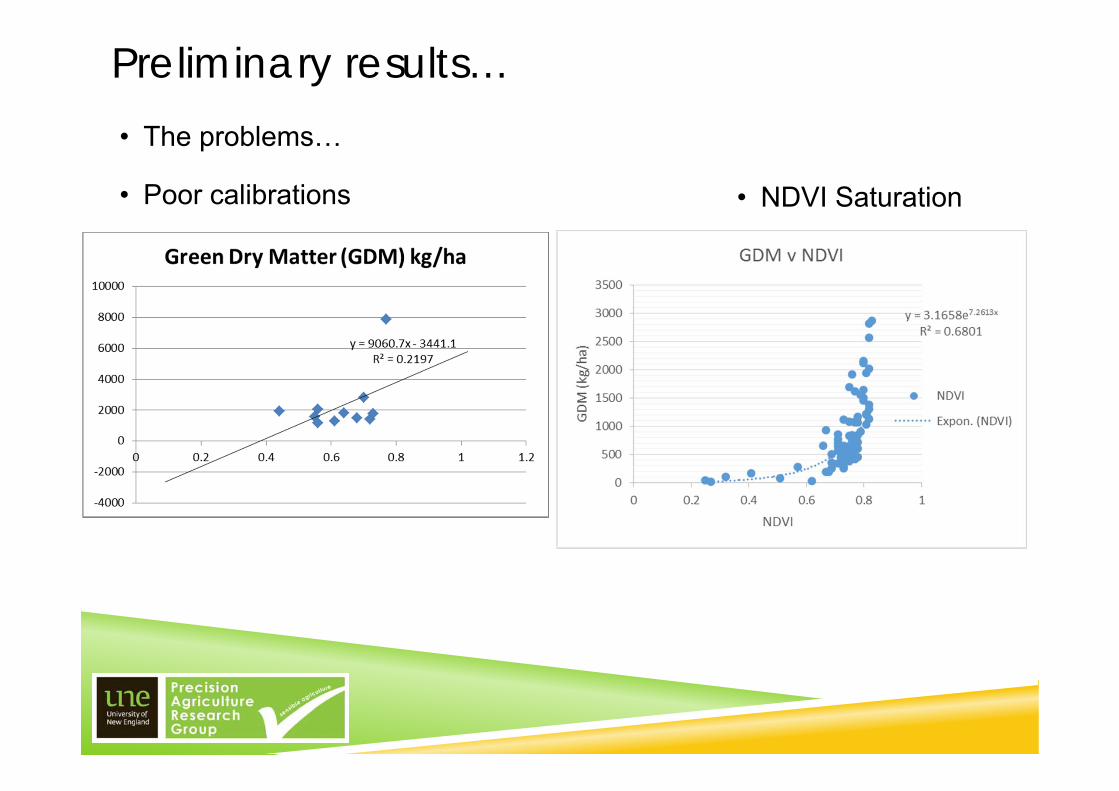
Preliminary results…• The problems…
• Poor calibrations • NDVI Saturation
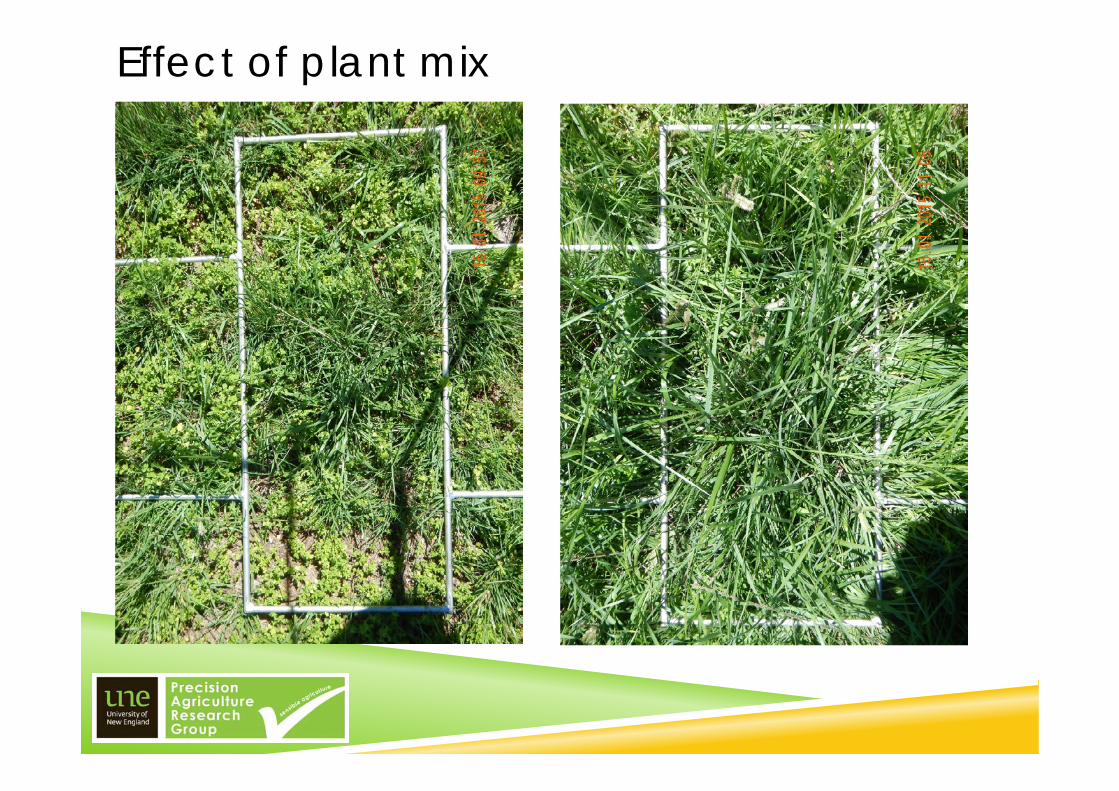
Effect of plant mix
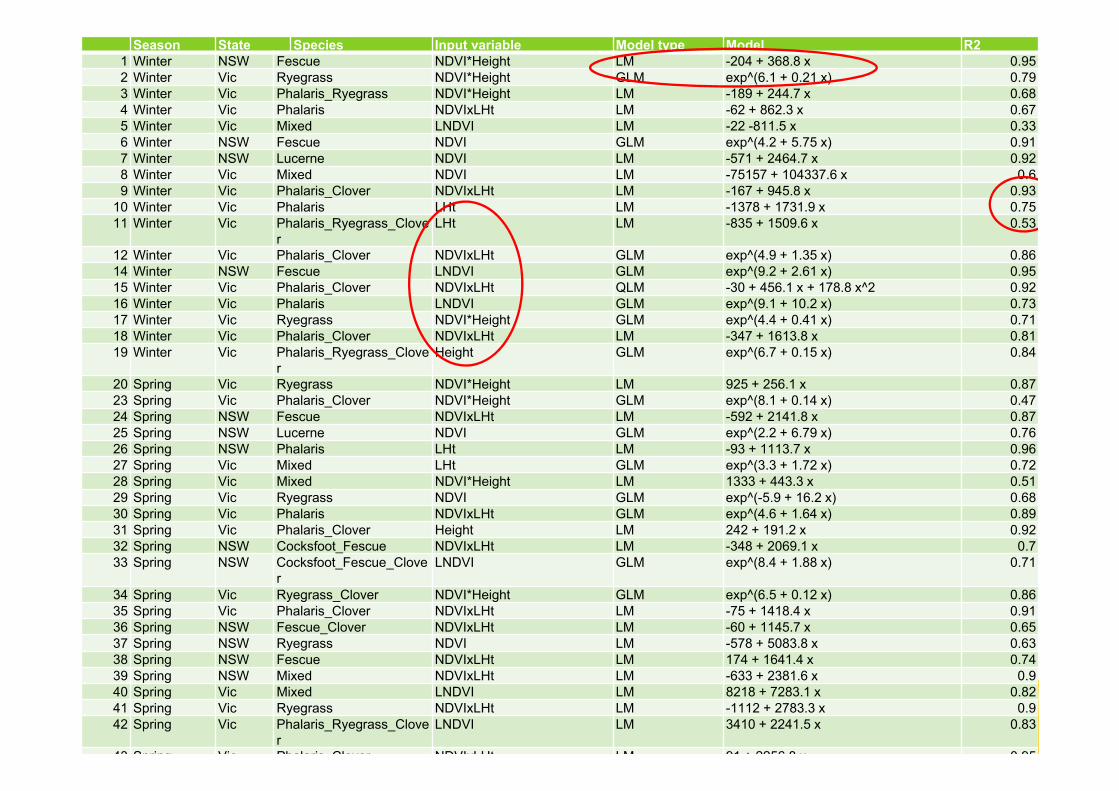
Season State Species Input variable Model type Model R21 Winter NSW Fescue NDVI*Height LM -204 + 368.8 x 0.952 Winter Vic Ryegrass NDVI*Height GLM exp^(6.1 + 0.21 x) 0.793 Winter Vic Phalaris_Ryegrass NDVI*Height LM -189 + 244.7 x 0.684 Winter Vic Phalaris NDVIxLHt LM -62 + 862.3 x 0.675 Winter Vic Mixed LNDVI LM -22 -811.5 x 0.336 Winter NSW Fescue NDVI GLM exp^(4.2 + 5.75 x) 0.917 Winter NSW Lucerne NDVI LM -571 + 2464.7 x 0.928 Winter Vic Mixed NDVI LM -75157 + 104337.6 x 0.69 Winter Vic Phalaris_Clover NDVIxLHt LM -167 + 945.8 x 0.93
10 Winter Vic Phalaris LHt LM -1378 + 1731.9 x 0.7511 Winter Vic Phalaris_Ryegrass_Clove
rLHt LM -835 + 1509.6 x 0.53
12 Winter Vic Phalaris_Clover NDVIxLHt GLM exp^(4.9 + 1.35 x) 0.8614 Winter NSW Fescue LNDVI GLM exp^(9.2 + 2.61 x) 0.9515 Winter Vic Phalaris_Clover NDVIxLHt QLM -30 + 456.1 x + 178.8 x^2 0.9216 Winter Vic Phalaris LNDVI GLM exp^(9.1 + 10.2 x) 0.7317 Winter Vic Ryegrass NDVI*Height GLM exp^(4.4 + 0.41 x) 0.7118 Winter Vic Phalaris_Clover NDVIxLHt LM -347 + 1613.8 x 0.8119 Winter Vic Phalaris_Ryegrass_Clove
rHeight GLM exp^(6.7 + 0.15 x) 0.84
20 Spring Vic Ryegrass NDVI*Height LM 925 + 256.1 x 0.8723 Spring Vic Phalaris_Clover NDVI*Height GLM exp^(8.1 + 0.14 x) 0.4724 Spring NSW Fescue NDVIxLHt LM -592 + 2141.8 x 0.8725 Spring NSW Lucerne NDVI GLM exp^(2.2 + 6.79 x) 0.7626 Spring NSW Phalaris LHt LM -93 + 1113.7 x 0.9627 Spring Vic Mixed LHt GLM exp^(3.3 + 1.72 x) 0.7228 Spring Vic Mixed NDVI*Height LM 1333 + 443.3 x 0.5129 Spring Vic Ryegrass NDVI GLM exp^(-5.9 + 16.2 x) 0.6830 Spring Vic Phalaris NDVIxLHt GLM exp^(4.6 + 1.64 x) 0.8931 Spring Vic Phalaris_Clover Height LM 242 + 191.2 x 0.9232 Spring NSW Cocksfoot_Fescue NDVIxLHt LM -348 + 2069.1 x 0.733 Spring NSW Cocksfoot_Fescue_Clove
rLNDVI GLM exp^(8.4 + 1.88 x) 0.71
34 Spring Vic Ryegrass_Clover NDVI*Height GLM exp^(6.5 + 0.12 x) 0.8635 Spring Vic Phalaris_Clover NDVIxLHt LM -75 + 1418.4 x 0.9136 Spring NSW Fescue_Clover NDVIxLHt LM -60 + 1145.7 x 0.6537 Spring NSW Ryegrass NDVI LM -578 + 5083.8 x 0.6338 Spring NSW Fescue NDVIxLHt LM 174 + 1641.4 x 0.7439 Spring NSW Mixed NDVIxLHt LM -633 + 2381.6 x 0.940 Spring Vic Mixed LNDVI LM 8218 + 7283.1 x 0.8241 Spring Vic Ryegrass NDVIxLHt LM -1112 + 2783.3 x 0.942 Spring Vic Phalaris_Ryegrass_Clove
rLNDVI LM 3410 + 2241.5 x 0.83
43 Spring Vic Phalaris Clover NDVIxLHt LM 91 + 2256 8 x 0 95
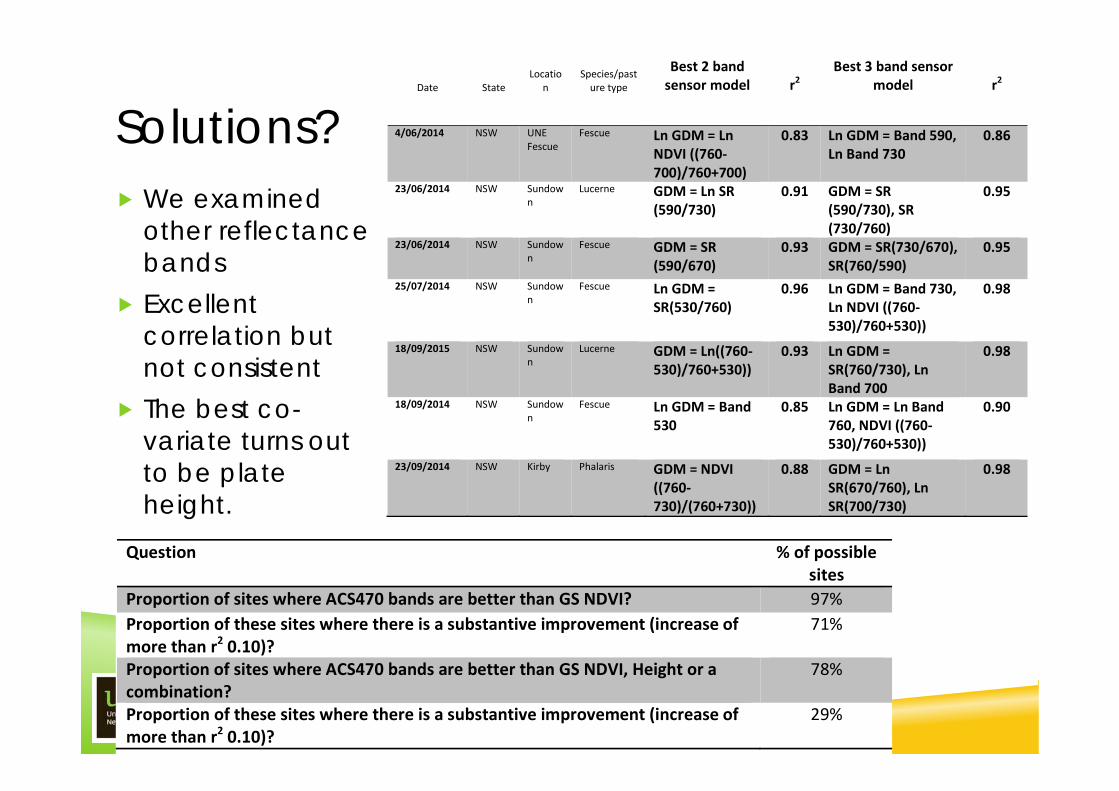
Solutions? We examined
other reflectance bands
Excellent correlation but not consistent
The best co-variate turns out to be plate height.
Question % of possible sites
Proportion of sites where ACS470 bands are better than GS NDVI? 97%Proportion of these sites where there is a substantive improvement (increase of more than r2 0.10)?
71%
Proportion of sites where ACS470 bands are better than GS NDVI, Height or a combination?
78%
Proportion of these sites where there is a substantive improvement (increase of more than r2 0.10)?
29%
Date State Locatio
n Species/pasture type
Best 2 band sensor model r2
Best 3 band sensor model r2
4/06/2014 NSW UNE Fescue
Fescue Ln GDM = Ln NDVI ((760‐700)/760+700)
0.83 Ln GDM = Band 590, Ln Band 730
0.86
23/06/2014 NSW Sundown
Lucerne GDM = Ln SR (590/730)
0.91 GDM = SR (590/730), SR (730/760)
0.95
23/06/2014 NSW Sundown
Fescue GDM = SR (590/670)
0.93 GDM = SR(730/670), SR(760/590)
0.95
25/07/2014 NSW Sundown
Fescue Ln GDM = SR(530/760)
0.96 Ln GDM = Band 730, Ln NDVI ((760‐530)/760+530))
0.98
18/09/2015 NSW Sundown
Lucerne GDM = Ln((760‐530)/760+530))
0.93 Ln GDM = SR(760/730), Ln Band 700
0.98
18/09/2014 NSW Sundown
Fescue Ln GDM = Band 530
0.85 Ln GDM = Ln Band 760, NDVI ((760‐530)/760+530))
0.90
23/09/2014 NSW Kirby Phalaris GDM = NDVI ((760‐730)/(760+730))
0.88 GDM = Ln SR(670/760), Ln SR(700/730)
0.98
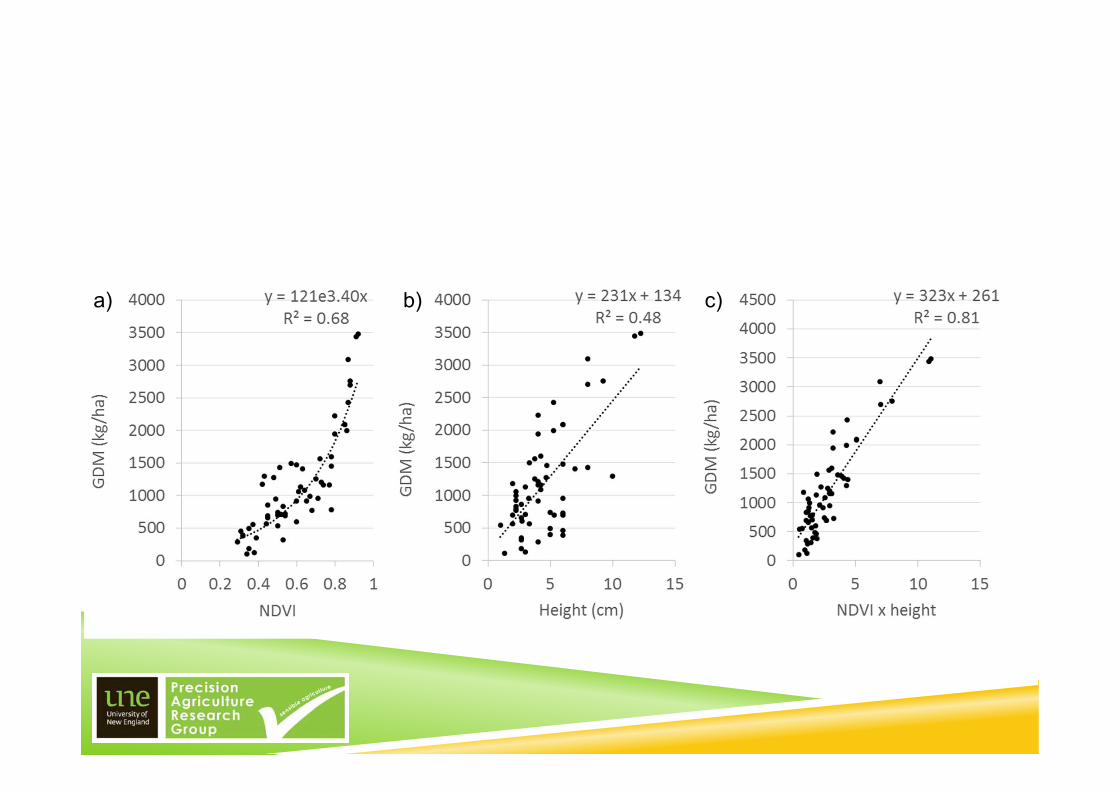
a) b) c)
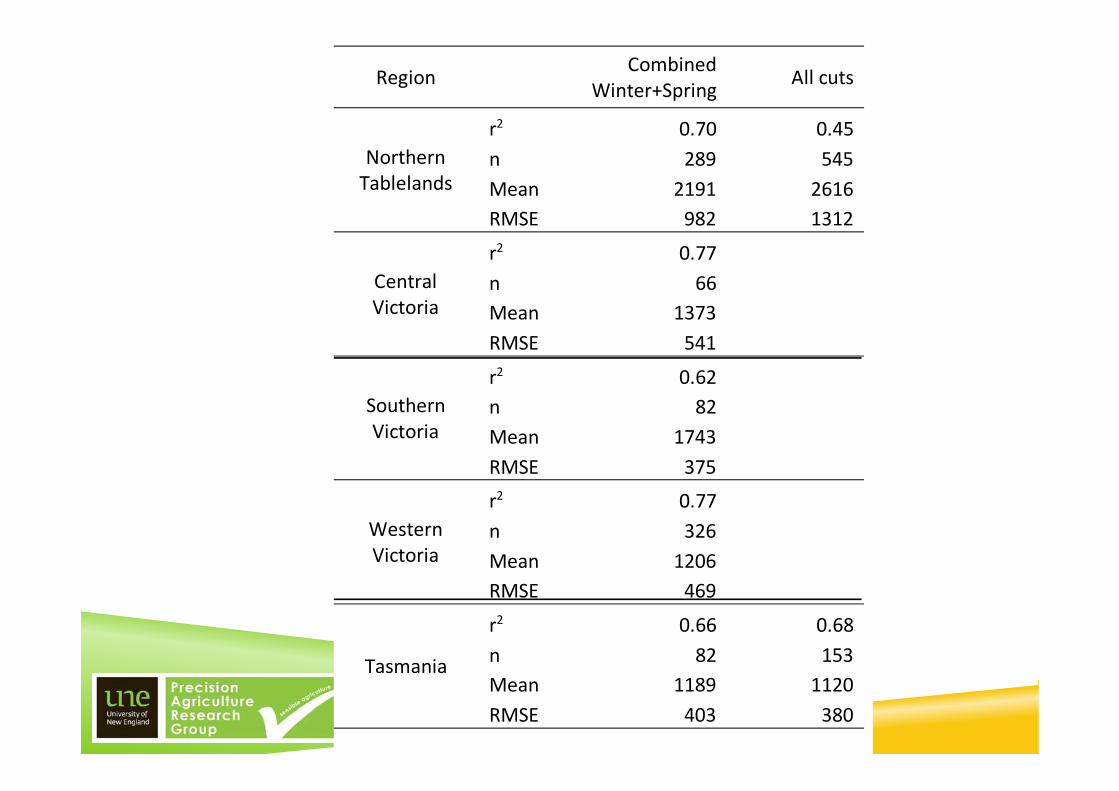
Region Combined Winter+Spring All cuts
Northern Tablelands
r2 0.70 0.45n 289 545Mean 2191 2616RMSE 982 1312
Central Victoria
r2 0.77 n 66Mean 1373RMSE 541
Southern Victoria
r2 0.62 n 82Mean 1743RMSE 375
Western Victoria
r2 0.77 n 326Mean 1206RMSE 469
Tasmania
r2 0.66 0.68n 82 153Mean 1189 1120RMSE 403 380
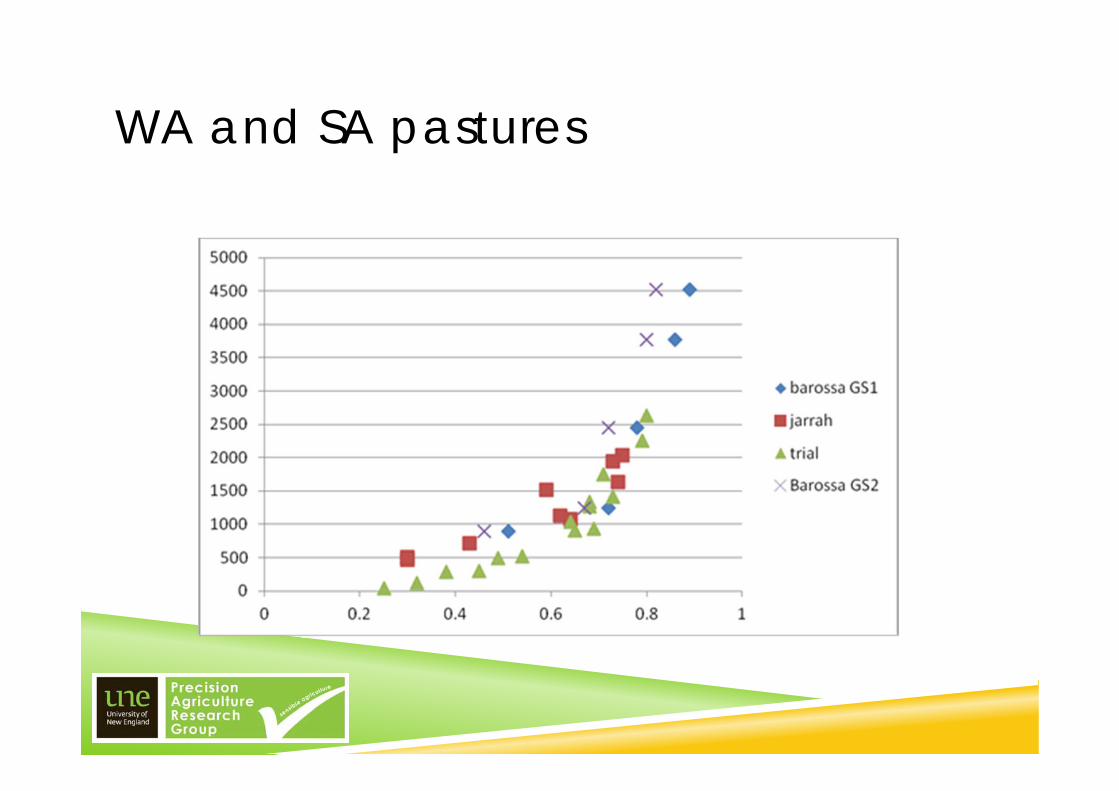
WA and SA pastures
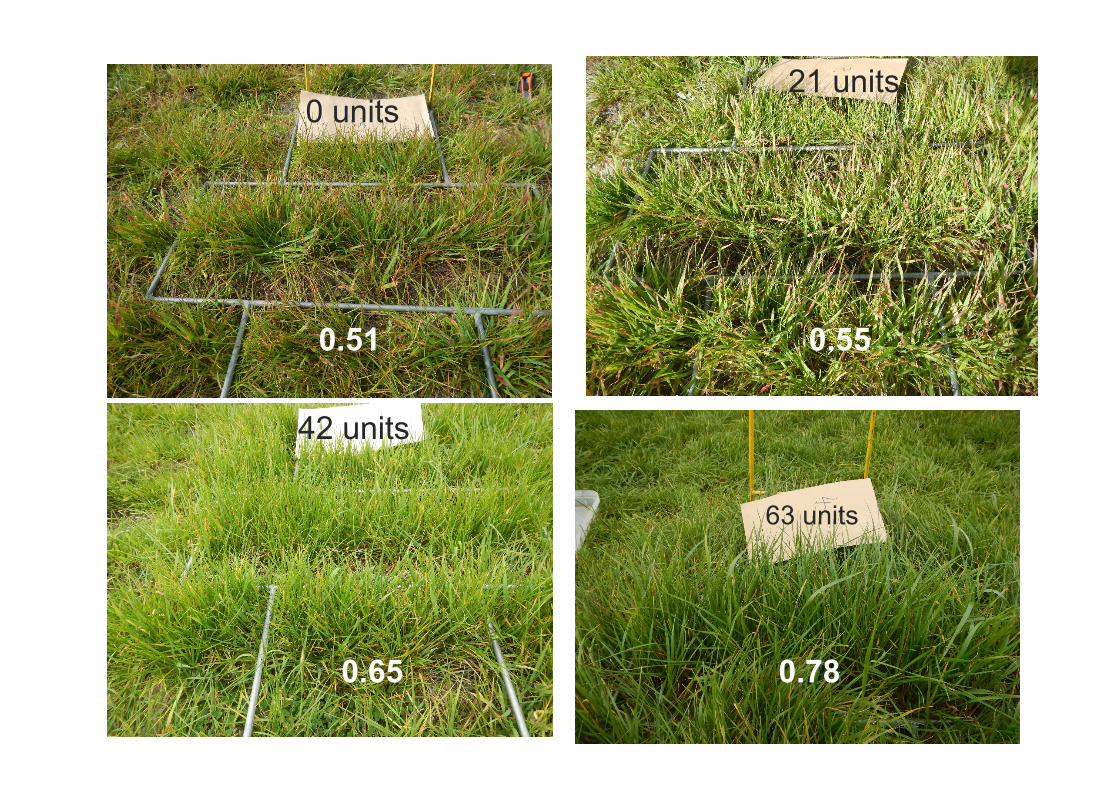
0 units21 units
42 units
63 units
0.51 0.55
0.65 0.78
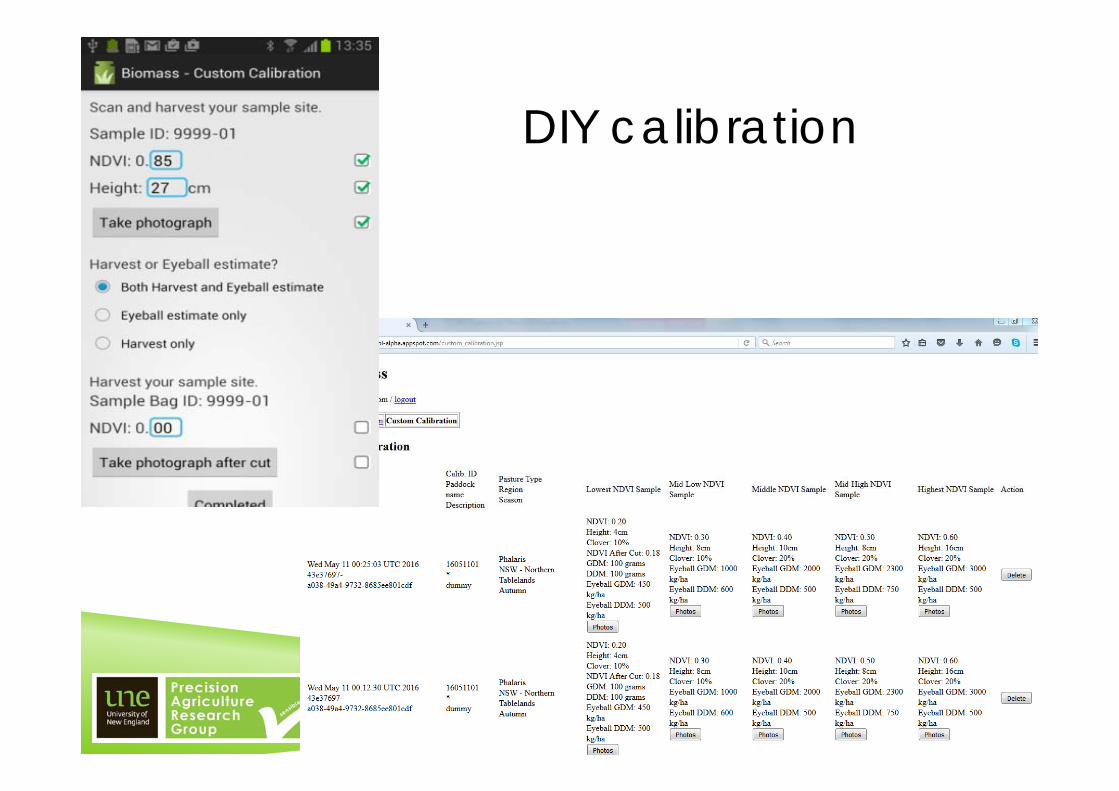
DIY calibration
Where to from here?
Integrate with weather and satellite data Integrate with LiDAR Integration with feed budgeting/stocking rate software Quality and pasture growth rates
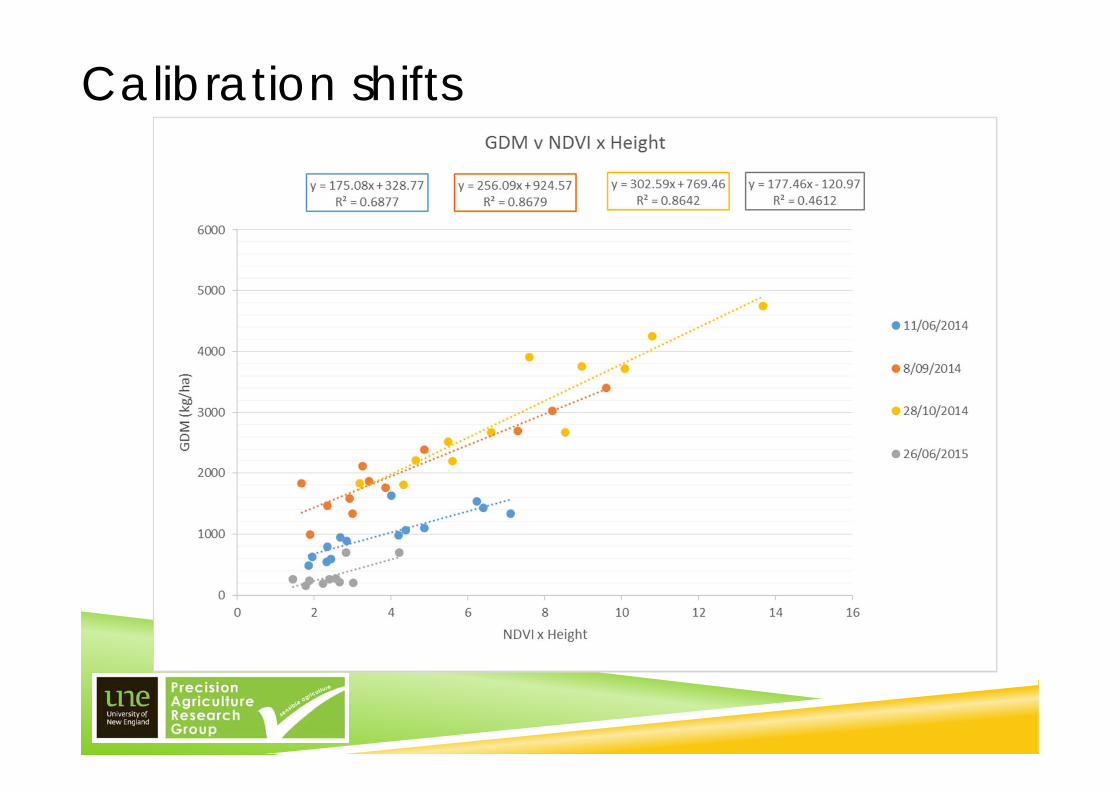
Calibration shifts
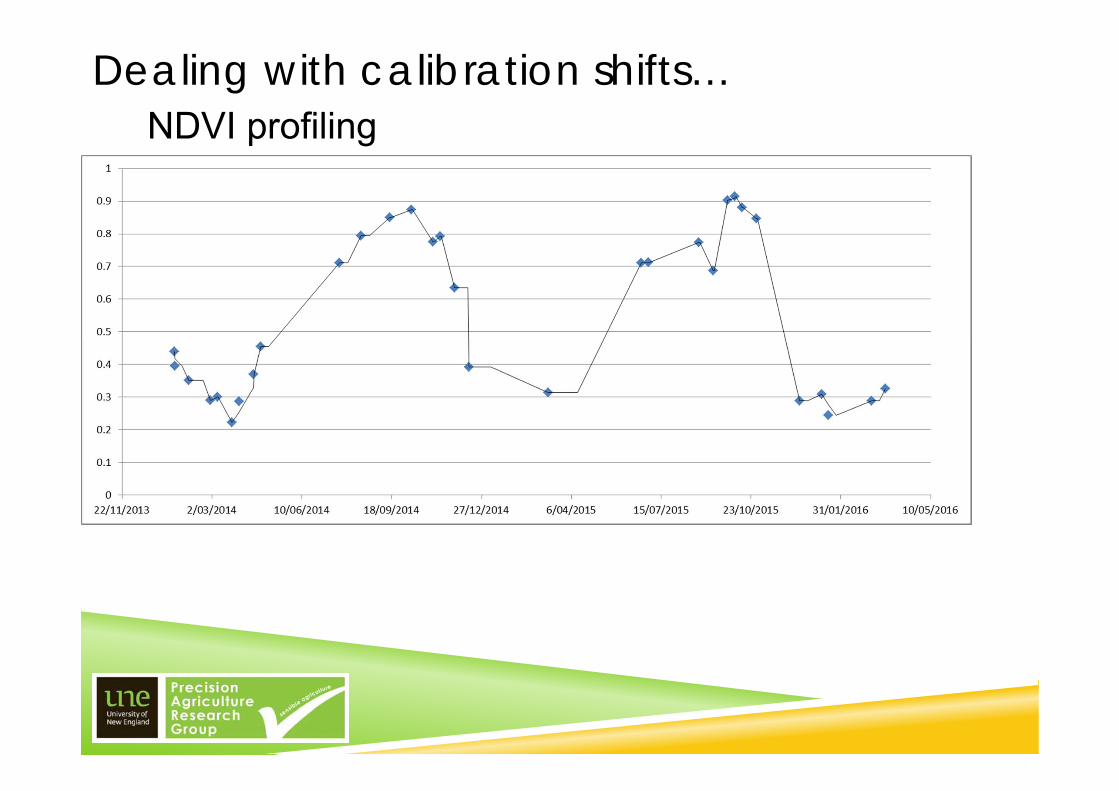
Dealing with calibration shifts…NDVI profiling
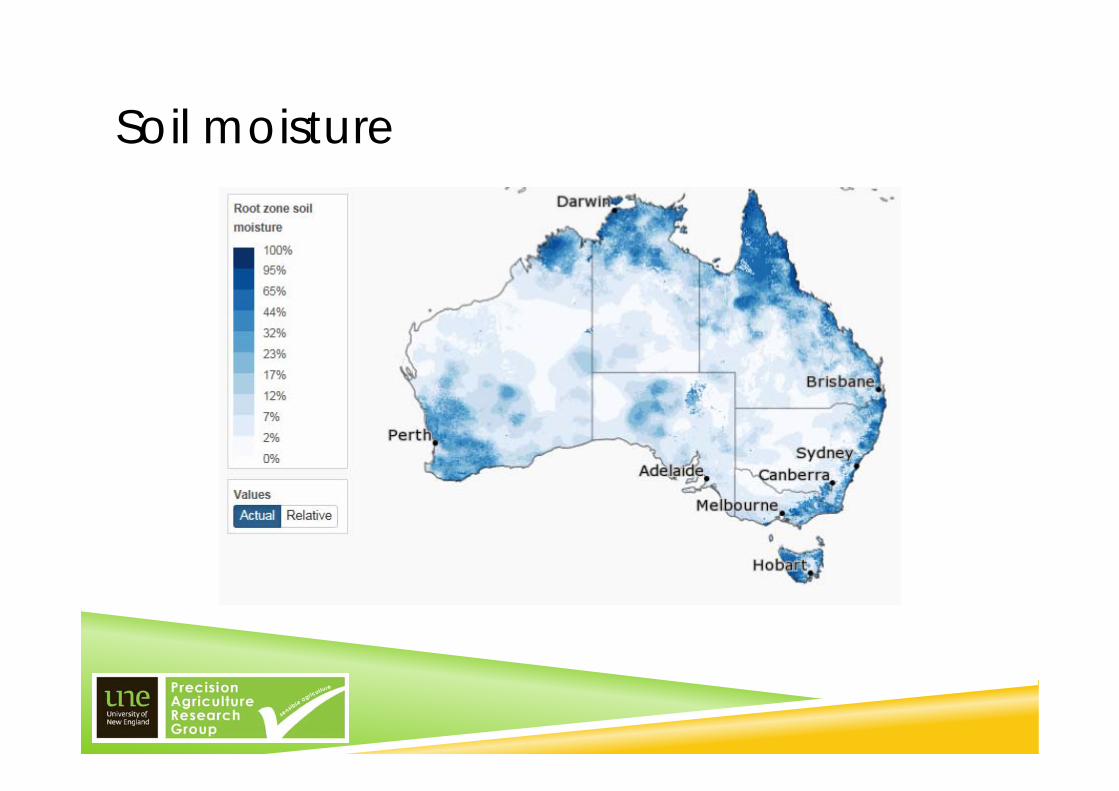
Soil moisture
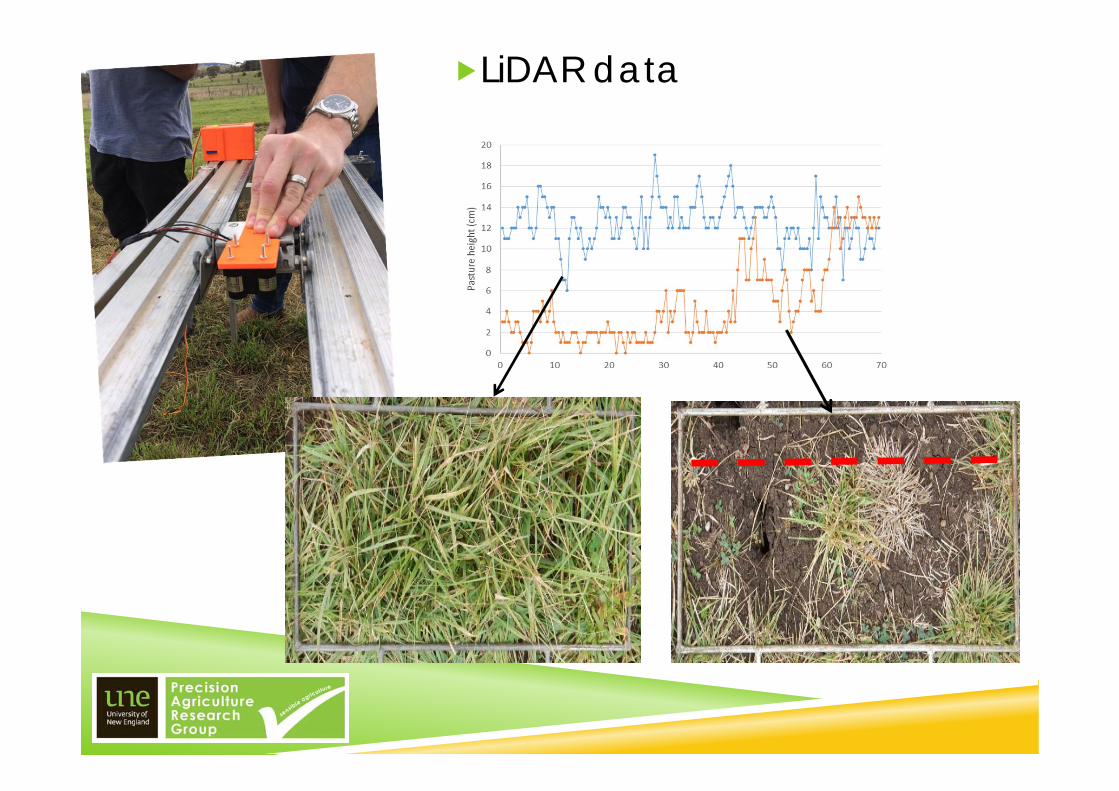
LiDAR data
Lidar data
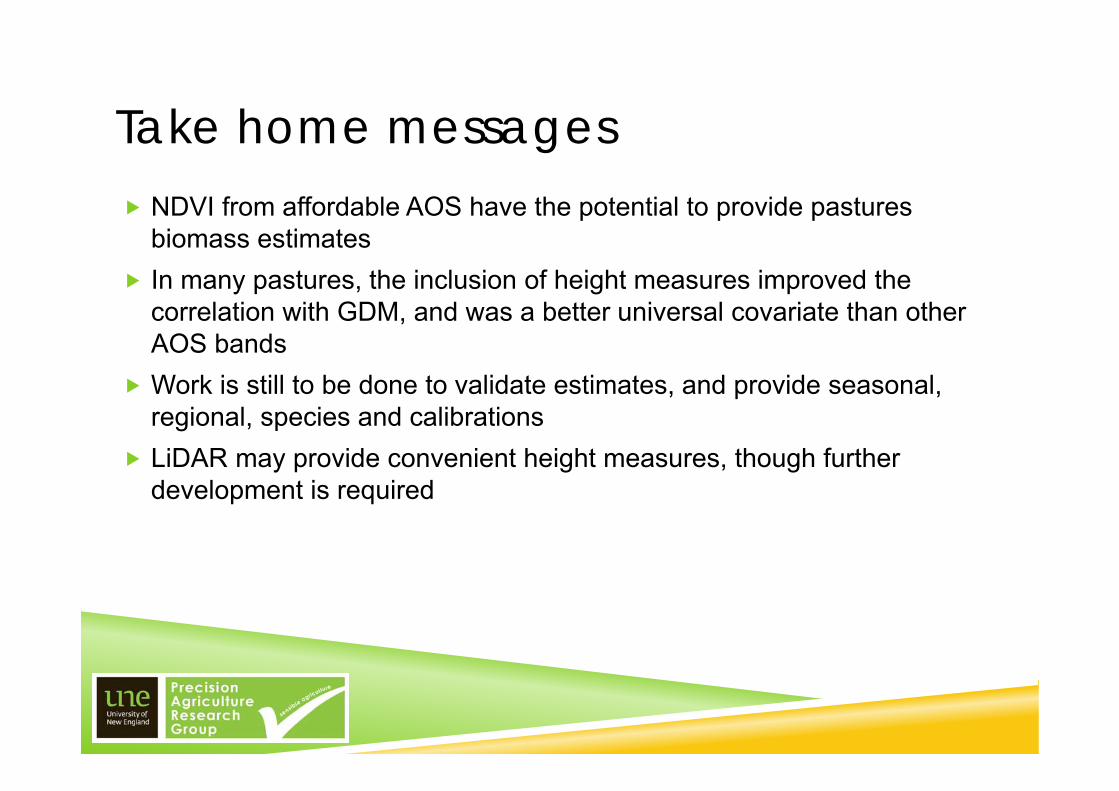
Take home messages NDVI from affordable AOS have the potential to provide pastures
biomass estimates In many pastures, the inclusion of height measures improved the
correlation with GDM, and was a better universal covariate than other AOS bands
Work is still to be done to validate estimates, and provide seasonal, regional, species and calibrations
LiDAR may provide convenient height measures, though further development is required


![On Access Network Selection/5079158[1].pdf · 2010-11-18 · On Access Network Selection Models and Mobility Support in Heterogeneous Wireless Networks Karl Andersson Mobile Systems](https://img.pdfslide.us/doc/110x75/5e8b915227c9fd00244d34da/on-access-network-selection-50791581pdf-2010-11-18-on-access-network-selection.jpg)