Embed Size (px)
Citation preview
February 2011
MANAGEMENT BRIEF
International Technology Group 4546 El Camino Real, Suite 230
Los Altos, California 94022-1069 Telephone: (650) 949-8410 Facsimile: (650) 949-8415 Email: [email protected]
ITG
Value Proposition for IBM POWER7 Based Systems
x86 Server Consolidation in SAP Enterprise Environments

Copyright © 2011 by the International Technology Group. All rights reserved. Material, in whole or part, contained in this document may not be reproduced or distributed by any means or in any form, including original, without the prior written permission of the International Technology Group (ITG). Information has been obtained from sources assumed to be reliable and reflects conclusions at the time. This document was developed with International Business Machines Corporation (IBM) funding. Although the document may utilize publicly available material from various sources, including IBM, it does not necessarily reflect the positions of such sources on the issues addressed in this document. Material contained and conclusions presented in this document are subject to change without notice. All warranties as to the accuracy, completeness or adequacy of such material are disclaimed. There shall be no liability for errors, omissions or inadequacies in the material contained in this document or for interpretations thereof. Trademarks included in this document are the property of their respective owners.
International Technology Group 1
TABLE OF CONTENTS EXECUTIVE SUMMARY 1
Consolidation Drivers 1 Consolidation Economics 1 Infrastructure Value 3 Conclusions 4
CHALLENGES AND SOLUTIONS 6 Consolidation Challenges 6
General Picture 6 Size and Complexity 6 Growth 7
Evaluating Platforms 8 Power Systems 8
General Picture 8 Virtualization and Workload Management 9 New Capabilities 10
x86 and VMware 11 Deployment Patterns 11 Scalability Issues 12 Other Limitations 13
Availability Optimization 13 Power Systems 13 AIX Software 15 x86 Environments 16
DETAILED DATA 17 Installations 17 IT Costs 18
Basis of Calculations 18 Cost Breakdowns 19
Costs of Downtime 20
List of Figures 1. Three-year x86 and Power Server Costs for Consolidated SAP Deployments 2 2. Three-year Costs of Downtime for Consolidated SAP Deployments 4 3. Approaches to Supporting Large Complex SAP Workloads 5 4. SAP Instances: Midsize User Example 7 5. Comparative SAP SD 2-tier Performance per Core:
POWER7 Based and Intel X7560-based Servers (SAPS) 9 6. Recent SAP SD Benchmark Results With and Without VMware 13 7. Key POWER7 Availability Optimization Technologies 14 8. Key AIX 7.1 Availability Optimization Features 15 9. Installations Summary 17 10. Three-year IT Cost Breakdowns 19
International Technology Group 1
EXECUTIVE SUMMARY
Consolidation Drivers When it was introduced in 2001, SAP R/3 4.6 contained around 80 million lines of code. By 2006, SAP was quoting 270 million lines of code, and with the introduction of Business Suite 7 in 2009, the total reached 392 million. Lines of code continue to grow. With add-ons, complementary applications and customization, even midsize SAP installations may run from 500 million to a billion lines of code.
Complex middleware, double-digit growth in databases and workloads, and increasingly diverse software technologies and system processes magnify the challenges of supporting such environments. Higher levels of integration, acceleration of business processes and moves toward “real-time” practices magnify them further.
SAP versions, application portfolios and process structures vary widely between organizations. However, for most if not all SAP users, it is clear that the demands placed on underlying server, storage and network infrastructures will continue to expand for the foreseeable future.
How will these challenges be met? For a growing number of SAP users, part of the answer – in many cases, a large part of the answer – is to consolidate servers. The cost savings, gains in infrastructure scalability and flexibility, and improvements in quality of service that may be realized through consolidation have appealed to SAP users of all sizes, in all industries.
Consolidation of UNIX platforms has been under way for more than a decade, and there has been growing interest in x86 server initiatives. The latest generation of Intel Nehalem EX Xeon 7500 and 5600 processors series and Advanced Micro Devices (AMD) equivalents has significantly increased x86 server performance, and VMware and other x86 virtualization tools have also grown more sophisticated.
The combination of powerful, inexpensive x86 hardware and virtualization appears to offer a compelling value proposition. Use of these, it is argued, represents the most cost-effective means of realizing x86 server consolidation.
But appearances can be deceptive.
SAP systems are among the most demanding environments that may be deployed on any server platform. However, consolidation challenges are greater, and cost structures more complex than for most other applications. UNIX system capabilities may realize economies that exceed – often by wide margins – those that are possible with even the most advanced x86 servers and virtualization tools.
This is particularly the case for the latest generation of IBM POWER7 based systems. In comparisons presented in this report, three-year IT costs in organizations consolidating x86 Windows and Linux servers to POWER7 based systems range from 14 percent to 46 percent less, and average 39 percent less than for use of Intel Xeon 7500-based servers and VMware vSphere 4.
Consolidation Economics Where can hard data on SAP server consolidation be obtained? A great deal of information is available on the subject, but its usefulness varies widely.
For example, SAP SD two-tier benchmarks may be employed to measure the performance of servers executing standardized workloads, but provide less insight into how well platforms will perform with concurrent mixed workloads, particularly when these are virtualized. Moreover, real production environments tend to be a great deal more complex and less predictable.
International Technology Group 2
Equally, vendor collateral such as case studies, surveys and internal test results are often selective, and total cost of ownership (TCO) and return on investment (ROI) tools are heavily dependent on the assumptions around which they are built.
This report is based on input from 46 organizations that have consolidated x86 or IBM Power platforms supporting SAP systems since 2007. Input from both groups helped to clarify consolidation patterns.
Among the 27 organizations that had conducted x86-to-x86 consolidation initiatives, for example, major SAP production systems were typically deployed on non-virtualized servers configured in three-tier hierarchies. VMware and equivalent hosts were in most cases employed for test, development and other non-production instances; comparatively light-duty production instances; or combinations of these.
In contrast, IBM Power server users routinely employed logical partitions (LPARs) and other PowerVM virtualization technologies for production as well as non-production applications.
Users of both platforms tended to employ rack-mounted hardware and virtualization for database and Central Instance (CI) serving, and blades for application and Web serving.
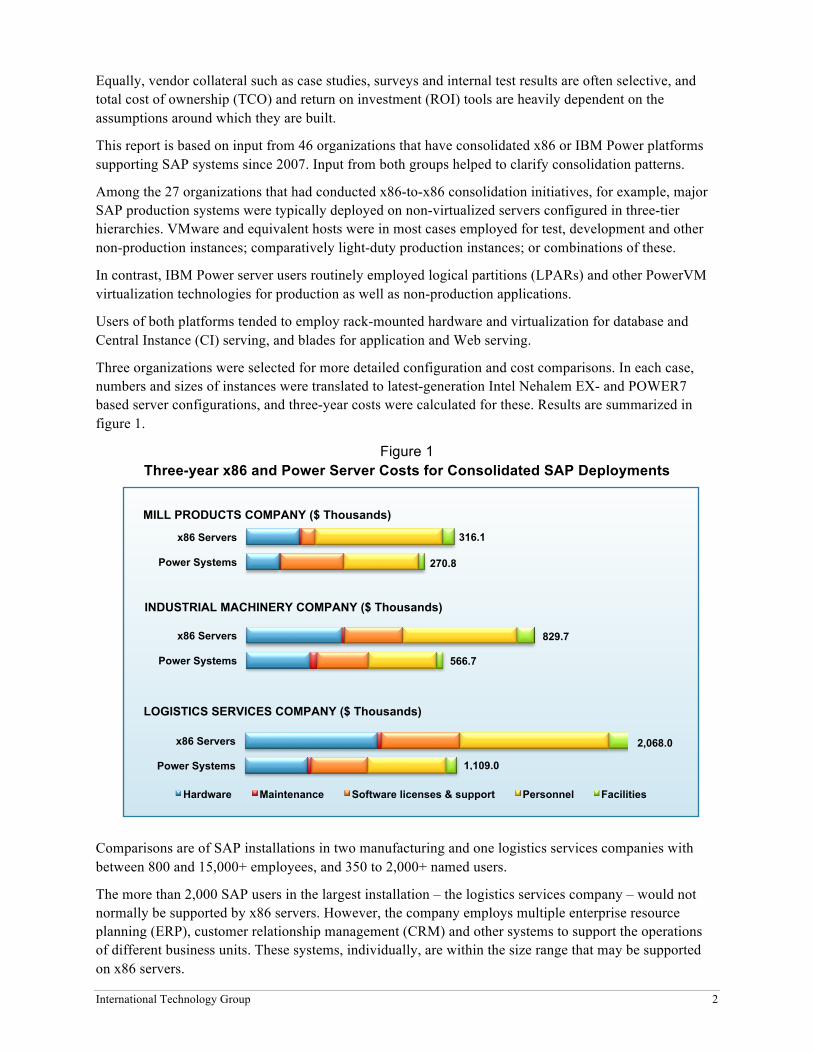
Three organizations were selected for more detailed configuration and cost comparisons. In each case, numbers and sizes of instances were translated to latest-generation Intel Nehalem EX- and POWER7 based server configurations, and three-year costs were calculated for these. Results are summarized in figure 1.
Figure 1 Three-year x86 and Power Server Costs for Consolidated SAP Deployments
Comparisons are of SAP installations in two manufacturing and one logistics services companies with between 800 and 15,000+ employees, and 350 to 2,000+ named users.
The more than 2,000 SAP users in the largest installation – the logistics services company – would not normally be supported by x86 servers. However, the company employs multiple enterprise resource planning (ERP), customer relationship management (CRM) and other systems to support the operations of different business units. These systems, individually, are within the size range that may be supported on x86 servers.
Power Systems
x86 Servers
MILL PRODUCTS COMPANY ($ Thousands)
270.8
316.1
Power Systems
x86 Servers 829.7
566.7
INDUSTRIAL MACHINERY COMPANY ($ Thousands)
Power Systems
x86 Servers
Hardware Maintenance Software licenses & support Personnel Facilities
1,109.0
2,068.0
LOGISTICS SERVICES COMPANY ($ Thousands)
International Technology Group 3
For mill products company comparisons, configurations are based on use of x86 and Power versions of a major Linux distribution, and with MaxDB databases. For the industrial machinery and logistics services companies, x86 server costs are based on use of Windows Server 2008, SQL Server 2008 and vSphere 4. Power Systems costs are based on use of IBM AIX 7.1, DB2 9.7 and PowerVM virtualization.
Costs include acquisition of server hardware and licenses for operating systems and virtualization tools; hardware maintenance and software support; server administration personnel; and facilities (primarily energy costs). Hardware, software, maintenance and support costs were calculated based on street prices; i.e., discounted prices actually paid by users.
Calculations do not include costs for MaxDB, DB2 and SQL Server databases. In practice, these would be calculated as percentages of SAP Application Value (SAV) plus support, and would be the same for x86 servers and Power Systems.
Lower costs for Power Systems are due to multiple factors, including higher system-level performance and greater density of virtualized environments compared to x86 servers. Personnel costs are reduced by higher integration and more advanced automation (these capabilities are discussed in the following section). Facilities and energy costs are reduced by use of fewer platforms and smaller configurations.
Details of companies, SAP installations, server configurations and software stacks, and server administration staffing levels, and of the methodology and assumptions employed may be found in the Detailed Data section of this report.
Infrastructure Value At a time of weak demand and budgetary pressures, the ability to reduce or at least contain growth in IT expenditure is a priority for most organizations. But it is rarely the only priority.
SAP systems literally “run the business.” Underlying system infrastructures must meet other demands. The ability to provide required levels of performance and scalability, and to meet exacting demands for quality of service – including such variables as availability, recoverability and security – also materially affect value propositions for server platforms.
In these areas, there are also strong cases for POWER7 based systems, which are recognized industry performance leaders. Scalability extends from four-core 3.0 GHz blades to Power 795 systems that may be configured with up to 256 4.0 GHz cores, eight terabytes (TB) of main memory and 1,000 LPARs.
User surveys have also consistently rated Power Systems as delivering significantly higher levels of availability than competitive UNIX and x86 platforms. In POWER7 based systems, reliability, availability and security (RAS) capabilities in hardware, microcode and AIX software have been further strengthened.
Experience has shown that major system outages can translate into lost sales, impaired productivity, operational disruption, delayed orders and deliveries, dissatisfied customers and other negative effects. Although unplanned (i.e., accidental) outages may be more visible, the cumulative impact of planned outages for such tasks as scheduled maintenance, hardware and software upgrades and security patching may be equally if not more damaging.
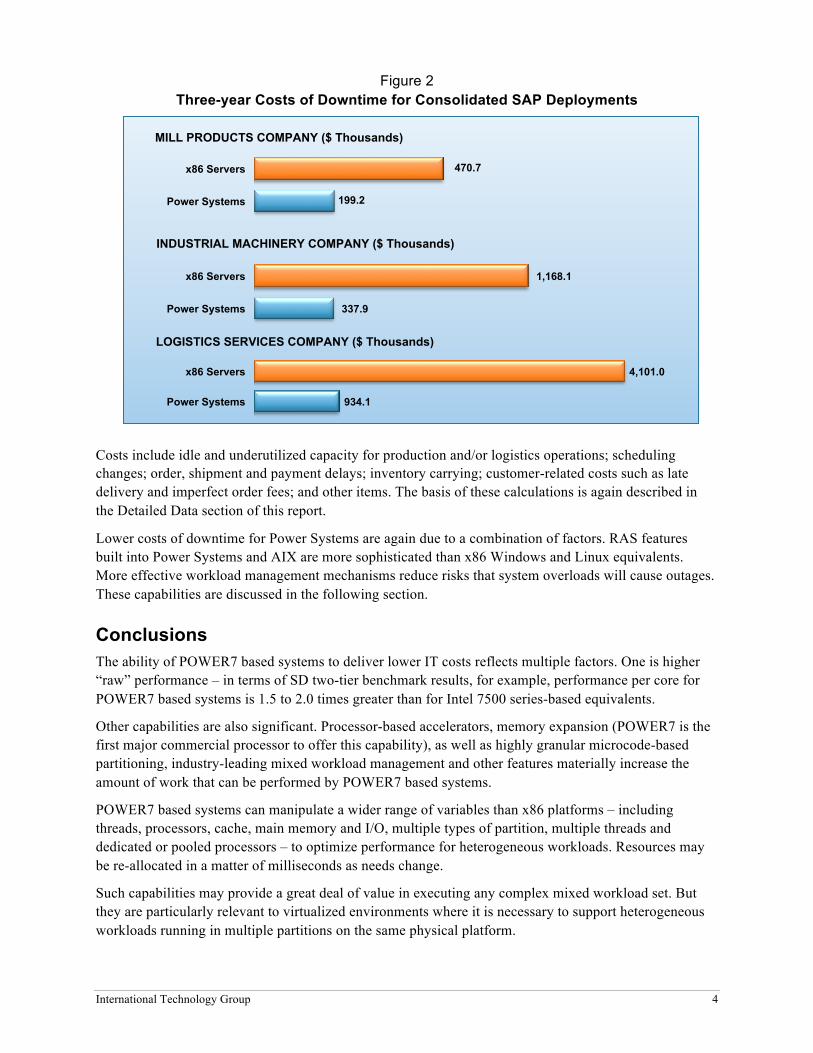
Higher levels of availability for POWER7 based systems have significant bottom-line implications. For example, in the three installations upon which cost comparisons are based, “costs of downtime” range from 58 percent to 77 percent less, and average 74 percent less than for Windows and x86 Linux servers.
Figure 2 illustrates these disparities.
International Technology Group 4
Figure 2 Three-year Costs of Downtime for Consolidated SAP Deployments
Costs include idle and underutilized capacity for production and/or logistics operations; scheduling changes; order, shipment and payment delays; inventory carrying; customer-related costs such as late delivery and imperfect order fees; and other items. The basis of these calculations is again described in the Detailed Data section of this report.
Lower costs of downtime for Power Systems are again due to a combination of factors. RAS features built into Power Systems and AIX are more sophisticated than x86 Windows and Linux equivalents. More effective workload management mechanisms reduce risks that system overloads will cause outages. These capabilities are discussed in the following section.
Conclusions The ability of POWER7 based systems to deliver lower IT costs reflects multiple factors. One is higher “raw” performance – in terms of SD two-tier benchmark results, for example, performance per core for POWER7 based systems is 1.5 to 2.0 times greater than for Intel 7500 series-based equivalents.
Other capabilities are also significant. Processor-based accelerators, memory expansion (POWER7 is the first major commercial processor to offer this capability), as well as highly granular microcode-based partitioning, industry-leading mixed workload management and other features materially increase the amount of work that can be performed by POWER7 based systems.
POWER7 based systems can manipulate a wider range of variables than x86 platforms – including threads, processors, cache, main memory and I/O, multiple types of partition, multiple threads and dedicated or pooled processors – to optimize performance for heterogeneous workloads. Resources may be re-allocated in a matter of milliseconds as needs change.
Such capabilities may provide a great deal of value in executing any complex mixed workload set. But they are particularly relevant to virtualized environments where it is necessary to support heterogeneous workloads running in multiple partitions on the same physical platform.
199.2
470.7
Power Systems
x86 Servers
MILL PRODUCTS COMPANY ($ Thousands)
337.9
1,168.1
Power Systems
x86 Servers
INDUSTRIAL MACHINERY COMPANY ($ Thousands)
934.1
4,101.0
Power Systems
x86 Servers
LOGISTICS SERVICES COMPANY ($ Thousands)
International Technology Group 5
Users of earlier POWER6 based systems have found that that the actual amount of work performed by these is routinely from two to four times greater than raw performance measurements would indicate. New POWER7 based capabilities indicate that disparities between formal and real performance will be significantly larger for this generation of architecture.
The capabilities of Windows and x86 Linux servers with VMware, Microsoft Hyper-V, Xen and other x86 virtualization enablers are weaker. The microcode-based partitioning technology employed by POWER7 based systems is more efficient and secure than software-based techniques such as VMware. POWER7 based workload management is – by a wide margin – superior to x86 server equivalents.
The Virtual I/O Server (VIOS) feature of Power Systems also enables these to support significantly larger numbers of virtual I/O adapters than Windows and x86 Linux equivalents. Organizations may also create redundant VIOS configurations that reduce risks of downtime due to I/O subsystem failures.
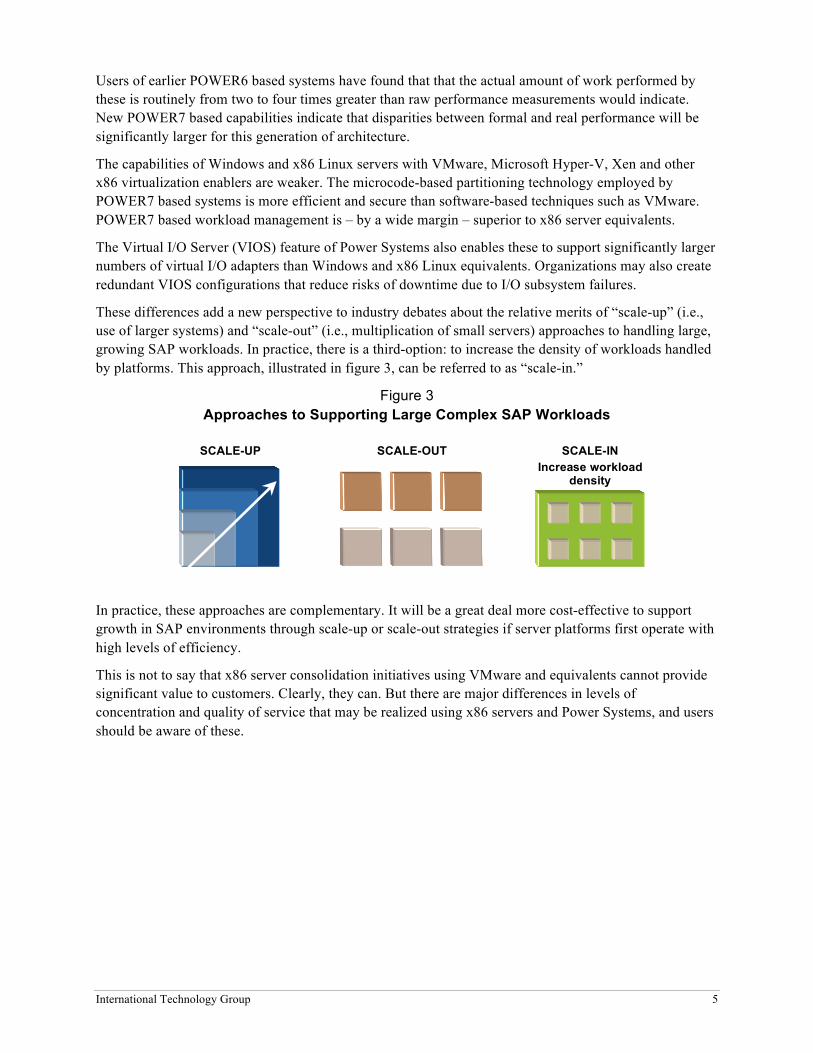
These differences add a new perspective to industry debates about the relative merits of “scale-up” (i.e., use of larger systems) and “scale-out” (i.e., multiplication of small servers) approaches to handling large, growing SAP workloads. In practice, there is a third-option: to increase the density of workloads handled by platforms. This approach, illustrated in figure 3, can be referred to as “scale-in.”
Figure 3 Approaches to Supporting Large Complex SAP Workloads
In practice, these approaches are complementary. It will be a great deal more cost-effective to support growth in SAP environments through scale-up or scale-out strategies if server platforms first operate with high levels of efficiency.
This is not to say that x86 server consolidation initiatives using VMware and equivalents cannot provide significant value to customers. Clearly, they can. But there are major differences in levels of concentration and quality of service that may be realized using x86 servers and Power Systems, and users should be aware of these.
SCALE-OUT SCALE-IN Increase workload
density
SCALE-UP
International Technology Group 6
CHALLENGES AND SOLUTIONS
Consolidation Challenges
General Picture
Consolidation is a long-established trend among SAP users. After initially deploying multiple SAP ERP systems supporting business unit and local operations, many large users have replaced these with larger global and regional systems over the last decade. In some cases, single global instances have even been put in place by organizations with worldwide operations.
Finance, human resources, procurement and other back-end systems have been consolidated and shared services structures put in place. Even when other finance systems have remained decentralized, single general ledgers (GLs) have often been implemented. Consolidation has also extended to CRM, supply chain and other SAP systems, and to data centers, storage, networks and other IT resources.
Cost reduction has been a major driver of these trends, although a variety of other benefits have typically been targeted. These have typically included better concentration of data for analytical as well as operational applications; greater consistency of systems and processes; improved availability, recovery and security; and increased staff productivity.
The same logic has applied to server consolidation. Experience has shown that, in distributed server installations, proliferation inflates costs, generates inefficiencies and impairs quality of service. Where servers have been installed over multi-year periods, inefficiencies are often magnified by use of multiple generations of hardware, and by different versions of operating systems, tools and driver software.
Consolidation initiatives have typically sought to reduce costs for hardware and software maintenance, energy, space and server administration. Economies are also typically realized in ongoing hardware costs – higher levels of capacity utilization mean that fewer new servers are required – and software license costs may be reduced if fewer instances are employed.
Among SAP users, server consolidation has proved particularly attractive – the need to support large multiple-instance landscapes has meant that high levels of server proliferation have developed in many organizations – and particularly difficult.
Even in small installations, the size and complexity of SAP environments pose challenges that are significantly greater than those encountered with most other types of server consolidation.
Size and Complexity
For more than a decade, SAP environments have not only grown larger, but also more diverse. Early deployments focused on transactional processes. There were less than 20 major modules. Processes were highly structured. Implementation involved three-tier client/server hierarchies supporting databases of, at most, a few hundred gigabytes.
Since that time, the SAP portfolio has evolved into a functionally broader spectrum of solutions. Industry-specific functions have become more granular, while the scope of SAP offerings now extends far beyond transactions to include SAP and partner solutions that address processes that deal with information, communication and collaboration.
A present-day SAP enterprise environment may contain solutions addressing between 300 and 500 processes generating highly diverse workloads. In large installations, there may be thousands of processes.
International Technology Group 7
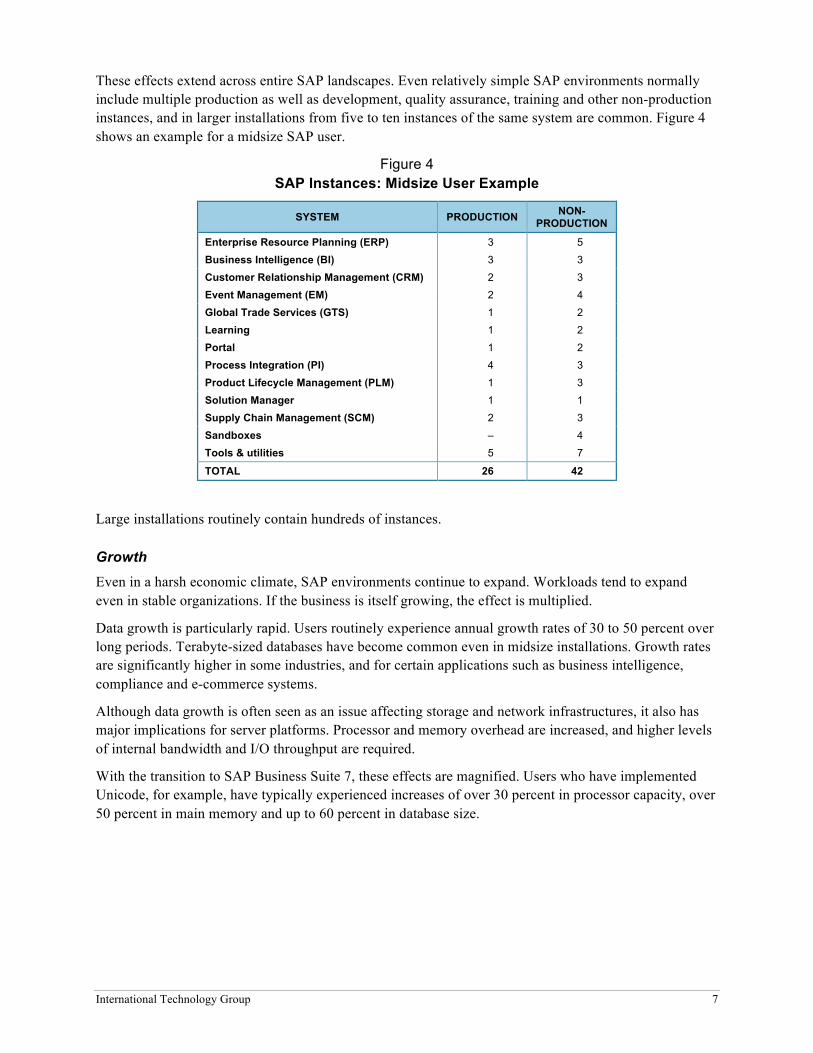
These effects extend across entire SAP landscapes. Even relatively simple SAP environments normally include multiple production as well as development, quality assurance, training and other non-production instances, and in larger installations from five to ten instances of the same system are common. Figure 4 shows an example for a midsize SAP user.
Figure 4 SAP Instances: Midsize User Example
SYSTEM PRODUCTION NON-PRODUCTION
Enterprise Resource Planning (ERP) 3 5
Business Intelligence (BI) 3 3
Customer Relationship Management (CRM) 2 3
Event Management (EM) 2 4
Global Trade Services (GTS) 1 2
Learning 1 2
Portal 1 2
Process Integration (PI) 4 3
Product Lifecycle Management (PLM) 1 3
Solution Manager 1 1
Supply Chain Management (SCM) 2 3
Sandboxes – 4
Tools & utilities 5 7
TOTAL 26 42
Large installations routinely contain hundreds of instances.
Growth Even in a harsh economic climate, SAP environments continue to expand. Workloads tend to expand even in stable organizations. If the business is itself growing, the effect is multiplied.
Data growth is particularly rapid. Users routinely experience annual growth rates of 30 to 50 percent over long periods. Terabyte-sized databases have become common even in midsize installations. Growth rates are significantly higher in some industries, and for certain applications such as business intelligence, compliance and e-commerce systems.
Although data growth is often seen as an issue affecting storage and network infrastructures, it also has major implications for server platforms. Processor and memory overhead are increased, and higher levels of internal bandwidth and I/O throughput are required.
With the transition to SAP Business Suite 7, these effects are magnified. Users who have implemented Unicode, for example, have typically experienced increases of over 30 percent in processor capacity, over 50 percent in main memory and up to 60 percent in database size.
International Technology Group 8
Evaluating Platforms Under any scenario, the stresses that SAP systems place on underlying servers are not small – and for most users, they will increase significantly in the future. It will be necessary to support increasingly complex end-to-end workloads with high levels of concurrency and throughput.
Among organizations consolidating servers, these trends will be reflected in the workloads supported by virtual as well as physical machines.
How, then, should the ability of platforms to handle these stresses be assessed? Multiple capabilities should be evaluated. A first requirement is for raw performance. Increasingly complex SAP software structures require a great deal of processing power and I/O bandwidth. Challenges are compounded when – as is, for example, the case for VMware – hypervisors also generate high levels of system overhead.
Measurement of application-level performance, however, is not a simple process. While metrics such as SD two-tier may be useful, results are typically generated using standardized workloads, low I/O activity and highly controlled operating conditions. Actual production environments tend to be very different, particularly when they involve large databases, virtualization and diverse, fluctuating workloads.
In virtualized environments, a broader range of factors – including hypervisor and workload management capabilities – must be taken into account.
Even small SAP instances normally experience spikes in activity, and may be idle for long periods. If insufficient allowance is made for peak utilization, there is risk that workloads will interfere with each other, causing overall server performance to degrade or triggering outages. If insufficient allowance is made for periods of low utilization, a high percentage of server capacity may be idle at any time.
Efficient virtualization means optimizing capacity use over time. If a system delivering, say, 10,000 SAPS of SD-rated benchmark performance can execute workloads three times larger than another platform with the same rating over a given period, this will significantly affect cost-effectiveness.
One implication is that, in planning for server consolidation, average capacity utilization may not be a meaningful value. A server may operate at an average of 10 to 15 percent utilization, but may spike at 40 to 60 percent. Peak utilization must be known, or at least estimated with a reasonable degree of accuracy.
In comparing server platforms, further caveats should also be applied to capacity utilization statistics. Knowing that a server is operating at, say, 65 or 85 percent of capacity does not provide insight into how efficiently that capacity is used. In practice, a great deal more work may be performed by a POWER7 based system even if utilization is the same as for another platform.
Power Systems
General Picture
POWER7 based systems are built around the seventh generation of the POWER Reduced Instruction Set Computing (RISC) architecture that was first introduced in 1990. During the 2000s, this platform has undergone a steady series of enhancements that have made it the market share leader in the overall UNIX server market, and the most common system for new SAP UNIX deployments.
Worldwide, more than 18,000 Power installations support SAP systems for more than 6,000 customers.
International Technology Group 9
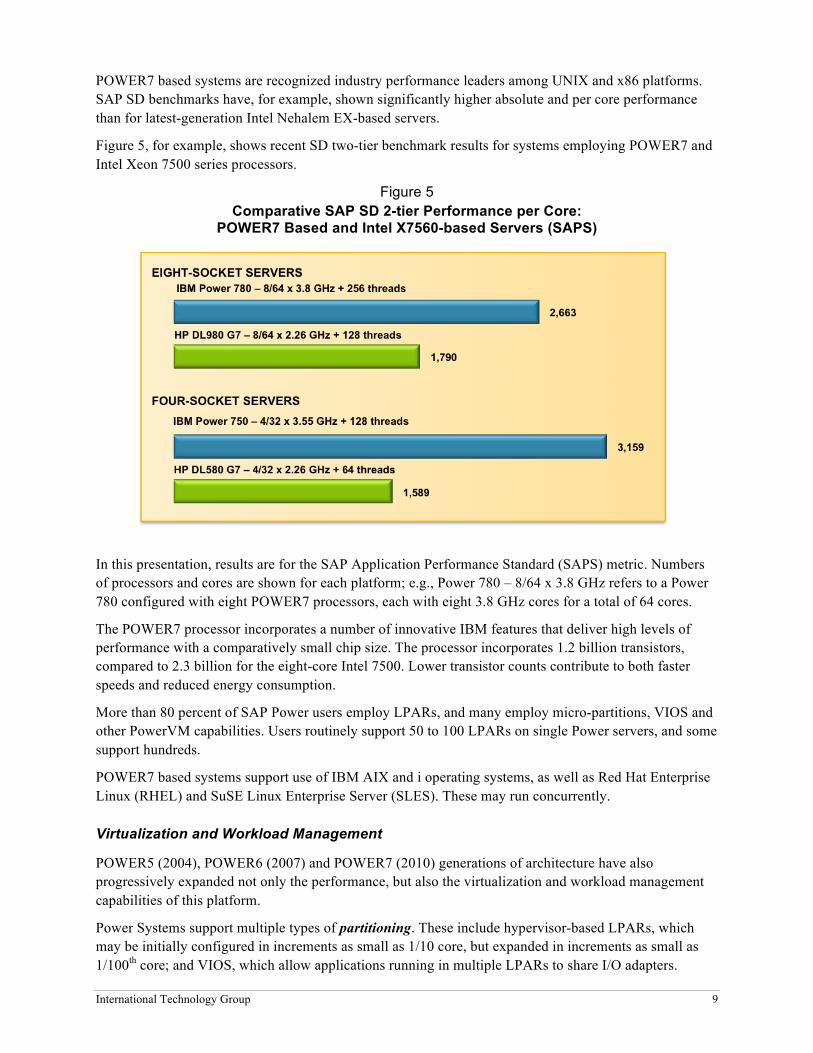
POWER7 based systems are recognized industry performance leaders among UNIX and x86 platforms. SAP SD benchmarks have, for example, shown significantly higher absolute and per core performance than for latest-generation Intel Nehalem EX-based servers.
Figure 5, for example, shows recent SD two-tier benchmark results for systems employing POWER7 and Intel Xeon 7500 series processors.
Figure 5 Comparative SAP SD 2-tier Performance per Core:
POWER7 Based and Intel X7560-based Servers (SAPS)
In this presentation, results are for the SAP Application Performance Standard (SAPS) metric. Numbers of processors and cores are shown for each platform; e.g., Power 780 – 8/64 x 3.8 GHz refers to a Power 780 configured with eight POWER7 processors, each with eight 3.8 GHz cores for a total of 64 cores.
The POWER7 processor incorporates a number of innovative IBM features that deliver high levels of performance with a comparatively small chip size. The processor incorporates 1.2 billion transistors, compared to 2.3 billion for the eight-core Intel 7500. Lower transistor counts contribute to both faster speeds and reduced energy consumption.
More than 80 percent of SAP Power users employ LPARs, and many employ micro-partitions, VIOS and other PowerVM capabilities. Users routinely support 50 to 100 LPARs on single Power servers, and some support hundreds.
POWER7 based systems support use of IBM AIX and i operating systems, as well as Red Hat Enterprise Linux (RHEL) and SuSE Linux Enterprise Server (SLES). These may run concurrently.
Virtualization and Workload Management
POWER5 (2004), POWER6 (2007) and POWER7 (2010) generations of architecture have also progressively expanded not only the performance, but also the virtualization and workload management capabilities of this platform.
Power Systems support multiple types of partitioning. These include hypervisor-based LPARs, which may be initially configured in increments as small as 1/10 core, but expanded in increments as small as 1/100th core; and VIOS, which allow applications running in multiple LPARs to share I/O adapters.
International Technology Group 10
Also supported are Workload Partitions (WPARs), which allow users to create multiple application-specific partitions within single AIX instances. WPARs are typically employed for development, test and light-duty production applications.
Key workload management features in POWER7 hardware, the microcode-based PowerVM hypervisor and AIX software, are closely integrated with partitioning mechanisms. The implications are important.
Partitioning creates the potential for high levels of concentration. However, the extent to which this will occur in practice depends heavily on the mechanisms that allocate system resources, and monitor and control workload execution processes across and within partitions. If these mechanisms are ineffective, an overall system capacity may be poorly utilized.
Power Systems workload management capabilities among the most sophisticated in existence. System resources, including processors and memory, may be dedicated to or shared by partition-based physical, logical (thread-based) and virtual processors. The system evaluates utilization of all resources every 10 milliseconds, and may change allocations as rapidly.
Users employing the earlier generation of IBM POWER6 based systems have found that use of PowerVM partitioning, coupled with shared processor pools and other mechanisms can significantly improve the amount of work performed by a given configuration.
New Capabilities
In POWER7 based systems, a number of new capabilities have been added that boost performance as well as virtualization and workload management. These include:
• Intelligent threading. Increasing the number of POWER-supported threads from two to four (POWER7 SMT4) can increase performance for certain applications. For example, IBM has reported internal test results showing that use of SMT4 can increase system throughput for ABAP software stacks by up to 66 percent and 27 percent compared to use of single or dual (SMT2) threads respectively.
Not all workloads, however, benefit from this approach. For example, database transactions and high-performance analytical processing may run more efficiently using single threads that exploit the full power of processor cores. This is particularly the case for high-volume systems.
With POWER7 based systems, workloads may be executed using one, two or four threads per core. The system can automatically determine which to use for optimum performance, or system administrators may select the number of threads employed. In automatic mode, continuous optimization of performance for system-wide as well as partition workloads is provided.
• Intelligent cache. A similar approach has been extended to cache memory. The system may be set to automatically determine the appropriate level of cache for specific workloads. Automated mode is again supported by performance optimization functions.
On Power 770, 780 and 795 systems, an additional TurboCore mode allows users to configure only half of system cores to exploit shared L3 cache and main memory. This mode is appropriate for high-volume database and transaction processing workloads where larger cache sizes and memory bandwidth can yield significant performance advantages.
• Active Memory Expansion. This enables system-managed compression and decompression of data in memory. IBM tests for SAP workloads indicate that de facto memory size may be increased by 75 percent with less than one percent processor overhead, and by 111 percent with around 15 percent processor overhead. Customers have reported comparable results.
International Technology Group 11
Active Memory Expansion may materially reduce hardware costs, particularly for memory-intensive applications. It also means that workloads representing up to twice as many users can be supported These capabilities are obviously relevant to the demands of virtualized hosts managing numerous partitions, equipped with large physical memories.
Automation is again much in evidence. Systems can automatically turn Active Memory Expansion on or off to optimize performance for workloads running in individual partitions. The amount of memory made available in this manner may be subject to system-level priorities.
The IBM emphasis on automation is striking. In some cases, autonomic technologies are employed. Autonomic computing, meaning the application of artificial intelligence techniques to system administration and optimization, has been a major IBM design focus for more than a decade. The company is the recognized industry leader in this area.
Automation has a number of bottom-line implications. One is that staffing and personnel costs for administrative tasks may be reduced. Another is that the potential for performance bottlenecks and outages due to administrator errors is reduced.
Equally, if not more important, automation accelerates processes that affect capacity utilization. A system capable of automatically determining requirements and re-allocating resources in a matter of milliseconds will inevitably be more efficient than one that depends upon human intervention. Such differences may have a far from negligible impact on configuration sizes and costs.
The impact of all of the capabilities described above is cumulative.
A comparative evaluation of POWER7 based systems would need to start with 50 to 100 percent more SAPS per core than Nehalem EX equivalents; allow for a minimum of two times gains due to virtualization and workload management capabilities; and factor in real memory savings through use of Active Memory Expansion.
In terms of overall cost structure, it would be necessary to account for the smaller, denser configurations enabled by Power Systems – which contribute to lower system administration, data center occupancy and energy costs – as well as economies realized through levels of automation, availability and security that are significantly higher than for any x86 server, operating system or virtualization enabler.
x86 and VMware
Deployment Patterns
Consolidation of x86 servers supporting SAP systems has been practiced for more than a decade. It has accelerated during the last few years with the appearance of more powerful Intel and AMD processor-based servers and growing use of VMware and (more rarely) other x86 virtualization enablers.
Among SAP UNIX server users, server consolidation has in most cases involved extensive use of partitioning technologies such as IBM LPARs, and HP and Sun equivalents. x86 consolidation has been a more diverse trend. Among SAP x86 users that contributed to this report, for example, 23 of 26 employed combinations of non-virtualized and virtualized servers.
Virtualization was typically employed for test, development, training and comparatively light-duty production instances – examples included SAP Content Manager, Portal, Process Integration (formerly Exchange Infrastructure), Solution Manager and e-procurement and analytics tools. x86 platforms supporting e-mail, collaboration, file and print serving, and other complementary applications were also commonly moved to virtualized servers.
International Technology Group 12
Some users had also virtualized ERP, CRM, supply chain management (SCM) and other more substantial SAP applications. These tended, however, to be either relatively small or partial environments; e.g., one organization that reported that it had virtualized a core production ERP system had actually done so for only a few modules.
This picture appears to be consistent with overall deployment patterns. Most industry estimates are that non-production systems account for between 60 and 80 percent of all deployed SAP instances in virtual machines (VMs). Virtualized production systems typically support small user organizations, less demanding SAP applications or both.
Use of VMware by a number of SAP Web hosting organizations reflects similar dynamics. Although these often employ large numbers of servers and VMs, they typically support customers who individually represent small systems and workloads.
User input also indicates the growing role of blades in server consolidation initiatives. In many cases, organizations have employed rack-mounted servers to support production database servers and central instances; blades to support production application and Web serving; and VMware servers to support other instances. Exact mixes, however, varied widely from organization.
Scalability Issues
The demographics of VMware use are striking in that, in principle, VMware can deliver extremely high levels of performance and scalability.
The Virtual Infrastructure 3 (VI3) product set, introduced in 2006, supports up 32 physical cores, 256 gigabytes (GB) of main memory and 128 VMs per host. The latest vSphere 4 version extends support to 64 physical cores, 1 terabyte (TB) of main memory and 320 VMs per host.
However, only a small fraction of the architectural potential of either version has been exploited in practice. One reason for this is that, in a SAP environment, system overhead increases rapidly as workloads within instances grow larger.
In VMware architecture, the number of physical processors that can be exploited by a VM depends upon the number of virtual processors (vCPUs) supported. For most of its history, VMware allowed use of only two vCPUs per VM. Virtual Infrastructure 3 extended support to four, and vSphere 4 to eight vCPUs.
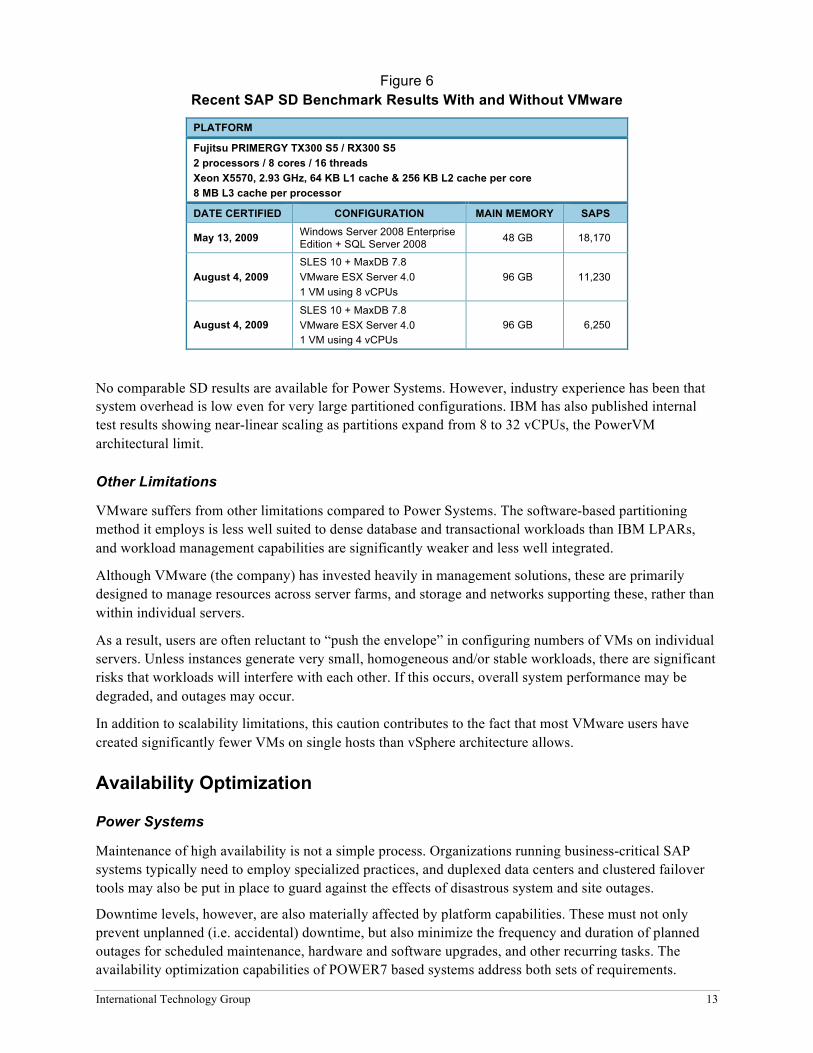
These transitions, however, have been accompanied by performance degradation. This is reflected even in SAP SD benchmark results. During 2009, for example, several SD two-tier benchmarks run on the same Nehalem EX-based physical machine using VMware ESX Server 4.0 – the core component of the vSphere 4 environment – showed striking variations.
As figure 6 illustrates, use of ESX 4.0 with eight virtual CPUs reduced performance by more than 38 percent compared to the same test run without VMware – from 18,170 to 11,230 SAPS.
This was the case despite use of larger main memory – 96GB compared to 48GB. Moreover, the VMware result was arrived at using Linux and SAP MaxDB, which generate lower system overhead than Windows Server 2008 and SQL Server 2008 employed for the test without VMware.
VMware performance degradation if these were employed would probably be in the 40 to 50 percent range for benchmark results, and significantly higher in real production conditions.
The same physical machine configured with four vCPUs delivered only 6,250 SAPS, around a third of the performance realized without VMware.
International Technology Group 13
Figure 6 Recent SAP SD Benchmark Results With and Without VMware
PLATFORM
Fujitsu PRIMERGY TX300 S5 / RX300 S5 2 processors / 8 cores / 16 threads Xeon X5570, 2.93 GHz, 64 KB L1 cache & 256 KB L2 cache per core 8 MB L3 cache per processor
DATE CERTIFIED CONFIGURATION MAIN MEMORY SAPS
May 13, 2009 Windows Server 2008 Enterprise Edition + SQL Server 2008 48 GB 18,170
August 4, 2009 SLES 10 + MaxDB 7.8 VMware ESX Server 4.0 1 VM using 8 vCPUs
96 GB 11,230
August 4, 2009 SLES 10 + MaxDB 7.8 VMware ESX Server 4.0 1 VM using 4 vCPUs
96 GB 6,250
No comparable SD results are available for Power Systems. However, industry experience has been that system overhead is low even for very large partitioned configurations. IBM has also published internal test results showing near-linear scaling as partitions expand from 8 to 32 vCPUs, the PowerVM architectural limit.
Other Limitations
VMware suffers from other limitations compared to Power Systems. The software-based partitioning method it employs is less well suited to dense database and transactional workloads than IBM LPARs, and workload management capabilities are significantly weaker and less well integrated.
Although VMware (the company) has invested heavily in management solutions, these are primarily designed to manage resources across server farms, and storage and networks supporting these, rather than within individual servers.
As a result, users are often reluctant to “push the envelope” in configuring numbers of VMs on individual servers. Unless instances generate very small, homogeneous and/or stable workloads, there are significant risks that workloads will interfere with each other. If this occurs, overall system performance may be degraded, and outages may occur.
In addition to scalability limitations, this caution contributes to the fact that most VMware users have created significantly fewer VMs on single hosts than vSphere architecture allows.
Availability Optimization
Power Systems
Maintenance of high availability is not a simple process. Organizations running business-critical SAP systems typically need to employ specialized practices, and duplexed data centers and clustered failover tools may also be put in place to guard against the effects of disastrous system and site outages.
Downtime levels, however, are also materially affected by platform capabilities. These must not only prevent unplanned (i.e. accidental) downtime, but also minimize the frequency and duration of planned outages for scheduled maintenance, hardware and software upgrades, and other recurring tasks. The availability optimization capabilities of POWER7 based systems address both sets of requirements.
International Technology Group 14
A key characteristic is that availability optimization is designed and implemented across all major system components, including hardware, PowerVM virtualization and AIX software.
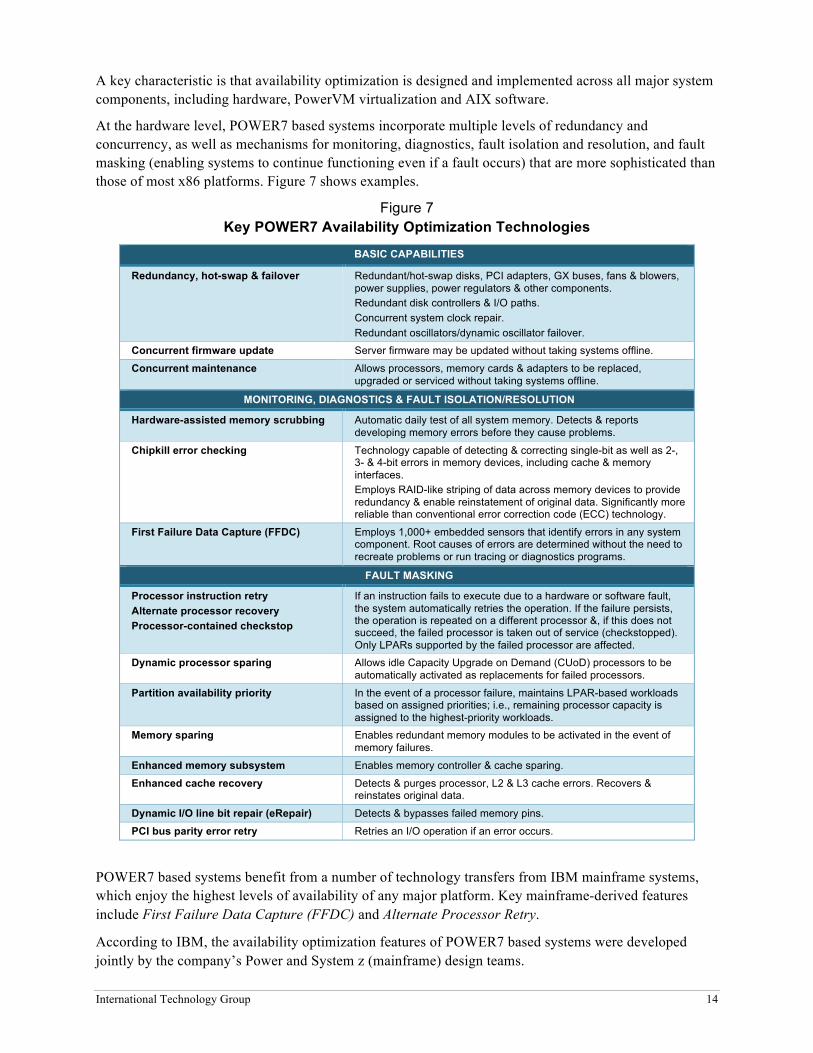
At the hardware level, POWER7 based systems incorporate multiple levels of redundancy and concurrency, as well as mechanisms for monitoring, diagnostics, fault isolation and resolution, and fault masking (enabling systems to continue functioning even if a fault occurs) that are more sophisticated than those of most x86 platforms. Figure 7 shows examples.
Figure 7 Key POWER7 Availability Optimization Technologies
BASIC CAPABILITIES
Redundancy, hot-swap & failover Redundant/hot-swap disks, PCI adapters, GX buses, fans & blowers, power supplies, power regulators & other components. Redundant disk controllers & I/O paths. Concurrent system clock repair. Redundant oscillators/dynamic oscillator failover.
Concurrent firmware update Server firmware may be updated without taking systems offline.
Concurrent maintenance Allows processors, memory cards & adapters to be replaced, upgraded or serviced without taking systems offline.
MONITORING, DIAGNOSTICS & FAULT ISOLATION/RESOLUTION
Hardware-assisted memory scrubbing Automatic daily test of all system memory. Detects & reports developing memory errors before they cause problems.
Chipkill error checking Technology capable of detecting & correcting single-bit as well as 2-, 3- & 4-bit errors in memory devices, including cache & memory interfaces. Employs RAID-like striping of data across memory devices to provide redundancy & enable reinstatement of original data. Significantly more reliable than conventional error correction code (ECC) technology.
First Failure Data Capture (FFDC) Employs 1,000+ embedded sensors that identify errors in any system component. Root causes of errors are determined without the need to recreate problems or run tracing or diagnostics programs.
FAULT MASKING
Processor instruction retry Alternate processor recovery Processor-contained checkstop
If an instruction fails to execute due to a hardware or software fault, the system automatically retries the operation. If the failure persists, the operation is repeated on a different processor &, if this does not succeed, the failed processor is taken out of service (checkstopped). Only LPARs supported by the failed processor are affected.
Dynamic processor sparing Allows idle Capacity Upgrade on Demand (CUoD) processors to be automatically activated as replacements for failed processors.
Partition availability priority In the event of a processor failure, maintains LPAR-based workloads based on assigned priorities; i.e., remaining processor capacity is assigned to the highest-priority workloads.
Memory sparing Enables redundant memory modules to be activated in the event of memory failures.
Enhanced memory subsystem Enables memory controller & cache sparing.
Enhanced cache recovery Detects & purges processor, L2 & L3 cache errors. Recovers & reinstates original data.
Dynamic I/O line bit repair (eRepair) Detects & bypasses failed memory pins.
PCI bus parity error retry Retries an I/O operation if an error occurs.
POWER7 based systems benefit from a number of technology transfers from IBM mainframe systems, which enjoy the highest levels of availability of any major platform. Key mainframe-derived features include First Failure Data Capture (FFDC) and Alternate Processor Retry.
According to IBM, the availability optimization features of POWER7 based systems were developed jointly by the company’s Power and System z (mainframe) design teams.
International Technology Group 15
AIX Software
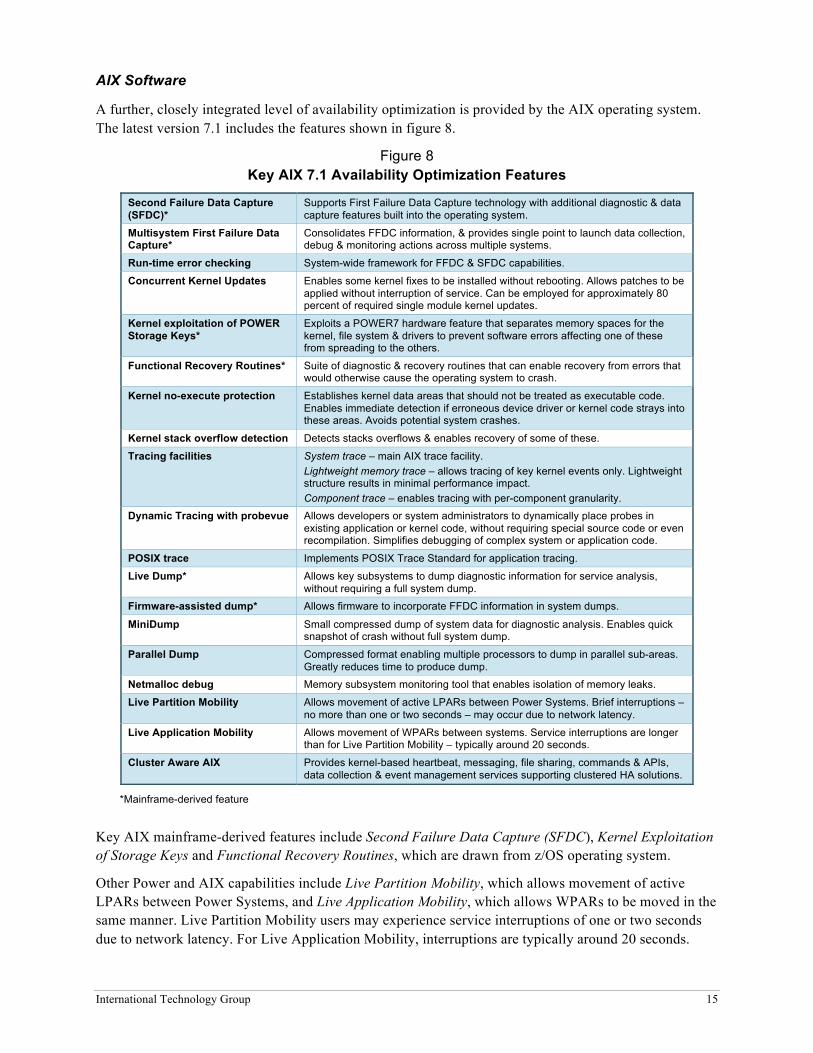
A further, closely integrated level of availability optimization is provided by the AIX operating system. The latest version 7.1 includes the features shown in figure 8.
Figure 8 Key AIX 7.1 Availability Optimization Features
Second Failure Data Capture (SFDC)*
Supports First Failure Data Capture technology with additional diagnostic & data capture features built into the operating system.
Multisystem First Failure Data Capture*
Consolidates FFDC information, & provides single point to launch data collection, debug & monitoring actions across multiple systems.
Run-time error checking System-wide framework for FFDC & SFDC capabilities.
Concurrent Kernel Updates Enables some kernel fixes to be installed without rebooting. Allows patches to be applied without interruption of service. Can be employed for approximately 80 percent of required single module kernel updates.
Kernel exploitation of POWER Storage Keys*
Exploits a POWER7 hardware feature that separates memory spaces for the kernel, file system & drivers to prevent software errors affecting one of these from spreading to the others.
Functional Recovery Routines* Suite of diagnostic & recovery routines that can enable recovery from errors that would otherwise cause the operating system to crash.
Kernel no-execute protection Establishes kernel data areas that should not be treated as executable code. Enables immediate detection if erroneous device driver or kernel code strays into these areas. Avoids potential system crashes.
Kernel stack overflow detection Detects stacks overflows & enables recovery of some of these.
Tracing facilities System trace – main AIX trace facility. Lightweight memory trace – allows tracing of key kernel events only. Lightweight structure results in minimal performance impact. Component trace – enables tracing with per-component granularity.
Dynamic Tracing with probevue Allows developers or system administrators to dynamically place probes in existing application or kernel code, without requiring special source code or even recompilation. Simplifies debugging of complex system or application code.
POSIX trace Implements POSIX Trace Standard for application tracing.
Live Dump* Allows key subsystems to dump diagnostic information for service analysis, without requiring a full system dump.
Firmware-assisted dump* Allows firmware to incorporate FFDC information in system dumps.
MiniDump Small compressed dump of system data for diagnostic analysis. Enables quick snapshot of crash without full system dump.
Parallel Dump Compressed format enabling multiple processors to dump in parallel sub-areas. Greatly reduces time to produce dump.
Netmalloc debug Memory subsystem monitoring tool that enables isolation of memory leaks.
Live Partition Mobility Allows movement of active LPARs between Power Systems. Brief interruptions – no more than one or two seconds – may occur due to network latency.
Live Application Mobility Allows movement of WPARs between systems. Service interruptions are longer than for Live Partition Mobility – typically around 20 seconds.
Cluster Aware AIX Provides kernel-based heartbeat, messaging, file sharing, commands & APIs, data collection & event management services supporting clustered HA solutions.
*Mainframe-derived feature
Key AIX mainframe-derived features include Second Failure Data Capture (SFDC), Kernel Exploitation of Storage Keys and Functional Recovery Routines, which are drawn from z/OS operating system.
Other Power and AIX capabilities include Live Partition Mobility, which allows movement of active LPARs between Power Systems, and Live Application Mobility, which allows WPARs to be moved in the same manner. Live Partition Mobility users may experience service interruptions of one or two seconds due to network latency. For Live Application Mobility, interruptions are typically around 20 seconds.

International Technology Group 16
In addition, high availability clustering solutions are offered by IBM and third parties for POWER7 based systems. PowerHA SystemMirror for AIX, for example, is one of the most widely used and mature clustered failover and recovery solutions for UNIX-based servers. It has been deployed by thousands of users over more than a decade.
Although the amount of time required to failover and restart systems and reinstate data may vary, the “best practice” norm for PowerHA SystemMirror is that operations may be fully restored within two hours with little or no data loss. Users have achieved mainframe-class failover and recovery even for complex large-scale transactional workloads.
x86 Environments
Since the mid-2000s, Power Systems and AIX have consistently shown higher levels of availability than competitive UNIX and x86 servers in user surveys.
Although x86 hardware platforms share some of the same RAS features, the capabilities of Power Systems, are broader in design and technologically more sophisticated. The AIX operating system is also – by wide margins – better optimized to deliver high availability than Windows or x86 Linux variants.
In x86 environments, moreover, availability must be maintained not only across processors and server platforms, but also across Windows or Linux, and virtualization tools such as VMware and Xen. Typically, this means dealing with the offerings of at least four vendors. Optimization of availability features is inevitably more problematic than is the case for Power Systems.
Use of high availability clusters does not necessarily change this picture. Windows and Linux clusters typically experience more downtime than UNIX equivalents, and failover and recovery processes tend to be both slower and less reliable. Clusters also tend to generate complexity, and the effects are magnified if they are multiplied across farms of small servers.
Experience has shown that x86 clusters are often necessary to achieve availability levels that may be realized by standalone Power Systems.
International Technology Group 17
DETAILED DATA
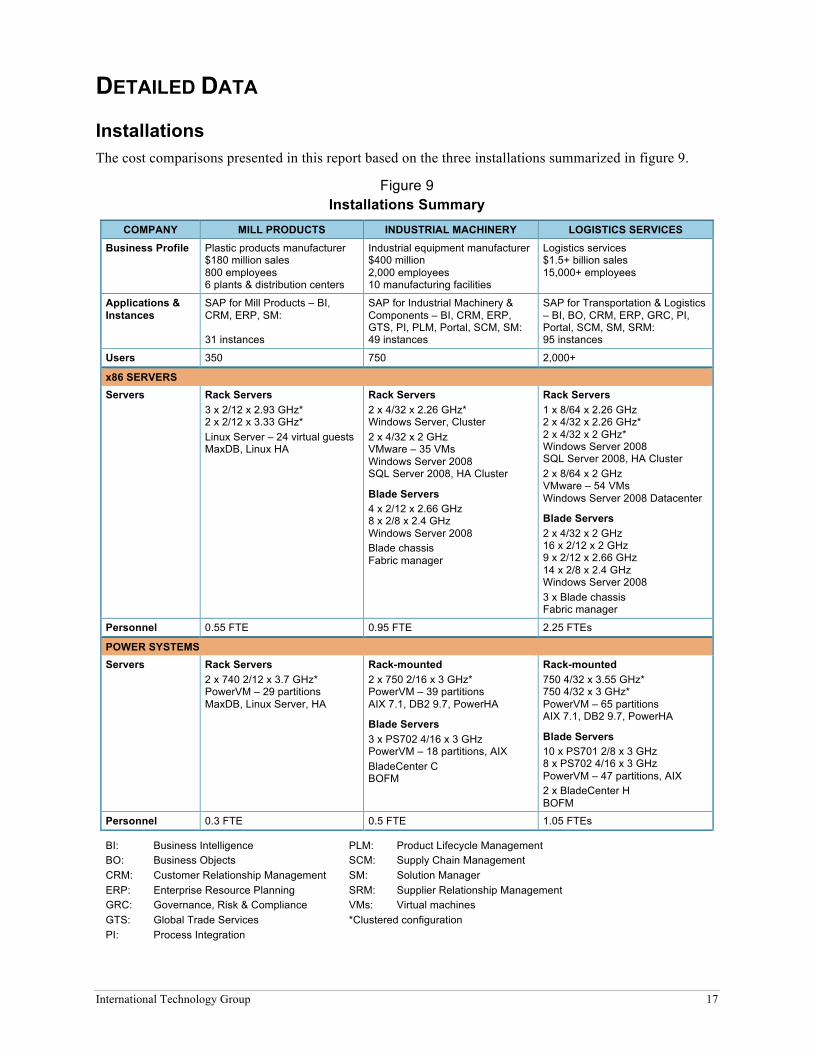
Installations The cost comparisons presented in this report based on the three installations summarized in figure 9.
Figure 9 Installations Summary
COMPANY MILL PRODUCTS INDUSTRIAL MACHINERY LOGISTICS SERVICES Business Profile Plastic products manufacturer
$180 million sales 800 employees 6 plants & distribution centers
Industrial equipment manufacturer $400 million 2,000 employees 10 manufacturing facilities
Logistics services $1.5+ billion sales 15,000+ employees
Applications & Instances
SAP for Mill Products – BI, CRM, ERP, SM: 31 instances
SAP for Industrial Machinery & Components – BI, CRM, ERP, GTS, PI, PLM, Portal, SCM, SM: 49 instances
SAP for Transportation & Logistics – BI, BO, CRM, ERP, GRC, PI, Portal, SCM, SM, SRM: 95 instances
Users 350 750 2,000+
x86 SERVERS
Servers Rack Servers 3 x 2/12 x 2.93 GHz* 2 x 2/12 x 3.33 GHz* Linux Server – 24 virtual guests MaxDB, Linux HA
Rack Servers 2 x 4/32 x 2.26 GHz* Windows Server, Cluster 2 x 4/32 x 2 GHz VMware – 35 VMs Windows Server 2008 SQL Server 2008, HA Cluster
Blade Servers 4 x 2/12 x 2.66 GHz 8 x 2/8 x 2.4 GHz Windows Server 2008 Blade chassis Fabric manager
Rack Servers 1 x 8/64 x 2.26 GHz 2 x 4/32 x 2.26 GHz* 2 x 4/32 x 2 GHz* Windows Server 2008 SQL Server 2008, HA Cluster 2 x 8/64 x 2 GHz VMware – 54 VMs Windows Server 2008 Datacenter
Blade Servers 2 x 4/32 x 2 GHz 16 x 2/12 x 2 GHz 9 x 2/12 x 2.66 GHz 14 x 2/8 x 2.4 GHz Windows Server 2008 3 x Blade chassis Fabric manager
Personnel 0.55 FTE 0.95 FTE 2.25 FTEs
POWER SYSTEMS
Servers Rack Servers 2 x 740 2/12 x 3.7 GHz* PowerVM – 29 partitions MaxDB, Linux Server, HA
Rack-mounted 2 x 750 2/16 x 3 GHz* PowerVM – 39 partitions AIX 7.1, DB2 9.7, PowerHA
Blade Servers 3 x PS702 4/16 x 3 GHz PowerVM – 18 partitions, AIX BladeCenter C BOFM
Rack-mounted 750 4/32 x 3.55 GHz* 750 4/32 x 3 GHz* PowerVM – 65 partitions AIX 7.1, DB2 9.7, PowerHA
Blade Servers 10 x PS701 2/8 x 3 GHz 8 x PS702 4/16 x 3 GHz PowerVM – 47 partitions, AIX 2 x BladeCenter H BOFM
Personnel 0.3 FTE 0.5 FTE 1.05 FTEs
BI: Business Intelligence BO: Business Objects CRM: Customer Relationship Management ERP: Enterprise Resource Planning GRC: Governance, Risk & Compliance GTS: Global Trade Services PI: Process Integration
PLM: Product Lifecycle Management SCM: Supply Chain Management SM: Solution Manager SRM: Supplier Relationship Management VMs: Virtual machines *Clustered configuration
International Technology Group 18
In this summary, IBM model numbers are shown for Power Systems, while x86 servers are branded products from a major manufacturer equipped with Intel Xeon 7500, 6500 or 5600 series processors.
Numbers of processors and cores are shown for servers – e.g., “ 4/32 x 2.26 GHz” refers to a four-socket x86 server equipped with eight-core Intel Xeon X7560 processors, while “750 2/16 x 3 GHz” refers to a two-socket IBM Power 750 system equipped with two eight-core POWER7 3.0 GHz processors.
Blade servers are housed in IBM BladeCenter C and H chassis, which may be configured with up to 6 or 14 blades respectively, and x86 equivalents. Chassis are equipped with IBM BladeCenter Open Fabric Manager (BOFM) and equivalent x86 fabric managers.
IT Costs
Basis of Calculations
Three-year IT costs were calculated as follows.
• Server costs. Hardware and maintenance costs are for initial acquisition and three-year 24/7 coverage respectively for the server configurations shown.
For sizing and cost calculations for the mill products company, x86 as well as for Power servers were configured with versions of the same major Linux distribution, along with virtualization and high availability (HA) clustering solutions offered for this distribution.
For the two other installations, x86 servers were configured with Windows Server 2008 Enterprise or Datacenter Edition and VMware vSphere 4 Acceleration Kit; while Power Systems were configured with AIX 7.1 Enterprise Edition and PowerVM Enterprise Edition microcode.
A third-party solution widely employed among SAP users, and IBM PowerHA SystemMirror for AIX are employed for clustered Windows and Power configurations respectively.
Software costs include initial licenses as well as three-year 24/7 support. IBM support costs are for Software Maintenance (SWMA), while Microsoft costs are for Software Assurance coverage.
Server configurations were sized based on use of SAP MaxDB for the mill products company, and SQL Server 2008 Enterprise Edition and DB2 9.7 Enterprise Edition for the two other installations. For reasons discussed earlier, database license and support costs are not included in cost calculations.
• Facilities costs. These include data center occupancy, power and cooling equipment, and energy consumption over a three-year period.
Occupancy cost calculations were based on EIA 42U rack mount units and blade chassis, including service clearances and allowance for inactive areas. A conservative assumption for annual cost per square foot for existing facilities was employed (i.e., costs do not include new facilities construction).
Costs for power and cooling equipment were based on configurations of such equipment appropriate for the servers employed in each installation and scenario. Costs were calculated for acquisition and maintenance over a three-year period, using discounted list prices for equipment from leading vendors.
Costs were based on prorated values; e.g., if servers required 15 percent of the output of a 10-ton chiller (“ton,” in this context, is a standard cooling metric), calculations were for 15 percent of three-year costs for this equipment.
International Technology Group 19
Energy costs were calculated based on estimated electricity consumption for server configurations. Specific utilization levels and hours of operation for each profile installation were then applied, and a conservative assumption for average price per kilowatt/hour was employed to determine three-year costs.
• Personnel costs. These were calculated for the numbers of full time equivalent (FTE) server administration staff shown in figure 9.
Calculations were based on annual salaries of $79,066 and $85,237 for x86 and Power Linux administrators respectively for the Mill Products Company: and $77,985 and $88,152 respectively for Windows and VMware, and Power/AIX and PowerVM administrators respectively for the Industrial Machinery and Logistics Services companies.
Salaries were increased by 48.3 percent to allow for benefits, bonuses, training and other personnel-related costs, and calculated for a three-year period.
All cost values employed were for the United States.
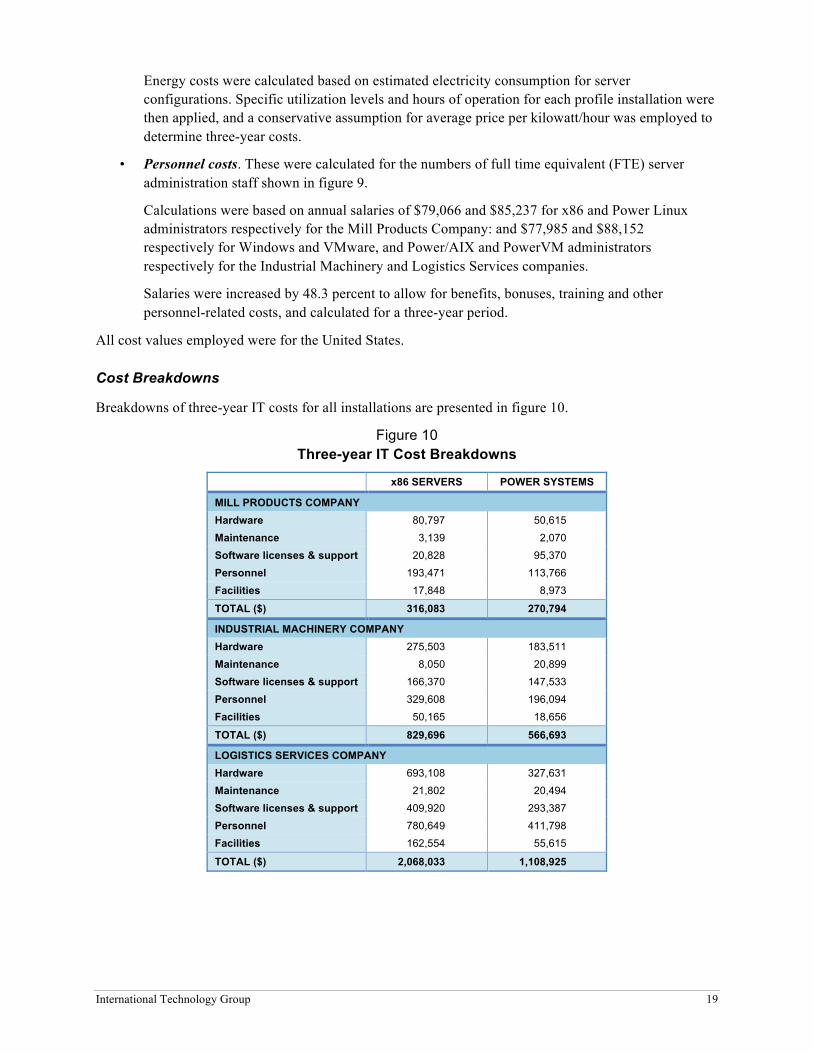
Cost Breakdowns
Breakdowns of three-year IT costs for all installations are presented in figure 10.
Figure 10 Three-year IT Cost Breakdowns
x86 SERVERS POWER SYSTEMS
MILL PRODUCTS COMPANY Hardware 80,797 50,615
Maintenance 3,139 2,070
Software licenses & support 20,828 95,370
Personnel 193,471 113,766
Facilities 17,848 8,973
TOTAL ($) 316,083 270,794
INDUSTRIAL MACHINERY COMPANY Hardware 275,503 183,511
Maintenance 8,050 20,899
Software licenses & support 166,370 147,533
Personnel 329,608 196,094
Facilities 50,165 18,656
TOTAL ($) 829,696 566,693
LOGISTICS SERVICES COMPANY Hardware 693,108 327,631
Maintenance 21,802 20,494
Software licenses & support 409,920 293,387
Personnel 780,649 411,798
Facilities 162,554 55,615
TOTAL ($) 2,068,033 1,108,925
International Technology Group 20
Costs of Downtime Costs of downtime were calculated using a two-phase process.
First, average costs per hour of downtime for the three companies summarized in figure 2 were calculated using appropriate industry- and company-specific values. “Average,” in this context, means that costs are based on overall annual volumes of business activity divided by hours of operation.
For the two manufacturing companies, three main cost categories were employed:
1. Outbound supply chain disruption consisted of costs caused by disruption of activities between factory release and customer delivery. These included costs of idle and underutilized capacity, including personnel costs; handling of delivery delays, including distribution center and transportation costs; inventory carrying costs; and costs of change for affected processes.
2. Inbound supply chain and production disruption consisted of costs incurred for activities between initial supplier queries and factory release. These included costs of idle and underutilized capacity for inbound logistics and production operations; handling of delivery delays; inventory carrying costs; and costs of supplier order, production scheduling and other changes.
3. Other costs included penalties for late delivery and imperfect orders, along with buyback costs such as rebates; costs of customer billing delays; reduced productivity of and additional work performed by sales, customer service and administrative personnel; and other items.
For the logistics services company, two cost categories were employed:
1. Operational disruption consisted of costs caused by delays in transportation and warehousing processes. These included costs of idle and underutilized capacity, including equipment-related costs and personnel-related costs for drivers, warehouse, fuelling, maintenance and other personnel; costs of rescheduling; and other items.
Cost items corresponded to the “Operating Costs” category normally reported by transportation and logistics companies. Items included rents and equipment costs; salaries, wages and benefits; fuel and fuel taxes; depreciation and amortization; operating supplies and expenses; insurance; operating licenses and taxes; communications and utilities; and general and administrative costs.
2. Other costs included late delivery penalties; buyback costs such as additional discounts and rebates; costs of customer billing delays; and reduced productivity of and additional work performed by sales and headquarters; and other items.
Second, average costs per hour of downtime were multiplied by numbers of hours of downtime per year for each platform. These were calculated based on user input. The focus was placed on downtime for underlying server platforms, rather than downtime for SAP applications, databases and middleware. Annual costs of downtime for each platform were then multiplied for three-year totals.
All cost values were again for the United States.
ABOUT THE INTERNATIONAL TECHNOLOGY GROUP ITG sharpens your awareness of what’s happening and your competitive edge
. . . this could affect your future growth and profit prospects
The International Technology Group (ITG), established in 1983, is an independent research and management consulting firm specializing in information technology (IT) investment strategy, cost/benefit metrics, infrastructure studies, deployment tactics, business alignment and financial analysis.
ITG was an early innovator and pioneer in developing total cost of ownership (TCO) and return on investment (ROI) processes and methodologies. In 2004, the firm received a Decade of Education Award from the Information Technology Financial Management Association (ITFMA), the leading professional association dedicated to education and advancement of financial management practices in end-user IT organizations.
The firm has undertaken more than 100 major consulting projects, released approximately 160 management reports and white papers, and delivered nearly 1,800 briefs and presentations to individual clients, user groups, industry conferences and seminars throughout the world.
Client services are designed to provide factual data and reliable documentation to assist in the decision-making process. Information provided establishes the basis for developing tactical and strategic plans. Important developments are analyzed and practical guidance is offered on the most effective ways to respond to changes that may impact or shape complex IT deployment agendas.
A broad range of services is offered, furnishing clients with the information necessary to complement their internal capabilities and resources. Customized client programs involve various combinations of the following deliverables:
Status Reports In-depth studies of important issues
Management Briefs Detailed analysis of significant developments
Management Briefings Periodic interactive meetings with management
Executive Presentations Scheduled strategic presentations for decision-makers
Email Communications Timely replies to informational requests
Telephone Consultation Immediate response to informational needs
Clients include a cross section of IT end users in the private and public sectors representing multinational corporations, industrial companies, financial institutions, service organizations, educational institutions, federal and state government agencies as well as IT system suppliers, software vendors and service firms. Federal government clients have included agencies within the Department of Defense (e.g. DISA), Department of Transportation (e.g. FAA) and Department of Treasury (e.g. US Mint).
International Technology Group 4546 El Camino Real, Suite 230
Los Altos, California 94022-1069 Telephone: (650) 949-8410 Facsimile: (650) 949-8415 Email: [email protected]
ITGPOL03081-USEN-00