Embed Size (px)
Citation preview
IN&OUT AG
IBM AIX POWER VS. LINUX X86
An in-practice comparison of core applications in bank-ing and insurance environments
Andreas Zallmann Manager IT Efficiency, In&Out AG
Version: 1.01
Date: 19.2.14
Classification: not classified
In&Out AG IT Consulting & Engineering
Seestrasse 353, CH-8038 Zurich Phone +41 44 485 60 60
Fax +41 44 485 60 68
[email protected], www.inout.ch
Page 1 of 21 In der vollvirtualisierten IBM
In&Out AG IBM AIX Power vs. LINUX x86 An in-practice comparison of core applications in banking and insurance environments
Version 1.01 Page 2 of 21
Preface
The study on hand was carried out on behalf of IBM. In&Out, as an independent consultancy, en-sures that there was no influence on the results of the study from IBM’s side and that the results were obtained independently. There is no financial connection between In&Out and IBM.
Introduction
Very often in the banking and insurance environments in particular, the central applications such as Adcubum Syrius, Avaloq, Finnova or Temenos T24 run on Unix-based sys-tems on RISC CPUs.
Discussions are increasingly taking place in these areas as to whether the Unix-based systems should be replaced by industry standard solutions on an x86 basis. Here costs of-ten play a decisive role, although frequently only the invest-ment costs for the processing power are compared, without aspects such as over-provisioning through virtualization, flexibility, stability and license costs being taken into ac-count.
IBM has commissioned In&Out as an independent consulting firm to undertake a comprehensive in-practice comparison of UNIX systems with RISC CPUs and LINUX systems with x86 CPUs, taking into account all the relevant de facto cost aspects. In so doing, current IBM systems on POWER7+ RISC basis (pSeries p770) and on x86 basis (xSeries x3650) will be compared with each other.
In&Out AG has many years of proven experience in architecture, design, engineering, implementation, oper-ation and tuning of system platforms for banks and insurance companies.
Management Summary
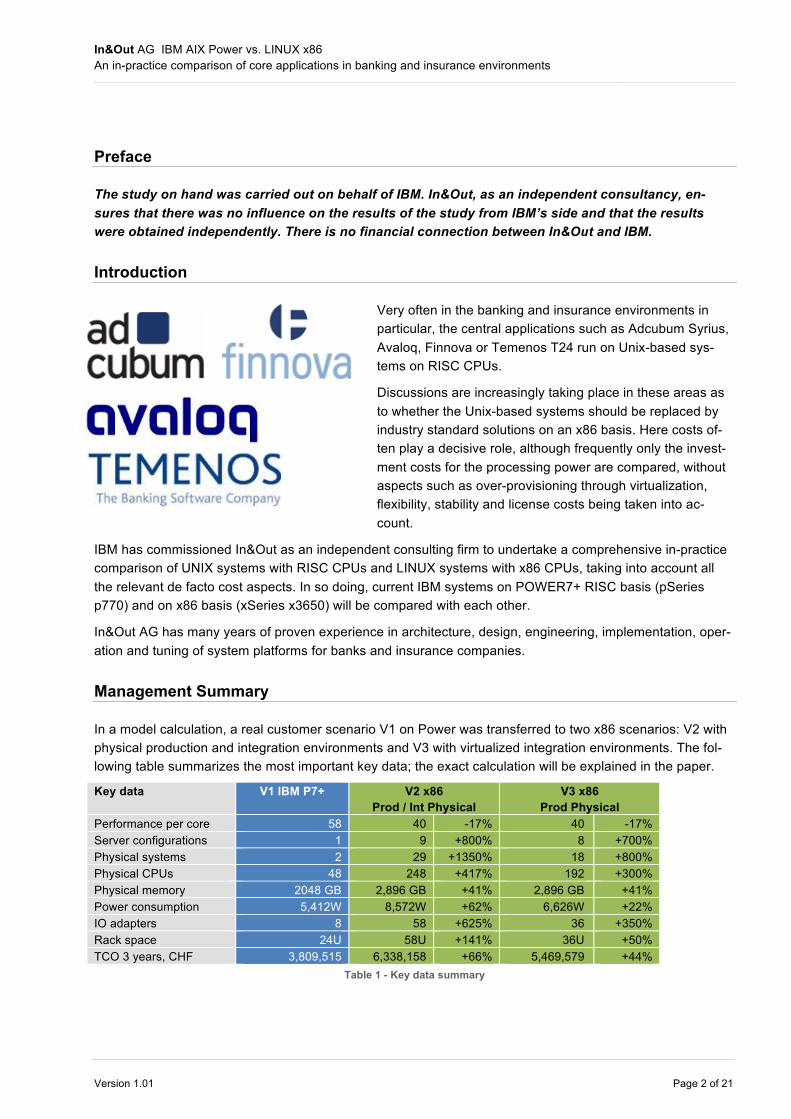
In a model calculation, a real customer scenario V1 on Power was transferred to two x86 scenarios: V2 with physical production and integration environments and V3 with virtualized integration environments. The fol-lowing table summarizes the most important key data; the exact calculation will be explained in the paper.
Key data V1 IBM P7+ V2 x86 Prod / Int Physical
V3 x86 Prod Physical
Performance per core 58 40 -17% 40 -17% Server configurations 1 9 +800% 8 +700% Physical systems 2 29 +1350% 18 +800% Physical CPUs 48 248 +417% 192 +300% Physical memory 2048 GB 2,896 GB +41% 2,896 GB +41% Power consumption 5,412W 8,572W +62% 6,626W +22% IO adapters 8 58 +625% 36 +350% Rack space 24U 58U +141% 36U +50% TCO 3 years, CHF 3,809,515 6,338,158 +66% 5,469,579 +44%
Table 1 - Key data summary
In&Out AG IBM AIX Power vs. LINUX x86 An in-practice comparison of core applications in banking and insurance environments
Version 1.01 Page 3 of 21
Resource requirement is significantly less due to efficient virtualization in the Power environment. The stable and established IBM Power platform is therefore, despite massively higher hardware costs, the less costly in a comprehensive TCO calculation. Furthermore, the decision for either Power or Linux should not be a pure-ly cost driven decision, but rather a strategic one.
Starting point
Since the 90s, company-critical applications have increasingly been migrated from host-based systems or AS400 systems to Unix systems, which thereby emerged from their niche of special applications and work stations and made their way into the data center.
In addition to the pure Unix derivatives, a Unix-like system with the same interfaces and processes was de-veloped on a new code base from Linus Torvalds and an increasingly large developer community: Linux. What is special about Linux is that it is open source and available in numerous distributions from a myriad of providers such as RedHat, Suse, Sun/Oracle, etc. There are also specially adapted variants of Linux, for example Linux for IBM POWER or zLinux for host systems. However, Linux runs predominantly on industry standard x86 processors from Intel or AMD.
Since the middle of the 00s, Linux has been competing increasingly with Unix systems in the area of compa-ny-critical applications and is growing at the expense of the Unix-based systems.
Market share
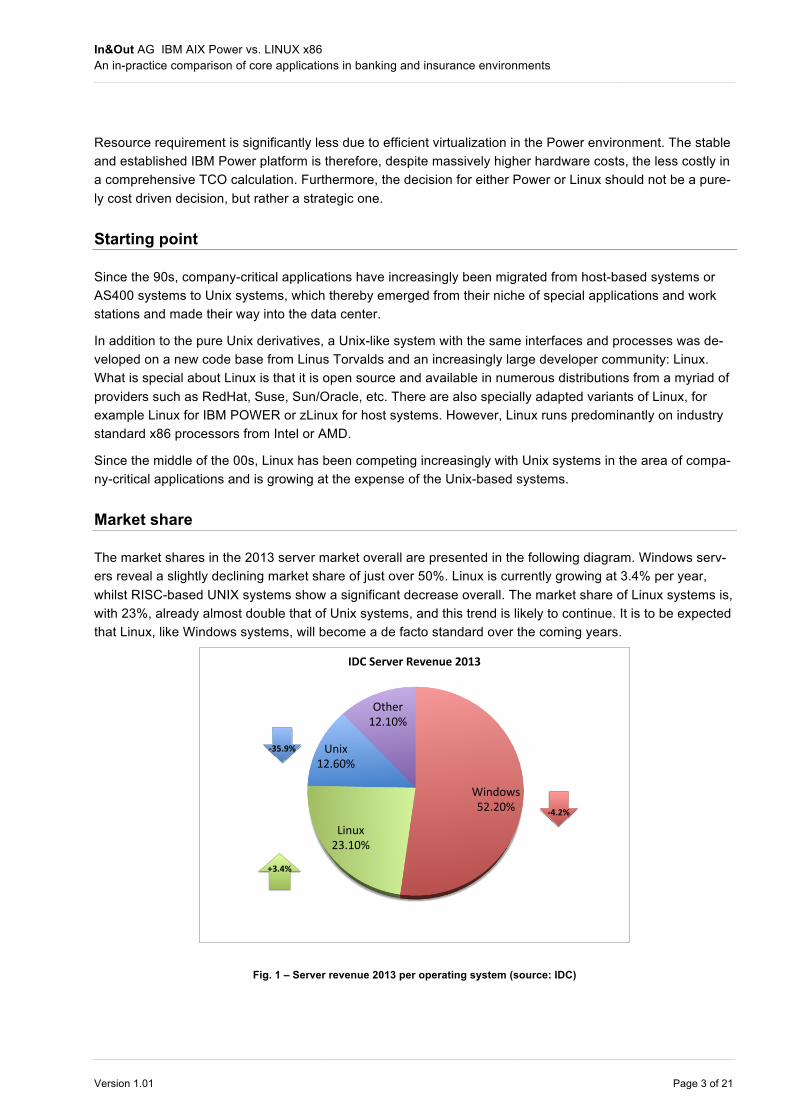
The market shares in the 2013 server market overall are presented in the following diagram. Windows serv-ers reveal a slightly declining market share of just over 50%. Linux is currently growing at 3.4% per year, whilst RISC-based UNIX systems show a significant decrease overall. The market share of Linux systems is, with 23%, already almost double that of Unix systems, and this trend is likely to continue. It is to be expected that Linux, like Windows systems, will become a de facto standard over the coming years.
Windows(52.20%(
Linux(23.10%(
Unix(12.60%(
Other(12.10%(
IDC$Server$Revenue$2013$
+3.4%$
44.2%$
435.9%$
Fig. 1 – Server revenue 2013 per operating system (source: IDC)
In&Out AG IBM AIX Power vs. LINUX x86 An in-practice comparison of core applications in banking and insurance environments
Version 1.01 Page 4 of 21
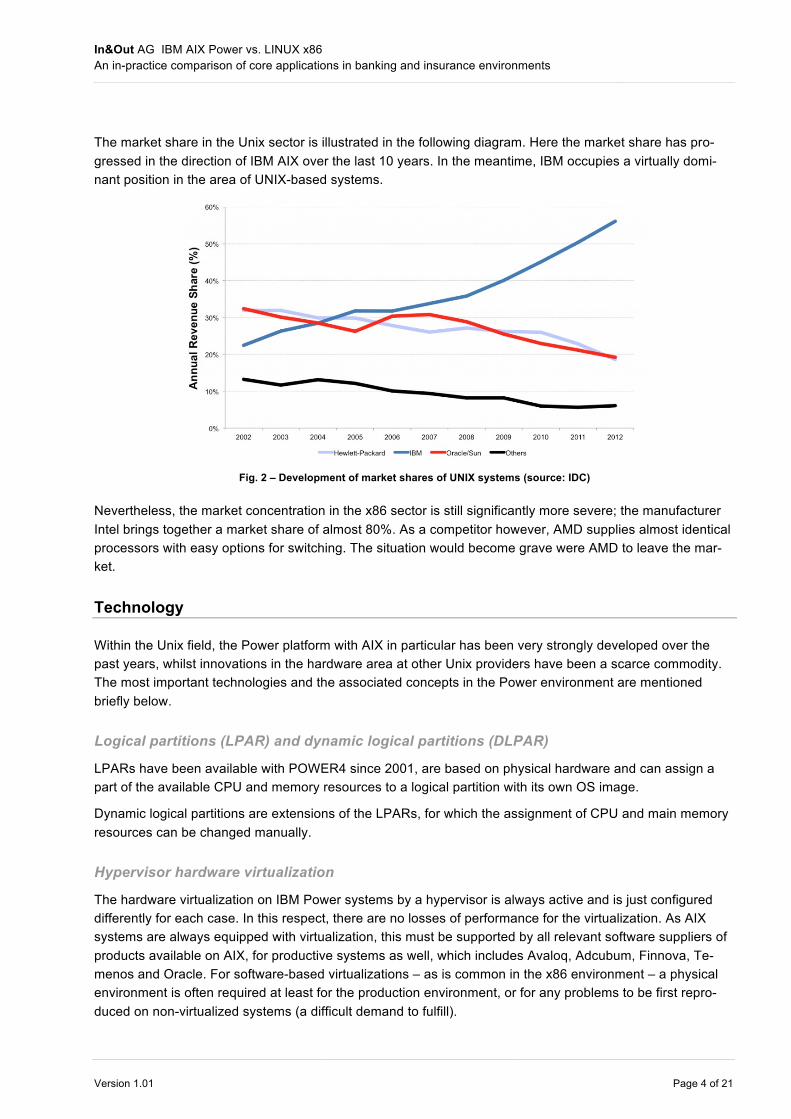
The market share in the Unix sector is illustrated in the following diagram. Here the market share has pro-gressed in the direction of IBM AIX over the last 10 years. In the meantime, IBM occupies a virtually domi-nant position in the area of UNIX-based systems.
Fig. 2 – Development of market shares of UNIX systems (source: IDC)
Nevertheless, the market concentration in the x86 sector is still significantly more severe; the manufacturer Intel brings together a market share of almost 80%. As a competitor however, AMD supplies almost identical processors with easy options for switching. The situation would become grave were AMD to leave the mar-ket.
Technology
Within the Unix field, the Power platform with AIX in particular has been very strongly developed over the past years, whilst innovations in the hardware area at other Unix providers have been a scarce commodity. The most important technologies and the associated concepts in the Power environment are mentioned briefly below.
Logical partitions (LPAR) and dynamic logical partitions (DLPAR)
LPARs have been available with POWER4 since 2001, are based on physical hardware and can assign a part of the available CPU and memory resources to a logical partition with its own OS image.
Dynamic logical partitions are extensions of the LPARs, for which the assignment of CPU and main memory resources can be changed manually.
Hypervisor hardware virtualization
The hardware virtualization on IBM Power systems by a hypervisor is always active and is just configured differently for each case. In this respect, there are no losses of performance for the virtualization. As AIX systems are always equipped with virtualization, this must be supported by all relevant software suppliers of products available on AIX, for productive systems as well, which includes Avaloq, Adcubum, Finnova, Te-menos and Oracle. For software-based virtualizations – as is common in the x86 environment – a physical environment is often required at least for the production environment, or for any problems to be first repro-duced on non-virtualized systems (a difficult demand to fulfill).
In&Out AG IBM AIX Power vs. LINUX x86 An in-practice comparison of core applications in banking and insurance environments
Version 1.01 Page 5 of 21
Shared processor partitions
With shared processor partitions, CPU resources are not assigned as dedicated to an LPAR, but rather a guaranteed percentage of CPUs (entitled capacity, EC) and a maximum percentage of CPUs (virtual proces-sors, VP) are defined. The VPs can be up to factor 10 and from POWER7+ even factor 20 higher than the EC. Thereby, a partition can, for example, have 0.8 guaranteed CPUs and 16 virtual CPUs. The LPAR can therefore use up to 16 CPUs, but only 0.8 are actually „guaranteed“. The guaranteed CPUs are only as-signed when these are actually used; otherwise they are available for other LPARs. If not enough physical CPUs are available to cover the sum of demands of the virtual processors, the guaranteed capacity is dis-tributed and then the remaining capacity according to a per LPAR definable weighting. The CPU assignment is carried out by the hypervisor in sub-millisecond frequency.
Over-provisioning
Due to the diverse load peaks of the various LPARs at different times, it is normal to assign the physical CPUs multiple times, i.e. to over-commit. The relationship between virtual CPUs and physical CPUs is de-scribed as the over-provisioning factor. Theoretically, an over-provisioning up to factor 10 (from POWER7+ factor 20) is possible, as although the physical CPUs can only be allocated once as entitled capacity, the virtual processors can be up to factor 10 (from POWER7+ 20) higher. The more LPARs there are on a phys-ical system, the higher can be the selected over-provisioning. This is particularly true when LPARs with very different load requirements are operated together, e.g. many development and integration instances. There-fore, in a project environment, an over-provisioning of the physical CPUs by factor 5 and more is common, and in a productive environment a factor of 3-5 is realistic.
Shared processor pools
Since POWER6, so-called shared processor pools have been supported. An individual upper limit of CPUs can be specified for each shared processor pool. Each LPAR will be assigned to one pool. The hardware virtualization ensures that the sum of the CPUs for the LPARs in a pool never exceeds the defined upper limit. Thereby, for example, an Oracle DB pool and a WebLogic pool can be formed and only the configured CPUs need be licensed. This type of partitioning is accepted by the vast majority of software providers1 whilst software virtualizations such as VMware are generally not accepted, and so license costs for the entire physical system, and even a server grid, are incurred.
Simultaneous multithreading (SMT)
4-times multithreading per core has been supported since POWER7, i.e. 4 parallel threads in the form of logical CPUs are available per virtual processor. If a physical processor is assigned an LPAR, 4 threads can be handled there at the same time, whereby the throughput approximately doubles. It is expected that 8 threads per core will be available from POWER8.
1 It should be noted that, since the end of 2013, Oracle no longer accepts the combination of shared processor pools as „hard parti-
tioning“ in specific constellations when employing Live Partition Mobility (LPM). The reason could be that with LPM, you can shift an Oracle LPAR between different servers at all times (even online), and thereby all servers are basically subject to licensing. This is understandable in principle and has always been handled in this way for VMware with the employment of VMmotion. It is however not entirely understandable why LPM between two servers with, for example, one Oracle DB pool each, is problematic. Here we need to wait and see how this new regulation will be handled. For customers who in any case deploy only one software component per physical system (e.g. Oracle DBs), this does not matter. If several products are used on shared processor pools, it may be nec-essary to use physically separated systems instead of pools, which would definitively worsen the business case for Power systems as more physics would come into play and the over-provisioning could no longer be so distinctly driven.
In&Out AG IBM AIX Power vs. LINUX x86 An in-practice comparison of core applications in banking and insurance environments
Version 1.01 Page 6 of 21
Virtual IO server (VIO)
All IO adapters (Ethernet, SAN for storage and tape etc.) can either be made available dedicated to one LPAR or be shared by various LPARs via so-called VIOs. The VIOs can be set up with redundancy and channels can be bundled within the VIOs so that an optimal system stability and performance are guaran-teed. A Power system therefore only need be physically connected by cable once. Then, the storage objects (LUNs) or network segments will be configured on the VIOs per LPAR. Thereby, when creating a logical partition, no more physical cabling is required, which massively reduces the operating costs and execution time. A complete IO virtualization today is standard even for the largest environments with Power systems.
Advanced Memory Expansion (AME)
With POWER7, the AME also specifically addressed the resource main memory. Until now, primarily the CPU resources could be easily virtualized and over-provisioned, but the main memory however was as-signed dedicated to the individual LPARs. This does not change with AME, but the memory can be com-pressed online. A compromise between the compression factor and the resultant CPU load needs to be found here. Compression up to factor 2 can be achieved without significant CPU load for example for DB servers. With a compression factor of 2 and the employment of 50 GB physical memory, there are actually 100 GB of main memory available to the applications. It makes no sense to employ AME for systems with extremely high memory through-put (e.g. web application servers) or for systems that already undertake alternative compression, e.g. Oracle Basic or Advanced Compression. The AME hardware accelerator has been available since POWER7+, which again greatly reduces the CPU load for the compression.
Oracle Benchmarks with the In&Out Oracle Benchmark Suite OraBench (www.orabench.ch) on POWER7 systems without hardware acceleration have shown no performance impact with AME compression factor 1.5 with a very slight additional CPU load through AME. IBM internal tests with POWER7 and Oracle without hardware acceleration show only a slight performance impact (<10%) with an AME factor 3 for 7% higher CPU usage2.
Therefore, the AME either helps to reduce the required main memory, or to provide the applications with more (compressed) main memory and thereby to achieve acceleration.
Active Memory Sharing (AMS)
PowerVM Active Memory Sharing (AMS) was introduced as an advanced storage virtualization technology with POWER6. AMS can shift the physical RAM from one partition to another using intelligent algorithms so that greater utilization and flexibility in the memory area can be achieved. Several AIX LPARs can share a joint storage pool thanks to this memory virtualization function. PowerVM automatically allocates the neces-sary memory to the individual partitions according to need. The currently unused or only slightly used memory segments will be moved onto a paging device if necessary. This procedure is especially suitable for occasionally used development and integration environments, but less so for productive systems.
2 Link: https://www-950.ibm.com/events/wwe/grp/grp024.nsf/vLookupPDFs/Printemps%20de%20la%20TPrintemps%20de%20la%20Technologie%202013%20S.%20Chabrolles/$file/Printemps%20de%20la%20TPrintemps%20de%20la%20Technologie%202013%20S.%20Chabrolles.pdf, Slide 35
In&Out AG IBM AIX Power vs. LINUX x86 An in-practice comparison of core applications in banking and insurance environments
Version 1.01 Page 7 of 21
Stability / RAS
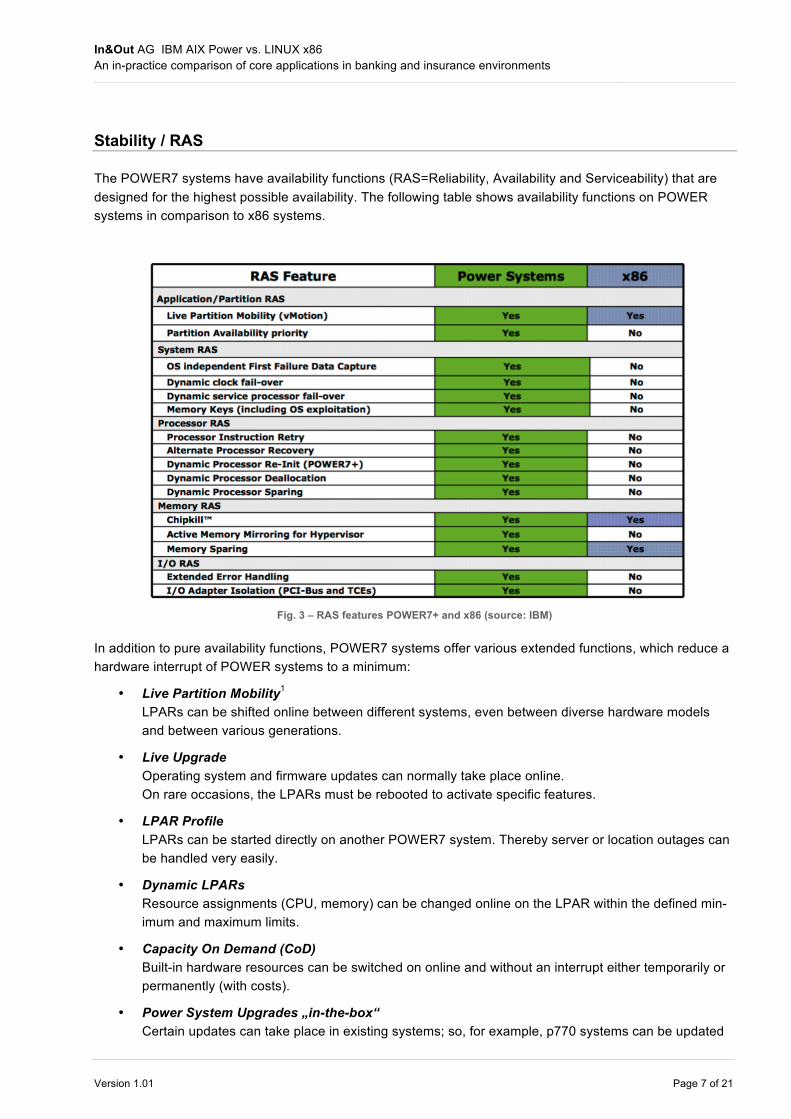
The POWER7 systems have availability functions (RAS=Reliability, Availability and Serviceability) that are designed for the highest possible availability. The following table shows availability functions on POWER systems in comparison to x86 systems.
Fig. 3 – RAS features POWER7+ and x86 (source: IBM)
In addition to pure availability functions, POWER7 systems offer various extended functions, which reduce a hardware interrupt of POWER systems to a minimum:
• Live Partition Mobility1 LPARs can be shifted online between different systems, even between diverse hardware models and between various generations.
• Live Upgrade Operating system and firmware updates can normally take place online. On rare occasions, the LPARs must be rebooted to activate specific features.
• LPAR Profile LPARs can be started directly on another POWER7 system. Thereby server or location outages can be handled very easily.
• Dynamic LPARs Resource assignments (CPU, memory) can be changed online on the LPAR within the defined min-imum and maximum limits.
• Capacity On Demand (CoD) Built-in hardware resources can be switched on online and without an interrupt either temporarily or permanently (with costs).
• Power System Upgrades „in-the-box“ Certain updates can take place in existing systems; so, for example, p770 systems can be updated
In&Out AG IBM AIX Power vs. LINUX x86 An in-practice comparison of core applications in banking and insurance environments
Version 1.01 Page 8 of 21
„in-the-box“ from POWER7 to POWER7+ with minimal downtime. However, this is not possible for certain generation changes; the upgrade from POWER7+ to POWER8 is not possible „in-the-box“. Nevertheless, partitions of POWER7+ systems can be shifted to POWER8 systems (even online) through Live Partition Mobility. These LPARs then run in POWER7 mode. Following a reboot, they start in POWER8 mode.
Availability
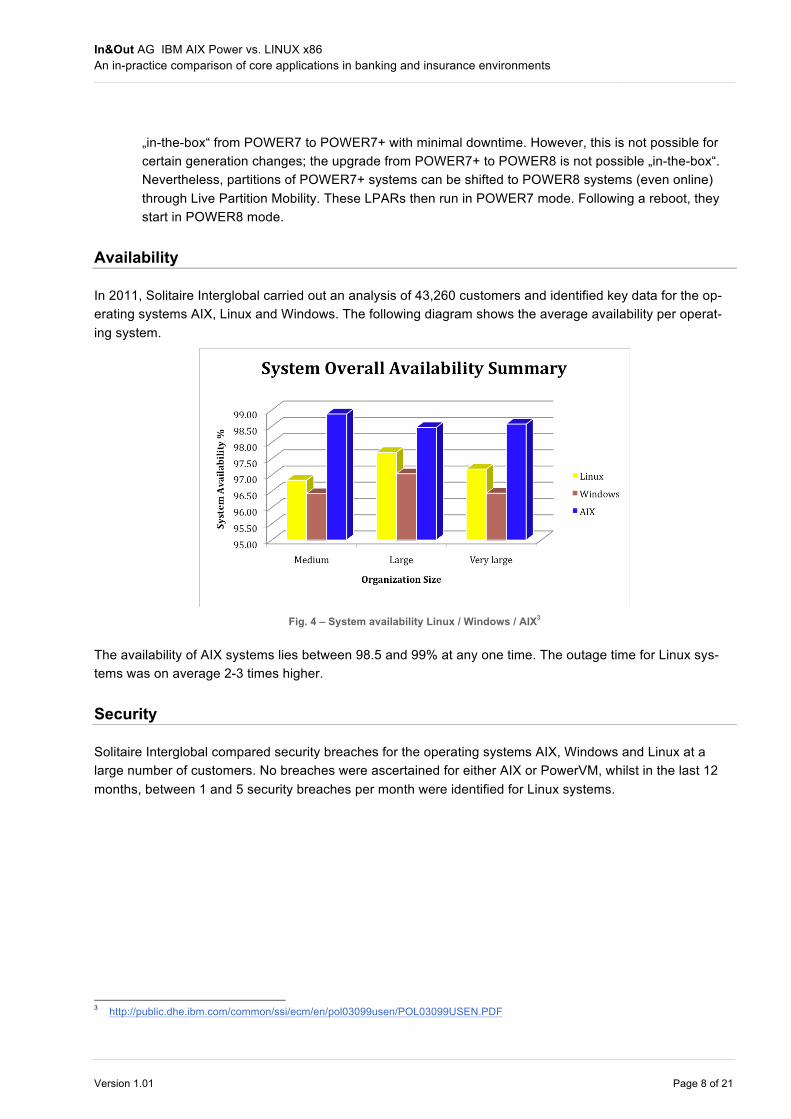
In 2011, Solitaire Interglobal carried out an analysis of 43,260 customers and identified key data for the op-erating systems AIX, Linux and Windows. The following diagram shows the average availability per operat-ing system.
Fig. 4 – System availability Linux / Windows / AIX3
The availability of AIX systems lies between 98.5 and 99% at any one time. The outage time for Linux sys-tems was on average 2-3 times higher.
Security
Solitaire Interglobal compared security breaches for the operating systems AIX, Windows and Linux at a large number of customers. No breaches were ascertained for either AIX or PowerVM, whilst in the last 12 months, between 1 and 5 security breaches per month were identified for Linux systems.
3 http://public.dhe.ibm.com/common/ssi/ecm/en/pol03099usen/POL03099USEN.PDF
In&Out AG IBM AIX Power vs. LINUX x86 An in-practice comparison of core applications in banking and insurance environments
Version 1.01 Page 9 of 21
Fig. 5 – Security breaches Linux / Windows / AIX3
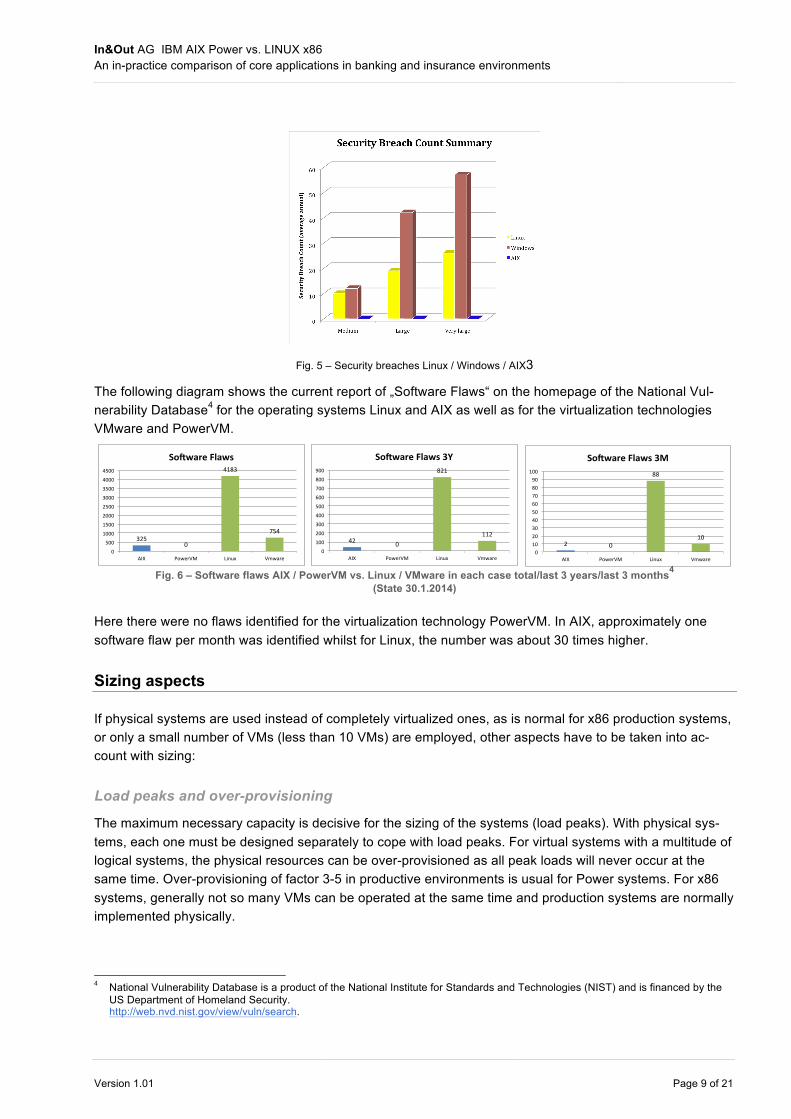
The following diagram shows the current report of „Software Flaws“ on the homepage of the National Vul-nerability Database4 for the operating systems Linux and AIX as well as for the virtualization technologies VMware and PowerVM.
325$0$
4183$
754$
0$
500$
1000$
1500$
2000$
2500$
3000$
3500$
4000$
4500$
AIX$ PowerVM$ Linux$ Vmware$
So#ware(Flaws(
42$ 0$
821$
112$
0$
100$
200$
300$
400$
500$
600$
700$
800$
900$
AIX$ PowerVM$ Linux$ Vmware$
So#ware(Flaws(3Y(
2$ 0$
88$
10$
0$10$20$30$40$50$60$70$80$90$
100$
AIX$ PowerVM$ Linux$ Vmware$
So#ware(Flaws(3M(
Fig. 6 – Software flaws AIX / PowerVM vs. Linux / VMware in each case total/last 3 years/last 3 months4
(State 30.1.2014)
Here there were no flaws identified for the virtualization technology PowerVM. In AIX, approximately one software flaw per month was identified whilst for Linux, the number was about 30 times higher.
Sizing aspects
If physical systems are used instead of completely virtualized ones, as is normal for x86 production systems, or only a small number of VMs (less than 10 VMs) are employed, other aspects have to be taken into ac-count with sizing:
Load peaks and over-provisioning
The maximum necessary capacity is decisive for the sizing of the systems (load peaks). With physical sys-tems, each one must be designed separately to cope with load peaks. For virtual systems with a multitude of logical systems, the physical resources can be over-provisioned as all peak loads will never occur at the same time. Over-provisioning of factor 3-5 in productive environments is usual for Power systems. For x86 systems, generally not so many VMs can be operated at the same time and production systems are normally implemented physically.
4 National Vulnerability Database is a product of the National Institute for Standards and Technologies (NIST) and is financed by the
US Department of Homeland Security. http://web.nvd.nist.gov/view/vuln/search.
In&Out AG IBM AIX Power vs. LINUX x86 An in-practice comparison of core applications in banking and insurance environments
Version 1.01 Page 10 of 21
Growth reserve
Each system should have a growth reserve available in relation to the actual demand for CPUs and memory, so that increasing requirements do not necessitate an extension or even a change of hardware. This growth reserve cannot be divided for physical servers, but must be available, dedicated for each physical server. Hereafter we reckon with a moderate growth reserve of 30% for physical servers.
Server sizes
Generally there are only a few standard configurations employed in a company for the most commonly used server type, e.g. small/medium/large, otherwise daily operational handling is made unnecessarily more com-plicated. This leads to an inability to choose the exact resources required, but rather the next largest model, which results in additional hardware and software costs.
Utilization
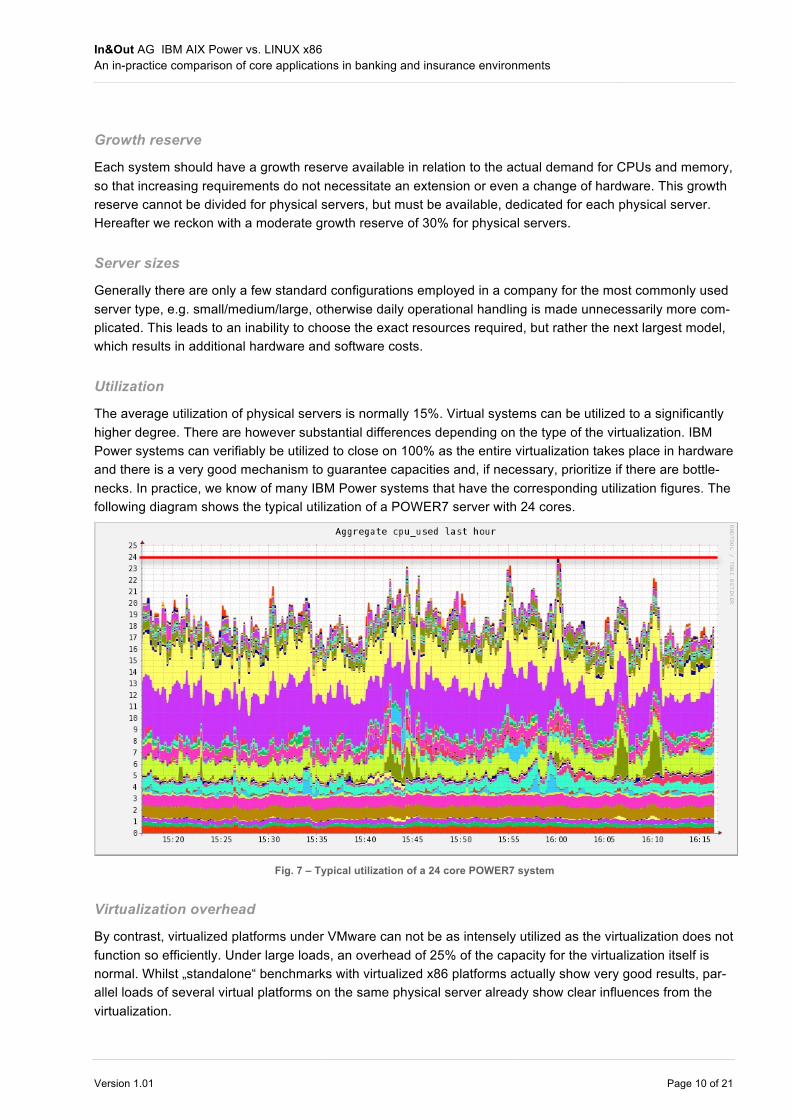
The average utilization of physical servers is normally 15%. Virtual systems can be utilized to a significantly higher degree. There are however substantial differences depending on the type of the virtualization. IBM Power systems can verifiably be utilized to close on 100% as the entire virtualization takes place in hardware and there is a very good mechanism to guarantee capacities and, if necessary, prioritize if there are bottle-necks. In practice, we know of many IBM Power systems that have the corresponding utilization figures. The following diagram shows the typical utilization of a POWER7 server with 24 cores.
Fig. 7 – Typical utilization of a 24 core POWER7 system
Virtualization overhead
By contrast, virtualized platforms under VMware can not be as intensely utilized as the virtualization does not function so efficiently. Under large loads, an overhead of 25% of the capacity for the virtualization itself is normal. Whilst „standalone“ benchmarks with virtualized x86 platforms actually show very good results, par-allel loads of several virtual platforms on the same physical server already show clear influences from the virtualization.
In&Out AG IBM AIX Power vs. LINUX x86 An in-practice comparison of core applications in banking and insurance environments
Version 1.01 Page 11 of 21
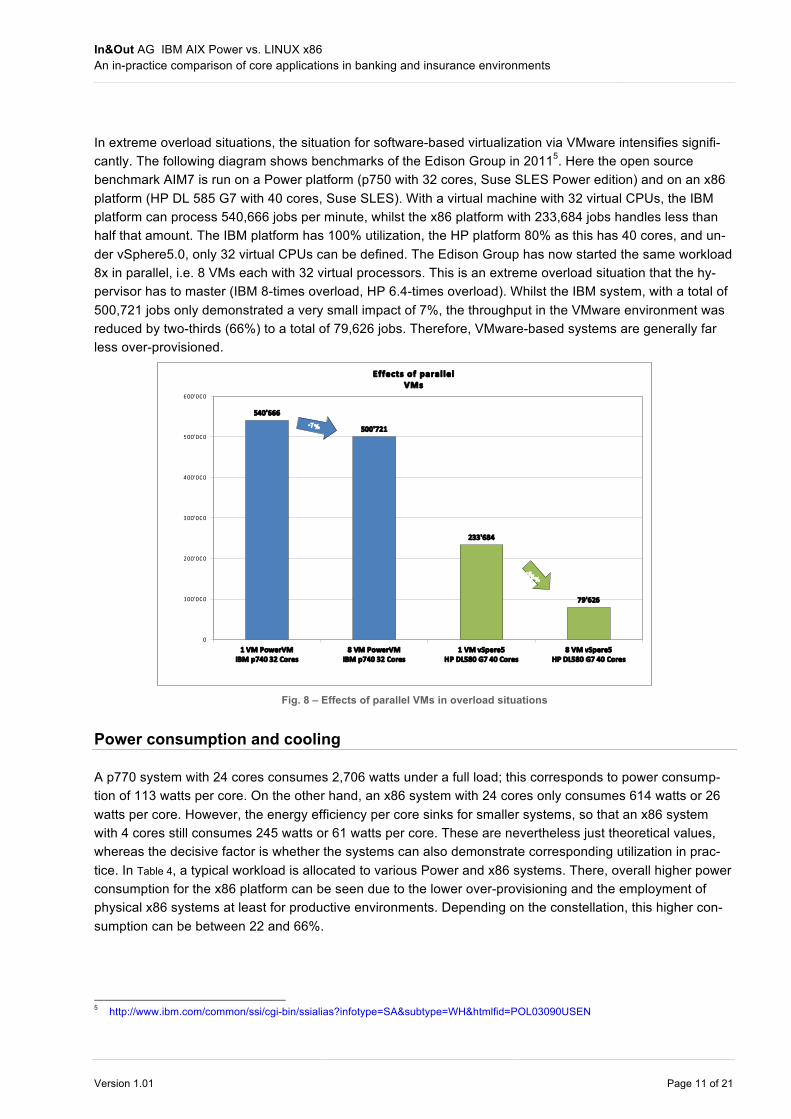
In extreme overload situations, the situation for software-based virtualization via VMware intensifies signifi-cantly. The following diagram shows benchmarks of the Edison Group in 20115. Here the open source benchmark AIM7 is run on a Power platform (p750 with 32 cores, Suse SLES Power edition) and on an x86 platform (HP DL 585 G7 with 40 cores, Suse SLES). With a virtual machine with 32 virtual CPUs, the IBM platform can process 540,666 jobs per minute, whilst the x86 platform with 233,684 jobs handles less than half that amount. The IBM platform has 100% utilization, the HP platform 80% as this has 40 cores, and un-der vSphere5.0, only 32 virtual CPUs can be defined. The Edison Group has now started the same workload 8x in parallel, i.e. 8 VMs each with 32 virtual processors. This is an extreme overload situation that the hy-pervisor has to master (IBM 8-times overload, HP 6.4-times overload). Whilst the IBM system, with a total of 500,721 jobs only demonstrated a very small impact of 7%, the throughput in the VMware environment was reduced by two-thirds (66%) to a total of 79,626 jobs. Therefore, VMware-based systems are generally far less over-provisioned.
Fig. 8 – Effects of parallel VMs in overload situations
Power consumption and cooling
A p770 system with 24 cores consumes 2,706 watts under a full load; this corresponds to power consump-tion of 113 watts per core. On the other hand, an x86 system with 24 cores only consumes 614 watts or 26 watts per core. However, the energy efficiency per core sinks for smaller systems, so that an x86 system with 4 cores still consumes 245 watts or 61 watts per core. These are nevertheless just theoretical values, whereas the decisive factor is whether the systems can also demonstrate corresponding utilization in prac-tice. In Table 4, a typical workload is allocated to various Power and x86 systems. There, overall higher power consumption for the x86 platform can be seen due to the lower over-provisioning and the employment of physical x86 systems at least for productive environments. Depending on the constellation, this higher con-sumption can be between 22 and 66%.
5 http://www.ibm.com/common/ssi/cgi-bin/ssialias?infotype=SA&subtype=WH&htmlfid=POL03090USEN
5 4 0 ' 6 6 6 5 0 0 ' 7 2 1
2 3 3 ' 6 8 4
7 9 ' 6 2 6
0
1 0 0 ' 0 0 0
2 0 0 ' 0 0 0
3 0 0 ' 0 0 0
4 0 0 ' 0 0 0
5 0 0 ' 0 0 0
6 0 0 ' 0 0 0
1 V M P o w e r V M I B M p 7 4 0 3 2 C o r e s
8 V M P o w e r V M I B M p 7 4 0 3 2 C o r e s
1 V M v S p e r e 5 H P D L 5 8 0 G 7 4 0 C o r e s
8 V M v S p e r e 5 H P D L 5 8 0 G 7 4 0 C o r e s
Effects of parallel VMs
- 7 %
- 6 6 %
In&Out AG IBM AIX Power vs. LINUX x86 An in-practice comparison of core applications in banking and insurance environments
Version 1.01 Page 12 of 21
Space requirement
The situation for space requirement is very similar. A p770 system equipped with a maximum of 48 cores needs 12 rack units in the server rack (12U), whilst an x86 system needs just 2U. In particular, the x86 serv-er with up to 24 cores is highly efficient for space with a space requirement of 2U. However, a system with 2 or 4 cores also needs 2U, whereby the space efficiency for the given capacity is worse than for Power sys-tems. For processing a typical workload as per Table 4, 2 p770s with a total of 24U or, depending on the spec-ification, 18 to 29 x86 systems with 36 to 58U are needed.
Operations
Basically, the operation of completely virtualized systems is significantly less costly than that of physical sys-tems. The more virtualized systems on a physical system, the lower the operational cost per virtual guest.
Moreover, virtual systems can be reconfigured and extended very quickly and flexibly. The costs of physical installations or cabling are dispensed with. A prioritized automatic resource allocation is also possible for Power systems.
Together with storage or server-based data mirroring and the option for starting profiles on all other physical systems, disaster prevention can be very easily implemented. Likewise, outages of individual servers can be obviated. This basically applies to all virtualized systems. In the x86 environment however, it is the produc-tive systems that are generally NOT virtualized, so that separate solutions must be established here.
Moreover, in the Power environment, a single point of failure can be eliminated very effectively and easily with redundant VIOs (Virtual IO servers), adapter failover across VIOs and the pairing of IO components. Additionally, this can occur automatically via the established clustering solution PowerHA.
In one of the two central data centers of the Raiffeisen group in St. Gallen, the DR solution based on IBM Power designed and implemented by In&Out underwent an extremely successful practical test. The data center was almost completely unusable due to water damage – thanks to the successful failover, the bank’s business remained completely unaffected6.
Concentration risk
With large systems with numerous productive applications a „concentration risk“ is specifically very often viewed as a problem for an outage of physical systems. This observation is basically appropriate, but from our point of view can be qualified through additional aspects.
Firstly, due to the RAS features, the high level of stability (see above) and the carrying out of online mainte-nance work and configuration changes the outage risk of a Power platform is significantly less than for an x86 standard industry solution, for which first and foremost a competitive price is what matters.
Secondly, a highly-consolidated platform has the advantage that high availability and disaster recovery can be designed and implemented holistically, i.e. ideally, there is the same solution for all systems. In the x86 environment with many servers, there is a great danger that this is „solved“ simply by keeping ready a few reserve systems and then restarting the systems following an outage. This leads to lengthy outage times if
6 http://www.tagblatt.ch/ostschweiz/stgallen/kantonstgallen/kantonstgallen/Raiffeisen-muss-mehrere-Wochen-auf-Server-
verzichten;art140,1254100 or http://www.inside-it.ch/articles/16757 http://www.polizeinews.ch/ostschweiz/Rohrbruch+im+Raiffeisengebaeude/372427/detail.htm
In&Out AG IBM AIX Power vs. LINUX x86 An in-practice comparison of core applications in banking and insurance environments
Version 1.01 Page 13 of 21
there are no accompanying measures, in particular for non-virtualized systems which cannot be easily start-ed on other physical servers.
Moreover, due to today’s strong networking of applications and their dependencies, the outage of a single system can result in many other systems no longer being (completely) functional. Therefore the use of smaller systems also result in implicit dependencies.
Performance comparison
SPEC
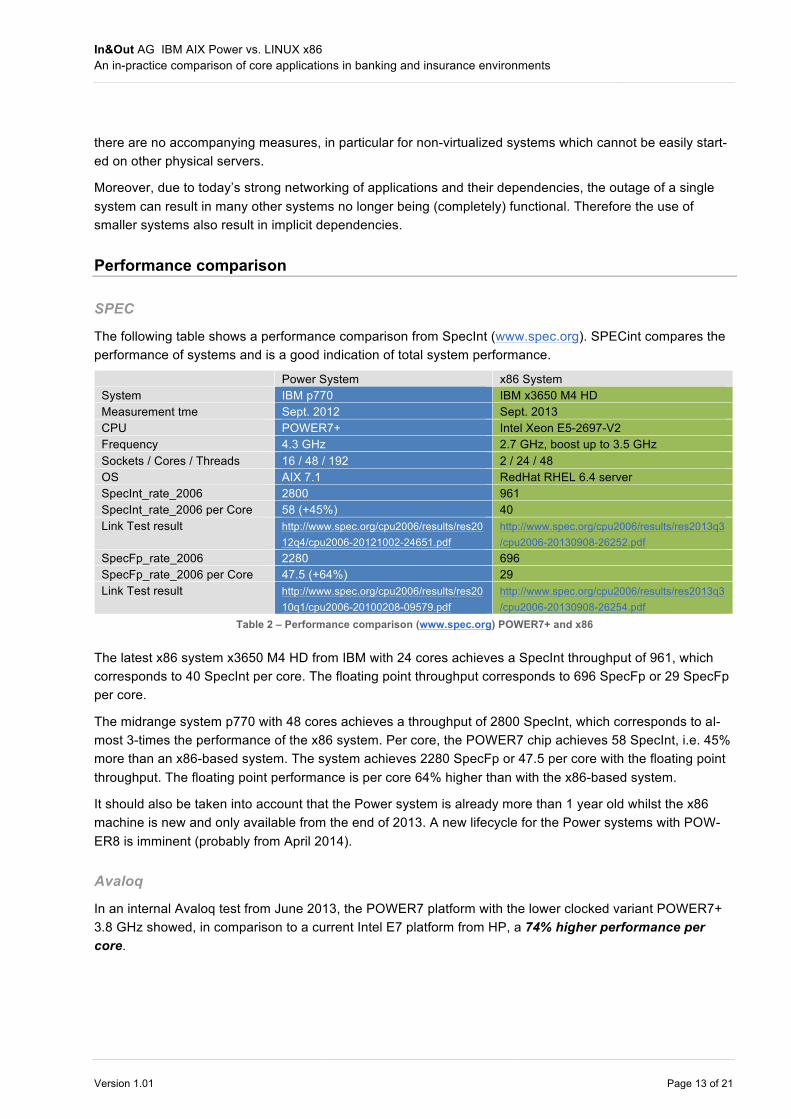
The following table shows a performance comparison from SpecInt (www.spec.org). SPECint compares the performance of systems and is a good indication of total system performance.
Power System x86 System System IBM p770 IBM x3650 M4 HD Measurement tme Sept. 2012 Sept. 2013 CPU POWER7+ Intel Xeon E5-2697-V2 Frequency 4.3 GHz 2.7 GHz, boost up to 3.5 GHz Sockets / Cores / Threads 16 / 48 / 192 2 / 24 / 48 OS AIX 7.1 RedHat RHEL 6.4 server SpecInt_rate_2006 2800 961 SpecInt_rate_2006 per Core 58 (+45%) 40 Link Test result http://www.spec.org/cpu2006/results/res20
12q4/cpu2006-20121002-24651.pdf http://www.spec.org/cpu2006/results/res2013q3/cpu2006-20130908-26252.pdf
SpecFp_rate_2006 2280 696 SpecFp_rate_2006 per Core 47.5 (+64%) 29 Link Test result http://www.spec.org/cpu2006/results/res20
10q1/cpu2006-20100208-09579.pdf http://www.spec.org/cpu2006/results/res2013q3/cpu2006-20130908-26254.pdf
Table 2 – Performance comparison (www.spec.org) POWER7+ and x86
The latest x86 system x3650 M4 HD from IBM with 24 cores achieves a SpecInt throughput of 961, which corresponds to 40 SpecInt per core. The floating point throughput corresponds to 696 SpecFp or 29 SpecFp per core.
The midrange system p770 with 48 cores achieves a throughput of 2800 SpecInt, which corresponds to al-most 3-times the performance of the x86 system. Per core, the POWER7 chip achieves 58 SpecInt, i.e. 45% more than an x86-based system. The system achieves 2280 SpecFp or 47.5 per core with the floating point throughput. The floating point performance is per core 64% higher than with the x86-based system.
It should also be taken into account that the Power system is already more than 1 year old whilst the x86 machine is new and only available from the end of 2013. A new lifecycle for the Power systems with POW-ER8 is imminent (probably from April 2014).
Avaloq
In an internal Avaloq test from June 2013, the POWER7 platform with the lower clocked variant POWER7+ 3.8 GHz showed, in comparison to a current Intel E7 platform from HP, a 74% higher performance per core.
In&Out AG IBM AIX Power vs. LINUX x86 An in-practice comparison of core applications in banking and insurance environments
Version 1.01 Page 14 of 21
Conclusion
From the successive observations, we assume that a POWER7+ core is 50% more efficient that an x86 core. This is an extremely conservative view. The additional CPU overhead arising from the software virtual-ization vSphere/VMware is not included.
Sizing and TCO – a comparison in practice
Two IBM p770 servers, on which 45 LPARs are operated, are employed in an actual project at a large health insurance company. Each server has 24 cores and 1 TB memory. In total, the 45 LPARs are assigned to 154 virtual cores, which corresponds to over-provisioning of factor 3.2 for the 48 available physical cores.
This workload is transferred to a calculation model on an x86 Linux configuration. Under x86 the productive systems were not virtualized as software virtualizations such as VMware are often not supported by the soft-ware providers for productive systems, in contrast to the hardware virtualized IBM LPARs. Generally, inte-gration systems are set up identically to production and would therefore also not be virtualized. We however also examine the variant whereby integration systems are virtualized as well. The following three variants are compared:
• V1: IBM POWER7+ p770, completely virtualized
• V2: IBM x86 x3650 M4 HD, Production and integration not virtualized, all other systems virtualized
• V3: IBM x86 x3650 M4 HD, Production not virtualized, all other systems virtualized
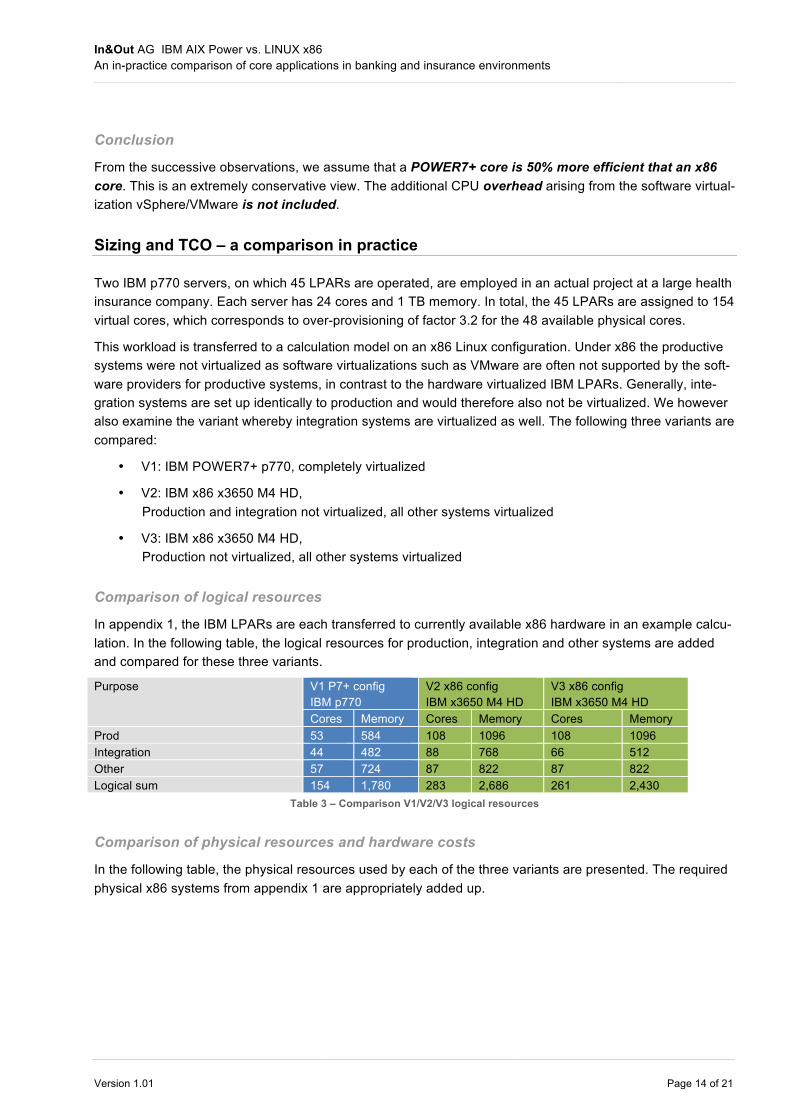
Comparison of logical resources
In appendix 1, the IBM LPARs are each transferred to currently available x86 hardware in an example calcu-lation. In the following table, the logical resources for production, integration and other systems are added and compared for these three variants.
Purpose V1 P7+ config IBM p770
V2 x86 config IBM x3650 M4 HD
V3 x86 config IBM x3650 M4 HD
Cores Memory Cores Memory Cores Memory Prod 53 584 108 1096 108 1096 Integration 44 482 88 768 66 512 Other 57 724 87 822 87 822 Logical sum 154 1,780 283 2,686 261 2,430
Table 3 – Comparison V1/V2/V3 logical resources
Comparison of physical resources and hardware costs
In the following table, the physical resources used by each of the three variants are presented. The required physical x86 systems from appendix 1 are appropriately added up.
In&Out AG IBM AIX Power vs. LINUX x86 An in-practice comparison of core applications in banking and insurance environments
Version 1.01 Page 15 of 21
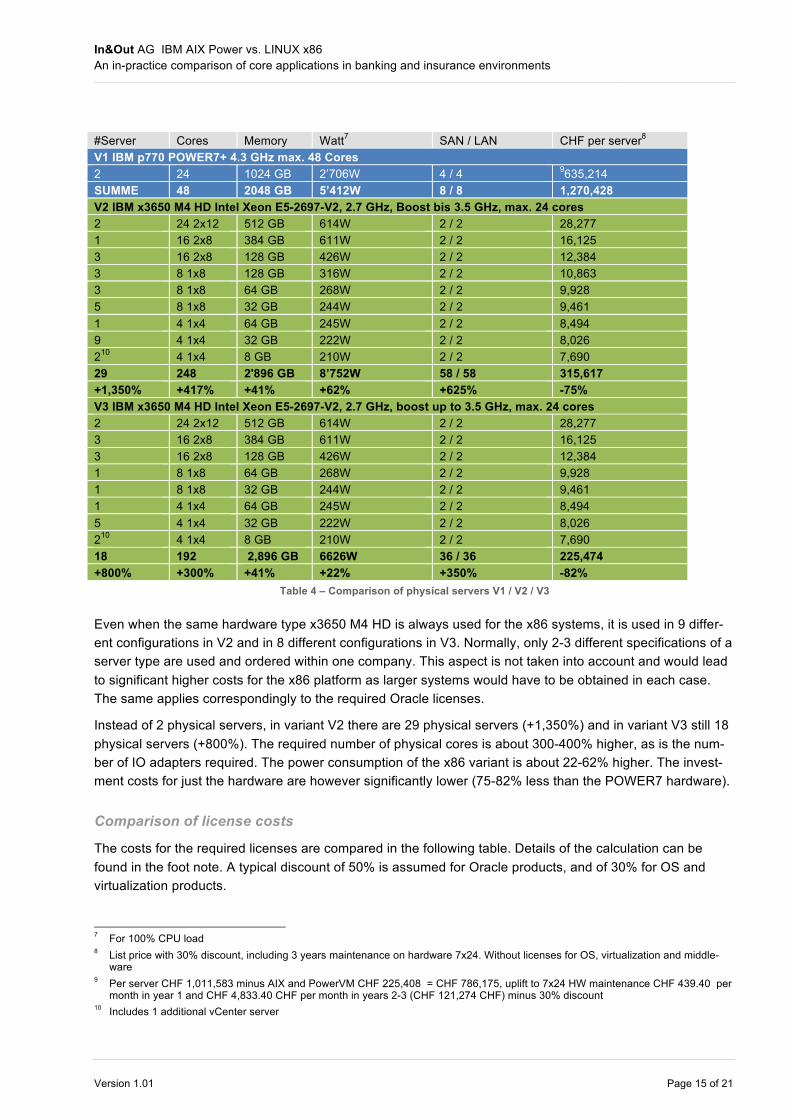
#Server Cores Memory Watt7 SAN / LAN CHF per server8 V1 IBM p770 POWER7+ 4.3 GHz max. 48 Cores 2 24 1024 GB 2’706W 4 / 4 9635,214 SUMME 48 2048 GB 5’412W 8 / 8 1,270,428 V2 IBM x3650 M4 HD Intel Xeon E5-2697-V2, 2.7 GHz, Boost bis 3.5 GHz, max. 24 cores 2 24 2x12 512 GB 614W 2 / 2 28,277 1 16 2x8 384 GB 611W 2 / 2 16,125 3 16 2x8 128 GB 426W 2 / 2 12,384 3 8 1x8 128 GB 316W 2 / 2 10,863 3 8 1x8 64 GB 268W 2 / 2 9,928 5 8 1x8 32 GB 244W 2 / 2 9,461 1 4 1x4 64 GB 245W 2 / 2 8,494 9 4 1x4 32 GB 222W 2 / 2 8,026 210 4 1x4 8 GB 210W 2 / 2 7,690 29 248 2'896 GB 8’752W 58 / 58 315,617 +1,350% +417% +41% +62% +625% -75% V3 IBM x3650 M4 HD Intel Xeon E5-2697-V2, 2.7 GHz, boost up to 3.5 GHz, max. 24 cores 2 24 2x12 512 GB 614W 2 / 2 28,277 3 16 2x8 384 GB 611W 2 / 2 16,125 3 16 2x8 128 GB 426W 2 / 2 12,384 1 8 1x8 64 GB 268W 2 / 2 9,928 1 8 1x8 32 GB 244W 2 / 2 9,461 1 4 1x4 64 GB 245W 2 / 2 8,494 5 4 1x4 32 GB 222W 2 / 2 8,026 210 4 1x4 8 GB 210W 2 / 2 7,690 18 192 2,896 GB 6626W 36 / 36 225,474 +800% +300% +41% +22% +350% -82%
Table 4 – Comparison of physical servers V1 / V2 / V3
Even when the same hardware type x3650 M4 HD is always used for the x86 systems, it is used in 9 differ-ent configurations in V2 and in 8 different configurations in V3. Normally, only 2-3 different specifications of a server type are used and ordered within one company. This aspect is not taken into account and would lead to significant higher costs for the x86 platform as larger systems would have to be obtained in each case. The same applies correspondingly to the required Oracle licenses.
Instead of 2 physical servers, in variant V2 there are 29 physical servers (+1,350%) and in variant V3 still 18 physical servers (+800%). The required number of physical cores is about 300-400% higher, as is the num-ber of IO adapters required. The power consumption of the x86 variant is about 22-62% higher. The invest-ment costs for just the hardware are however significantly lower (75-82% less than the POWER7 hardware).
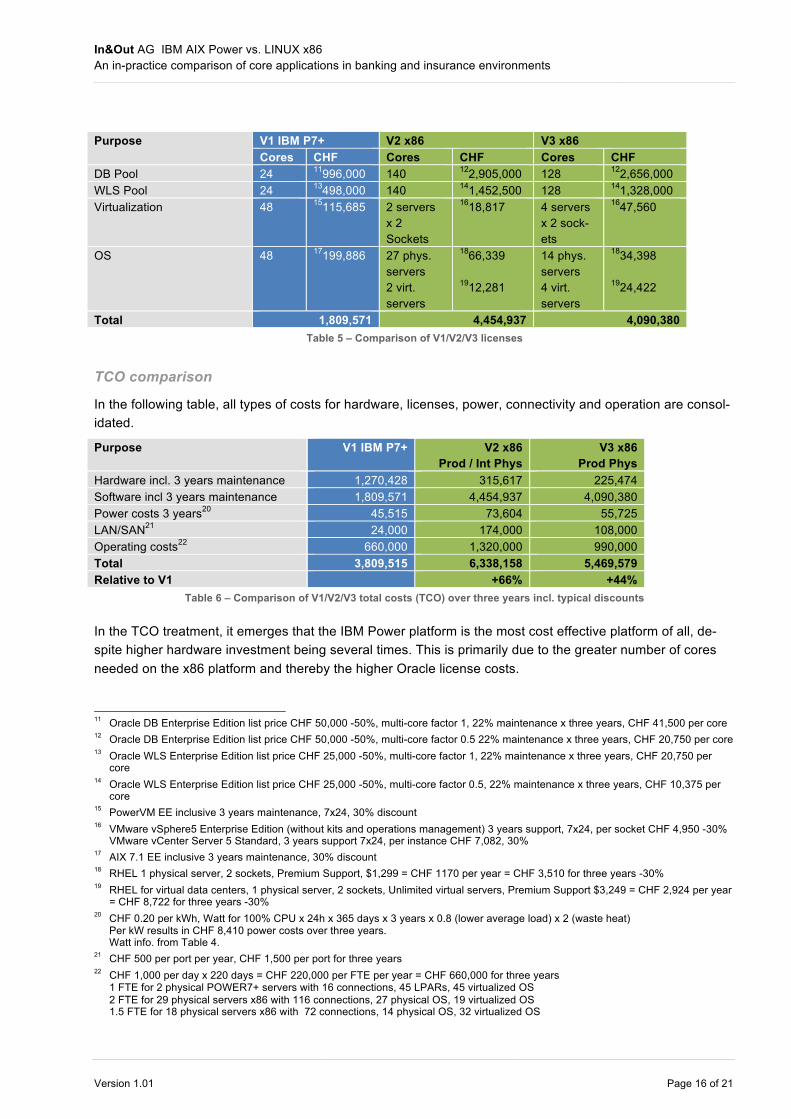
Comparison of license costs
The costs for the required licenses are compared in the following table. Details of the calculation can be found in the foot note. A typical discount of 50% is assumed for Oracle products, and of 30% for OS and virtualization products.
7 For 100% CPU load 8 List price with 30% discount, including 3 years maintenance on hardware 7x24. Without licenses for OS, virtualization and middle-
ware 9 Per server CHF 1,011,583 minus AIX and PowerVM CHF 225,408 = CHF 786,175, uplift to 7x24 HW maintenance CHF 439.40 per
month in year 1 and CHF 4,833.40 CHF per month in years 2-3 (CHF 121,274 CHF) minus 30% discount 10 Includes 1 additional vCenter server
In&Out AG IBM AIX Power vs. LINUX x86 An in-practice comparison of core applications in banking and insurance environments
Version 1.01 Page 16 of 21
Purpose V1 IBM P7+ V2 x86 V3 x86 Cores CHF Cores CHF Cores CHF
DB Pool 24 11996,000 140 122,905,000 128 122,656,000 WLS Pool 24 13498,000 140 141,452,500 128 141,328,000 Virtualization 48 15115,685 2 servers
x 2 Sockets
1618,817 4 servers x 2 sock-ets
1647,560
OS 48 17199,886 27 phys. servers 2 virt. servers
1866,339
1912,281
14 phys. servers 4 virt. servers
1834,398
1924,422
Total 1,809,571 4,454,937 4,090,380 Table 5 – Comparison of V1/V2/V3 licenses
TCO comparison
In the following table, all types of costs for hardware, licenses, power, connectivity and operation are consol-idated.
Purpose V1 IBM P7+ V2 x86 Prod / Int Phys
V3 x86 Prod Phys
Hardware incl. 3 years maintenance 1,270,428 315,617 225,474 Software incl 3 years maintenance 1,809,571 4,454,937 4,090,380 Power costs 3 years20 45,515 73,604 55,725 LAN/SAN21 24,000 174,000 108,000 Operating costs22 660,000 1,320,000 990,000 Total 3,809,515 6,338,158 5,469,579 Relative to V1 +66% +44%
Table 6 – Comparison of V1/V2/V3 total costs (TCO) over three years incl. typical discounts
In the TCO treatment, it emerges that the IBM Power platform is the most cost effective platform of all, de-spite higher hardware investment being several times. This is primarily due to the greater number of cores needed on the x86 platform and thereby the higher Oracle license costs.
11 Oracle DB Enterprise Edition list price CHF 50,000 -50%, multi-core factor 1, 22% maintenance x three years, CHF 41,500 per core 12 Oracle DB Enterprise Edition list price CHF 50,000 -50%, multi-core factor 0.5 22% maintenance x three years, CHF 20,750 per core 13 Oracle WLS Enterprise Edition list price CHF 25,000 -50%, multi-core factor 1, 22% maintenance x three years, CHF 20,750 per
core 14 Oracle WLS Enterprise Edition list price CHF 25,000 -50%, multi-core factor 0.5, 22% maintenance x three years, CHF 10,375 per
core 15 PowerVM EE inclusive 3 years maintenance, 7x24, 30% discount 16 VMware vSphere5 Enterprise Edition (without kits and operations management) 3 years support, 7x24, per socket CHF 4,950 -30%
VMware vCenter Server 5 Standard, 3 years support 7x24, per instance CHF 7,082, 30% 17 AIX 7.1 EE inclusive 3 years maintenance, 30% discount 18 RHEL 1 physical server, 2 sockets, Premium Support, $1,299 = CHF 1170 per year = CHF 3,510 for three years -30% 19 RHEL for virtual data centers, 1 physical server, 2 sockets, Unlimited virtual servers, Premium Support $3,249 = CHF 2,924 per year
= CHF 8,722 for three years -30% 20 CHF 0.20 per kWh, Watt for 100% CPU x 24h x 365 days x 3 years x 0.8 (lower average load) x 2 (waste heat)
Per kW results in CHF 8,410 power costs over three years. Watt info. from Table 4.
21 CHF 500 per port per year, CHF 1,500 per port for three years 22 CHF 1,000 per day x 220 days = CHF 220,000 per FTE per year = CHF 660,000 for three years
1 FTE for 2 physical POWER7+ servers with 16 connections, 45 LPARs, 45 virtualized OS 2 FTE for 29 physical servers x86 with 116 connections, 27 physical OS, 19 virtualized OS 1.5 FTE for 18 physical servers x86 with 72 connections, 14 physical OS, 32 virtualized OS
In&Out AG IBM AIX Power vs. LINUX x86 An in-practice comparison of core applications in banking and insurance environments
Version 1.01 Page 17 of 21
Furthermore, the connectivity costs in particular are significantly lower as the number of the HBA and LAN adapters is several times less for the virtualized IBM platform. Finally, there are lower operational costs to be borne due to the far lower number of physical servers. Moreover, this treatment is calculated rather conser-vatively in favor of the x86 systems.
The required floor space in the data center and the speed of implementing the demands are not taken into account. The Power platform is fully virtualized, for the x86 systems the production (and in variant V2 also the integration) are realized physically. Therefore, the required time for implementing new systems or exten-sions based on the order procedure are significantly longer for x86 systems.
SWOT
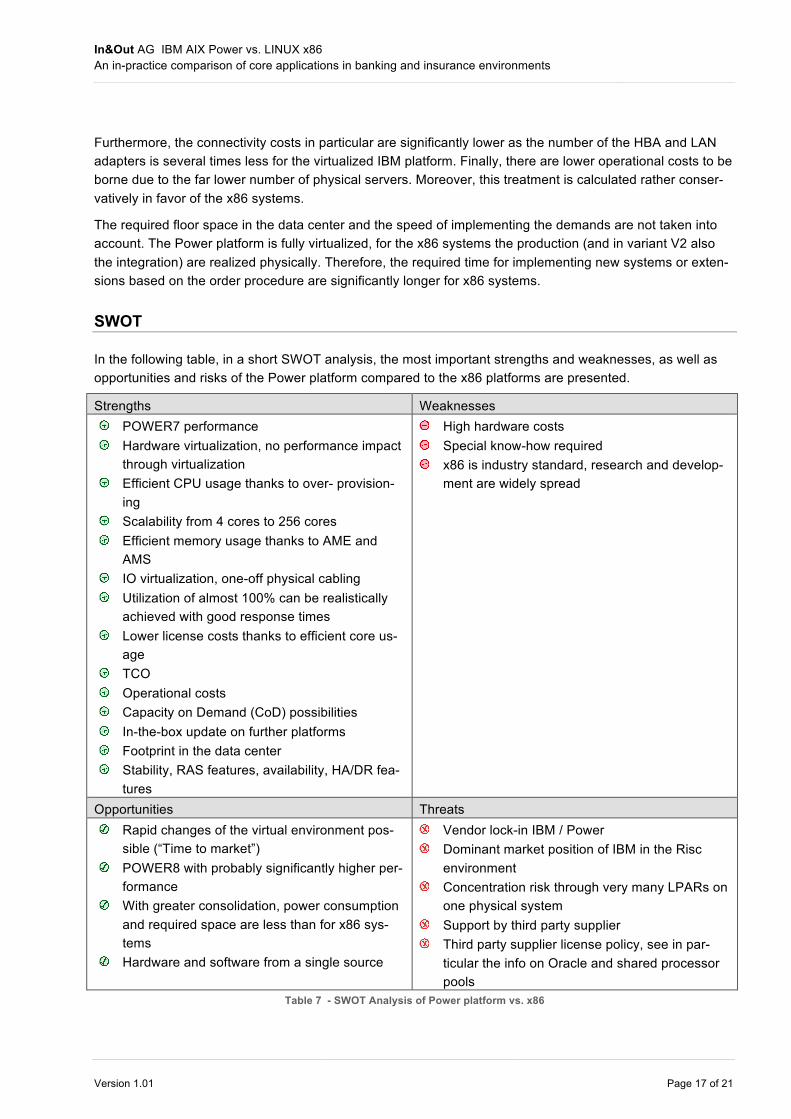
In the following table, in a short SWOT analysis, the most important strengths and weaknesses, as well as opportunities and risks of the Power platform compared to the x86 platforms are presented.
Strengths Weaknesses POWER7 performance Hardware virtualization, no performance impact
through virtualization Efficient CPU usage thanks to over- provision-
ing Scalability from 4 cores to 256 cores Efficient memory usage thanks to AME and
AMS IO virtualization, one-off physical cabling Utilization of almost 100% can be realistically
achieved with good response times Lower license costs thanks to efficient core us-
age TCO Operational costs Capacity on Demand (CoD) possibilities In-the-box update on further platforms Footprint in the data center Stability, RAS features, availability, HA/DR fea-
tures
High hardware costs Special know-how required x86 is industry standard, research and develop-
ment are widely spread
Opportunities Threats Rapid changes of the virtual environment pos-
sible (“Time to market”) POWER8 with probably significantly higher per-
formance With greater consolidation, power consumption
and required space are less than for x86 sys-tems
Hardware and software from a single source
Vendor lock-in IBM / Power Dominant market position of IBM in the Risc
environment Concentration risk through very many LPARs on
one physical system Support by third party supplier Third party supplier license policy, see in par-
ticular the info on Oracle and shared processor pools
Table 7 - SWOT Analysis of Power platform vs. x86
In&Out AG IBM AIX Power vs. LINUX x86 An in-practice comparison of core applications in banking and insurance environments
Version 1.01 Page 18 of 21
Conclusion
It is beyond dispute that today, AIX with POWER7 is the most efficient, and in particular with respect to virtu-alization, the most developed platform. This has most recently been shown by the development of the mar-ket share in the Unix environment.
The performance per core on POWER7+ is always significantly higher than on x86 industry standard sys-tems. The hardware prices of POWER7 are however, performance-adjusted, at least a factor 5 higher. The significantly more decisive factor is nevertheless the license costs for software products. Due to the ad-vanced virtualization and the higher over-provisioning of the Power platform, it offers massive advantages. Together with higher operational costs, the x86 platform has a 22 to 44% higher TCO, depending on the calculation model.
At the same time, the IBM Power platform is one of the most stable and reliable platforms of all, which the cost-optimized x86 standard server and Linux can currently not touch. Undoubtedly x86 / Linux will evolve to become the de facto industry standard.
Despite massively higher hardware costs, the stable and established IBM Power platform is not necessarily the most expensive platform – on the contrary, the aforementioned highly practice-oriented calculation shows TCO advantages for the IBM platform. Each customer should carry out a serious and comprehensive TCO calculation for himself. Moreover, the decision for or against Power or Linux should not be a cost-driven decision, but rather a strategic one.
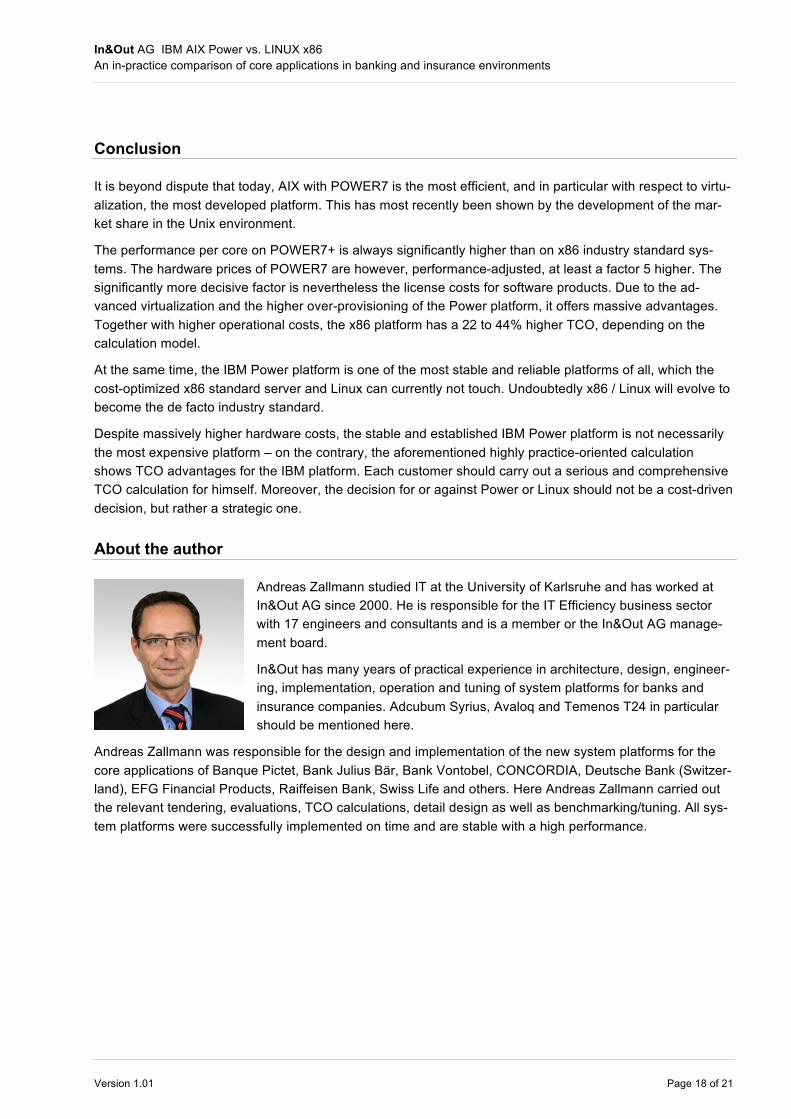
About the author
Andreas Zallmann studied IT at the University of Karlsruhe and has worked at In&Out AG since 2000. He is responsible for the IT Efficiency business sector with 17 engineers and consultants and is a member or the In&Out AG manage-ment board.
In&Out has many years of practical experience in architecture, design, engineer-ing, implementation, operation and tuning of system platforms for banks and insurance companies. Adcubum Syrius, Avaloq and Temenos T24 in particular should be mentioned here.
Andreas Zallmann was responsible for the design and implementation of the new system platforms for the core applications of Banque Pictet, Bank Julius Bär, Bank Vontobel, CONCORDIA, Deutsche Bank (Switzer-land), EFG Financial Products, Raiffeisen Bank, Swiss Life and others. Here Andreas Zallmann carried out the relevant tendering, evaluations, TCO calculations, detail design as well as benchmarking/tuning. All sys-tem platforms were successfully implemented on time and are stable with a high performance.
In&Out AG IBM AIX Power vs. LINUX x86 An in-practice comparison of core applications in banking and insurance environments
Version 1.01 Page 19 of 21
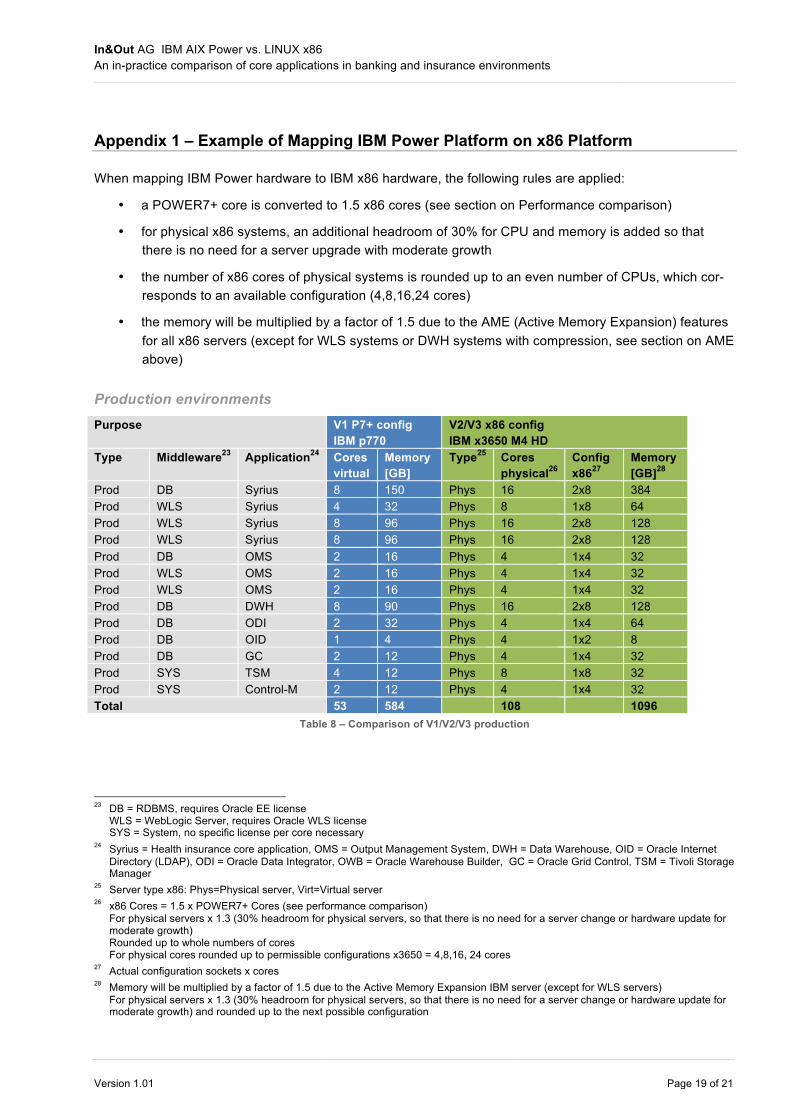
Appendix 1 – Example of Mapping IBM Power Platform on x86 Platform
When mapping IBM Power hardware to IBM x86 hardware, the following rules are applied:
• a POWER7+ core is converted to 1.5 x86 cores (see section on Performance comparison)
• for physical x86 systems, an additional headroom of 30% for CPU and memory is added so that there is no need for a server upgrade with moderate growth
• the number of x86 cores of physical systems is rounded up to an even number of CPUs, which cor-responds to an available configuration (4,8,16,24 cores)
• the memory will be multiplied by a factor of 1.5 due to the AME (Active Memory Expansion) features for all x86 servers (except for WLS systems or DWH systems with compression, see section on AME above)
Production environments Purpose V1 P7+ config
IBM p770 V2/V3 x86 config IBM x3650 M4 HD
Type Middleware23 Application24 Cores virtual
Memory [GB]
Type25 Cores physical26
Config x8627
Memory [GB]28
Prod DB Syrius 8 150 Phys 16 2x8 384 Prod WLS Syrius 4 32 Phys 8 1x8 64 Prod WLS Syrius 8 96 Phys 16 2x8 128 Prod WLS Syrius 8 96 Phys 16 2x8 128 Prod DB OMS 2 16 Phys 4 1x4 32 Prod WLS OMS 2 16 Phys 4 1x4 32 Prod WLS OMS 2 16 Phys 4 1x4 32 Prod DB DWH 8 90 Phys 16 2x8 128 Prod DB ODI 2 32 Phys 4 1x4 64 Prod DB OID 1 4 Phys 4 1x2 8 Prod DB GC 2 12 Phys 4 1x4 32 Prod SYS TSM 4 12 Phys 8 1x8 32 Prod SYS Control-M 2 12 Phys 4 1x4 32 Total 53 584 108 1096
Table 8 – Comparison of V1/V2/V3 production
23 DB = RDBMS, requires Oracle EE license
WLS = WebLogic Server, requires Oracle WLS license SYS = System, no specific license per core necessary
24 Syrius = Health insurance core application, OMS = Output Management System, DWH = Data Warehouse, OID = Oracle Internet Directory (LDAP), ODI = Oracle Data Integrator, OWB = Oracle Warehouse Builder, GC = Oracle Grid Control, TSM = Tivoli Storage Manager
25 Server type x86: Phys=Physical server, Virt=Virtual server 26 x86 Cores = 1.5 x POWER7+ Cores (see performance comparison)
For physical servers x 1.3 (30% headroom for physical servers, so that there is no need for a server change or hardware update for moderate growth) Rounded up to whole numbers of cores For physical cores rounded up to permissible configurations x3650 = 4,8,16, 24 cores
27 Actual configuration sockets x cores 28 Memory will be multiplied by a factor of 1.5 due to the Active Memory Expansion IBM server (except for WLS servers)
For physical servers x 1.3 (30% headroom for physical servers, so that there is no need for a server change or hardware update for moderate growth) and rounded up to the next possible configuration
In&Out AG IBM AIX Power vs. LINUX x86 An in-practice comparison of core applications in banking and insurance environments
Version 1.01 Page 20 of 21
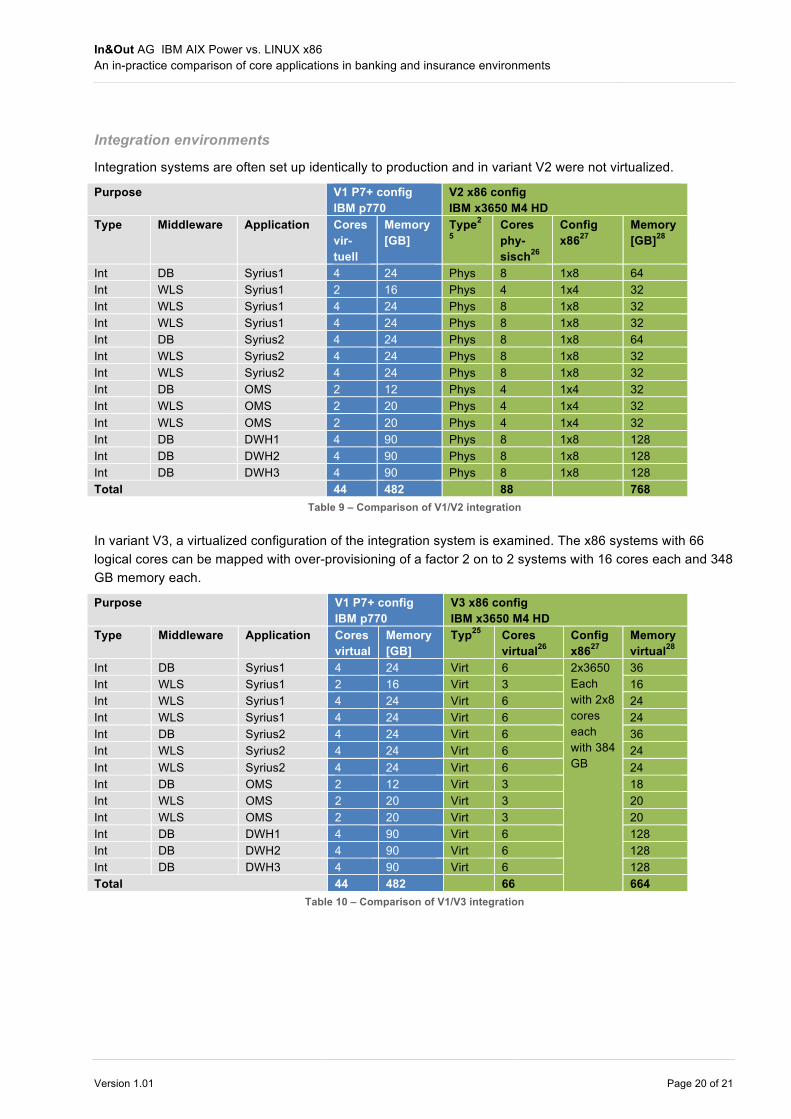
Integration environments
Integration systems are often set up identically to production and in variant V2 were not virtualized.
Purpose V1 P7+ config IBM p770
V2 x86 config IBM x3650 M4 HD
Type Middleware Application Cores vir-tuell
Memory [GB]
Type2
5 Cores phy-sisch26
Config x8627
Memory [GB]28
Int DB Syrius1 4 24 Phys 8 1x8 64 Int WLS Syrius1 2 16 Phys 4 1x4 32 Int WLS Syrius1 4 24 Phys 8 1x8 32 Int WLS Syrius1 4 24 Phys 8 1x8 32 Int DB Syrius2 4 24 Phys 8 1x8 64 Int WLS Syrius2 4 24 Phys 8 1x8 32 Int WLS Syrius2 4 24 Phys 8 1x8 32 Int DB OMS 2 12 Phys 4 1x4 32 Int WLS OMS 2 20 Phys 4 1x4 32 Int WLS OMS 2 20 Phys 4 1x4 32 Int DB DWH1 4 90 Phys 8 1x8 128 Int DB DWH2 4 90 Phys 8 1x8 128 Int DB DWH3 4 90 Phys 8 1x8 128 Total 44 482 88 768
Table 9 – Comparison of V1/V2 integration
In variant V3, a virtualized configuration of the integration system is examined. The x86 systems with 66 logical cores can be mapped with over-provisioning of a factor 2 on to 2 systems with 16 cores each and 348 GB memory each.
Purpose V1 P7+ config IBM p770
V3 x86 config IBM x3650 M4 HD
Type Middleware Application Cores virtual
Memory [GB]
Typ25 Cores virtual26
Config x8627
Memory virtual28
Int DB Syrius1 4 24 Virt 6 2x3650 Each with 2x8 cores each with 384 GB
36 Int WLS Syrius1 2 16 Virt 3 16 Int WLS Syrius1 4 24 Virt 6 24 Int WLS Syrius1 4 24 Virt 6 24 Int DB Syrius2 4 24 Virt 6 36 Int WLS Syrius2 4 24 Virt 6 24 Int WLS Syrius2 4 24 Virt 6 24 Int DB OMS 2 12 Virt 3 18 Int WLS OMS 2 20 Virt 3 20 Int WLS OMS 2 20 Virt 3 20 Int DB DWH1 4 90 Virt 6 128 Int DB DWH2 4 90 Virt 6 128 Int DB DWH3 4 90 Virt 6 128 Total 44 482 66 664
Table 10 – Comparison of V1/V3 integration
In&Out AG IBM AIX Power vs. LINUX x86 An in-practice comparison of core applications in banking and insurance environments
Version 1.01 Page 21 of 21
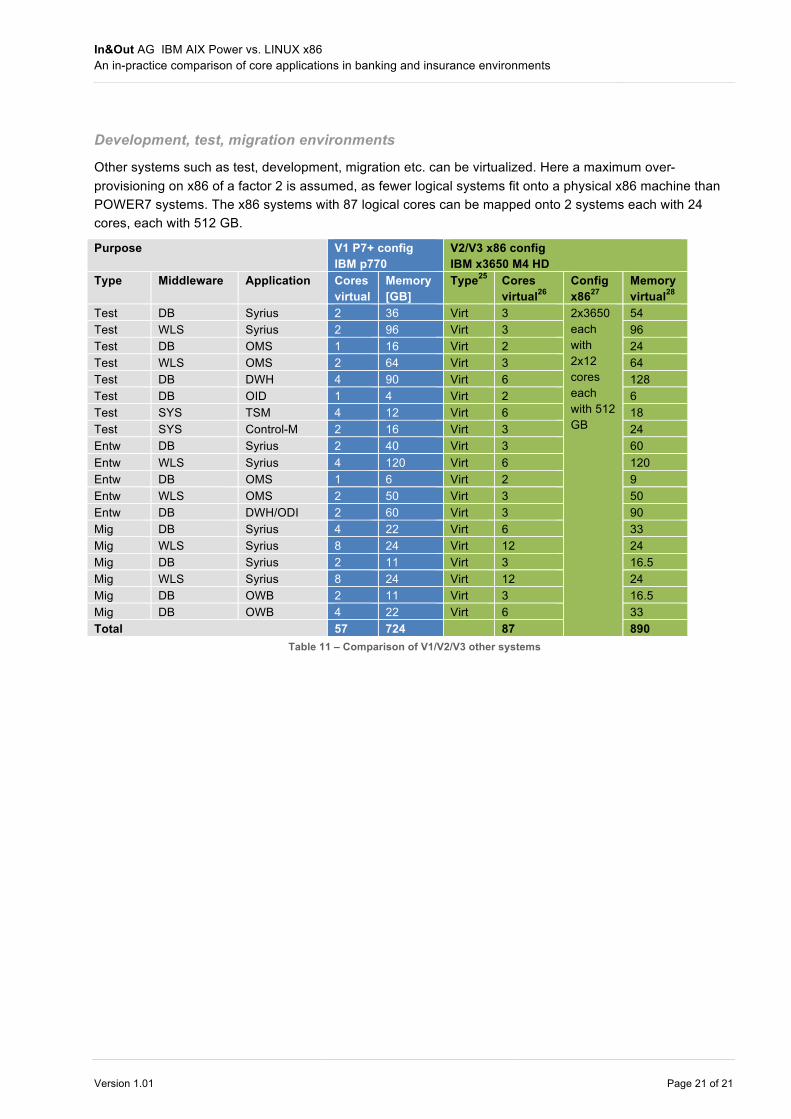
Development, test, migration environments
Other systems such as test, development, migration etc. can be virtualized. Here a maximum over-provisioning on x86 of a factor 2 is assumed, as fewer logical systems fit onto a physical x86 machine than POWER7 systems. The x86 systems with 87 logical cores can be mapped onto 2 systems each with 24 cores, each with 512 GB.
Purpose V1 P7+ config IBM p770
V2/V3 x86 config IBM x3650 M4 HD
Type Middleware Application Cores virtual
Memory [GB]
Type25 Cores virtual26
Config x8627
Memory virtual28
Test DB Syrius 2 36 Virt 3 2x3650 each with 2x12 cores each with 512 GB
54 Test WLS Syrius 2 96 Virt 3 96 Test DB OMS 1 16 Virt 2 24 Test WLS OMS 2 64 Virt 3 64 Test DB DWH 4 90 Virt 6 128 Test DB OID 1 4 Virt 2 6 Test SYS TSM 4 12 Virt 6 18 Test SYS Control-M 2 16 Virt 3 24 Entw DB Syrius 2 40 Virt 3 60 Entw WLS Syrius 4 120 Virt 6 120 Entw DB OMS 1 6 Virt 2 9 Entw WLS OMS 2 50 Virt 3 50 Entw DB DWH/ODI 2 60 Virt 3 90 Mig DB Syrius 4 22 Virt 6 33 Mig WLS Syrius 8 24 Virt 12 24 Mig DB Syrius 2 11 Virt 3 16.5 Mig WLS Syrius 8 24 Virt 12 24 Mig DB OWB 2 11 Virt 3 16.5 Mig DB OWB 4 22 Virt 6 33 Total 57 724 87 890
Table 11 – Comparison of V1/V2/V3 other systems