Embed Size (px)
Citation preview
W W W. H E A LT H L E A D E R S M E D I A . C O M / I N T E L L I G E N C E
C uncilHEALTHLEADERS MEDIA
Access. Insight. Analysis.
Powered by
| IntelligenceF R E E R E P O RT
IT AND THE ANALYTICS ADVANTAGE: Managing Data to Master Risk
APRIL 2015
An independent HealthLeaders Media survey supported by

CLICK HERE TO LEARN MORE ABOUT OUR PREMIUM EDITION
For more information or to purchase this report, go to HealthLeadersMedia.com/Intelligence or call 800-753-0131. Reference promotion code MM323382 upon ordering.
NEW REPORT reveals why extending into complex data sets and higher-order analytics is a strategic imperative—and how providers can pick a path to make it work.
• Discover which performance factors give analytics-savvy organizations a competitive advantage.
• Find out how Rex Healthcare is training physicians to document comorbidities more consistently to reduce inappropriate readmission penalties.
• Understand where you will need to add or enhance skills in order to pursue analytics—and how best to do it.
• Learn how Albany Medical Center used Big Data analytics on a wide range of factors to identify care variations, process breakdowns, and other problems—and accurately predict the impact of improvements.
• Uncover how Orlando Health is using middleware “exchange platform” to harmonize practice management and EHR data from five internal systems with aligned-provider data from 125 physician practices.
WWW. H E A LT H L E A D E R SM E D I A . C OM / I N T E L L I G E N C E
C uncilHEALTHLEADERS MEDIA
Access. Insight. Analysis.
Powered by
| IntelligencePREMIUM REPORT
APRIL 2015
IT AND THE ANALYTICS ADVANTAGE: Managing Data to Master Risk
INTELLIGENCE REPORT PREMIUM from HealthLeaders Media
IT AND THE ANALYTICS ADVANTAGE: Managing Data to Master Risk

APRIL 2015 | IT and the Analytics Advantage: Managing Data to Master Risk PAGE 3TOC
Today’s healthcare landscape includes multiple providers across the
continuum, all generating ever-growing volumes of patient and admin-
istrative data. And as quickly as data volumes have spiked, so too have
the expectations for improved patient outcomes, cost accountability,
population needs, and risk management. This requires us to find mean-
ing and connections in real-time, with greater financial efficiency, to
deliver better patient care.
It is no longer acceptable simply to store healthcare data, we must have
protocols in place for these data to be integrated, allowing us to de-
velop knowledge through actionable information and analysis. These
demands have created nothing short of a seismic shift for our industry,
requiring a transformation of how we think about information in all
forms and from all sources.
The question is, how do we, as an industry, get there? How do we rede-
fine the delivery of healthcare? Having the right data, in the right form,
and at the right time is key, but these elements take planning, invest-
ment, and commitment. Globally, healthcare organizations have made
considerable investments in EHR systems. And while these systems have
proven successful in managing structured information, they fall short
when it comes to handling unstructured data. As much as 80% of health-
care data is said to be unstructured and unmanaged, according to the
Institute for Health Technology Transformation (iHT2).
We will need to accelerate integration, optimization, and big-data inno-
vation to capture the full value of both patient and financial data in real-
time. But without analysis, big data provides few answers. And without
full data access, even analysis offers false hope and limited meaning. As
healthcare moves beyond data storage, and even beyond simple analysis,
optimal use demands that we have the tools to aggregate, synthesize,
and isolate information, as well as the skills and vision to do so.
To care for populations with similar diseases requires us to be fluent
in the best evidence-based medicine. We must understand the prog-
ress of patient groups with the same conditions, just as we must un-
derstand the prevalent health needs of our patient base. At the same
time, we must have access to data enabling us to determine the best
treatment for the individual patient in front of us, whose condition
may—or may not—resemble anyone else’s. Our clinicians and staff will
need training, and we will need the infrastructure to serve these two
broad, but critical, goals.
PERSPECTIVE
Healthcare 3.0: Smart System Planning and Redefining Care Delivery
APRIL 2015 | IT and the Analytics Advantage: Managing Data to Master Risk PAGE 4TOC
We need patient records that are seamlessly integrated so that the
plethora of available data can be analyzed, and so we can make it action-
able in our quest to deliver better patient care. Yet we must beware of
one-size-fits-all platforms, and choose wisely for our institutions, offices,
missions, and locations. The same approaches apply to how we can and
should utilize our financial and administrative data to empower efficien-
cies and drive down the cost of doing business.
Success in this next-generation healthcare environment will take a com-
bination of record integration, interoperability, usability, and infrastruc-
ture. Without these tools, we will be unable to:
• perform the analyses that reveal trends in illnesses or disease
• determine the most successful treatment patterns
• uncover inefficient spending
These gaps in understanding will continue to affect patient outcomes
and care quality—leading to increased costs, less-effective treatments,
and, ultimately, higher readmission rates.
What’s more, keeping up in the Healthcare 3.0 era will require us to
leverage big data solutions that integrate fragmented information with
existing patient health records. This will allow providers to have the
actionable knowledge from it they need to make better clinical decisions,
and the enterprise to make better administrative choices. Moreover, we
need data that is streamlined across the continuum of care, regardless of
its source, in an industrywide effort that supports our shared clinical as-
pirations of improving patient outcomes. The challenge, for us all, is to
divine intelligence from patient and business data to prevent the digital
landfills that render it useless in the current healthcare landscape.
Technological innovation now allows for just that. Yet while the need for
and projected use of analytics grows in healthcare, it’s clear that some
segments of the industry feel unprepared. But therein lies our greatest
opportunity—to redefine data management in healthcare to ensure the
accuracy, interoperability, and integration needed for this next-gen era.
This Intelligence Report indicates changes ahead for both financial and
clinical data. What can be derived from the findings is that we should
count on leaps in the types of data collected, and in the expectations
of interoperability and outcomes. And EMC will continue its com-
mitment to making sure the healthcare industry continues advancing
toward better care delivery, more cost accountability, and improved
patient outcomes.
Bill BuntingDirector, Healthcare SolutionsEMC
Perspective (continued)

APRIL 2015 | IT and the Analytics Advantage: Managing Data to Master Risk PAGE 5TOC
This is a summary of the Premium edition of the report. In the
full report, you’ll find a wealth of additional information. For
each question, the Premium edition includes overall response
information, as well as a breakdown of responses by various factors:
setting (e.g., hospital, health system, physician organization),
number of beds (hospitals), number of sites (health systems), net
patient revenue, and region.
Available separately from HealthLeaders Media is the Buying Power
edition, which includes additional data segmentation based on
purchase involvement, dollar amount influenced, and types of
products or services purchased.
In addition to this valuable survey data, you’ll also get the tools you
need to turn the data into decisions:
• A Foreword by Rick Schooler, Vice President and Chief
Information Officer at Orlando (Florida) Health and Lead
Advisor for this Intelligence Report
• Three Case Studies featuring initiatives by Albany (New York)
Medical Center; Rex Healthcare in Raleigh, North Carolina; and
Orlando (Florida) Health
• A list of Recommendations drawing on the data, insights, and
analysis from this report
• A Meeting Guide featuring questions to ask your team
About the Premium and Buying Power Editions

APRIL 2015 | IT and the Analytics Advantage: Managing Data to Master Risk PAGE 6TOC
Table of Contents
Perspective 3
Methodology 7
Respondent Profile 8
Analysis 9
Survey Results 20
This document contains privileged, copyrighted information. If you have not purchased it or are not otherwise entitled to it by agreement with HealthLeaders Media, any use, disclosure, forwarding, copying, or other communication of the contents is prohibited without permission.
Fig. 1: Types of Finance Data Drawn On for Analytics Activity Now . . . . . 20
Fig. 2: Types of Finance Data to Draw On for Analytics Activity Within Three Years . . . . . . . . . . . . . . . . . . . . . . . . . . . . . . . . . . . . . . . . . . 21
Fig. 3: Types of Patient Data Drawn On for Analytics Now . . . . . . . . . . . . . 22
Fig. 4: Types of Patient Data to Draw On for Analytics Within Three Years . . . . . . . . . . . . . . . . . . . . . . . . . . . . . . . . . . . . . . . . . . . . . . . . . 23
Fig. 5: Current Applications for Working With Large/Complex Data Sets . . . . . . . . . . . . . . . . . . . . . . . . . . . . . . . . . . . . . . . . . . . . . . . . . . . 24
Fig. 6: Time Frame for Beginning to Draw On Large/Complex Data Sets to Reveal Trends . . . . . . . . . . . . . . . . . . . . . . . . . . . . . . . . . . . 26
Fig. 7: Percentage of Organization’s Patient Population Exposed to Downside Risk . . . . . . . . . . . . . . . . . . . . . . . . . . . . . . . . . . . . . . . . . . . . . . 27
Fig. 8: Presence of Downside Risk Contracts Prompting Need for Analytics Software . . . . . . . . . . . . . . . . . . . . . . . . . . . . . . . . . . . . . . . . . . 28
Fig. 9: Use of Clinical Analytics Now . . . . . . . . . . . . . . . . . . . . . . . . . . . . . . . . . 29
Fig. 10: Use of Clinical Analytics Within Three Years . . . . . . . . . . . . . . . . . . 30
Fig. 11: Use of Financial Analytics Now . . . . . . . . . . . . . . . . . . . . . . . . . . . . . . . 31
Fig. 12: Use of Financial Analytics Within Three Years . . . . . . . . . . . . . . . . . 32
Fig. 13: Investment in Analytics Areas Over Next Year. . . . . . . . . . . . . . . . . 33
Fig. 14: Top Data Analytics Challenges Over Next Three Years . . . . . . . . . . 34
Fig. 15: Top Tactical Analytics Challenges Over Next Three Years . . . . . . . 35
APRIL 2015 | IT and the Analytics Advantage: Managing Data to Master Risk PAGE 7TOC
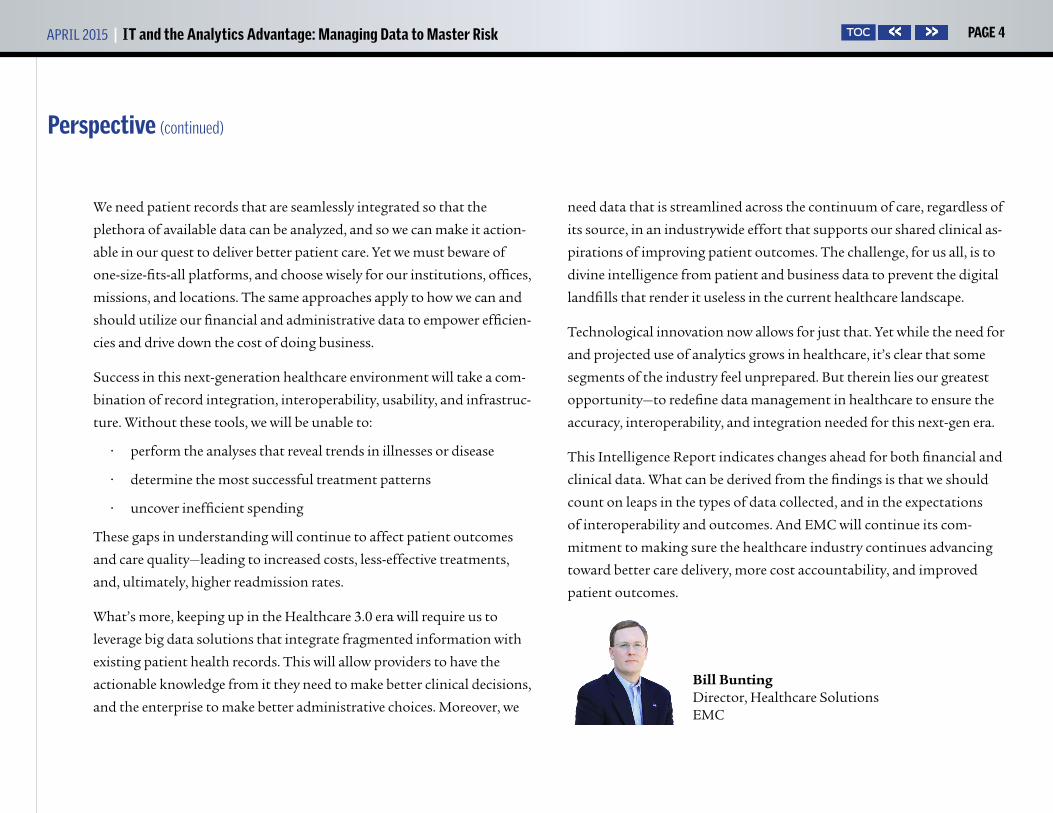
Methodology
The 2015 Healthcare IT and Analytics Survey was conducted by the HealthLeaders Media Intelligence Unit, powered by the HealthLeaders Media Council. It is part of a series of monthly Thought Leadership Studies. In January 2015, an online survey was sent to the HealthLeaders Media Council and select members of the HealthLeaders Media audience. A total of 367 completed surveys are included in the analysis. The margin of error for a Base of 367 is +/-5.1% at the 95% confidence interval.
ADVISORS FOR THIS INTELLIGENCE REPORTThe following healthcare leaders graciously provided guidance and insight in the creation of this report.
Linda Butler, MDVice President of Medical Affairs, Chief Medical Officer,and Chief Medical Information OfficerRex HealthcareRaleigh, North Carolina
George T. Hickman, FCHIME, LCHIME, LFHIMSS, CPHIMS, CHCIOExecutive Vice President and Chief Information OfficerAlbany (New York) Medical Center
Rick Schooler, FACHE, LFCHIME,FHIMSS, CHCIOVice President and Chief Information OfficerOrlando (Florida) Health
UPCOMING INTELLIGENCE REPORT TOPICS
MAY Emergency Department Strategies
JUNE Strategic Cost Control
JULY Care Continuum Coordination
AUGUST Patient Experience
SEPTEMBER Physician-Hospital Alignment
C uncilHEALTHLEADERS MEDIA
Access. Insight. Analysis.Click for information on joining.
Click here to subscribe.
ABOUT THE HEALTHLEADERS MEDIA INTELLIGENCE UNITThe HealthLeaders Media Intelligence Unit, a division of HealthLeaders Media, is the premier source for executive healthcare business research. It provides analysis and forecasts through digital platforms, print publications, custom reports, white papers, conferences, roundtables, peer networking opportunities, and presentations for senior management.
Vice President and PublisherRAFAEL [email protected]
Editorial Director EDWARD PREWITT [email protected]
Managing Editor BOB WERTZ [email protected]
Intelligence Unit Director ANN MACKAY [email protected]
Media Sales Operations Manager ALEX MULLEN [email protected]
Intelligence Report Contributing Editor DON [email protected]
Intelligence Report Contributing Editor SCOTT [email protected]
Intelligence Report Design and Layout KEN [email protected]
Intelligence Report Cover Art DOUG [email protected]
Copyright ©2015 HealthLeaders Media, a division of BLR, 100 Winners Circle, Suite 300, Brentwood, TN 37027 Opinions expressed are not necessarily those of HealthLeaders Media. Mention of products and services does not constitute endorsement. Advice given is general, and readers should consult professional counsel for specific legal, ethical, or clinical questions.
Intelligence Report Senior Research Analyst MICHAEL ZEIS [email protected]
Intelligence Report Research Editor-Analyst JONATHAN BEES [email protected]

APRIL 2015 | IT and the Analytics Advantage: Managing Data to Master Risk PAGE 8TOC
Respondent Profile
Respondents represent titles from across the various functions at at healthcare provider organizations.
Senior leaders | CEO, Administrator, Chief Operations Officer, Chief Medical Officer, Chief Financial Officer, Executive Dir., Partner, Board Member, Principal Owner, President, Chief of Staff, Chief Information Officer
Clinical leaders | Chief of Cardiology, Chief of Neurology, Chief of Oncology, Chief of Orthopedics, Chief of Radiology, Chief Nursing Officer, Dir. of Ambulatory Services, Dir. of Clinical Services, Dir. of Emergency Services, Dir. of Inpatient Services, Dir. of Intensive Care Services, Dir. of Nursing, Dir. of Rehabilitation Services, Service Line Director, Dir. of Surgical/Perioperative Services, Medical Director, VP Clinical Informatics, VP Clinical Quality, VP Clinical Services, VP Medical Affairs (Physician Mgmt/MD), VP Nursing
Operations leaders | Chief Compliance Officer, Chief Purchasing Officer, Asst. Administrator, Chief Counsel, Dir. of Patient Safety, Dir. of Purchasing, Dir. of Quality, Dir. of Safety, VP/Dir. Compliance, VP/Dir. Human Resources, VP/Dir. Operations/Administration, Other VP
Financial leaders | VP/Dir. Finance, HIM Director, Director of Case Management, Director of Patient Financial Services, Director of RAC, Director of Reimbursement, Director of Revenue Cycle
Marketing leaders | VP/Dir. Marketing/Sales, VP/Dir. Media Relations
Information leaders | Chief Medical Information Officer, Chief Technology Officer, VP/Dir. Technology/MIS/IT
Base = 120 (Hospitals)
Type of organization Number of beds
1–199 45%
200–499 37%
500+ 18%
Number of physicians
Base = 53 (Physician organizations)
1–9 21%
10–49 32%
50+ 47%
Region
WEST: Washington, Oregon, California,
Alaska, Hawaii, Arizona, Colorado, Idaho,
Montana, Nevada, New Mexico, Utah, Wyoming
MIDWEST: North Dakota, South Dakota,
Nebraska, Kansas, Missouri, Iowa, Minnesota,
Illinois, Indiana, Michigan, Ohio, Wisconsin
SOUTH: Texas, Oklahoma, Arkansas,
Louisiana, Mississippi, Alabama, Tennessee,
Kentucky, Florida, Georgia, South Carolina,
North Carolina, Virginia, West Virginia, D.C.,
Maryland, Delaware
NORTHEAST: Pennsylvania, New York,
New Jersey, Connecticut, Vermont, Rhode
Island, Massachusetts, New Hampshire, Maine
Title
Base = 367
46%Senior leaders
7% Financial leaders
0
10
20
30
40
50
17% Operations
leaders
21% Clinical leaders
7% Marketing
leaders
36%
26%
19%
19%
Number of sites
Base = 97 (Health systems)
1–5 13%
6–20 30%
21+ 57%
Base = 367
Hospital 33%
Health System 26%
Physician Org 14%
Health Plan/Insurer 9%
Long-term Care/SNF 8%
Ancillary, Allied Provider 7%
Government, Education, Academic 3%
2% Information
leaders

APRIL 2015 | IT and the Analytics Advantage: Managing Data to Master Risk PAGE 9TOC
Information technology provides healthcare organizations with an essential
infrastructure. But from an evolutionary perspective, healthcare IT has its
roots in finance and administration, with clinical IT applications developing
along a separate path. The shift to delivering value-based care challenges IT
in two principal ways.
First, as organizations respond to the industry’s push toward capitated or
at-risk payments, decision-makers depend on analysis that is based on both
clinical and financial data, so organizations are challenged to integrate
data. Second, as early reimbursement penalties morph into broader-based
responsibility for health outcomes, and attribution of patients to providers
becomes common, the performance of care partners becomes a concern.
Both factors push healthcare IT teams to work with broader sets of data,
with the objective of supporting a new set of decisions in new ways.
Although the labels may look pretty much the same, there will be a big
difference between the way organizations apply analytics now and the
analytics applications in the near future. “The analytics work that we will do
in the future will require deeper competencies and be at a different level of
discovery than today’s work,” says George T. Hickman, FCHIME, LCHIME,
LFHIMSS, CPHIMS, CHCIO, executive vice president and chief information
officer of Albany Medical Center. The nonprofit organization incorporates
ANALYSIS
Analytics: Accept the Challenge and Make Data Work for You MICHAEL ZEIS
“Accurate data will provide profiling and information on how to better manage
chronic diseases in the outpatient setting and in better partnership with our
physicians. It should be a significant benefit in moving toward value-based
reimbursement. We cannot manage without data.”
—Chief operations officer for a medium hospital
“Analytics is a tool, not the holy grail. It is an important tool, but just a
tool.”
—CEO for a large health system
“The challenges include stratifying all the clinical- and business-oriented data
we are getting from our current EHR and using the data to make successful
and highly skilled decisions on patient care. The opportunities include cost
savings associated with the implementation, delivering the right care at the
right time and at the right price.”
—Director of surgical/perioperative services for a medium health system
“We recognize the need. We want to do it. But we have to get ourselves ready
to move on it. Our resources are limited, so we expect to work with our affiliate
and with our EHR vendor to take the first steps.”
—Chief financial officer for a small hospital
“Appropriate analytics will help provide insight into service utilization, as-
sessing community needs, assessing which service lines will be better shared
with partners and which service lines are no longer viable. Analytics will also
be vital in computer-assisted modeling to project more accurately resource
utilization and potential needs.”
—Director of emergency services for a medium hospital
WHAT HEALTHCARE LEADERS ARE SAYING

APRIL 2015 | IT and the Analytics Advantage: Managing Data to Master Risk PAGE 10TOC
the 734-bed Albany Medical Center Hospital, Albany Medical College, a
biomedical research enterprise, and a physician practice with 425 doctors.
Hickman reminds us that in IT, the healthcare industry lacks the degree
of maturity seen in other industries. “The sorts of things that we’re doing
today may be new to healthcare, but they rely on some toolkits that are
generally straightforward.” He notes that, for the most part, healthcare
IT is moving beyond early siloed transactional systems that provided a
retrospective or historical view of healthcare activities and today is focused
more on the logistics and techniques of working with many sets of data,
often in what is called a data warehouse.
Working with many sets of data allows views of the organization’s
operations that are not possible when examining one set of data at a time,
and, Hickman says, leaders are laying a foundation that “uses a different
sort of quantitative toolkit to move to a higher form of quantifiable
analysis, one in which you seek relationships that exist in the data. Now
we’ve got more data. We’ve got more questions. And the questions are
a different flavor. We’re going to have to have large-scale computing
environments, and high-end probabilistic relational tools that can mine
the data to help us by discovery.”
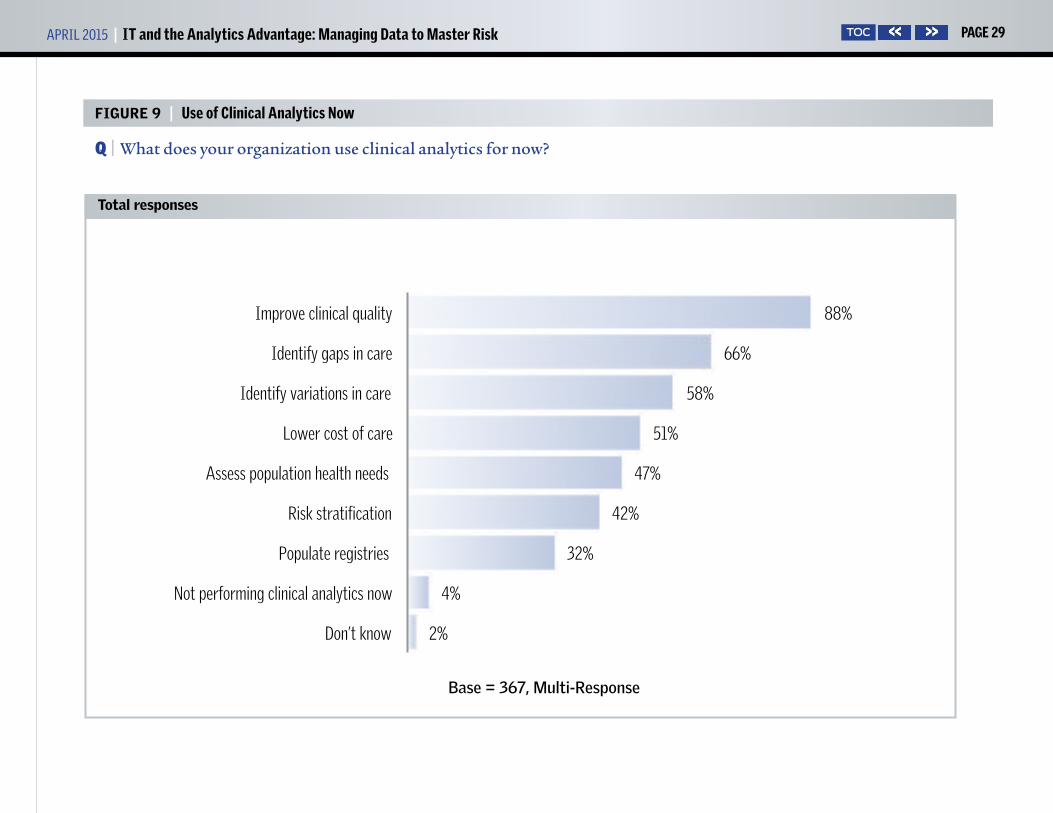
We can see that many healthcare leaders understand what is ahead.
Nearly all (95%) health systems use analytics to improve clinical quality,
the top clinical application across all settings. The percentage using
analytics to improve clinical quality (88% overall) is more than twice the
percentage now using analytics
for risk stratification (42%). But
within three years, 73% say they
will be using analytics for risk
stratification, an increase of 31
percentage points. And 78% say
they will be using analytics to
assess population health needs,
up from 47% today. Even though
an advisor cautions that we don’t
know the degree of utilization,
the results indicate there is broad
recognition that IT will need
to operate with a higher level of sophistication as their organizations
approach value-based care.
Linda Butler, MD, is vice president of medical affairs, chief medical officer,
and chief medical information officer for Rex Healthcare of Raleigh,
North Carolina, a member of UNC Health Care, a nonprofit healthcare
system that includes the 660-licensed-bed Rex Hospital. She explains that
lowering the cost of care, which is the clinical analytics item that shows the
greatest increase over the next three years (32 percentage points) is not as
simple as it sounds, even when an organization standardizes.
“Now that we have revenue cycle on Epic and we have clinical care on Epic
“The analytics work that we will do in the future will require deeper competencies and be at a different level of discovery than today’s work.”
—George T. Hickman
Analysis (continued)

APRIL 2015 | IT and the Analytics Advantage: Managing Data to Master Risk PAGE 11TOC
Analysis (continued)
and we’re all going to be on the same cost accounting system,” Butler says,
“we hope we’ll be able to link our cost accounting system with Epic, too,
so we’ll truly know what our cost of care is. But we don’t really have a way
to link the clinical outcomes with the cost quite yet.” Nonetheless, as the
industry shifts its financial underpinnings away from fee-for-service and
toward value-based payment, such a connection is very important.
“We need to know the cost of care if we’re going to be at risk,” Butler
explains. “We need to know what it costs us to take care of the average
pneumonia patient. Right now, it is hard to risk-adjust, because we don’t
have a way to look at the case-mix index or the severity of illness with the
outcome. We know overall readmissions and overall mortality, but we
don’t have good computer-assisted coding software that will allow us to
look at patients and try to risk-adjust. And I think that one is going to be
really hard.”
Noting that survey results show that 47% now are doing analytics to
assess population health needs, Hickman acknowledges that there is
considerable work ahead. “We try to assess the population’s health needs
by examining a lot of market data. We’re able to draw conclusions about
what form of interventions are being utilized and where to expect market
growth so that we know how to build a healthcare delivery system that
meets those demands. But if we consider real disease management, where
the interventions are about wellness, and having primary care at the
front end, and avoiding unnecessary emergency department visits and
hospitalization, many providers
are not yet doing that.”
Such is the case with evaluating
population risk assessment. We
can see a high degree of interest:
In the three-year time frame,
65% expect to be using financial
analytics for population risk
assessment, more than twice the present percentage (29%). Advisor Butler
suggests that there may be some wishful thinkers among those who expect
to add such applications. “We know that population health is the direction
we’re moving in, but there’s so many of us that really are not prepared, and
we’re hoping we will have these answers in three years.”
Risk prompts analytics push.Decisions about risk prompt a great deal of today’s interest in squeezing
more insight out of IT and analytics. First, entering contracts with
downside risk is new territory for many, so the parameters for weighing the
merits of contracts are new and different. Second, once the deal is struck,
both monitoring status and guiding performance require new views of
operations.
Readmission penalties offer a preview of sorts. Providers can learn about
attribution from readmission penalties, and readmission penalties teach
“We need to know the cost of care if we’re going to be at risk.”
—Linda Butler, MD

APRIL 2015 | IT and the Analytics Advantage: Managing Data to Master Risk PAGE 12TOC
Analysis (continued)
them how difficult it is to modify performance when performance is
tallied long after the fact. Butler, who serves as both CMO and CMIO,
explains how the data-based system for determining readmission penalties
is of no use in guiding actions to reduce readmissions, and often delivers
results that are too late even to confirm patient attribution.
“How can we make sure we’re having the right patient attributions?” she
asks. “Just because they have in their record that it’s our patient and it’s
our doctor taking care of them, it may not actually be true. We need to get
results at the end of the month so we can intervene in a timely fashion. It
usually lags behind. I don’t know what our readmission rates are in the last
three months for our Blue Cross contract. When it arrives, I can’t really use
that information for anything.”
More than half of survey respondents (54%) are exposed to downside risk
for at least a portion of their patient population. Along with that exposure
comes a greater need for analytics. Higher percentages (19%) of those with
20% or more of their patient population at risk say that they acquired an
analytics software module as a result of having a downside-risk contract,
compared to only 6% of those with lower portions exposed to downside
risk.
Of course, acquiring the software doesn’t necessarily provide answers.
Software and its output need to be integrated into the organization’s
work process and decision dynamics. There is a technical aspect to this,
but especially with analytics efforts, staff involvement makes it work.
Staff capabilities should be part
of the organization’s make-or-buy
decision, and organizations may
find they can advance faster if
they avoid in-house development
activities and use vendor-provided
platforms where possible.
Says Rick Schooler, vice president
and chief information officer
for Orlando Health, a nonprofit
network of eight hospitals with
a combined 1,788 beds serving Central Florida, “Hire the people who are
going to be the data users, the expert users, the super users, people who
have knowledge about what you’re trying to gather. Don’t spend a lot of
time and money trying to build platforms, because to build a data model
to support analytics, you’ve got to have a certain level of expertise.”
The relationship between accepting risk and using analytics to support
decision-making is clear to Schooler, lead advisor for this Intelligence
Report. “You won’t be able to survive this kind of a scenario without this
kind of information, and without the tool sets and the talent to be able to
handle it. It’s just that simple.”
As Butler has mentioned, Schooler, too, says that speed becomes
important because healthcare leaders need information to support timely
“Don’t spend a lot of time and money trying to build platforms, because to build a data model to support analytics, you’ve got to have a certain level of expertise.”
—Rick Schooler
APRIL 2015 | IT and the Analytics Advantage: Managing Data to Master Risk PAGE 13TOC
Analysis (continued)
action. “With more pressure on the downside, providers have no choice
but to enhance their ability to know what’s going on quicker, before it’s
too late to do anything about it. [What’s needed is] concurrent real-time
information that is actionable, versus a two-dimensional report that might
cover three to six months of history.”
And the need for immediacy extends to day-to-day care. “A lot of contracts,
for either upside or downside risk, are going to have metrics that get
calculated over time,” Schooler says. “But you’ve got to manage this, day to
day, at an individual-patient level with actionable information. That way,
when you get to the point of rolling up all these aggregated results, the
metric is going in the direction you want it.”
Of course, providers recognize that hands-on care is fundamental to
mission and strategy. But the mission and the strategy now include
outcome measures and population health; the activities of primary care
physicians and other providers outside of the acute care environment are
part of the formula. We are used to seeing larger organizations—those
with high net patient revenue—and larger health systems lead in many
aspects of healthcare reform. But more than one-third (36%) of physician
organizations exposed to downside risk say that the presence of risk
caused them to increase their dependence on analytics modules, slightly
higher than health systems (33%) and considerably higher than hospitals
(16%). That’s what happens when you are on the front lines of care delivery
and, therefore, play a pivotal role in healthcare reform.
Says Butler, “Acute care is not
the solution. If you don’t do
the prevention part right, then
patients end up within our
doors. And it’s a lot easier for the
government to keep us on the
hook because they see us as the
biggest cost. But if you think about
where population health is best
managed and controlled, it’s in
the physician office. Once patients
have gotten to the hospital, it’s too
late.”
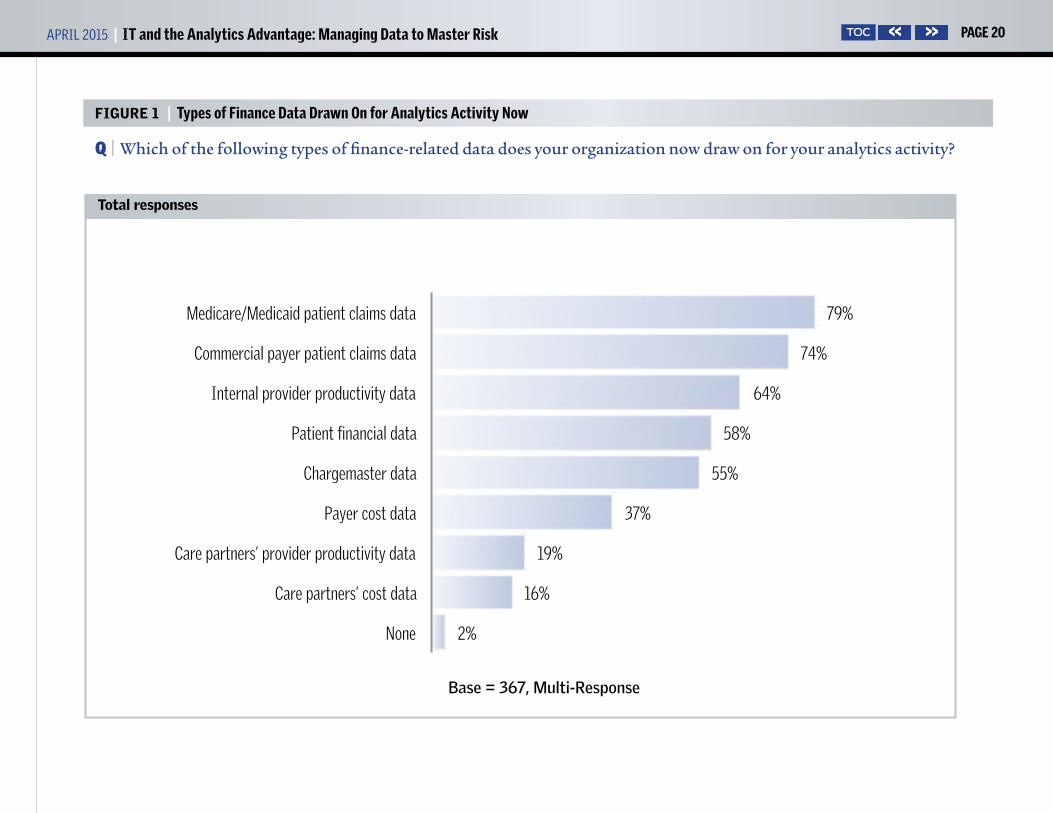
Data provides the foundation.The data sources for much of today’s financial analytics reflect today’s
reporting requirements: 79% of respondents do analytics on Medicare/
Medicaid patient claims data, and 74% use patient claims data from
commercial payers. While that may reinforce how organizations are
attentive to the relationship between patient care and revenue, advisors
note that patient claims data provides a retrospective view, a view that does
not support near-term action or predictive analytics that would provide a
measure of confidence about making decisions in support of the need to
bear risk. Butler notes, “I think the stuff that we’re already focusing on is
the more or less low-hanging fruit that is pretty easy to get out of systems.”
“We’re going to have to have large-scale computing environments, and high-end probabilistic relational tools that can mine the data to help us by discovery.”
—George T. Hickman

APRIL 2015 | IT and the Analytics Advantage: Managing Data to Master Risk PAGE 14TOC
In the near-term future, care partners’ cost and productivity data will
garner more new attention than other types of financial data. Over the
next three years, 37% of organizations expect to begin to perform analytics
on care partners’ cost data, boosting that activity from 16% to 53% of
respondents; likewise, 30% expect to begin working with care partners’
provider productivity data, raising that activity from 19% now to 49%
within three years.
“The only way to manage financing of healthcare is to also manage care
across the continuum for every episode of care that occurs for a particular
person,” Hickman says. “If you’re going to do that, you better understand
how the partners you select are performing with regard to interventions
and their ability to manage interventions.”
The electronic health record remains a top data source for analytics efforts,
now (81%) and in the future (95%), but Hickman suggests that, while
organizations will continue to depend on the EHR as a source of patient
health data, the healthcare industry will begin to recognize the EHR as
what he calls a transaction system.
“At this point, electronic health records should start feeling like
transaction systems, not necessarily at the center of the universe where
we often put them,” he says. “If you really want to focus on population
health, you have to have a healthy electronic health system environment
supporting that effort. So let’s focus on all the other systems and solutions
we’re going to need to be building
for the future.”
Nearly one-third of respondents
(32%) report they are using
unstructured data from their
EHR in their analytics activity, a
reading that Schooler considers
to be high considering the
complexity of the task. “We all use
this information,” he says, “but
using it in analytics means you’re
combining it with other patient
information and other types of
information to glean some intelligence, maybe make predictions, maybe
get an understanding of what happened, or maybe get a sense of what
should be done to address populations. I’m surprised there’s that many
people saying they are actually doing it, because I know how difficult it is
to do.”
The survey logs the presence of the activity, but not the scale or degree
of activity. But given the challenges, 32% is an indication of a high level
of interest in gleaning additional insight from physician notes. Another
22% expect to begin using unstructured EHR data for analytics purposes
within three years, boosting the total to 54% of respondents. Schooler
Analysis (continued)
“We know that population health is the direction we’re moving in, but there’s so many of us that really are not prepared, and we’re hoping we will have these answers in three years.”
—Linda Butler, MD

APRIL 2015 | IT and the Analytics Advantage: Managing Data to Master Risk PAGE 15TOC
suggests that much of the work in the near term might be to use natural
language processing to add precision to ICD coding, which is more a data-
integrity process than an analytics activity. And the support from applying
natural language processing to unstructured EHR data is a way of allowing
the EHR tool to fit the work method providers prefer.
“Providers in general, particularly physicians, do not like to enter data
into a template,” Schooler explains. “They typically steer away from having
to go through a screen and enter specific values, specific data, and even
specific words. They like to write progress notes. They like to write their
H&Ps [histories and physical exam notes]. They like to do all that in an
unstructured, open text form. Well, there’s a lot of good stuff in there.
Computer-assisted coding technologies run through this text and pull out
stuff that’s helping coders survive the conversion to ICD-10.”
There is some doubt about whether the computer will eventually do the
data extraction or will continue to assist in the extraction. Says Butler,
“At Rex, unstructured data from the chart is put through algorithms and
presented to a clinical documentation specialist, so there are human eyes
looking at it to say, ‘Okay, is this something that we should act on or not?’
I don’t know that we’re going to get to where we can just use this type
of software to run accurate reports so that we’ll never need to manually
abstract a chart again.”
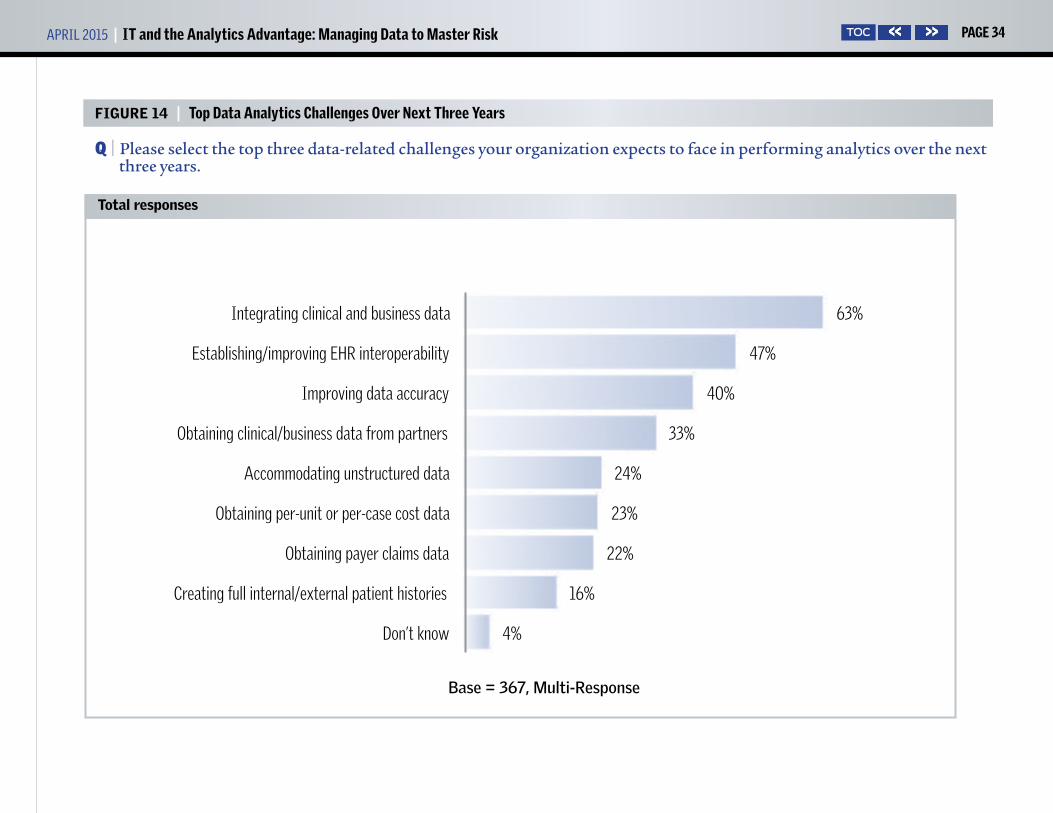
Hickman expects that the distinction between financial data and clinical
data will disappear over time. “The data is going to converge. We’ll be
doing all kinds of things across
those families of data,” he says.
The integration of financial and
clinical data, cited as a top data-
related challenge by 63%, will be
driven by the questions providers
are asking, which are the questions
that IT systems are working to
answer by applying analytics across
a disparate set of data.
Schooler sees that asking many
questions produces many ways of
getting answers. “When it comes to population health,” he says, “you think
about how to manage the health status of a patient in real time. How do I
ensure that people are actually doing what they should be doing? How do
I alert and prompt? How do I invoke patient engagement? How do I do all
this stuff? You end up with these different technology solutions.”
The challenge, Schooler says, is that organizations operate various clinical
IT technologies or applications, and they also operate various financial
applications. “All these technologies have been built, and they all have their
own source of truth. To be efficient as a healthcare provider organization,
you really need to try to migrate yourself to where you have a single source
of truth. So that’s a good problem to have from the standpoint that you’ve
actually got tools now that can give you information from all the data, but
Analysis (continued)
“To be efficient as a healthcare provider organization, you really need to try to migrate yourself to where you have a single source of truth.”
—Rick Schooler

APRIL 2015 | IT and the Analytics Advantage: Managing Data to Master Risk PAGE 16TOC
the problem is there are so many of them.”
Can you get there from here?Because the foundation for analysis is data, many IT-related challenges
and investments have to do with data. Over the next year, 75% expect
to begin or increase investments in improving the quality of data. And
58% expect to invest in integrating data from external sources. Nearly
half (48%) expect to add or train analytics staff. And 39% expect to train
clinicians in analytics. Butler notes how important it is for clinicians
to become more involved in documentation, especially as analytics
applications for EHR data expand.
“Based on what the physician or the advanced clinical practitioner
documents in the chart, the coders assign certain codes, and based on
those codes you end up getting the bill or the DRG,” she says. “But it is not
as if somebody goes through the record with a fine-tooth comb and really
gleans all that information out. It’s based on whatever the provider wrote
in the H&P, the progress notes, and the discharge summary. You may have
people that are over-documenting certain things, and then you have other
people who are under-documenting. When that happens, you’re not really
going to risk-adjust your patients accurately. The only way you change that
is to really educate your physicians on how what they’re documenting is
being used.”
Hickman identifies the problem of sorting out vocabularies as a
foundational issue, one that is compounded in an environment of
increased merger, acquisition,
and partnership activity. He says,
“I speculate that some believe
that because we are starting to
move to standardized or common
vocabularies, we will have less
unstructured data and be in a
more structured data world.
Certainly our documentation tools
allow us to create more structure
as we capture information from
clinicians. But we could also
say that even with vocabularies,
there may be multiple choices of those words that can be used to describe
something clinical in a vocabulary.
“There are tools to help you bring vocabularies together, but that
creates additional things that you have to do, at an additional expense,”
Hickman continues. “And the more organizations you seek to combine
with that have their own vocabularies, the bigger the problem gets. The
environmental factor of merger and acquisition activity is going to make it
a real challenge to work data across many providers.”
Data integration is not easy for anyone, but it may be especially difficult
for smaller organizations without the sheer might to push system
Analysis (continued)
“If you think about where population health is best managed and controlled, it’s in the physician office. Once patients have gotten to the hospital, it’s too late.”
—Linda Butler, MD

APRIL 2015 | IT and the Analytics Advantage: Managing Data to Master Risk PAGE 17TOC
consolidation forward. Hickman has seen that, “If you’re in a larger IDN
with the financial resources to do it, consolidation of solutions or systems
is a strategy to keep you moving toward standard ways of using data so
that you can operate on data across systems. If you’re an organization
without those financial resources, you may be trying to just stitch it
together as best you can. That means a whole lot of manual reporting
or pulling things together in Excel workbooks so you can understand
what’s going on if you’re sitting on six, seven, or eight electronic health
records.” Those who, as Hickman says, “stitch their solutions together”
will increasingly be at a disadvantage. On the other hand, Hickman says,
“If you can harness all of that data across those many systems, you’ve got
an edge.”
Schooler sees clinical integration as a step toward data integration, with
both driven by the need to provide value-based care. “You cannot take
on the fundamental aspects of being accountable for a population of
patients without clinically integrating the network of providers,” he says.
“Obviously there is a clinical aspect to that and there is a business aspect
to that. We will contract for quality or whatever, so we’ve got to align
ourselves. But once we’ve done that, it will never work without information
integration.”
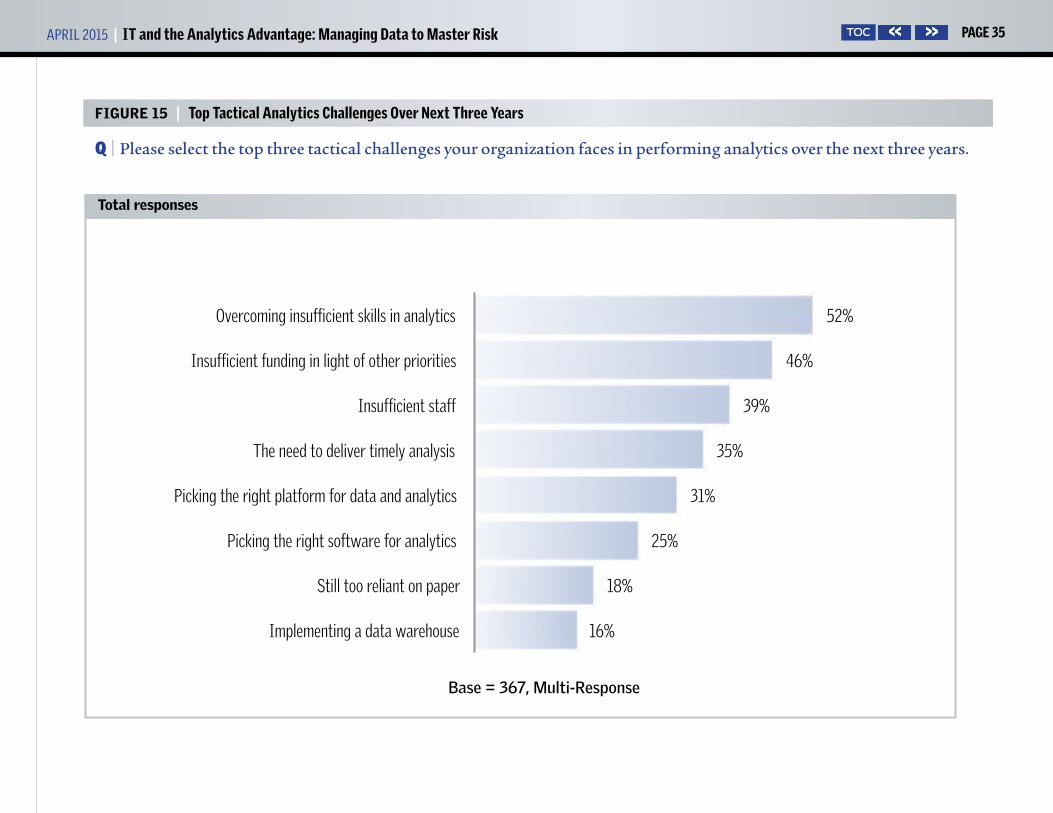
Overcoming insufficient skills in analytics is cited as a top tactical
analytics challenge by 52%, and is the tactical challenge mentioned
most frequently. “We’re going to have a dearth of talent in this space in
healthcare,” Hickman says. “We’ll
be clamoring to find people that
have the competency, education,
and aptitude to do this sort of
work. Anticipating that now and
beginning to address it is very
important.”
Hickman sees the need for
analytics skills among the clinical
team, too. “We’ve got a lot of data.
You can have the data scientists
that know how to manipulate the
tools to cause the data to merge, but you better have healthcare content
experts, too, people that understand the nature of healthcare operation,
that understand what’s going on clinically.”
Although picking the right platform for data and analytics is among the
top tactical challenges for only 31%, and 25% say that picking the right
software for analytics is among their top challenges, providers need to
work with data in new ways, and the need to collaborate presents data
integration challenges. So platform and software decisions must be made
carefully because they affect the ability of the IT team to be facile enough
to support decision-making in the future.
Analysis (continued)
“The only way to manage financing of healthcare is to also manage care across the continuum for every episode of care that occurs for a particular person.”
—George T. Hickman

APRIL 2015 | IT and the Analytics Advantage: Managing Data to Master Risk PAGE 18TOC
Says Schooler, “If you don’t get on the right path with the right solution
provider and you don’t have the right kind of strategy, you’re going to spin
your wheels, waste a lot of money, and lose.” But, indeed, to respond to the
particular analytics need of a specific organization, a strong analytics team
needs to perform functions that packaged software may not.
According to Butler, “Epic has tons of reports, and they’re great, but
sometimes those reports don’t answer our specific questions. I think that
will be the case with population health, too: You have canned reports, but
you might find that you want to ask a specific question about something
in your patient population, and it will not be so easy to get at that data.”
A sober look at the direction of the industry and the organization’s
strategy for participation should inform decisions about skills and
systems. Schooler lays out the situation: “You’ve got this quandary. As an
industry, we’re moving rapidly into a new reimbursement model and a new
sort of healthcare dynamic. And we’ve got a lot of different solutions that
do a lot of different things. But are those solutions really giving us, in the
end, what we need to effectively thrive in the future?” He reminds us that
analytics as a discipline in healthcare isn’t really new. “What’s new is that
it’s no longer behind-the-curtain work done by departmental specialists
or clinical specialists. It’s now moved into the front and leaders are saying,
‘Wait a minute, we better get our arms around this thing called analytics,
because it appears that it’s going to be critical for our survival going
forward.’ ”
Maintain the present, work toward the future.The objective of IT and analytics
is not to merely track, monitor, or
report, but in addition to uncover
causal relationships and use data
to help decision-makers anticipate
what might occur in the future.
Given that the industry is shifting
to a payment model that requires a
more robust set of data—data that
needs to be worked over with a set
of tools that are new to many—
one wonders, first, can everyone
actually do this? Second, do organizations have the discipline to move in
these new directions?
A principal consideration is whether the organization has the scale,
resources, and skills required to meet new analytics requirements. Asks
Hickman, “You’re going to have to figure out how to do this to survive.
Can you afford to do it? If not, what sorts of strategies or tactics must the
healthcare organization consider? Some might merge with someone else
who can do it. Others might come up with a partnering arrangement with
others or with many others.
Analysis (continued)
“If you don’t get on the right path with the right solution provider and you don’t have the right kind of strategy, you’re going to spin your wheels, waste a lot of money, and lose.”
—Rick Schooler

APRIL 2015 | IT and the Analytics Advantage: Managing Data to Master Risk PAGE 19TOC
“Maybe we need to be talking about creating major collaboratives or
coalitions that serve a region or an employer-based group tied together by
a common mission,” Hickman continues. “If you’re a very large academic
health system or a very large IDN, or one of the big systems, you might
have the capital to pull this off.” But it is important to examine the kind of
insight that will support decision-makers in the future, to take a clear-eyed
reading of where present skills and infrastructure need to be augmented
to move in that direction, and to put in place the strategies and tactics
necessary to move in the right direction.
“As this thing matures and evolves,” Hickman cautions, “I think many will
not have the capability to pull it off because of the investment it’s going to
require. Thinking now about how to address that is important.”
How can a provider take care of today’s pressing information needs while
at the same time integrating both IT systems and health systems in ways
that support future needs? It takes discipline, Schooler says. “Analytics
covers every spectrum of our business, and there are so many different
applications, uses, and needs for analytics capabilities.”
Although the long-standing separation in the healthcare industry between
financial and clinical IT activities is melting away, healthcare leaders must
address the very real requirement to continue to deploy point solutions to
meet day-to-day needs while at the same time striving for an ultimate goal
of data and application integration.
“To be efficient about it,” Schooler notes, “leading organizations are
moving toward a common source of truth. But you can’t snap your fingers
and make this happen overnight, so at the same time we must maintain
all these disparate silos.” One must make sure that pressing needs of the
present do not prevent the organization from establishing a foundation
for the future.
“The tyranny of the urgent is what stops you from doing the things you
ought to do to survive for the long term,” Schooler cautions. “You’ve got to
be disciplined to say, ‘We know what we’ve got to do today, but in parallel
to that, there are things that we have to do to position us for the long
term.’ You can think of hundreds of things that, day to day, drive us in
multiple directions and pull us off a course. You have to have the discipline
that it takes to make good decisions. You have to have an executive culture
that really understands what this means and that this requires a certain
level of governance to ensure that you’re focusing your priorities in the
right direction at the right time.”
Michael Zeis is senior research analyst for HealthLeaders Media. He may
be contacted at [email protected].
Analysis (continued)
APRIL 2015 | IT and the Analytics Advantage: Managing Data to Master Risk PAGE 20TOC
FIGURE 1 | Types of Finance Data Drawn On for Analytics Activity Now
Q | Which of the following types of finance-related data does your organization now draw on for your analytics activity?
2%
16%
19%
37%
55%
58%
64%
74%
79%
None
Care partners’ cost data
Care partners’ provider productivity data
Payer cost data
Chargemaster data
Patient financial data
Internal provider productivity data
Commercial payer patient claims data
Medicare/Medicaid patient claims data
Base = 367, Multi-Response
Total responses

APRIL 2015 | IT and the Analytics Advantage: Managing Data to Master Risk PAGE 21TOC
FIGURE 2 | Types of Finance Data to Draw On for Analytics Activity Within Three Years
Q | Which of the following types of finance-related data do you expect to begin to draw on for your analytics activity within three years? Includes now and within three years (net)
49%
53%
65%
68%
73%
82%
85%
88%
Care partners’ provider productivity data
Care partners’ cost data
Chargemaster data
Payer cost data
Patient financial data
Internal provider productivity data
Commercial payer patient claims data
Medicare/Medicaid patient claims data
Base = 367, Multi-Response
Total responses

APRIL 2015 | IT and the Analytics Advantage: Managing Data to Master Risk PAGE 22TOC
FIGURE 3 | Types of Patient Data Drawn On for Analytics Now
Q | Which of the following types of patient-related data does your organization now draw on for your analytics activity?
2%
22%
32%
37%
54%
56%
62%
81%
81%
None
Patient health monitors, such as remote telemetry
Unstructured data from EHR
Self-reported patient data
Patient pharmaceutical data
Patient lab and imaging data
Aggregated EHR and patient claims data
Clinical data from EHR
Patient demographics
Base = 367, Multi-Response
Total responses

APRIL 2015 | IT and the Analytics Advantage: Managing Data to Master Risk PAGE 23TOC
FIGURE 4 | Types of Patient Data to Draw On for Analytics Within Three Years
Q | Which of the following types of patient-related data do you expect to begin to draw on for your analytics activity within three years? Includes now and within three years (net)
54%
55%
59%
72%
73%
85%
91%
95%
Unstructured data from EHR
Patient health monitors, such as remote telemetry
Self-reported patient data
Patient pharmaceutical data
Patient lab and imaging data
Aggregated EHR and patient claims data
Patient demographics
Clinical data from EHR
Base = 367, Multi-Response
Total responses

APRIL 2015 | IT and the Analytics Advantage: Managing Data to Master Risk PAGE 24TOC
FIGURE 5 | Current Applications for Working With Large/Complex Data Sets
Q | Which of the following best describes your current applications for working with large and/or complex data sets to reveal trends or specific insights? Among those who use large/complex data sets
Click on these icons to dig deeper.
DATA SEGMENTATION TOOL

APRIL 2015 | IT and the Analytics Advantage: Managing Data to Master Risk PAGE 25TOC
Indicates the type of goods or services the respondent is involved in purchasing
Indicates the role of the respondent in making purchasing decisions
Indicates the total dollar amount the respondent influences
FIGURE 5 (continued) | Current Applications for Working With Large/Complex Data Sets
Q | Which of the following best describes your current applications for working with large and/or complex data sets to reveal trends or specific insights? Among those who use large/complex data sets
BUYING POWER REPORT SAMPLE CHARTS Click here to order!
Who controls the money? Click on the icons to learn how they think
Click on these icons to dig deeper.
DATA SEGMENTATION TOOL

APRIL 2015 | IT and the Analytics Advantage: Managing Data to Master Risk PAGE 26TOC
FIGURE 6 | Time Frame for Beginning to Draw On Large/Complex Data Sets to Reveal Trends
Q | What is your organization’s time frame for beginning to draw on large and/or complex data sets to reveal trends or specific insights? Among those who do not draw on large/complex data sets, or don’t know
3%
24%
3% 3%
21%
10%
34%
Within 12 months 13–24 months 25–36 months More than 3 years
We are investigating
Don’t expect to use large and complex data
sets
Don’t know
Base = 29
Total responses

APRIL 2015 | IT and the Analytics Advantage: Managing Data to Master Risk PAGE 27TOC
FIGURE 7 | Percentage of Organization’s Patient Population Exposed to Downside Risk
Q | For what portion of your patient population is your organization now exposed to downside risk?
11%
23%
27%
4%
35%
0% 1%–19% 20%–99% 100% Don't know
Base = 367
Total responses

APRIL 2015 | IT and the Analytics Advantage: Managing Data to Master Risk PAGE 28TOC
FIGURE 8 | Presence of Downside Risk Contracts Prompting Need for Analytics Software
Q | Has the presence of contracts with downside risk prompted the need for or increased your dependence on an analytics software module or modules? Among those who have exposure to downside risk
PREMIUM REPORT SAMPLE CHART Click here to order!
Click on these icons to dig deeper.
DATA SEGMENTATION TOOL
APRIL 2015 | IT and the Analytics Advantage: Managing Data to Master Risk PAGE 29TOC
FIGURE 9 | Use of Clinical Analytics Now
Q | What does your organization use clinical analytics for now?
2%
4%
32%
42%
47%
51%
58%
66%
88%
Don’t know
Not performing clinical analytics now
Populate registries
Risk stratification
Assess population health needs
Lower cost of care
Identify variations in care
Identify gaps in care
Improve clinical quality
Base = 367, Multi-Response
Total responses

APRIL 2015 | IT and the Analytics Advantage: Managing Data to Master Risk PAGE 30TOC
FIGURE 10 | Use of Clinical Analytics Within Three Years
Q | What does your organization expect to begin using clinical analytics for within three years? Includes now and within three years (net)
49%
73%
78%
83%
83%
84%
94%
Populate registries
Risk stratification
Assess population health needs
Identify variations in care
Lower cost of care
Identify gaps in care
Improve clinical quality
Base = 367, Multi-Response
Total responses

APRIL 2015 | IT and the Analytics Advantage: Managing Data to Master Risk PAGE 31TOC
FIGURE 11 | Use of Financial Analytics Now
Q | What does your organization use financial analytics for now?
3%
4%
29%
34%
47%
56%
61%
68%
76%
Not doing financial analytics now
Don’t know
Population risk assessment
Assessing care partners’ efficiency and quality
Determining provider compensation/reimbursement
Payer negotiation efforts
Maximizing reimbursements
Financial risk assessment
Cost containment efforts
Base = 367, Multi-Response
Total responses

APRIL 2015 | IT and the Analytics Advantage: Managing Data to Master Risk PAGE 32TOC
FIGURE 12 | Use of Financial Analytics Within Three Years
Q | What do you expect to begin using financial analytics for within three years? Includes now and within three years (net)
62%
65%
70%
75%
79%
85%
87%
Assessing care partners’ efficiency and quality
Population risk assessment
Determining provider compensation/reimbursement
Payer negotiation efforts
Maximizing reimbursements
Financial risk assessment
Cost containment efforts
Base = 367, Multi-Response
Total responses

APRIL 2015 | IT and the Analytics Advantage: Managing Data to Master Risk PAGE 33TOC
FIGURE 13 | Investment in Analytics Areas Over Next Year
Q | In which of the following does your organization expect to begin or increase investments over the next year to support or enable analytics?
8%
11%
17%
19%
28%
39%
48%
58%
75%
No analytics investments expected
Contracting for data warehouse cloud services
Acquiring a data warehouse appliance
Obtaining outside data analytics services
Acquiring an analytics platform or module
Training clinicians in analytics
Adding or training analytics staff
Integration of data from external sources
Improving quality of data
Base = 367, Multi-Response
Total responses
APRIL 2015 | IT and the Analytics Advantage: Managing Data to Master Risk PAGE 34TOC
FIGURE 14 | Top Data Analytics Challenges Over Next Three Years
Q | Please select the top three data-related challenges your organization expects to face in performing analytics over the next three years.
4%
16%
22%
23%
24%
33%
40%
47%
63%
Don’t know
Creating full internal/external patient histories
Obtaining payer claims data
Obtaining per-unit or per-case cost data
Accommodating unstructured data
Obtaining clinical/business data from partners
Improving data accuracy
Establishing/improving EHR interoperability
Integrating clinical and business data
Base = 367, Multi-Response
Total responses
APRIL 2015 | IT and the Analytics Advantage: Managing Data to Master Risk PAGE 35TOC
FIGURE 15 | Top Tactical Analytics Challenges Over Next Three Years
Q | Please select the top three tactical challenges your organization faces in performing analytics over the next three years.
16%
18%
25%
31%
35%
39%
46%
52%
Implementing a data warehouse
Still too reliant on paper
Picking the right software for analytics
Picking the right platform for data and analytics
The need to deliver timely analysis
Insufficient staff
Insufficient funding in light of other priorities
Overcoming insufficient skills in analytics
Base = 367, Multi-Response
Total responses
➔
Join today at www.healthleadersmediacouncil.com
Be a voiceGain insight from your peersShape the direction of the industry
lC unci The nation’s most exclusive
healthcare intelligence community


![[WUC 2015] Lennert de Rijk, Managing Director Benelux & Germany, Internet Advantage | Web Analytics in the Travel Industry](https://img.pdfslide.us/doc/110x75/55c4a8b2bb61eb581f8b4801/wuc-2015-lennert-de-rijk-managing-director-benelux-germany-internet-advantage.jpg)