Embed Size (px)
Citation preview
By Bill McBeath | January 2020
Unlocking the Analytics Advantage: Part 2
Analytics for Private Fleet and Driver Performance
Table of Contents
Analytics for Improving Private Fleet and Driver Performance .......................................................................1
Overall Fleet Performance to Plans and Commitments ................1
Improving overall performance ............................................1
Improving plan accuracy and optimization effectiveness ......2
Service estimates/forecasting ...............................................2
Vehicle utilization and performance ...........................................3
Driver performance ....................................................................3
Cost-of-service tradeoffs ............................................................3
Unlocking the Analytics Advantage ............................................4
This is the second in a three-part series on using analytics in transportation and logistics to achieve a competitive advantage:
Part One: The Democratization of Analytics for Transportation and Logistics In part one, we explore the kinds of data being produced by transportation and logistics systems, how that can be used to create a data-driven enterprise, the substantial obstacles to achieving an analytic advantage, and how those obstacles can be overcome.
Part Two: Analytics for Private Fleet and Driver Performance Here in part two, we look at how analytics uses real-time location data, combined with orders, plans, proof-of-delivery, vehicle data, and more to drive significant improvements to fleet and driver performance.
Part Three: Analytics for Improving Carrier Performance and Leveraging Trade Data In the third and final part, we discuss how analytics can create improvements to carrier performance while substantially reducing costs, as well as how trade data can help importers and exporters gain competitive insights, manage supply chain risk, optimize total landed costs, and more.
Analytics for Improving Private Fleet and Driver Performance
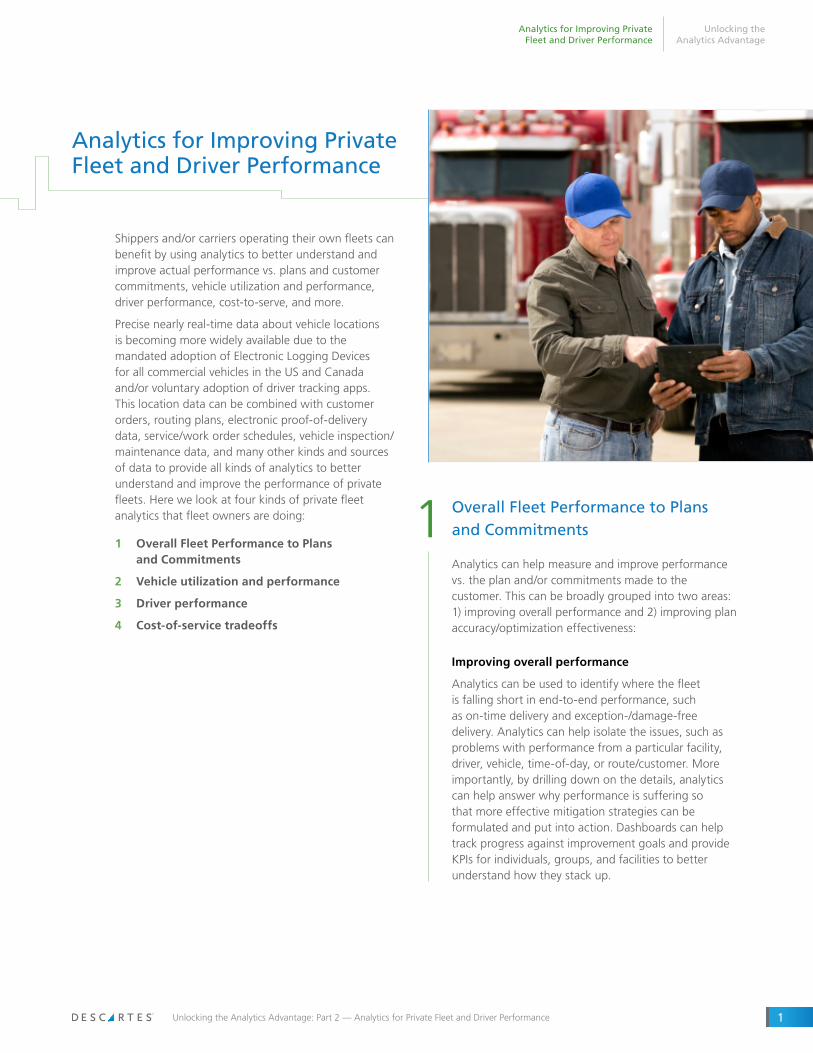
Shippers and/or carriers operating their own fleets can benefit by using analytics to better understand and improve actual performance vs. plans and customer commitments, vehicle utilization and performance, driver performance, cost-to-serve, and more.
Precise nearly real-time data about vehicle locations is becoming more widely available due to the mandated adoption of Electronic Logging Devices for all commercial vehicles in the US and Canada and/or voluntary adoption of driver tracking apps. This location data can be combined with customer orders, routing plans, electronic proof-of-delivery data, service/work order schedules, vehicle inspection/maintenance data, and many other kinds and sources of data to provide all kinds of analytics to better understand and improve the performance of private fleets. Here we look at four kinds of private fleet analytics that fleet owners are doing:
1 Overall Fleet Performance to Plans and Commitments
2 Vehicle utilization and performance
3 Driver performance
4 Cost-of-service tradeoffs
Overall Fleet Performance to Plans and Commitments1Analytics can help measure and improve performance vs. the plan and/or commitments made to the customer. This can be broadly grouped into two areas: 1) improving overall performance and 2) improving plan accuracy/optimization effectiveness:
Improving overall performance
Analytics can be used to identify where the fleet is falling short in end-to-end performance, such as on-time delivery and exception-/damage-free delivery. Analytics can help isolate the issues, such as problems with performance from a particular facility, driver, vehicle, time-of-day, or route/customer. More importantly, by drilling down on the details, analytics can help answer why performance is suffering so that more effective mitigation strategies can be formulated and put into action. Dashboards can help track progress against improvement goals and provide KPIs for individuals, groups, and facilities to better understand how they stack up.
Unlocking the Analytics Advantage
Unlocking the Analytics Advantage: Part 2 — Analytics for Private Fleet and Driver Performance 1
Analytics for Improving Private Fleet and Driver Performance
Improving plan accuracy and optimization effectiveness
Transportation/delivery plans tend to be based on averages and/or estimates, rather than taking into account differences between sites, drivers, products, time-of-day, and so forth. As a result, individual legs and stops within a plan, as well as the overall plan, will be too conservative (resulting in underutilization of resources), or too optimistic (resulting in missed commitments, disappointed customers, and frustrated employees, including potentially overly aggressive driving to compensate for a too-tight schedule). Some of the factors that analytics can measure to adjust transit and service times include:
• Customer site characteristics—Actual delivery time is impacted by site characteristics such as the security check-in process, size of facility and floor of delivery, availability and speed of elevators, customer’s receiving process and receiving staff availability, and so forth. Specific data on these may or may not be available. Lacking those data, GPS data can be used to record the actual time-on-site, in order to more accurately estimate the time allotted for future deliveries to that same location. Analytics can help detect if time-on-site changes based on time-of-year, or when a trending or sudden change to average time-on-site has occurred. Geocoding can be made more accurate by recording the actual location of delivery.
• Product/shipment characteristics—Size, weight, handleability, and special handling requirements (e.g. delicate or hazardous) all impact the delivery time, especially loading and unloading.
• Driver differences—Differences in experience, physical fitness, and familiarity with the route and/or customer site can impact delivery times. Expectations can be adjusted as a driver gains experience.
• Vehicle differences—Size and maneuverability may determine how close a vehicle can get to the point of delivery and thereby how far the delivery has to be carried by hand or cart—in some cases it might be hundreds of yards, making a material difference in delivery time. The availability and type of on-vehicle equipment/capabilities, such as a liftgate, crane, forklift, etc. can make a difference. On the road as well, the actual speed that different vehicles travel along various routes and under different conditions will vary based on the type of vehicle (e.g. semi vs. step van) and these differences can be derived via analytics using GPS and other relevant data.
• Time-based differences—Time of season, day-of-week, time-of-day, holidays, and timing of special events, can all affect transit and delivery times.
All this more granular understanding of factors impacting actual performance vs. plan will only be useful if your route planning and optimization system is able to incorporate it and adjust plans accordingly. In some cases, the planning system may already have built-in ability to adjust plans based on some of these characteristics (such as type of vehicle or product characteristics). However, it is also good if the adjustment factors in your planning system are extendable, to allow any arbitrary attribute you provide to impact transit and service times, with a flexible set of algorithms for determining the weight or influence of each attribute. This might include the ability to run scripts, so you or the solution provider can create simple algorithms to make transit- or service-time adjustments based on a combination of factors (e.g. heavy, hard-to-handle load + no elevator + number of flights of stairs).
Service estimates/forecasting
When more complex services (such as installation, repair, or inventory restocking/shelf management) are involved, then estimating service times can become more complex, entailing larger variability between jobs, based on more factors. Thereby complex services often require more data and detail about the order, products, site, etc. For example, products may be grouped into more granular categories, and or have more attributes considered. In particular, unique aspects of a site or job need to be considered. For example, installation on drywall may take less time than installation on a concrete block wall. The time it takes to run wiring might vary based on the construction. For jobs that require many trips back to the truck, the distance to/from the vehicle makes a difference.
These kinds of details may be collected as part of the order-taking process, although care must be taken to not over-burden customers by asking for too much information or asking questions that the typical customer may not know (don’t want to make your customer feel dumb). For sites with repeat visits, the driver can be provided with a mobile app to record site details for future visits; such as for a construction site, they might note that the goods need to be delivered to the back of the house, or for an existing building, noting details that would impact future installations there such as wiring, wall construction, narrow stairs, etc. Similarly, an installer can be asked many of these questions as part of the Proof-of-Delivery data collection process after the install has been completed. This gives analytics more useful data to help understand the impact of various factors and then to adjust the service time on future orders.
Unique aspects of a site or job need to be considered.
Unlocking the Analytics Advantage
Unlocking the Analytics Advantage: Part 2 — Analytics for Private Fleet and Driver Performance 2
Analytics for Improving Private Fleet and Driver Performance
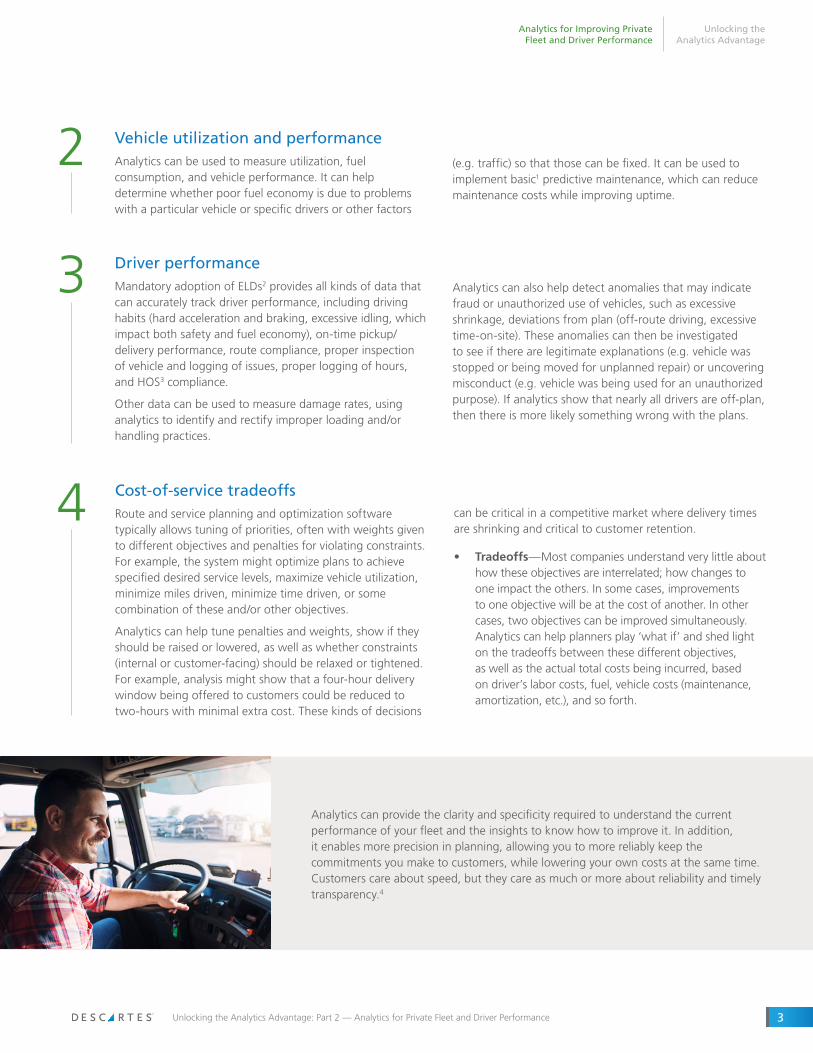
Vehicle utilization and performanceAnalytics can be used to measure utilization, fuel consumption, and vehicle performance. It can help determine whether poor fuel economy is due to problems with a particular vehicle or specific drivers or other factors
Driver performanceMandatory adoption of ELDs2 provides all kinds of data that can accurately track driver performance, including driving habits (hard acceleration and braking, excessive idling, which impact both safety and fuel economy), on-time pickup/delivery performance, route compliance, proper inspection of vehicle and logging of issues, proper logging of hours, and HOS3 compliance.
Other data can be used to measure damage rates, using analytics to identify and rectify improper loading and/or handling practices.
Cost-of-service tradeoffsRoute and service planning and optimization software typically allows tuning of priorities, often with weights given to different objectives and penalties for violating constraints. For example, the system might optimize plans to achieve specified desired service levels, maximize vehicle utilization, minimize miles driven, minimize time driven, or some combination of these and/or other objectives.
Analytics can help tune penalties and weights, show if they should be raised or lowered, as well as whether constraints (internal or customer-facing) should be relaxed or tightened. For example, analysis might show that a four-hour delivery window being offered to customers could be reduced to two-hours with minimal extra cost. These kinds of decisions
Analytics can also help detect anomalies that may indicate fraud or unauthorized use of vehicles, such as excessive shrinkage, deviations from plan (off-route driving, excessive time-on-site). These anomalies can then be investigated to see if there are legitimate explanations (e.g. vehicle was stopped or being moved for unplanned repair) or uncovering misconduct (e.g. vehicle was being used for an unauthorized purpose). If analytics show that nearly all drivers are off-plan, then there is more likely something wrong with the plans.
can be critical in a competitive market where delivery times are shrinking and critical to customer retention.
• Tradeoffs—Most companies understand very little about how these objectives are interrelated; how changes to one impact the others. In some cases, improvements to one objective will be at the cost of another. In other cases, two objectives can be improved simultaneously. Analytics can help planners play ‘what if’ and shed light on the tradeoffs between these different objectives, as well as the actual total costs being incurred, based on driver’s labor costs, fuel, vehicle costs (maintenance, amortization, etc.), and so forth.
2
3
4
Analytics can provide the clarity and specificity required to understand the current performance of your fleet and the insights to know how to improve it. In addition, it enables more precision in planning, allowing you to more reliably keep the commitments you make to customers, while lowering your own costs at the same time. Customers care about speed, but they care as much or more about reliability and timely transparency.4
(e.g. traffic) so that those can be fixed. It can be used to implement basic1 predictive maintenance, which can reduce maintenance costs while improving uptime.
Unlocking the Analytics Advantage
Unlocking the Analytics Advantage: Part 2 — Analytics for Private Fleet and Driver Performance 3
Analytics for Improving Private Fleet and Driver Performance
Unlocking the Analytics Advantage
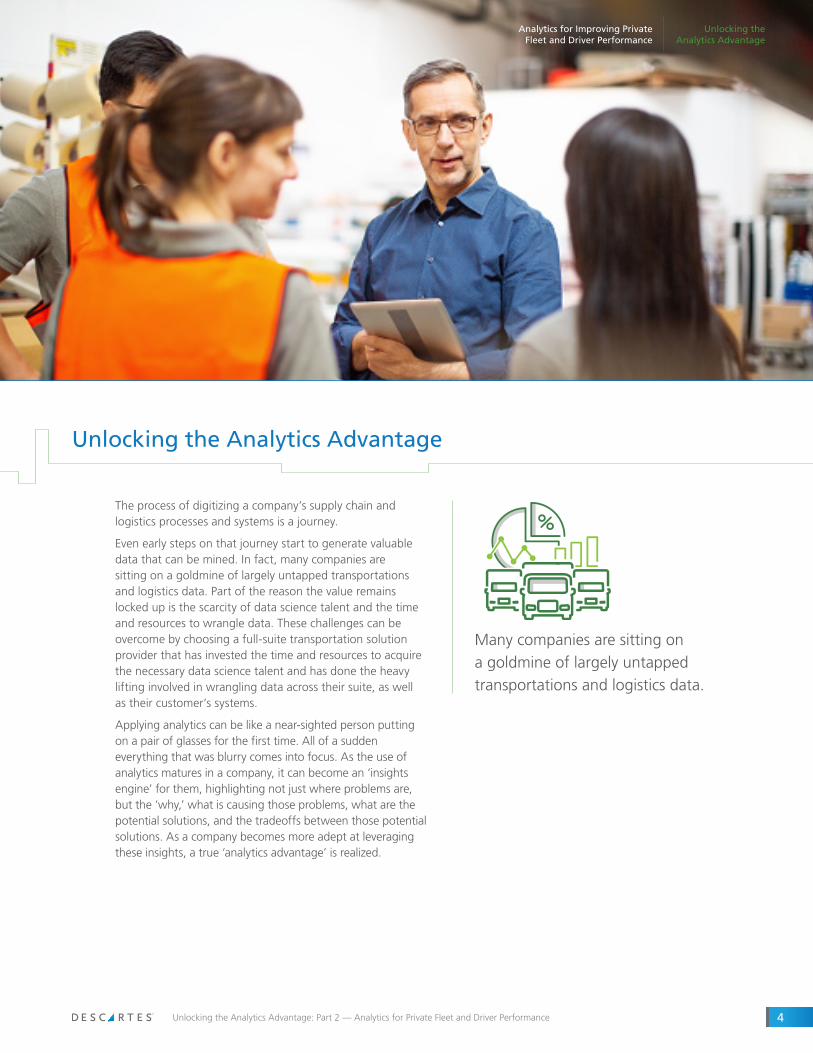
Many companies are sitting on a goldmine of largely untapped transportations and logistics data.
The process of digitizing a company’s supply chain and logistics processes and systems is a journey.
Even early steps on that journey start to generate valuable data that can be mined. In fact, many companies are sitting on a goldmine of largely untapped transportations and logistics data. Part of the reason the value remains locked up is the scarcity of data science talent and the time and resources to wrangle data. These challenges can be overcome by choosing a full-suite transportation solution provider that has invested the time and resources to acquire the necessary data science talent and has done the heavy lifting involved in wrangling data across their suite, as well as their customer’s systems.
Applying analytics can be like a near-sighted person putting on a pair of glasses for the first time. All of a sudden everything that was blurry comes into focus. As the use of analytics matures in a company, it can become an ‘insights engine’ for them, highlighting not just where problems are, but the ‘why,’ what is causing those problems, what are the potential solutions, and the tradeoffs between those potential solutions. As a company becomes more adept at leveraging these insights, a true ‘analytics advantage’ is realized.
Unlocking the Analytics Advantage: Part 2 — Analytics for Private Fleet and Driver Performance 4
Unlocking the Analytics Advantage
Analytics for Improving Private Fleet and Driver Performance
Notes
1 More advanced predictive maintenance typically requires dedicated software designed for that purpose.
2 ELD = Electronic Logging Device. For more see Use Cases for Driving Value from ELD Mandates
3 HOS = Hours of Service, limits for drivers mandated by the federal government.
4 According to a recent (Oct. 2019) survey of 2,500 consumers by Convoy, “98% of shoppers will stake their brand loyalty based on their delivery experience. Our survey uncovered that there are two major shipping factors that drive shoppers to buy from the retailer again: Setting initial expectations by defining strict delivery expectations, as early in the customer journey as the shopping cart, and following through on brand promises with communication, especially if the delivery goes sideways.”
Unlocking the Analytics Advantage: Part 2 — Analytics for Private Fleet and Driver Performance 5
About ChainLink Research
ChainLink Research, Inc. is a Supply Chain research organization dedicated to helping executives improve business performance and competitiveness through an understanding of real-world implications, obstacles and results for supply-chain policies, practices, processes, and technologies. The ChainLink 3Pe Model is the basis for our research; a unique, multidimensional framework for managing and improving the links between supply chain partners.
For more information, contact ChainLink Research at:
321 Walnut Street, Suite 442, Newton, MA 02460-1927
www.clresearch.com
(617) 762-4040
© 2020 ChainLink Research, All Rights Reserved.
www.descartes.com