Embed Size (px)
Citation preview
Introduction This study forms part of a larger research component of the Eco-health Field Building Leadership Initiative (FBLI) in Vietnam to address human health
problems related to agricultural intensification and human waste management in Ha Nam Province that involve multi-stakeholders and multi-institutions
as well as policy makers. Hanam province is located within the Red River Deltain Northern Vietnam and is dominated by flat land. The natural conditions
favour diverse agricultural activities. Poultry raising is the common farming practice.
Objectives
The objective of this study was to determine the factors
influencing the transformation process of poultry
production in Ha Nam province.
Materials and methods Multistage and random sampling procedures were
employed to select 461 farmers. Both structured
questionnaires and in-depth interviews were used to
collect data on the characteristics and dynamics of
poultry farms. The information for 2013 and during the
last five years was based on actual data, but
information for 2008 was based on recall of household
members. The collected information was analysed by
applying descriptive statistics and qualitative analysis.
Conclusion
Poultry farming will continue to change in the future. While a range of factors have contributed to these changes, input and output prices and
capital are the most important drivers. Future changes of poultry production processes will also depend on dynamic relationships among
these factors.
Dinh Xuan Tung1, Pham Duc Phuc2, Le Thi Phuong Hong2, Nguyen Mai Huong2, Tran Thi Tuyet Hanh2, Tran Minh Hang3, Nguyen Viet Hung24
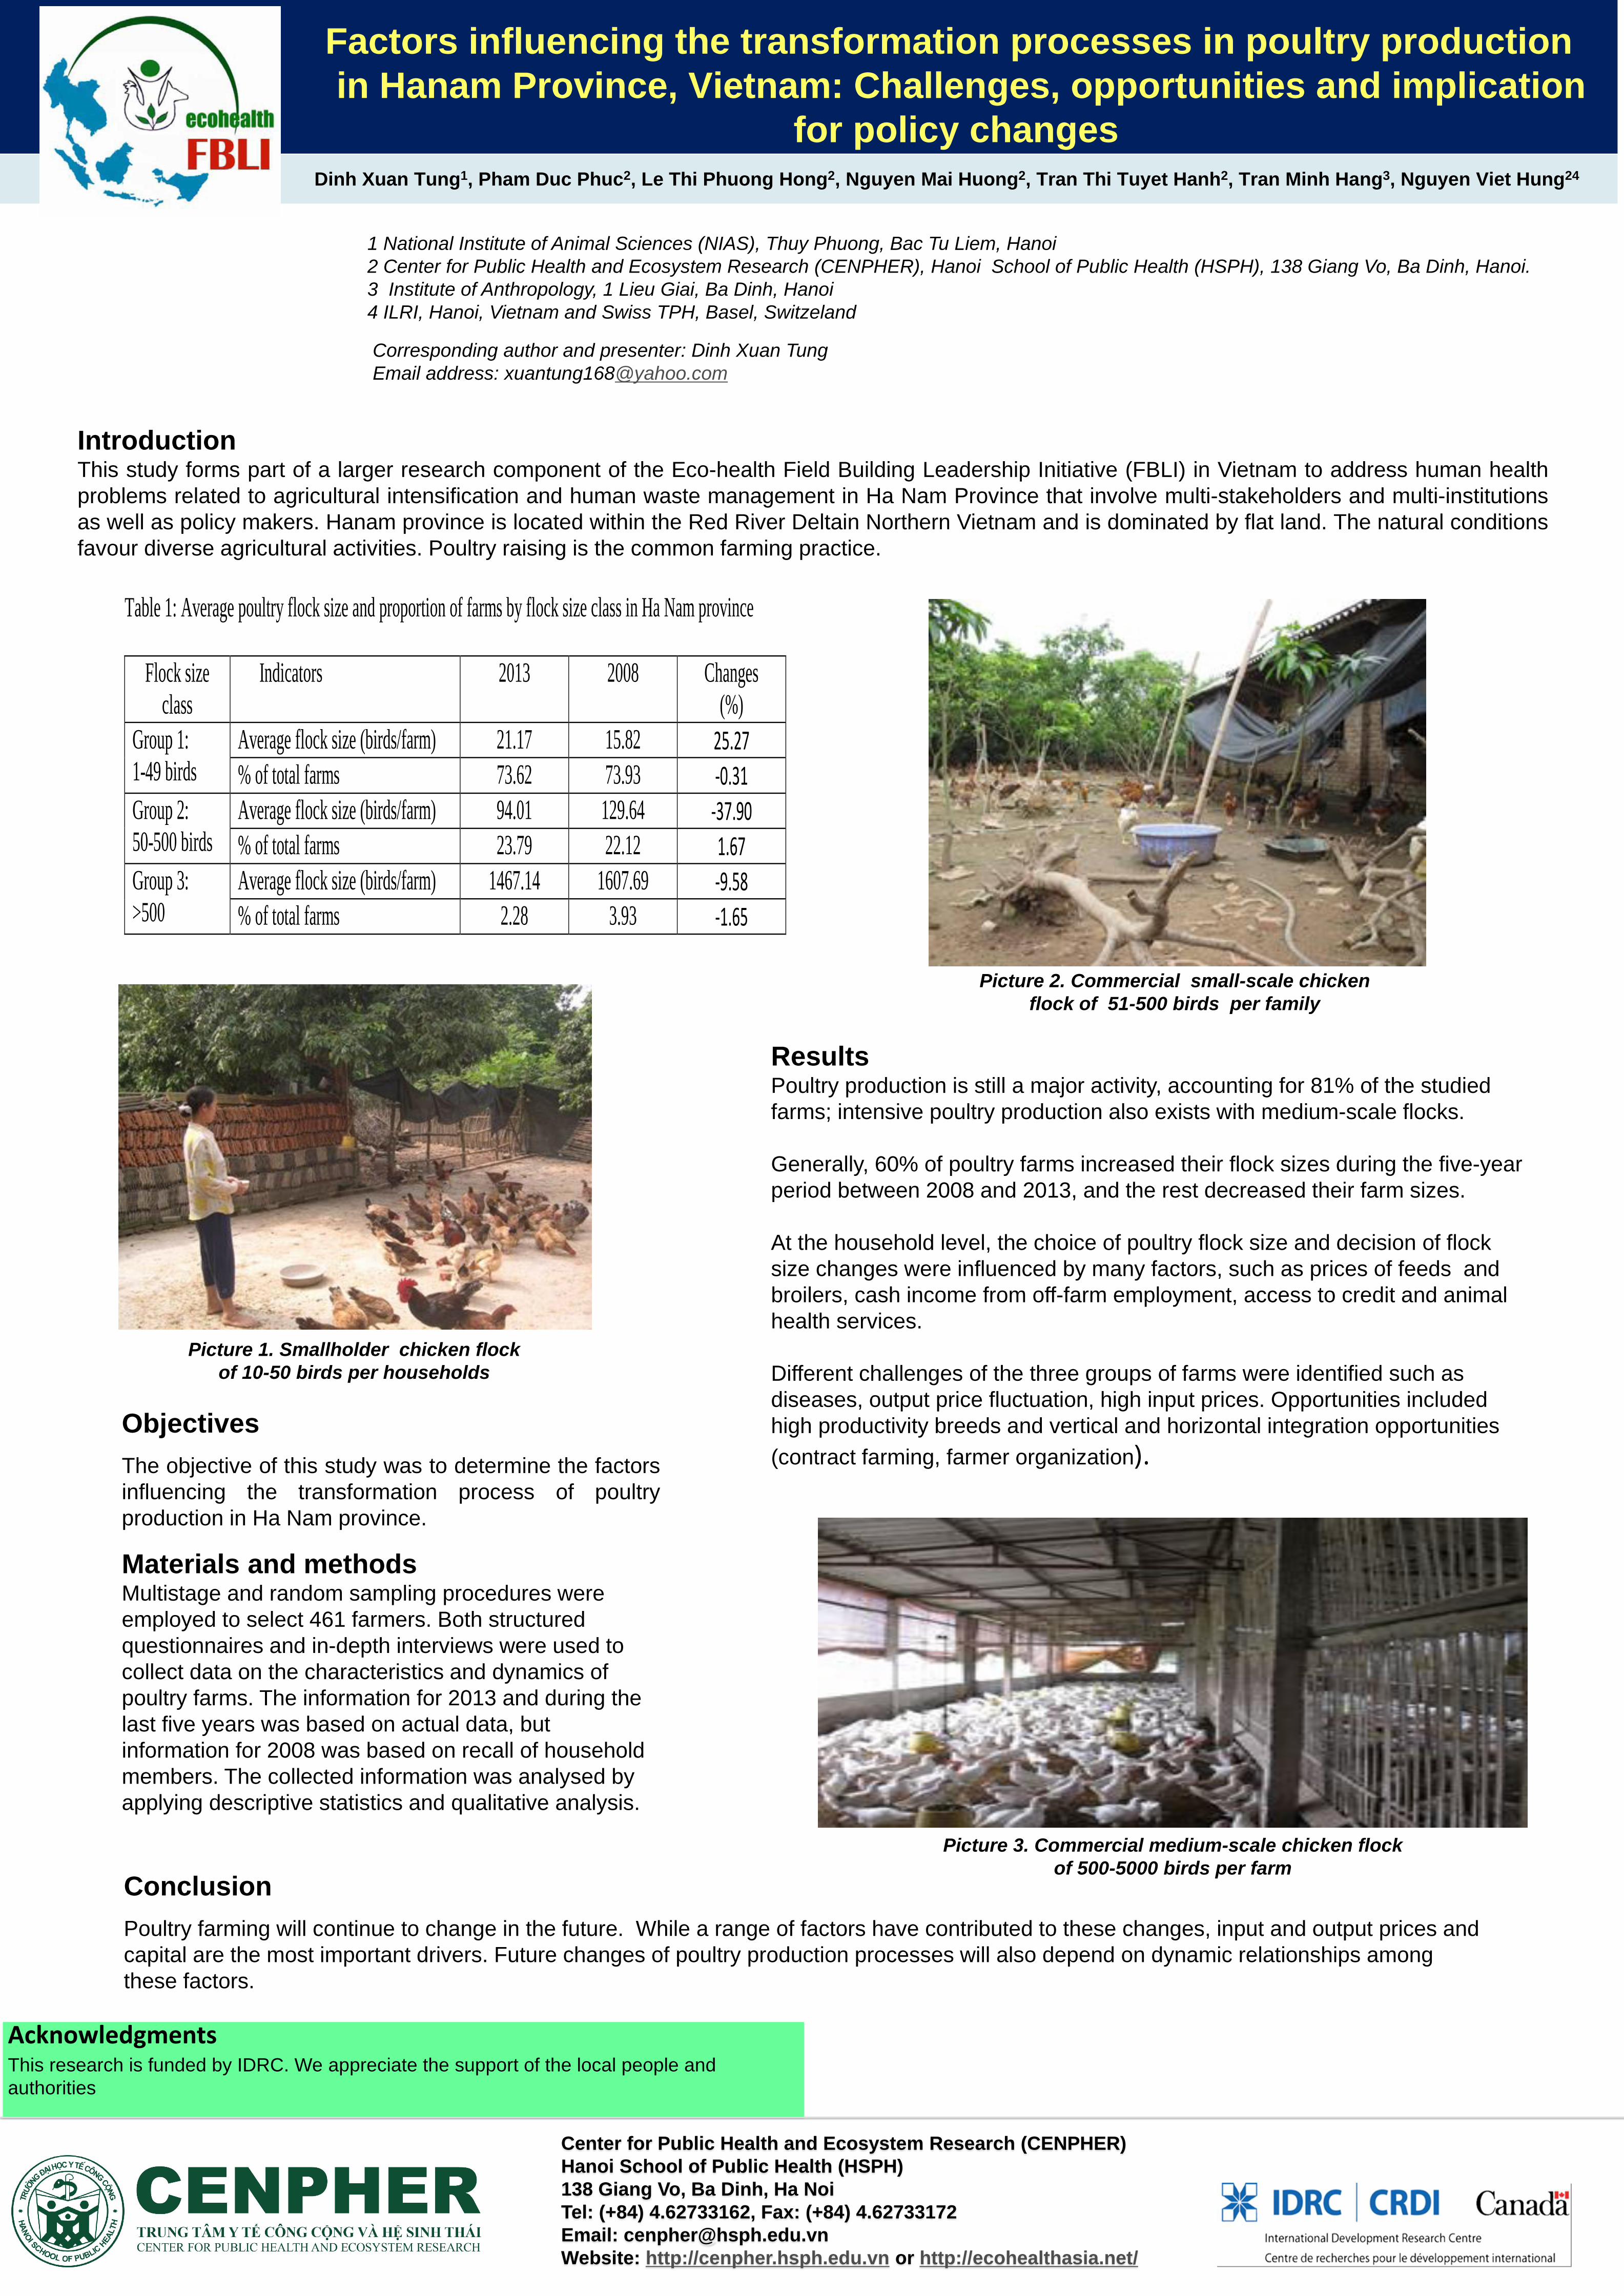
Factors influencing the transformation processes in poultry production
in Hanam Province, Vietnam: Challenges, opportunities and implication
for policy changes
Results Poultry production is still a major activity, accounting for 81% of the studied
farms; intensive poultry production also exists with medium-scale flocks.
Generally, 60% of poultry farms increased their flock sizes during the five-year
period between 2008 and 2013, and the rest decreased their farm sizes.
At the household level, the choice of poultry flock size and decision of flock
size changes were influenced by many factors, such as prices of feeds and
broilers, cash income from off-farm employment, access to credit and animal
health services.
Different challenges of the three groups of farms were identified such as
diseases, output price fluctuation, high input prices. Opportunities included
high productivity breeds and vertical and horizontal integration opportunities
(contract farming, farmer organization).
1 National Institute of Animal Sciences (NIAS), Thuy Phuong, Bac Tu Liem, Hanoi
2 Center for Public Health and Ecosystem Research (CENPHER), Hanoi School of Public Health (HSPH), 138 Giang Vo, Ba Dinh, Hanoi.
3 Institute of Anthropology, 1 Lieu Giai, Ba Dinh, Hanoi
4 ILRI, Hanoi, Vietnam and Swiss TPH, Basel, Switzeland
Corresponding author and presenter: Dinh Xuan Tung
Email address: [email protected]
Center for Public Health and Ecosystem Research (CENPHER)
Hanoi School of Public Health (HSPH)
138 Giang Vo, Ba Dinh, Ha Noi
Tel: (+84) 4.62733162, Fax: (+84) 4.62733172
Email: [email protected]
Website: http://cenpher.hsph.edu.vn or http://ecohealthasia.net/
Acknowledgments This research is funded by IDRC. We appreciate the support of the local people and
authorities
Picture 1. Smallholder chicken flock
of 10-50 birds per households
Picture 2. Commercial small-scale chicken
flock of 51-500 birds per family
Picture 3. Commercial medium-scale chicken flock
of 500-5000 birds per farm
Table 1: Average poultry flock size and proportion of farms by flock size class in Ha Nam province
Flock size
class
Indicators 2013 2008 Changes
(%)
Group 1:
1-49 birds
Average flock size (birds/farm) 21.17 15.82 25.27 % of total farms 73.62 73.93 -0.31
Group 2:
50-500 birds
Average flock size (birds/farm) 94.01 129.64 -37.90 % of total farms 23.79 22.12 1.67
Group 3:
>500
Average flock size (birds/farm) 1467.14 1607.69 -9.58 % of total farms 2.28 3.93 -1.65


![Basel 3 & Implication[1]](https://img.pdfslide.us/doc/110x75/577d1e721a28ab4e1e8e9042/basel-3-implication1.jpg)