Embed Size (px)
Citation preview
Doug HollettDeputy Assistant Secretary for Renewable Power
Office of Energy Efficiency and Renewable Energy FY 2017 Budget Overview | February 29, 2016
2
EERE Overview
3
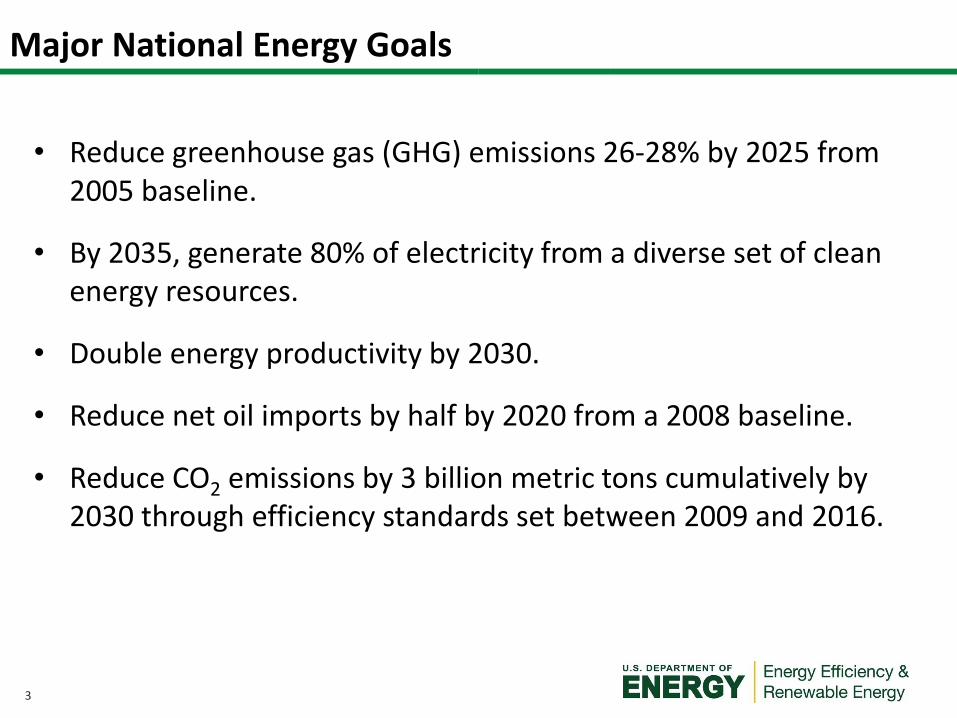
Major National Energy Goals
• Reduce greenhouse gas (GHG) emissions 26-28% by 2025 from 2005 baseline.
• By 2035, generate 80% of electricity from a diverse set of clean energy resources.
• Double energy productivity by 2030.
• Reduce net oil imports by half by 2020 from a 2008 baseline.
• Reduce CO2 emissions by 3 billion metric tons cumulatively by 2030 through efficiency standards set between 2009 and 2016.
4
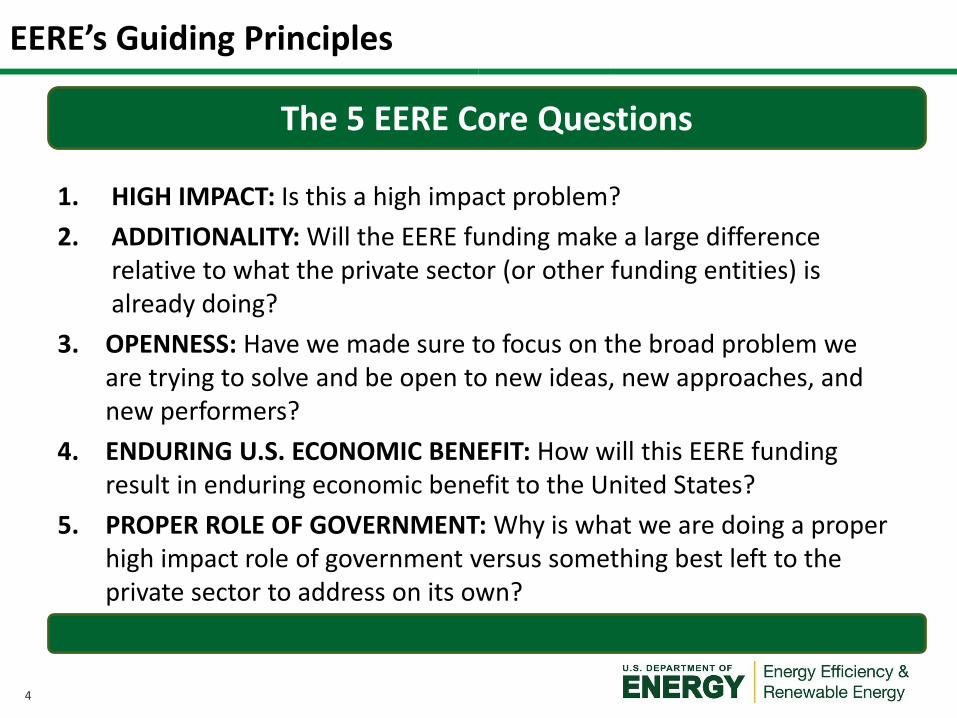
EERE’s Guiding Principles
1. HIGH IMPACT: Is this a high impact problem?
2. ADDITIONALITY: Will the EERE funding make a large difference relative to what the private sector (or other funding entities) is already doing?
3. OPENNESS: Have we made sure to focus on the broad problem we are trying to solve and be open to new ideas, new approaches, and new performers?
4. ENDURING U.S. ECONOMIC BENEFIT: How will this EERE funding result in enduring economic benefit to the United States?
5. PROPER ROLE OF GOVERNMENT: Why is what we are doing a proper high impact role of government versus something best left to the private sector to address on its own?
The 5 EERE Core Questions
5
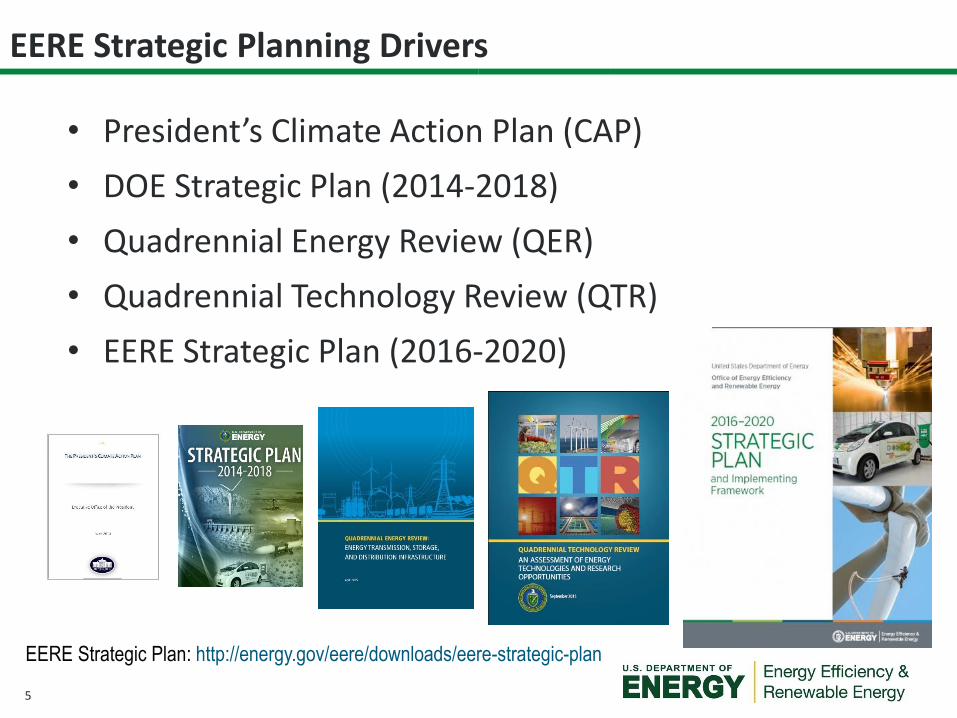
• President’s Climate Action Plan (CAP)
• DOE Strategic Plan (2014-2018)
• Quadrennial Energy Review (QER)
• Quadrennial Technology Review (QTR)
• EERE Strategic Plan (2016-2020)
EERE Strategic Planning Drivers
EERE Strategic Plan: http://energy.gov/eere/downloads/eere-strategic-plan
6
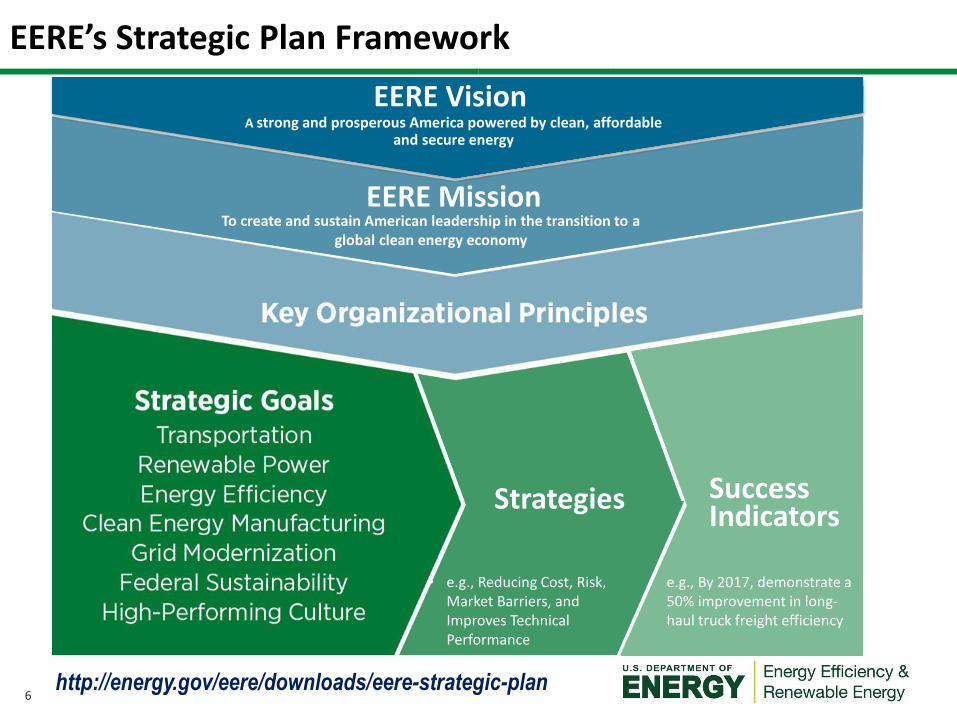
EERE’s Strategic Plan Framework
Strategic Plan FrameworkEERE Vision
EERE Mission
A strong and prosperous America powered by clean, affordable and secure energy
To create and sustain American leadership in the transition to a global clean energy economy
Strategies SuccessIndicators
• e.g., Reducing Cost, Risk, Market Barriers, and Improves Technical Performance
e.g., By 2017, demonstrate a 50% improvement in long-haul truck freight efficiency
http://energy.gov/eere/downloads/eere-strategic-plan
7
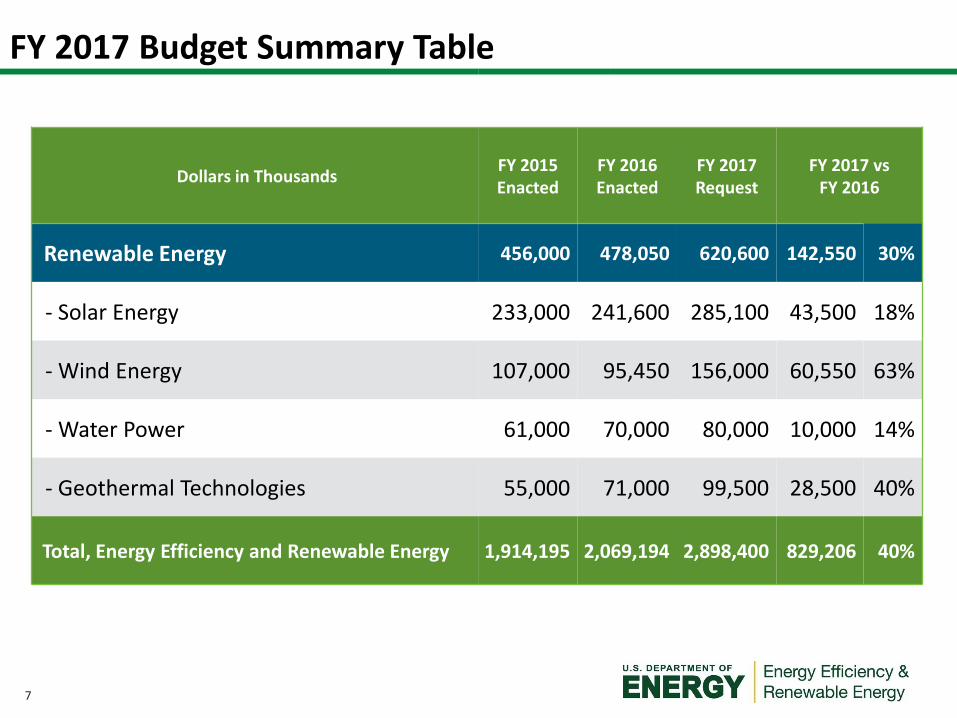
FY 2017 Budget Summary Table
Dollars in ThousandsFY 2015Enacted
FY 2016Enacted
FY 2017Request
FY 2017 vsFY 2016
Renewable Energy 456,000 478,050 620,600 142,550 30%
- Solar Energy 233,000 241,600 285,100 43,500 18%
- Wind Energy 107,000 95,450 156,000 60,550 63%
- Water Power 61,000 70,000 80,000 10,000 14%
- Geothermal Technologies 55,000 71,000 99,500 28,500 40%
Total, Energy Efficiency and Renewable Energy 1,914,195 2,069,194 2,898,400 829,206 40%
8
Strategic Goal: Increase the generation of electric power from renewable sources
9
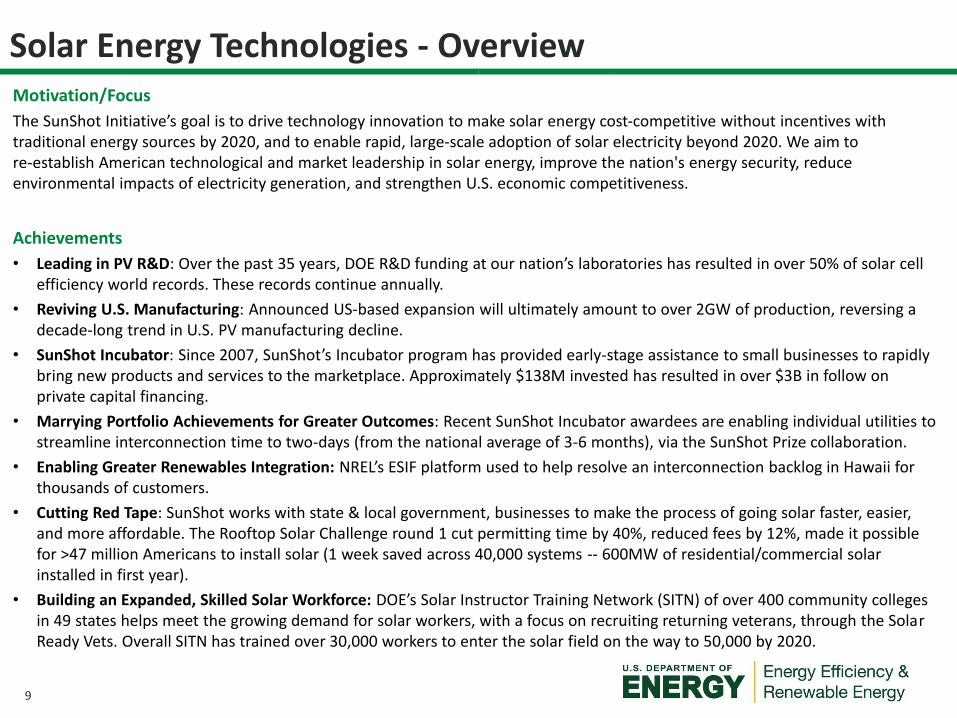
Solar Energy Technologies - OverviewMotivation/Focus
The SunShot Initiative’s goal is to drive technology innovation to make solar energy cost‐competitive without incentives with traditional energy sources by 2020, and to enable rapid, large‐scale adoption of solar electricity beyond 2020. We aim to re‐establish American technological and market leadership in solar energy, improve the nation's energy security, reduce environmental impacts of electricity generation, and strengthen U.S. economic competitiveness.
Achievements
• Leading in PV R&D: Over the past 35 years, DOE R&D funding at our nation’s laboratories has resulted in over 50% of solar cell efficiency world records. These records continue annually.
• Reviving U.S. Manufacturing: Announced US-based expansion will ultimately amount to over 2GW of production, reversing a decade-long trend in U.S. PV manufacturing decline.
• SunShot Incubator: Since 2007, SunShot’s Incubator program has provided early-stage assistance to small businesses to rapidly bring new products and services to the marketplace. Approximately $138M invested has resulted in over $3B in follow on private capital financing.
• Marrying Portfolio Achievements for Greater Outcomes: Recent SunShot Incubator awardees are enabling individual utilities to streamline interconnection time to two-days (from the national average of 3-6 months), via the SunShot Prize collaboration.
• Enabling Greater Renewables Integration: NREL’s ESIF platform used to help resolve an interconnection backlog in Hawaii for thousands of customers.
• Cutting Red Tape: SunShot works with state & local government, businesses to make the process of going solar faster, easier, and more affordable. The Rooftop Solar Challenge round 1 cut permitting time by 40%, reduced fees by 12%, made it possible for >47 million Americans to install solar (1 week saved across 40,000 systems -- 600MW of residential/commercial solar installed in first year).
• Building an Expanded, Skilled Solar Workforce: DOE’s Solar Instructor Training Network (SITN) of over 400 community colleges in 49 states helps meet the growing demand for solar workers, with a focus on recruiting returning veterans, through the Solar Ready Vets. Overall SITN has trained over 30,000 workers to enter the solar field on the way to 50,000 by 2020.
10
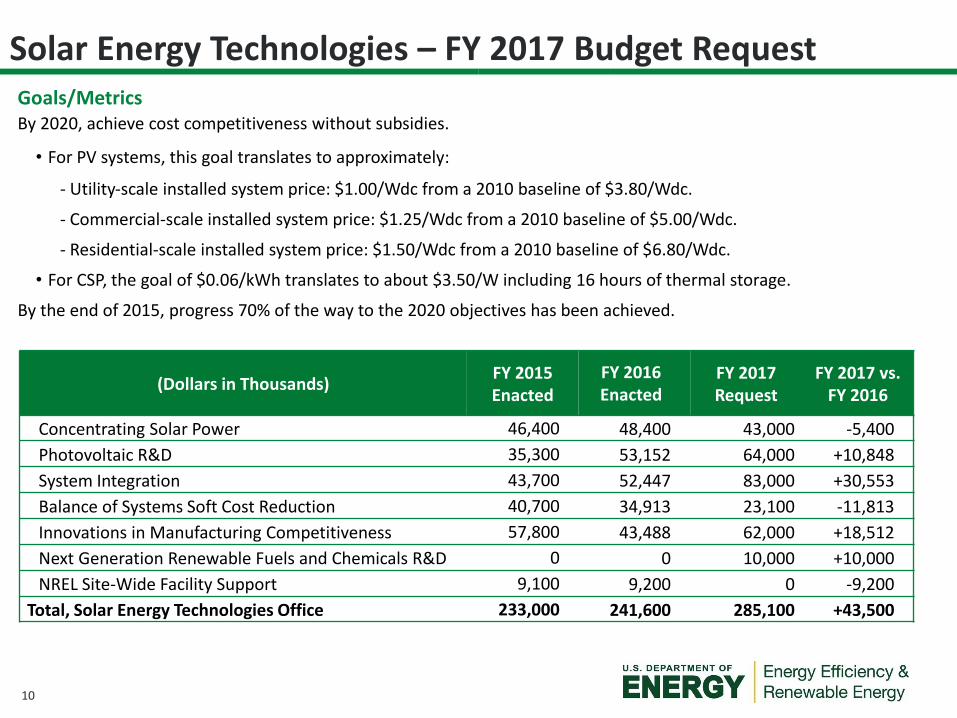
Solar Energy Technologies – FY 2017 Budget Request
(Dollars in Thousands)FY 2015 Enacted
FY 2016Enacted
FY 2017 Request
FY 2017 vs. FY 2016
Concentrating Solar Power 46,400 48,400 43,000 -5,400
Photovoltaic R&D 35,300 53,152 64,000 +10,848
System Integration 43,700 52,447 83,000 +30,553
Balance of Systems Soft Cost Reduction 40,700 34,913 23,100 -11,813
Innovations in Manufacturing Competitiveness 57,800 43,488 62,000 +18,512
Next Generation Renewable Fuels and Chemicals R&D 0 0 10,000 +10,000
NREL Site-Wide Facility Support 9,100 9,200 0 -9,200
Total, Solar Energy Technologies Office 233,000 241,600 285,100 +43,500
Goals/MetricsBy 2020, achieve cost competitiveness without subsidies.
• For PV systems, this goal translates to approximately:
- Utility‐scale installed system price: $1.00/Wdc from a 2010 baseline of $3.80/Wdc.
- Commercial‐scale installed system price: $1.25/Wdc from a 2010 baseline of $5.00/Wdc.
- Residential‐scale installed system price: $1.50/Wdc from a 2010 baseline of $6.80/Wdc.
• For CSP, the goal of $0.06/kWh translates to about $3.50/W including 16 hours of thermal storage.
By the end of 2015, progress 70% of the way to the 2020 objectives has been achieved.
11
Solar Energy Technologies – FY 2017 Budget Highlights
• Advanced Power Electronics Solutions for Distributed PV ($20M): Supports development of cutting-edge approaches to reduce the cost and improve the reliability and functionality of power electronics associated with solar energy systems.
• Next Generation PV Modules ($18M): R&D focused on non-cell module components and design, which comprise 40% of typical module cost and have the potential to significantly impact PV performance as well as installation cost.
• Bridging Research Interactions Cooperative Grants (BRIDGE) ($15M): Partnerships with basic science researchers to understand degradation modes that limit PV reliability and to develop new PV characterization techniques.
• Concentrating Solar Power Desalination ($15M): R&D to explore using thermal energy systems for cost-effective water purification and desalination strategies, in support of the DOE Energy-Water Nexus Crosscut.
• Next Generation Renewable Fuels and Chemicals ($10M): New subprogram to support the transition to a clean energy economy through innovative approaches of converting and storing solar power into usable fuels.
12
Wind Power Technologies – Overview
Motivation/FocusEERE’s Wind Energy Program seeks to establish a competitive U.S. wind industry through cost reduction activities focused on technology RD&D, offshore demonstrations, efforts to eliminate and reduce market barriers, and efforts to enable the seamless and cost effective integration of growing amounts of wind power into the electric grid.
Achievements
• The unsubsidized cost of U.S. wind energy has decreased by more than 90%—from $0.585 /kilowatt hour (kWh, $2015) in 1980 to $0.044 /kWh ($2015) in 2014 in good to excellent wind resource sites (without subsidies)—and has decreased by more than 40% over just the last 5 years.
• Wind deployment has grown substantially, with total cumulative U.S. wind installed capacity at 2015 year-end of approximately 74.5 GW (~5% of total U.S. consumption), representing greater than a fourfold increase in installed capacity from 17 GW at 2007 year-end.
• The “Atmosphere to Electrons” (A2e) wind plant optimization R&D consortium continues cutting edge research to optimize the cost and performance of fully integrated wind plants. A2e completed its experimental planetary boundary layer instrumentation assessment (XPIA) and conducted its second annual merit review, including review of the draft A2e Strategic Plan.
• Released stakeholder supported (Industry, Academia, Researchers and NGO’s) Wind Vision report, outlining a credible robust wind energy future by 2020, 2030 and 2050, inclusive of multi-stakeholder actions (Roadmap)
13
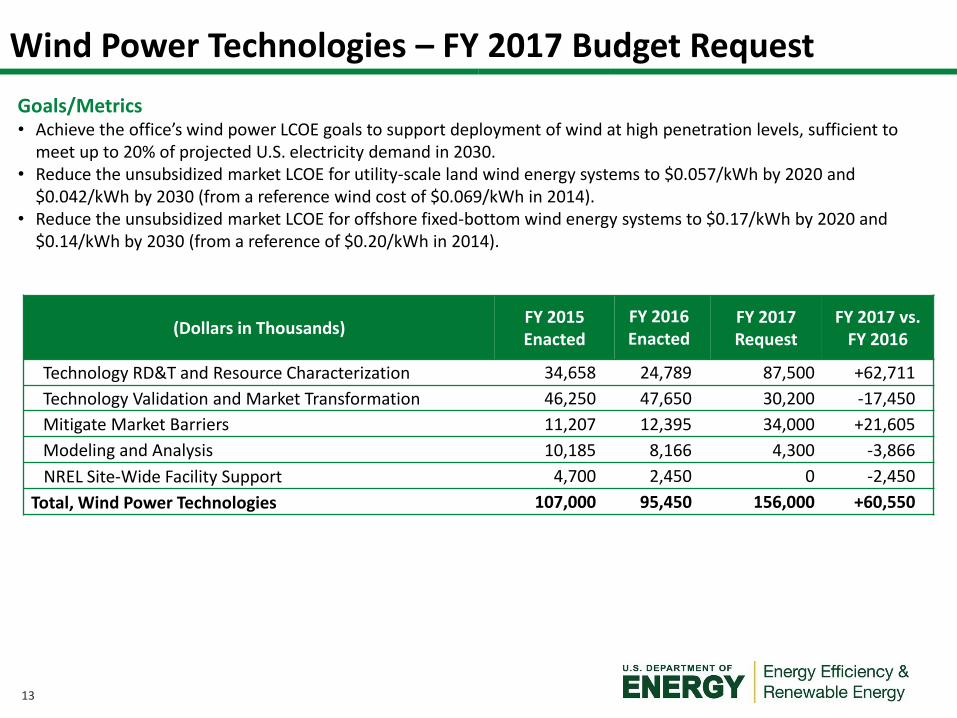
Wind Power Technologies – FY 2017 Budget Request
(Dollars in Thousands)FY 2015 Enacted
FY 2016 Enacted
FY 2017Request
FY 2017 vs. FY 2016
Technology RD&T and Resource Characterization 34,658 24,789 87,500 +62,711
Technology Validation and Market Transformation 46,250 47,650 30,200 -17,450
Mitigate Market Barriers 11,207 12,395 34,000 +21,605
Modeling and Analysis 10,185 8,166 4,300 -3,866
NREL Site-Wide Facility Support 4,700 2,450 0 -2,450
Total, Wind Power Technologies 107,000 95,450 156,000 +60,550
Goals/Metrics• Achieve the office’s wind power LCOE goals to support deployment of wind at high penetration levels, sufficient to
meet up to 20% of projected U.S. electricity demand in 2030.• Reduce the unsubsidized market LCOE for utility-scale land wind energy systems to $0.057/kWh by 2020 and
$0.042/kWh by 2030 (from a reference wind cost of $0.069/kWh in 2014).• Reduce the unsubsidized market LCOE for offshore fixed-bottom wind energy systems to $0.17/kWh by 2020 and
$0.14/kWh by 2030 (from a reference of $0.20/kWh in 2014).
14
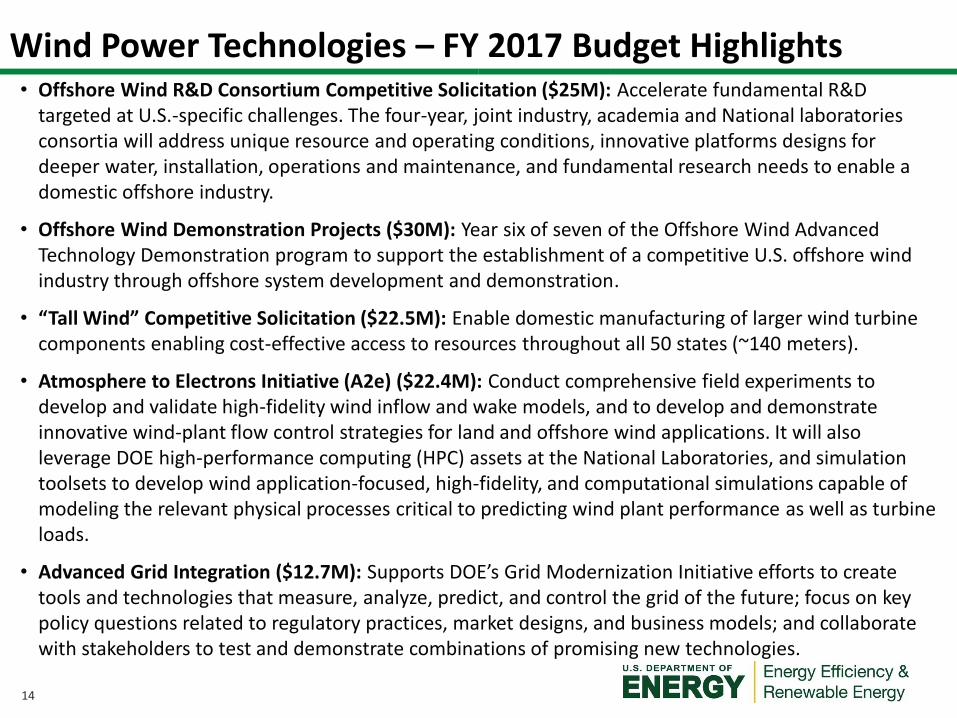
Wind Power Technologies – FY 2017 Budget Highlights• Offshore Wind R&D Consortium Competitive Solicitation ($25M): Accelerate fundamental R&D
targeted at U.S.-specific challenges. The four-year, joint industry, academia and National laboratories consortia will address unique resource and operating conditions, innovative platforms designs for deeper water, installation, operations and maintenance, and fundamental research needs to enable a domestic offshore industry.
• Offshore Wind Demonstration Projects ($30M): Year six of seven of the Offshore Wind Advanced Technology Demonstration program to support the establishment of a competitive U.S. offshore wind industry through offshore system development and demonstration.
• “Tall Wind” Competitive Solicitation ($22.5M): Enable domestic manufacturing of larger wind turbine components enabling cost-effective access to resources throughout all 50 states (~140 meters).
• Atmosphere to Electrons Initiative (A2e) ($22.4M): Conduct comprehensive field experiments to develop and validate high-fidelity wind inflow and wake models, and to develop and demonstrate innovative wind-plant flow control strategies for land and offshore wind applications. It will also leverage DOE high-performance computing (HPC) assets at the National Laboratories, and simulation toolsets to develop wind application-focused, high-fidelity, and computational simulations capable of modeling the relevant physical processes critical to predicting wind plant performance as well as turbine loads.
• Advanced Grid Integration ($12.7M): Supports DOE’s Grid Modernization Initiative efforts to create tools and technologies that measure, analyze, predict, and control the grid of the future; focus on key policy questions related to regulatory practices, market designs, and business models; and collaborate with stakeholders to test and demonstrate combinations of promising new technologies.
15
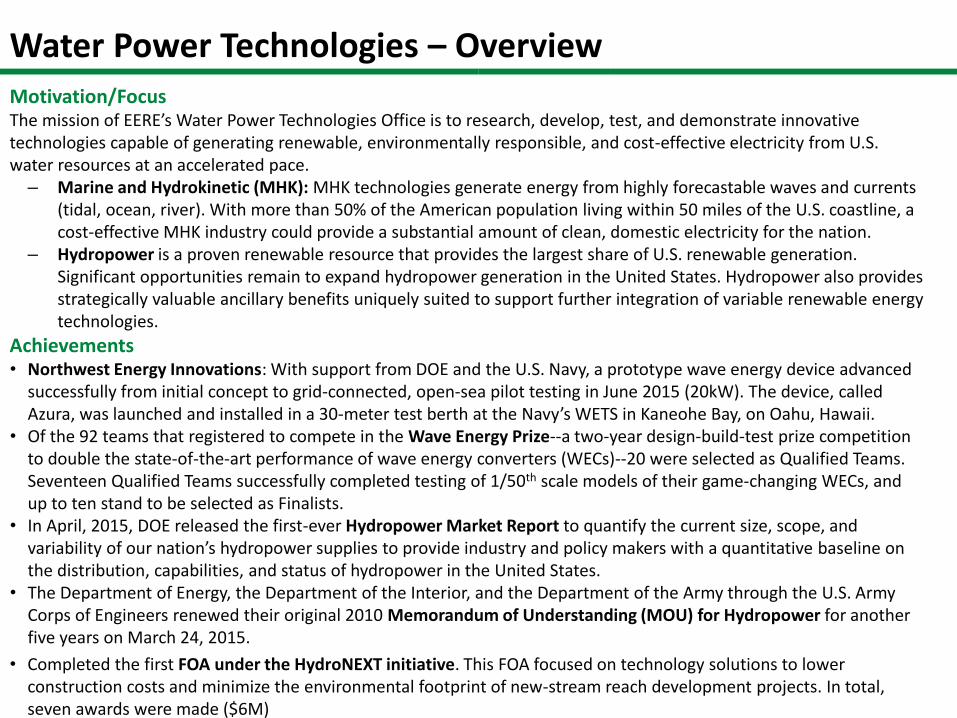
Water Power Technologies – OverviewMotivation/FocusThe mission of EERE’s Water Power Technologies Office is to research, develop, test, and demonstrate innovative technologies capable of generating renewable, environmentally responsible, and cost-effective electricity from U.S. water resources at an accelerated pace. – Marine and Hydrokinetic (MHK): MHK technologies generate energy from highly forecastable waves and currents
(tidal, ocean, river). With more than 50% of the American population living within 50 miles of the U.S. coastline, a cost-effective MHK industry could provide a substantial amount of clean, domestic electricity for the nation.
– Hydropower is a proven renewable resource that provides the largest share of U.S. renewable generation. Significant opportunities remain to expand hydropower generation in the United States. Hydropower also provides strategically valuable ancillary benefits uniquely suited to support further integration of variable renewable energy technologies.
Achievements• Northwest Energy Innovations: With support from DOE and the U.S. Navy, a prototype wave energy device advanced
successfully from initial concept to grid-connected, open-sea pilot testing in June 2015 (20kW). The device, called Azura, was launched and installed in a 30-meter test berth at the Navy’s WETS in Kaneohe Bay, on Oahu, Hawaii.
• Of the 92 teams that registered to compete in the Wave Energy Prize--a two-year design-build-test prize competition to double the state-of-the-art performance of wave energy converters (WECs)--20 were selected as Qualified Teams. Seventeen Qualified Teams successfully completed testing of 1/50th scale models of their game-changing WECs, and up to ten stand to be selected as Finalists.
• In April, 2015, DOE released the first-ever Hydropower Market Report to quantify the current size, scope, and variability of our nation’s hydropower supplies to provide industry and policy makers with a quantitative baseline on the distribution, capabilities, and status of hydropower in the United States.
• The Department of Energy, the Department of the Interior, and the Department of the Army through the U.S. Army Corps of Engineers renewed their original 2010 Memorandum of Understanding (MOU) for Hydropower for another five years on March 24, 2015.
• Completed the first FOA under the HydroNEXT initiative. This FOA focused on technology solutions to lower construction costs and minimize the environmental footprint of new-stream reach development projects. In total, seven awards were made ($6M)
16
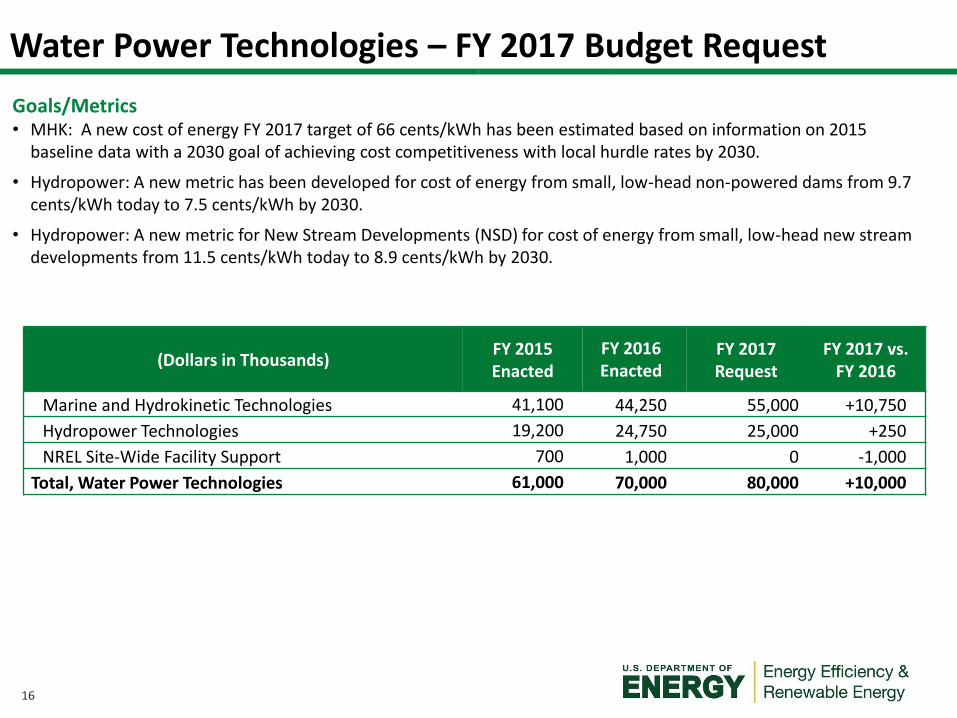
Water Power Technologies – FY 2017 Budget Request
(Dollars in Thousands)FY 2015 Enacted
FY 2016 Enacted
FY 2017 Request
FY 2017 vs. FY 2016
Marine and Hydrokinetic Technologies 41,100 44,250 55,000 +10,750
Hydropower Technologies 19,200 24,750 25,000 +250
NREL Site-Wide Facility Support 700 1,000 0 -1,000
Total, Water Power Technologies 61,000 70,000 80,000 +10,000
Goals/Metrics• MHK: A new cost of energy FY 2017 target of 66 cents/kWh has been estimated based on information on 2015
baseline data with a 2030 goal of achieving cost competitiveness with local hurdle rates by 2030.
• Hydropower: A new metric has been developed for cost of energy from small, low-head non-powered dams from 9.7 cents/kWh today to 7.5 cents/kWh by 2030.
• Hydropower: A new metric for New Stream Developments (NSD) for cost of energy from small, low-head new stream developments from 11.5 cents/kWh today to 8.9 cents/kWh by 2030.
17
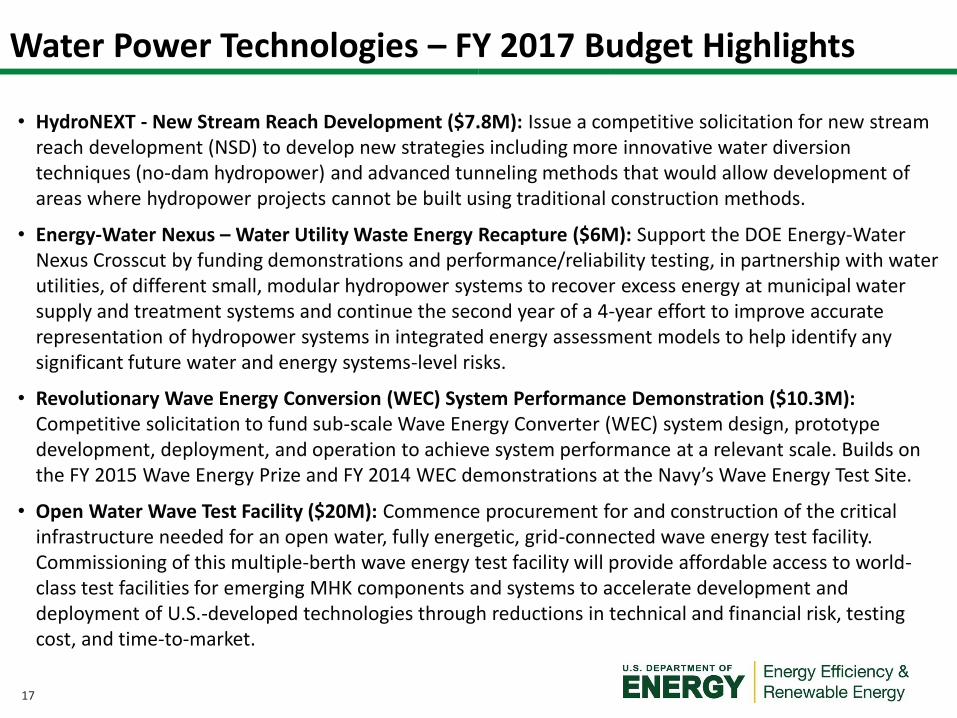
Water Power Technologies – FY 2017 Budget Highlights
• HydroNEXT - New Stream Reach Development ($7.8M): Issue a competitive solicitation for new stream reach development (NSD) to develop new strategies including more innovative water diversion techniques (no-dam hydropower) and advanced tunneling methods that would allow development of areas where hydropower projects cannot be built using traditional construction methods.
• Energy-Water Nexus – Water Utility Waste Energy Recapture ($6M): Support the DOE Energy-Water Nexus Crosscut by funding demonstrations and performance/reliability testing, in partnership with water utilities, of different small, modular hydropower systems to recover excess energy at municipal water supply and treatment systems and continue the second year of a 4-year effort to improve accurate representation of hydropower systems in integrated energy assessment models to help identify any significant future water and energy systems-level risks.
• Revolutionary Wave Energy Conversion (WEC) System Performance Demonstration ($10.3M):Competitive solicitation to fund sub-scale Wave Energy Converter (WEC) system design, prototype development, deployment, and operation to achieve system performance at a relevant scale. Builds on the FY 2015 Wave Energy Prize and FY 2014 WEC demonstrations at the Navy’s Wave Energy Test Site.
• Open Water Wave Test Facility ($20M): Commence procurement for and construction of the critical infrastructure needed for an open water, fully energetic, grid-connected wave energy test facility. Commissioning of this multiple-berth wave energy test facility will provide affordable access to world-class test facilities for emerging MHK components and systems to accelerate development and deployment of U.S.-developed technologies through reductions in technical and financial risk, testing cost, and time-to-market.
18
Geothermal Technologies – Overview
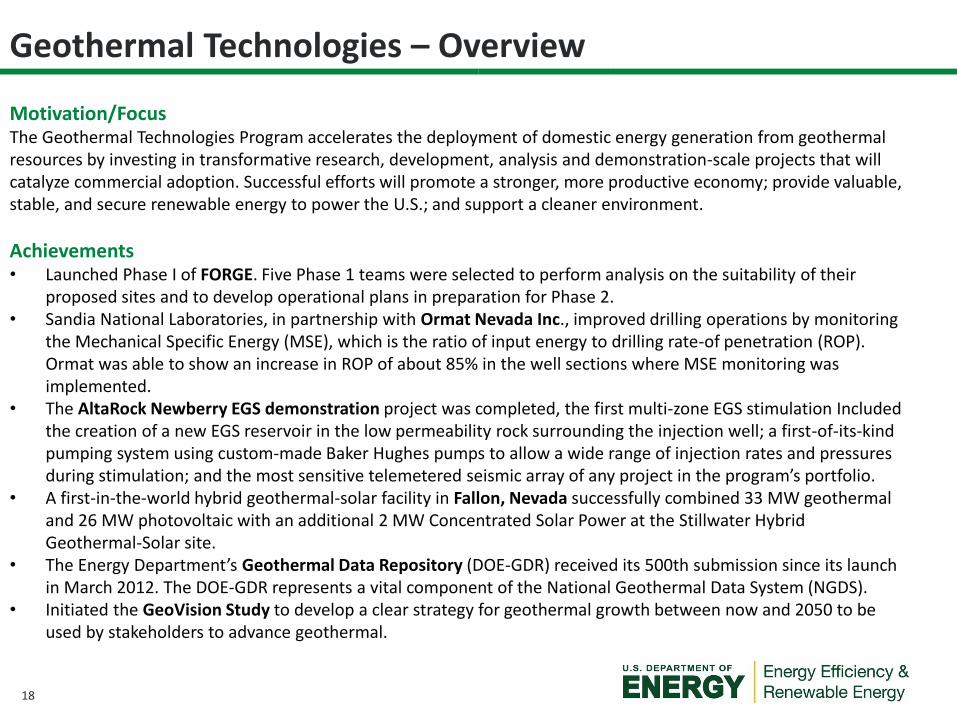
Motivation/FocusThe Geothermal Technologies Program accelerates the deployment of domestic energy generation from geothermal resources by investing in transformative research, development, analysis and demonstration-scale projects that will catalyze commercial adoption. Successful efforts will promote a stronger, more productive economy; provide valuable, stable, and secure renewable energy to power the U.S.; and support a cleaner environment.
Achievements• Launched Phase I of FORGE. Five Phase 1 teams were selected to perform analysis on the suitability of their
proposed sites and to develop operational plans in preparation for Phase 2. • Sandia National Laboratories, in partnership with Ormat Nevada Inc., improved drilling operations by monitoring
the Mechanical Specific Energy (MSE), which is the ratio of input energy to drilling rate-of penetration (ROP). Ormat was able to show an increase in ROP of about 85% in the well sections where MSE monitoring was implemented.
• The AltaRock Newberry EGS demonstration project was completed, the first multi-zone EGS stimulation Included the creation of a new EGS reservoir in the low permeability rock surrounding the injection well; a first-of-its-kind pumping system using custom-made Baker Hughes pumps to allow a wide range of injection rates and pressures during stimulation; and the most sensitive telemetered seismic array of any project in the program’s portfolio.
• A first-in-the-world hybrid geothermal-solar facility in Fallon, Nevada successfully combined 33 MW geothermal and 26 MW photovoltaic with an additional 2 MW Concentrated Solar Power at the Stillwater Hybrid Geothermal-Solar site.
• The Energy Department’s Geothermal Data Repository (DOE-GDR) received its 500th submission since its launch in March 2012. The DOE-GDR represents a vital component of the National Geothermal Data System (NGDS).
• Initiated the GeoVision Study to develop a clear strategy for geothermal growth between now and 2050 to be used by stakeholders to advance geothermal.
19
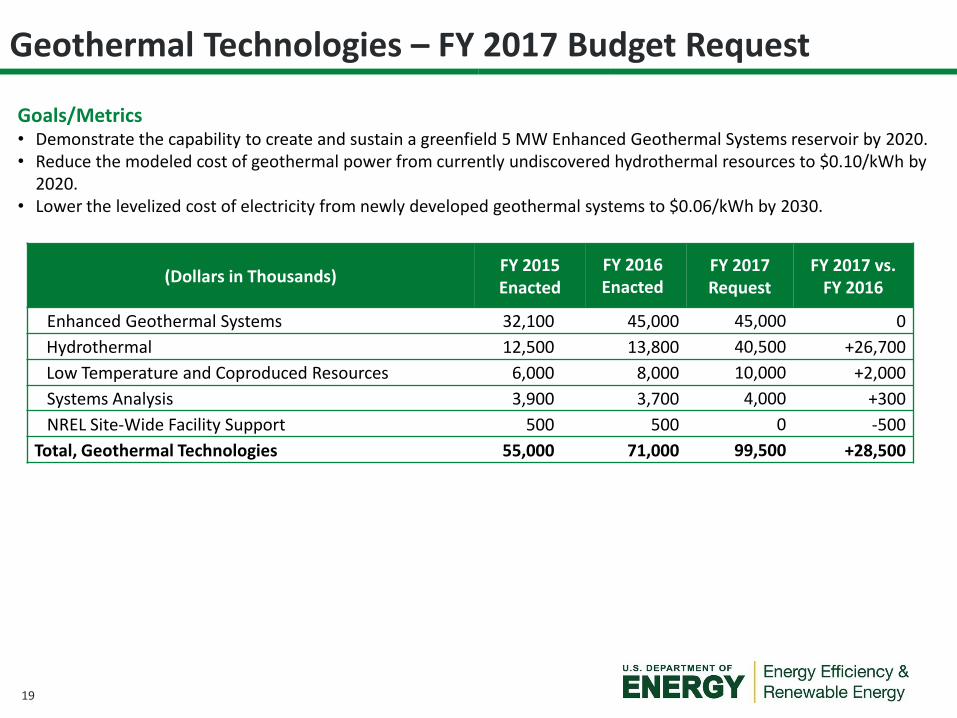
Geothermal Technologies – FY 2017 Budget Request
(Dollars in Thousands)FY 2015 Enacted
FY 2016 Enacted
FY 2017 Request
FY 2017 vs. FY 2016
Enhanced Geothermal Systems 32,100 45,000 45,000 0
Hydrothermal 12,500 13,800 40,500 +26,700
Low Temperature and Coproduced Resources 6,000 8,000 10,000 +2,000
Systems Analysis 3,900 3,700 4,000 +300
NREL Site-Wide Facility Support 500 500 0 -500
Total, Geothermal Technologies 55,000 71,000 99,500 +28,500
Goals/Metrics• Demonstrate the capability to create and sustain a greenfield 5 MW Enhanced Geothermal Systems reservoir by 2020.• Reduce the modeled cost of geothermal power from currently undiscovered hydrothermal resources to $0.10/kWh by
2020.• Lower the levelized cost of electricity from newly developed geothermal systems to $0.06/kWh by 2030.
20
Geothermal Technologies – FY 2017 Budget Highlights
• Frontier Observatory for Research in Geothermal Energy (FORGE) ($35M): Continue full implementation of FORGE field operations. Activities include commencement of drilling, continuation of site characterization, and advancement of a competitive solicitation for R&D projects focusing on reservoir creation technologies.
• Subsurface Technology and Engineering R&D (Subsurface Crosscut) ($33M): Innovative research and development in key areas — wellbore integrity, subsurface stress and induced seismicity, permeability manipulation and new subsurface signals, and advanced imaging of geophysical and geochemical signals in the subsurface — to reduce the cost and risk of geothermal exploration and development.
• Play Fairway Analysis ($5M): Conduct temperature gradient well drilling at targeted areas of hydrothermal potential, culminating in a comprehensive economic and uncertainty analysis of each play fairway to spur future exploration activities and potential development by the geothermal industry.
• Deep Direct Use ($4M): Conduct feasibility studies of low-temperature deep-well geothermal systems coupled with advanced direct use applications and cascaded surface technologies, whose applications extend the reach of geothermal beyond the western U.S. These efforts will support identification of potential sites and assess new geothermal resource opportunities.
21
DOE Crosscuts
22
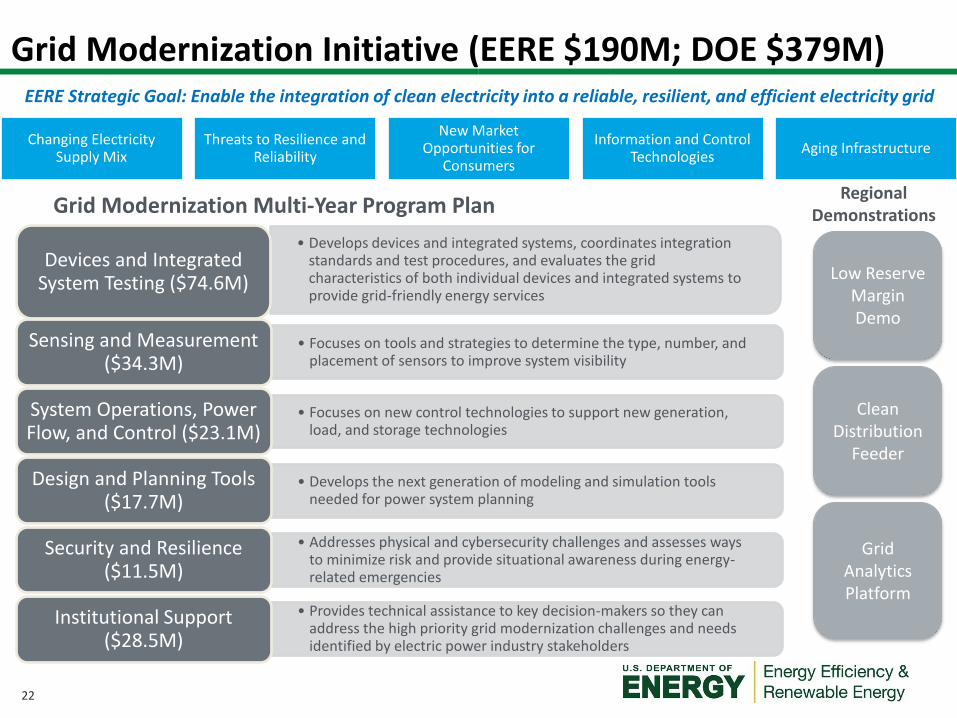
Grid Modernization Initiative (EERE $190M; DOE $379M)
• Develops devices and integrated systems, coordinates integration standards and test procedures, and evaluates the grid characteristics of both individual devices and integrated systems to provide grid-friendly energy services
Devices and Integrated System Testing ($74.6M)
• Focuses on tools and strategies to determine the type, number, and placement of sensors to improve system visibility
Sensing and Measurement ($34.3M)
• Focuses on new control technologies to support new generation, load, and storage technologies
System Operations, Power Flow, and Control ($23.1M)
• Develops the next generation of modeling and simulation tools needed for power system planning
Design and Planning Tools ($17.7M)
• Addresses physical and cybersecurity challenges and assesses ways to minimize risk and provide situational awareness during energy-related emergencies
Security and Resilience ($11.5M)
• Provides technical assistance to key decision-makers so they can address the high priority grid modernization challenges and needs identified by electric power industry stakeholders
Institutional Support ($28.5M)
Changing Electricity Supply Mix
Threats to Resilience and Reliability
New Market Opportunities for
Consumers
Information and Control Technologies
Aging Infrastructure
EERE Strategic Goal: Enable the integration of clean electricity into a reliable, resilient, and efficient electricity grid
Clean Distribution
Feeder
Low Reserve Margin Demo
Grid Analytics Platform
Regional Demonstrations Grid Modernization Multi-Year Program Plan
23
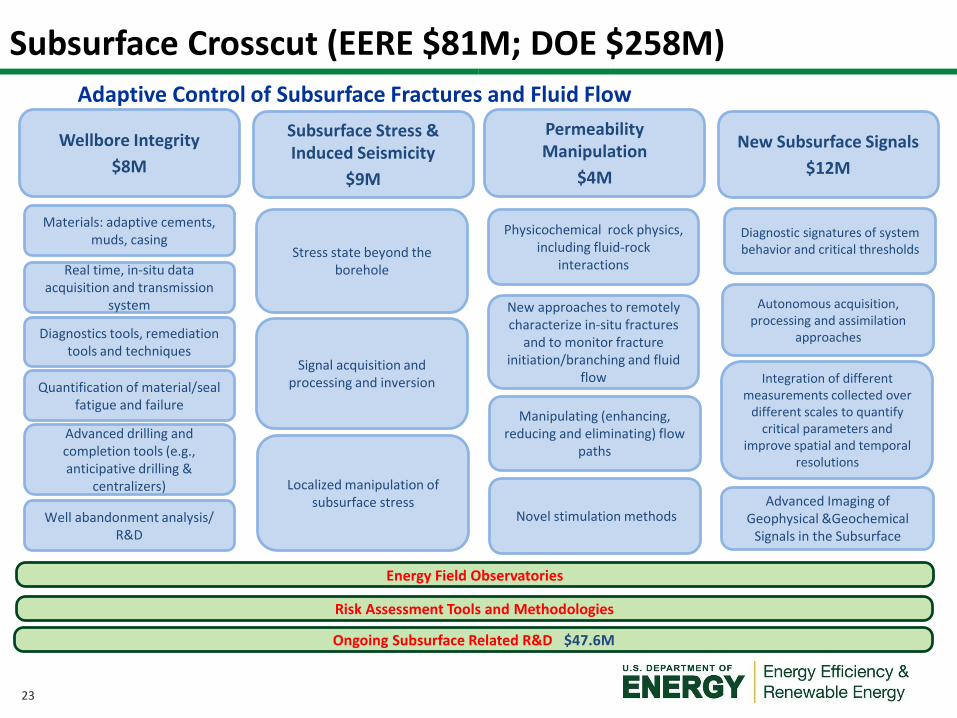
Wellbore Integrity
$8M
Subsurface Stress & Induced Seismicity
$9M
Permeability Manipulation
$4M
New Subsurface Signals
$12M
Energy Field Observatories
Materials: adaptive cements, muds, casing
Real time, in-situ data acquisition and transmission
system
Diagnostics tools, remediation tools and techniques
Quantification of material/seal fatigue and failure
Advanced drilling and completion tools (e.g., anticipative drilling &
centralizers)
Well abandonment analysis/ R&D
Stress state beyond the borehole
Signal acquisition and processing and inversion
Localized manipulation of subsurface stress
Physicochemical rock physics, including fluid-rock
interactions
New approaches to remotely characterize in-situ fractures
and to monitor fracture initiation/branching and fluid
flow
Manipulating (enhancing, reducing and eliminating) flow
paths
Novel stimulation methods
Diagnostic signatures of system behavior and critical thresholds
Autonomous acquisition, processing and assimilation
approaches
Integration of different measurements collected over
different scales to quantify critical parameters and
improve spatial and temporal resolutions
Adaptive Control of Subsurface Fractures and Fluid Flow
Risk Assessment Tools and Methodologies
Ongoing Subsurface Related R&D $47.6M
Subsurface Crosscut (EERE $81M; DOE $258M)
Advanced Imaging of Geophysical &Geochemical
Signals in the Subsurface
24
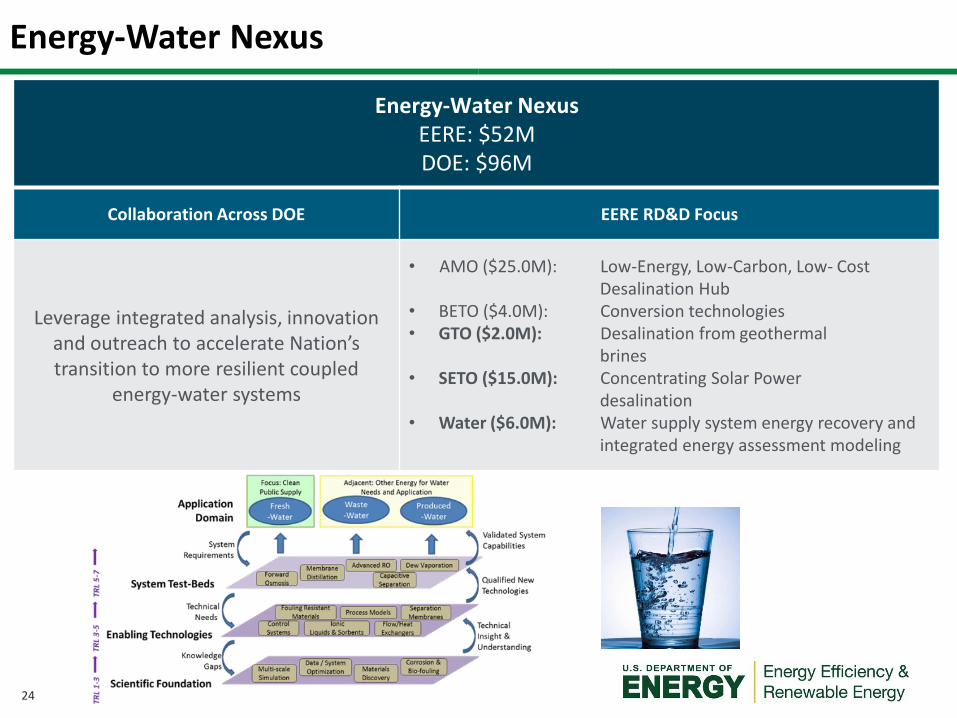
Energy-Water Nexus
Energy-Water NexusEERE: $52MDOE: $96M
Collaboration Across DOE EERE RD&D Focus
Leverage integrated analysis, innovation and outreach to accelerate Nation’s transition to more resilient coupled
energy-water systems
• AMO ($25.0M): Low-Energy, Low-Carbon, Low- Cost Desalination Hub
• BETO ($4.0M): Conversion technologies• GTO ($2.0M): Desalination from geothermal
brines• SETO ($15.0M): Concentrating Solar Power
desalination• Water ($6.0M): Water supply system energy recovery and
integrated energy assessment modeling
25
Source: NASA
Questions?