Embed Size (px)
Citation preview
Is there development potential left in solar power, wind power and energy storages?
Jero Ahola, LUT8.10.2015
Content
1. Background and motivation
2. Development solar photovoltaics
3. Development of wind power
4. Electrification of the whole energy system
5. Conclusion

1. Background and motivation
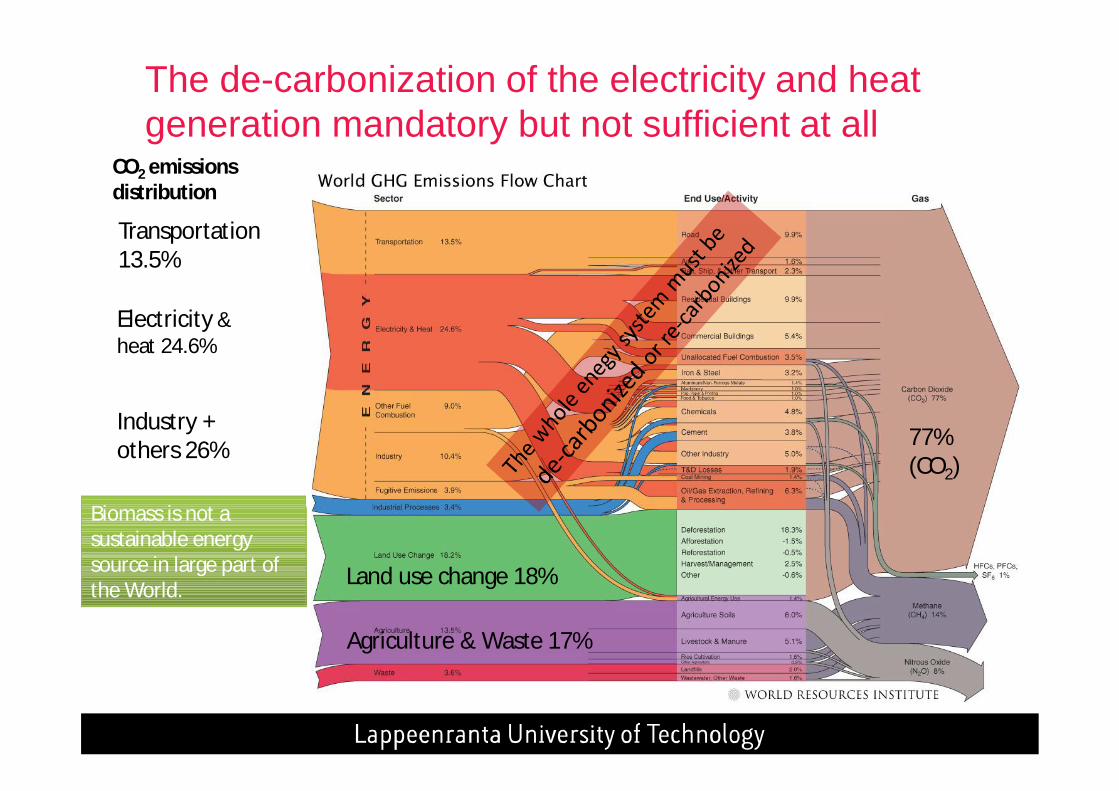
The de-carbonization of the electricity and heat generation mandatory but not sufficient at all
Biomass is not a sustainable energy source in large part of the World.
77% (CO2)
Transportation13.5%
Electricity &heat 24.6%
Industry +others 26%
CO2 emissions distribution
Land use change 18%
Agriculture & Waste 17%
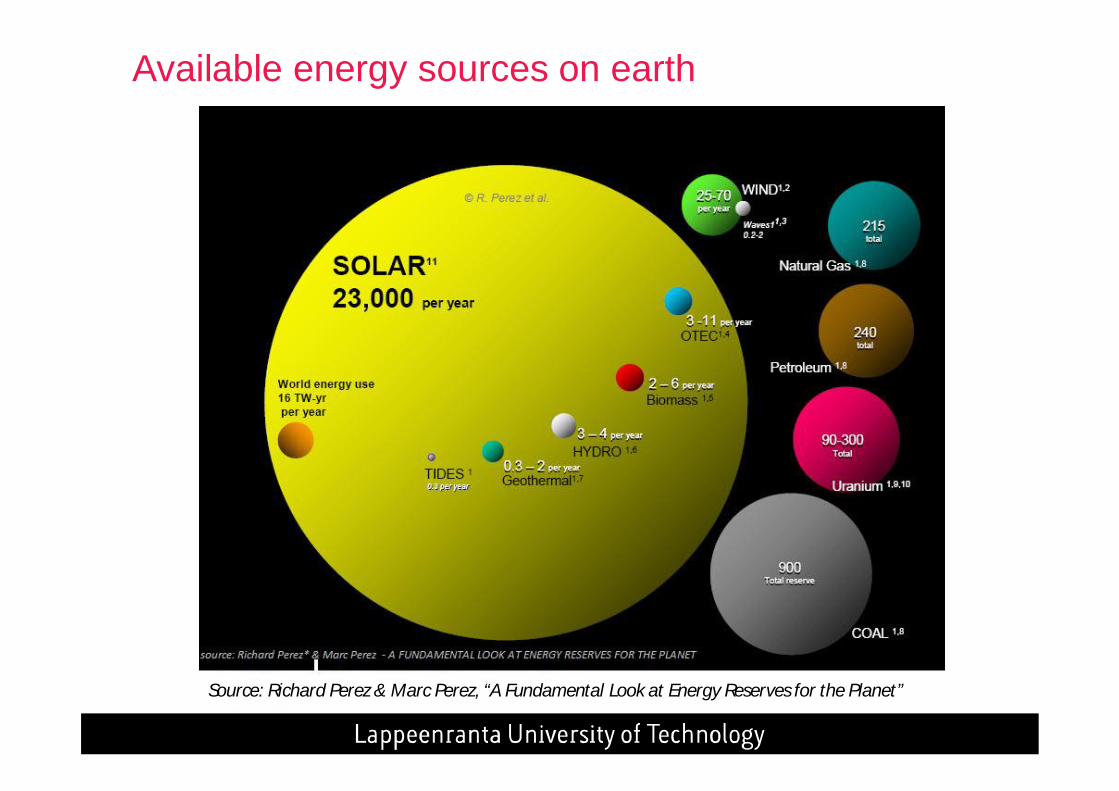
Available energy sources on earth
Source: Richard Perez & Marc Perez, “A Fundamental Look at Energy Reserves for the Planet”
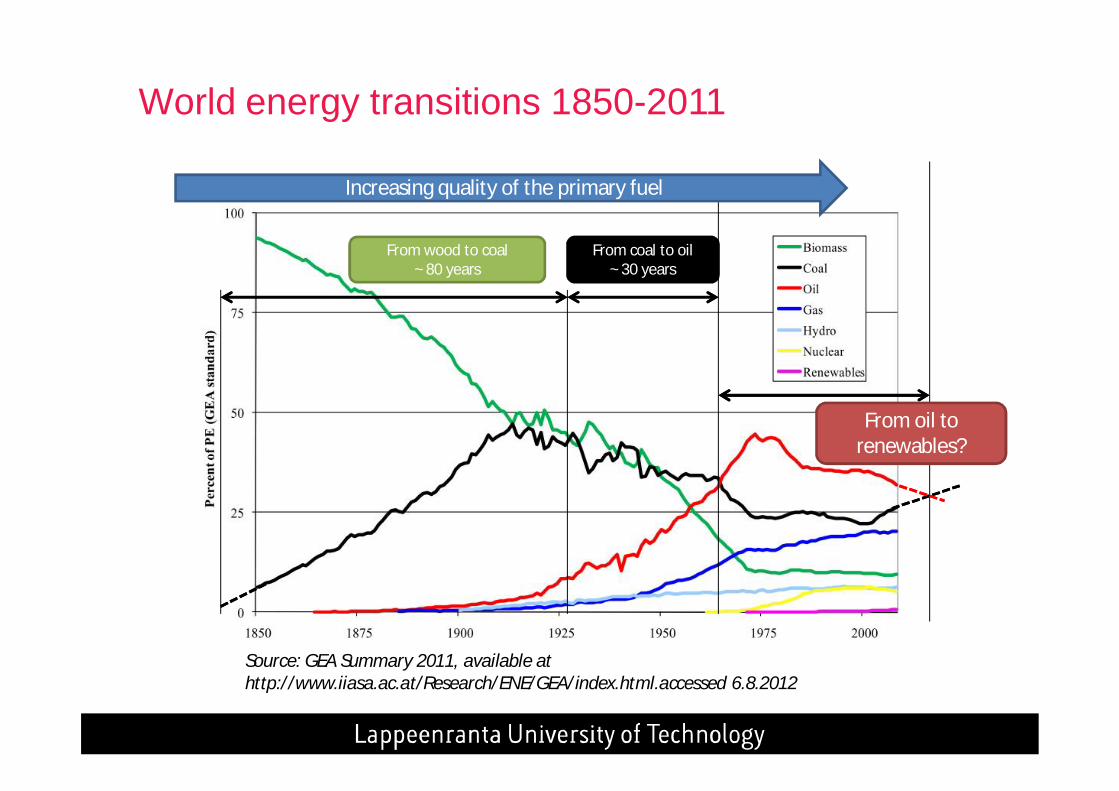
World energy transitions 1850-2011
Source: GEA Summary 2011, available at http://www.iiasa.ac.at/Research/ENE/GEA/index.html.accessed 6.8.2012
From wood to coal~ 80 years
From coal to oil~ 30 years
From oil to renewables?
Increasing quality of the primary fuel
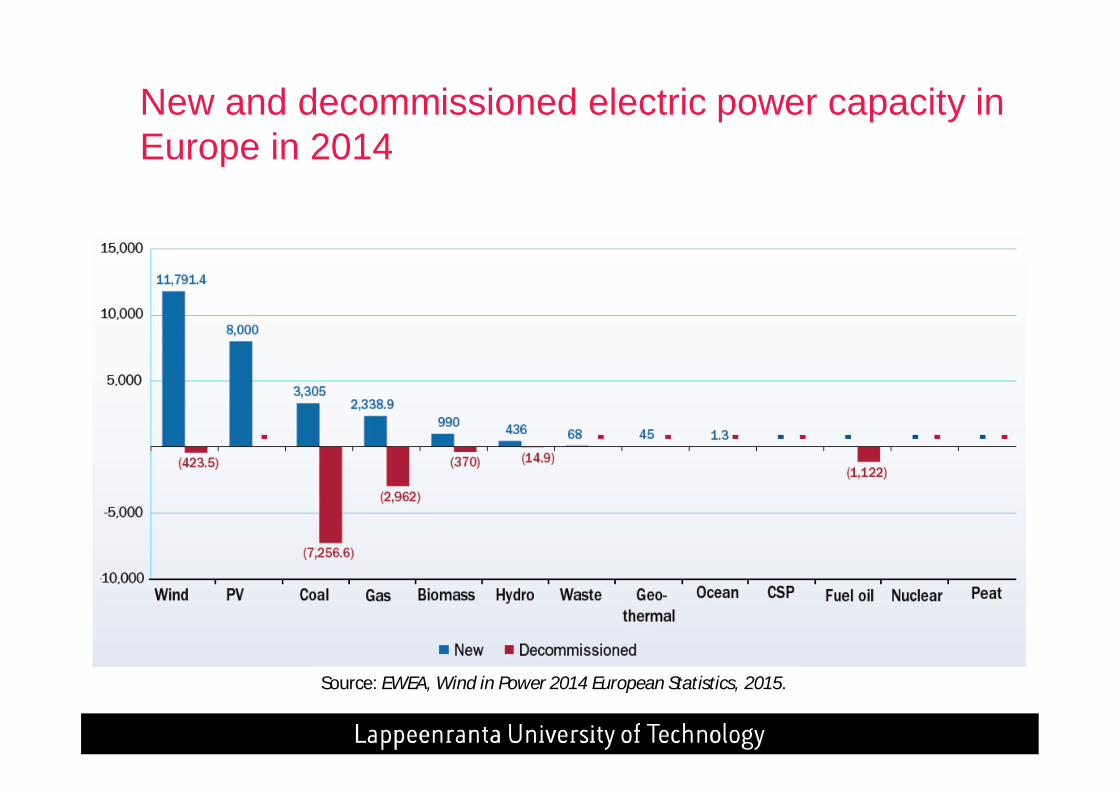
New and decommissioned electric power capacity in Europe in 2014
Source: EWEA, Wind in Power 2014 European Statistics, 2015.
2. Development of solar photovoltaics
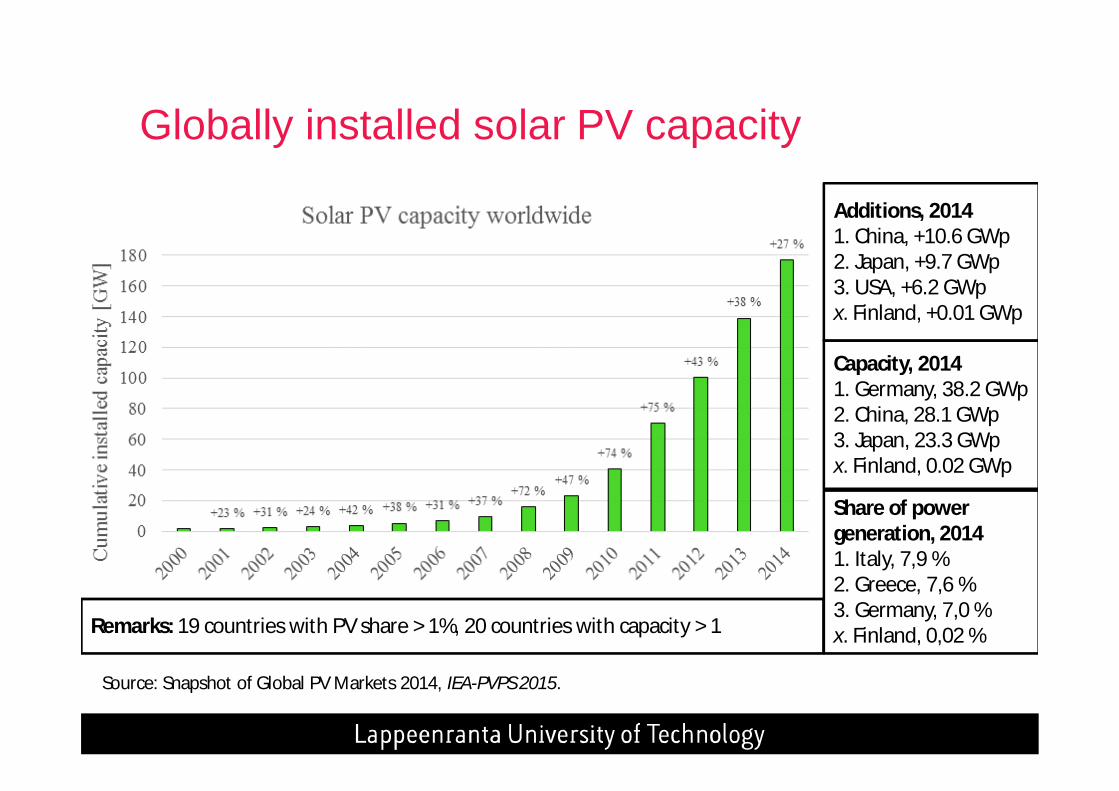
Globally installed solar PV capacity
Source: Snapshot of Global PV Markets 2014, IEA-PVPS 2015.
Additions, 20141. China, +10.6 GWp2. Japan, +9.7 GWp3. USA, +6.2 GWpx. Finland, +0.01 GWp
Share of power generation, 20141. Italy, 7,9 %2. Greece, 7,6 %3. Germany, 7,0 %x. Finland, 0,02 %Remarks: 19 countries with PV share > 1%, 20 countries with capacity > 1
Capacity, 20141. Germany, 38.2 GWp2. China, 28.1 GWp3. Japan, 23.3 GWpx. Finland, 0.02 GWp
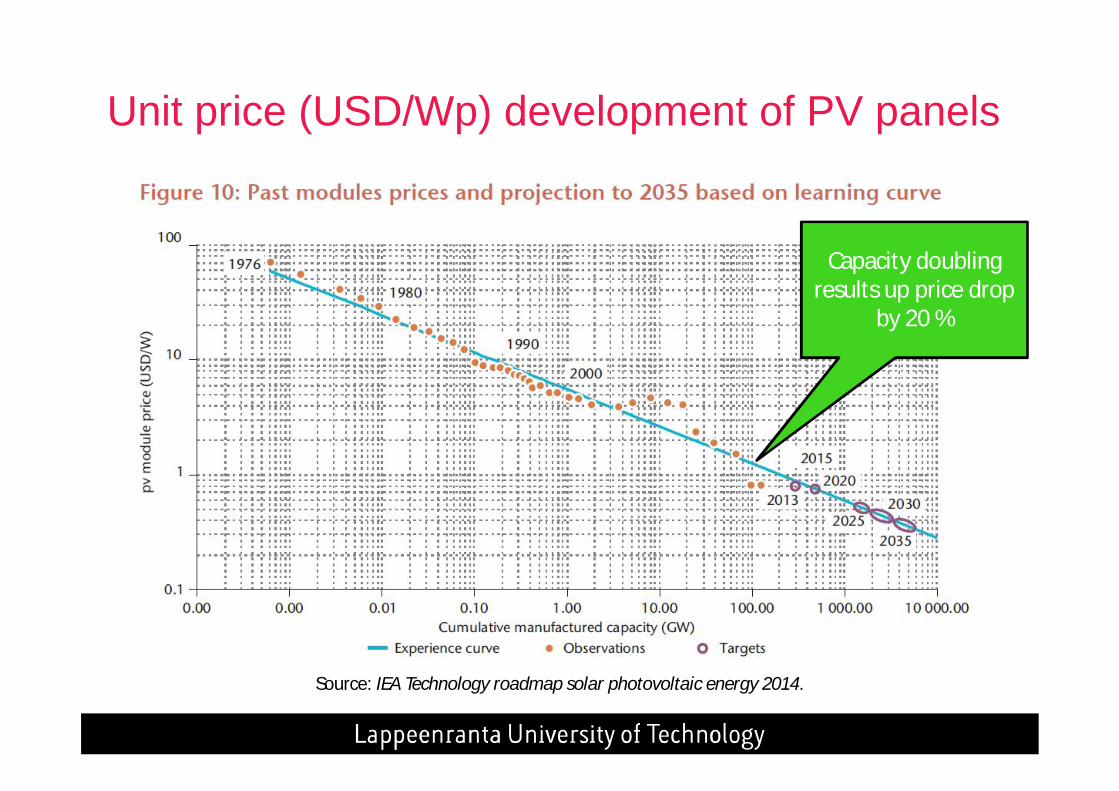
Unit price (USD/Wp) development of PV panels
Source: IEA Technology roadmap solar photovoltaic energy 2014.
Capacity doubling results up price drop
by 20 %
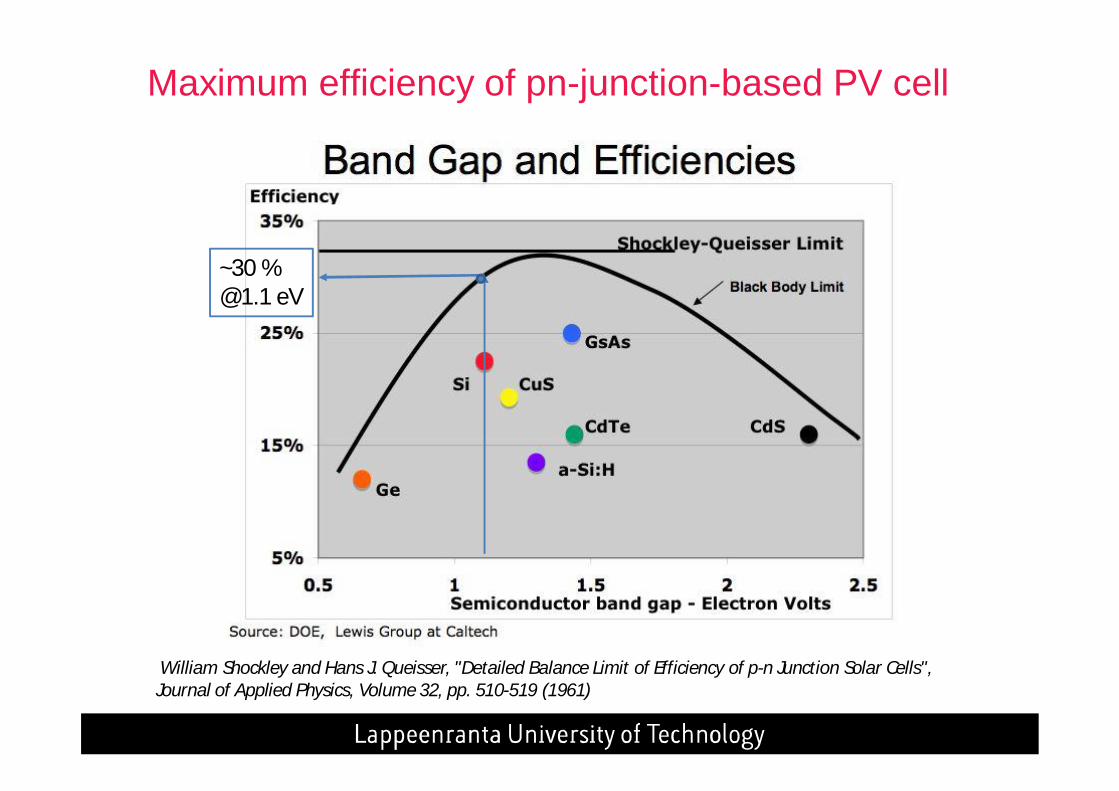
Maximum efficiency of pn-junction-based PV cell
~30 %@1.1 eV
William Shockley and Hans J. Queisser, "Detailed Balance Limit of Efficiency of p-n Junction Solar Cells", Journal of Applied Physics, Volume 32, pp. 510-519 (1961)
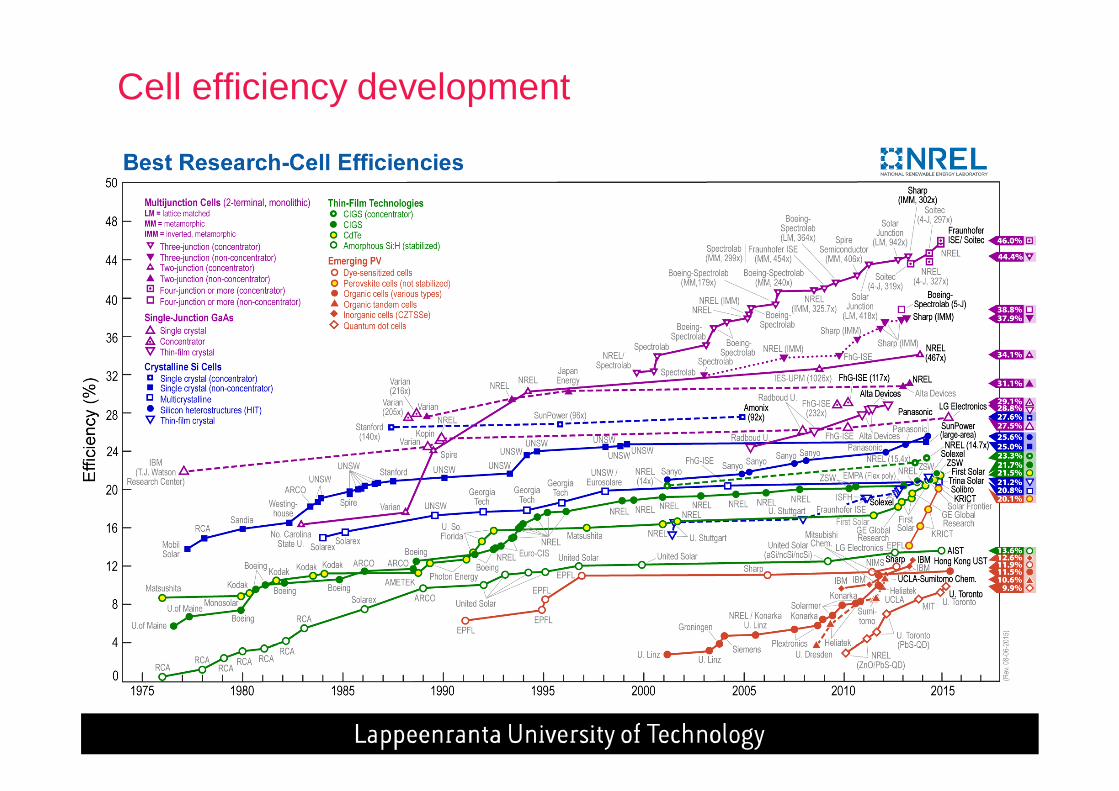
Cell efficiency development
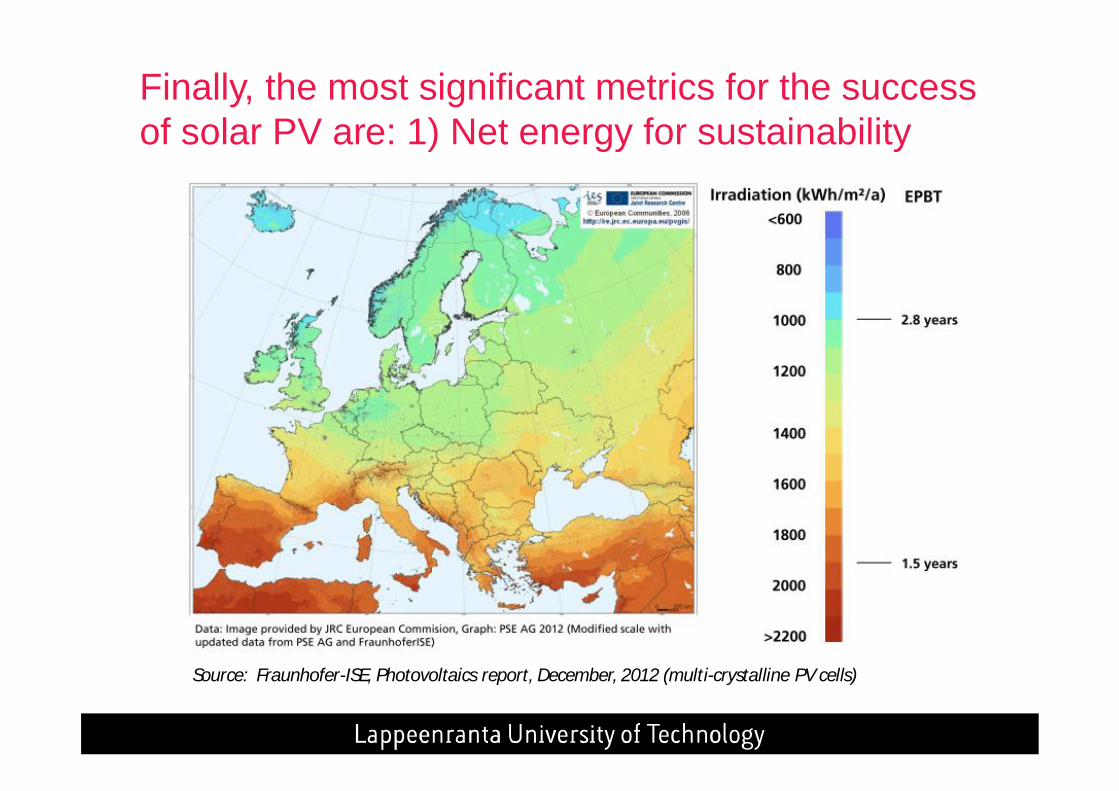
Finally, the most significant metrics for the success of solar PV are: 1) Net energy for sustainability
Source: Fraunhofer-ISE, Photovoltaics report, December, 2012 (multi-crystalline PV cells)
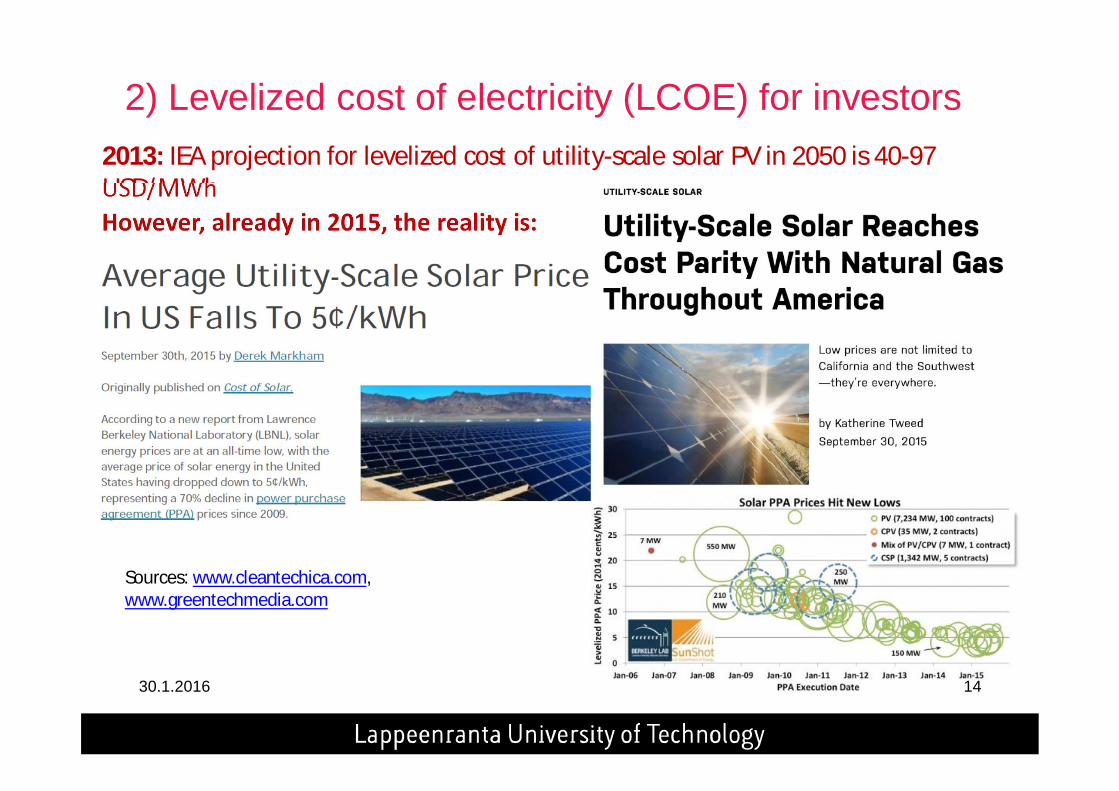
2) Levelized cost of electricity (LCOE) for investors2013: IEA projection for levelized cost of utility-scale solar PV in 2050 is 40-97 USD/MWhHowever, already in 2015, the reality is:
Sources: www.cleantechica.com, www.greentechmedia.com
30.1.2016 14

3. Development of wind power
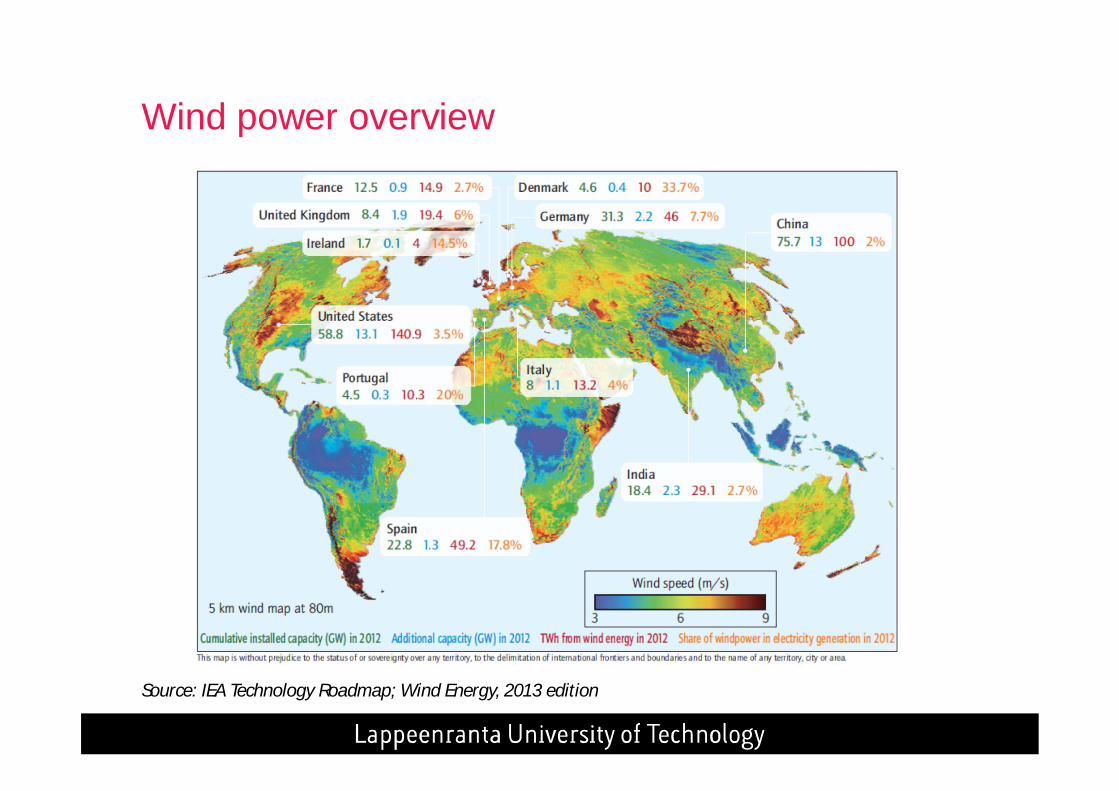
Wind power overview
Source: IEA Technology Roadmap; Wind Energy, 2013 edition
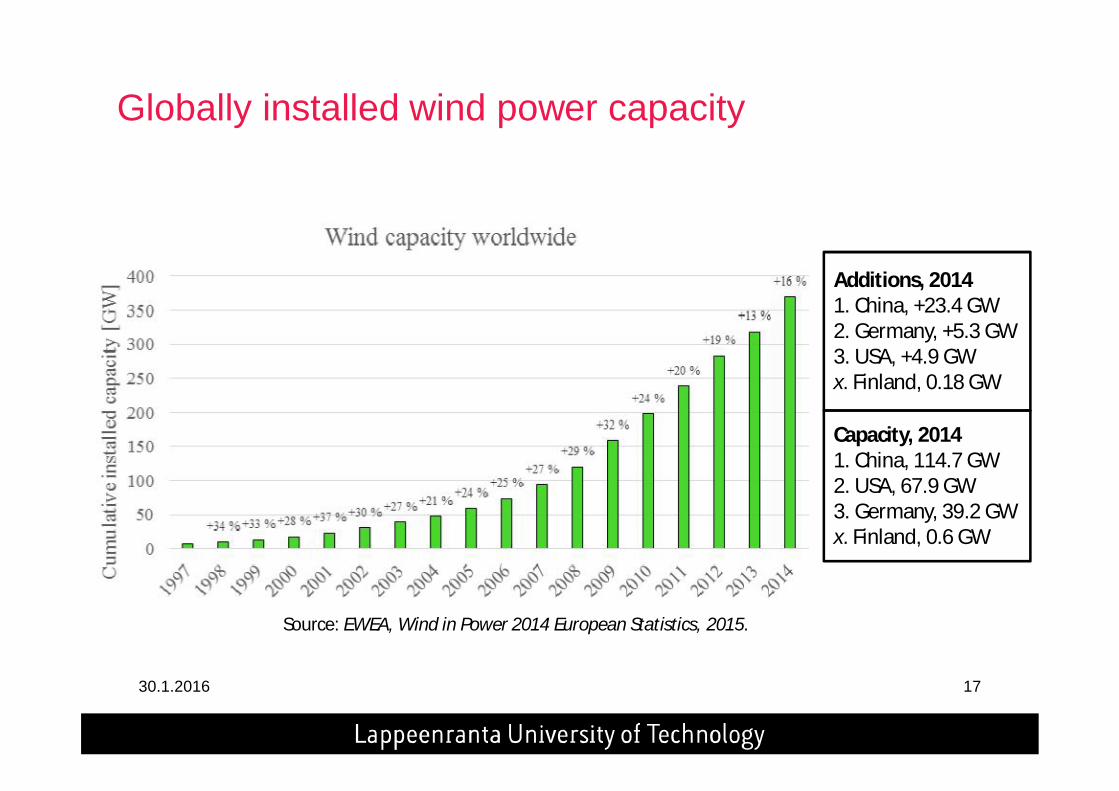
Globally installed wind power capacity
30.1.2016 17
Additions, 20141. China, +23.4 GW2. Germany, +5.3 GW3. USA, +4.9 GWx. Finland, 0.18 GW
Capacity, 20141. China, 114.7 GW2. USA, 67.9 GW3. Germany, 39.2 GWx. Finland, 0.6 GW
Source: EWEA, Wind in Power 2014 European Statistics, 2015.
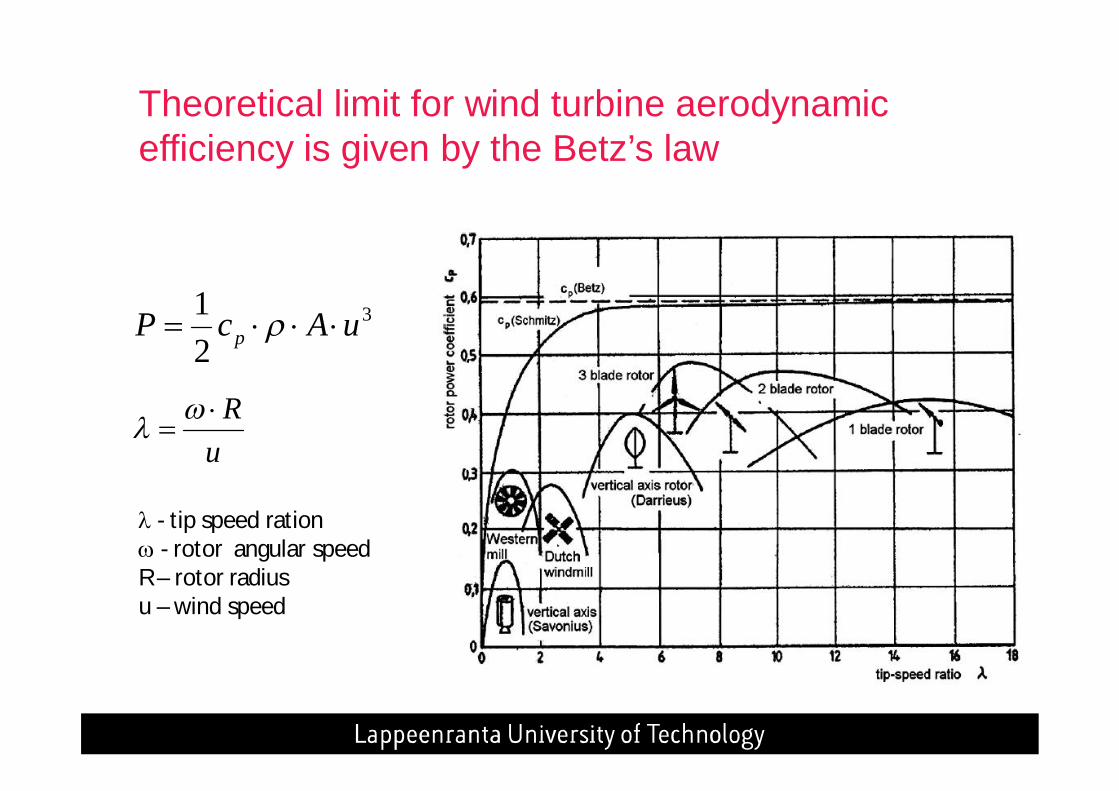
Theoretical limit for wind turbine aerodynamic efficiency is given by the Betz’s law
uR
- tip speed ration- rotor angular speed
R – rotor radiusu – wind speed
3
21 uAcP p
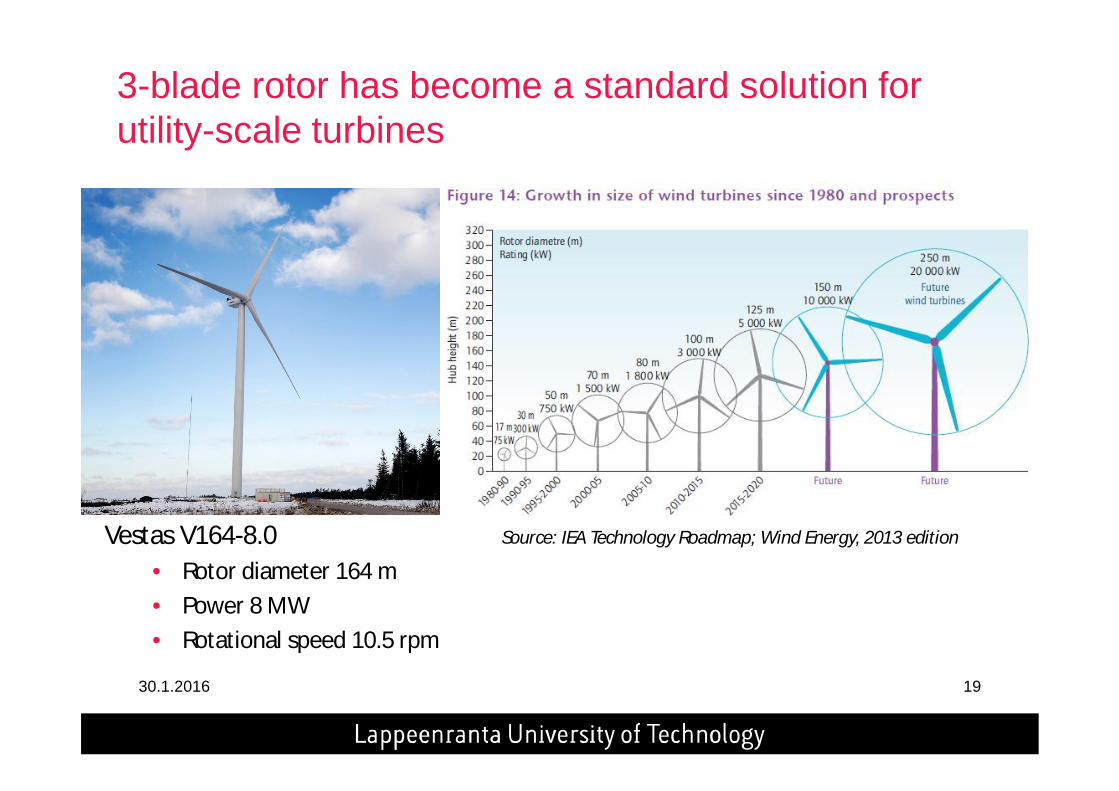
3-blade rotor has become a standard solution for utility-scale turbines
30.1.2016 19
Vestas V164-8.0• Rotor diameter 164 m• Power 8 MW• Rotational speed 10.5 rpm
Source: IEA Technology Roadmap; Wind Energy, 2013 edition
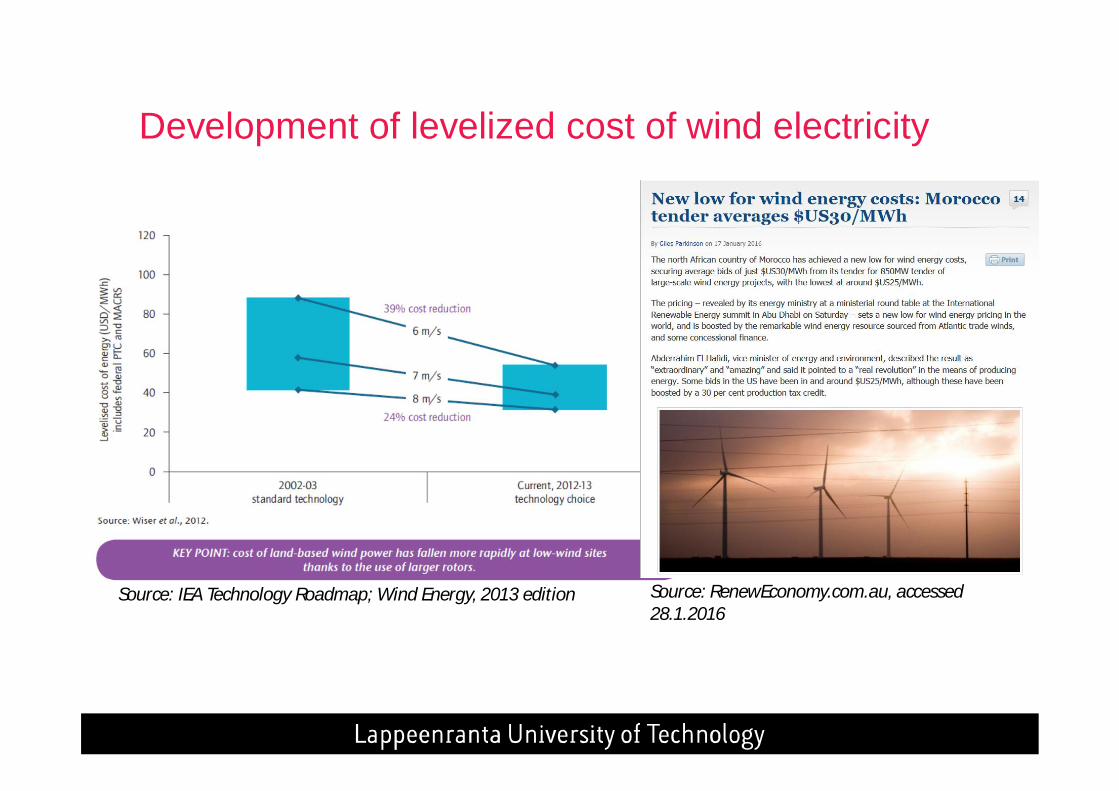
Development of levelized cost of wind electricity
Source: IEA Technology Roadmap; Wind Energy, 2013 edition Source: RenewEconomy.com.au, accessed28.1.2016
4. The electrification of the whole energy system
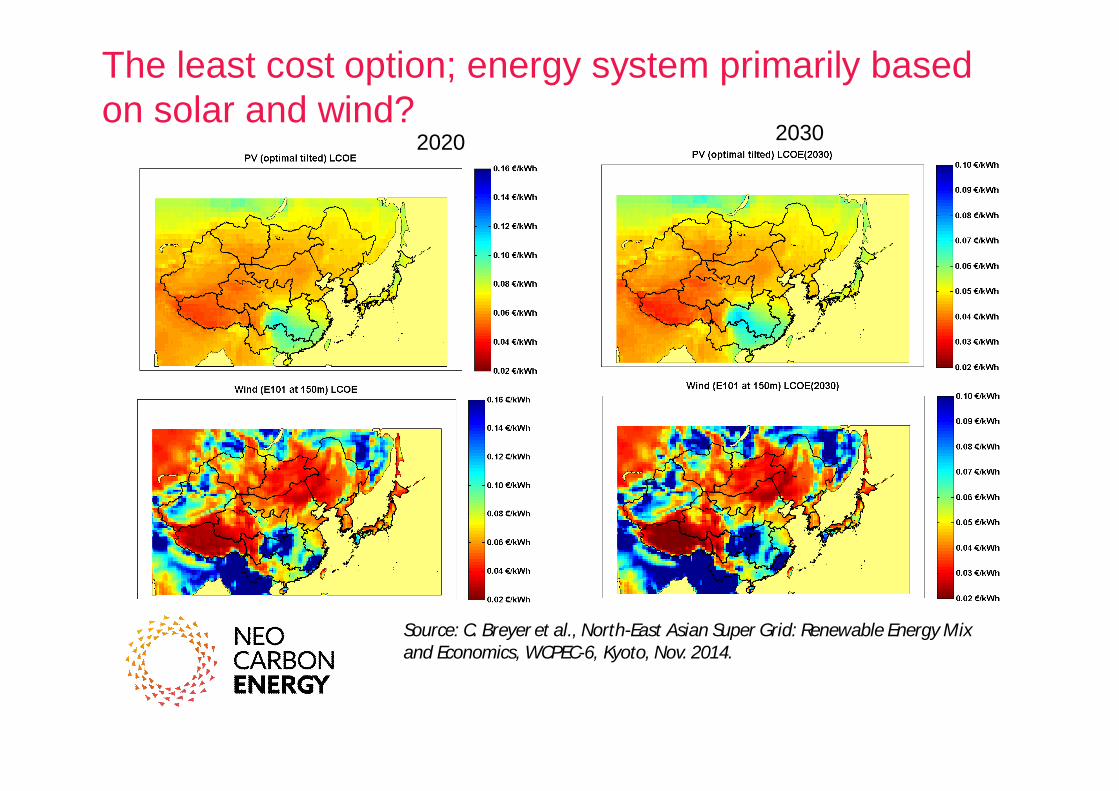
The least cost option; energy system primarily based on solar and wind?
Source: C. Breyer et al., North-East Asian Super Grid: Renewable Energy Mix and Economics, WCPEC-6, Kyoto, Nov. 2014.
2020 2030
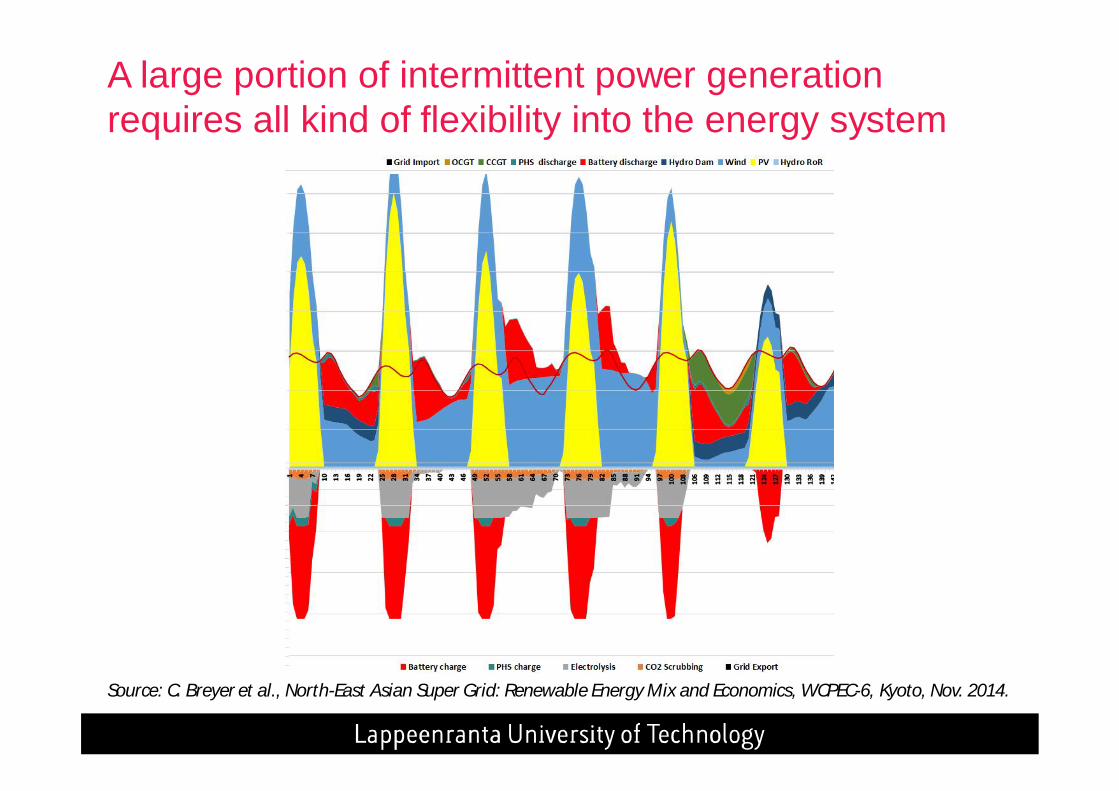
A large portion of intermittent power generation requires all kind of flexibility into the energy system
Source: C. Breyer et al., North-East Asian Super Grid: Renewable Energy Mix and Economics, WCPEC-6, Kyoto, Nov. 2014.
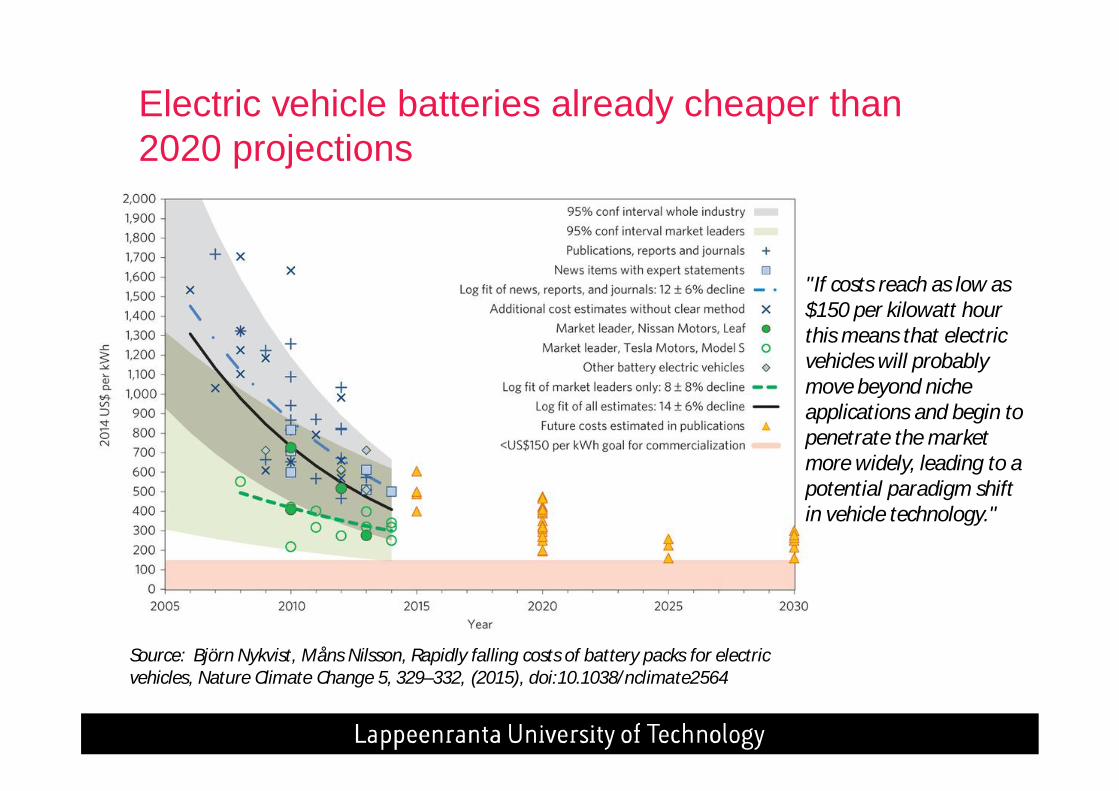
Electric vehicle batteries already cheaper than 2020 projections
"If costs reach as low as $150 per kilowatt hour this means that electric vehicles will probably move beyond niche applications and begin to penetrate the market more widely, leading to a potential paradigm shift in vehicle technology."
Source: Björn Nykvist, Måns Nilsson, Rapidly falling costs of battery packs for electric vehicles, Nature Climate Change 5, 329–332, (2015), doi:10.1038/nclimate2564
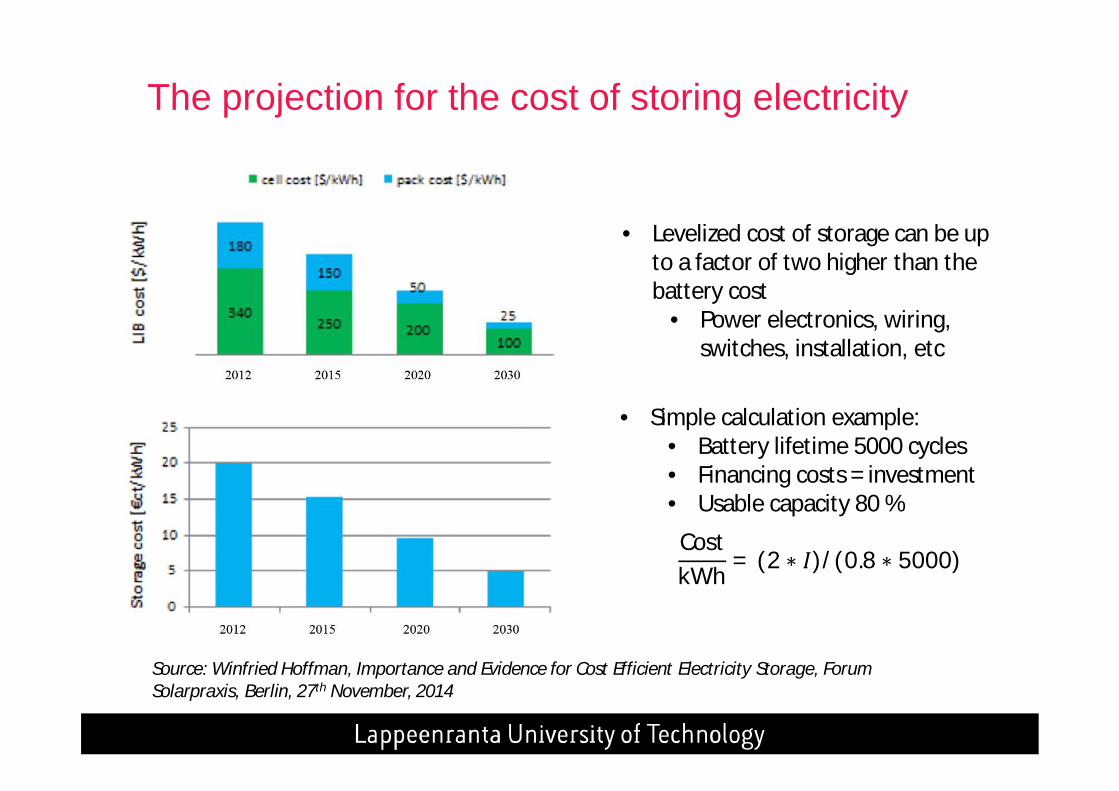
The projection for the cost of storing electricity
• Levelized cost of storage can be up to a factor of two higher than the battery cost
• Power electronics, wiring, switches, installation, etc
• Simple calculation example:• Battery lifetime 5000 cycles• Financing costs = investment• Usable capacity 80 %
CostkWh = (2 )/(0.8 5000)
Source: Winfried Hoffman, Importance and Evidence for Cost Efficient Electricity Storage, Forum Solarpraxis, Berlin, 27th November, 2014
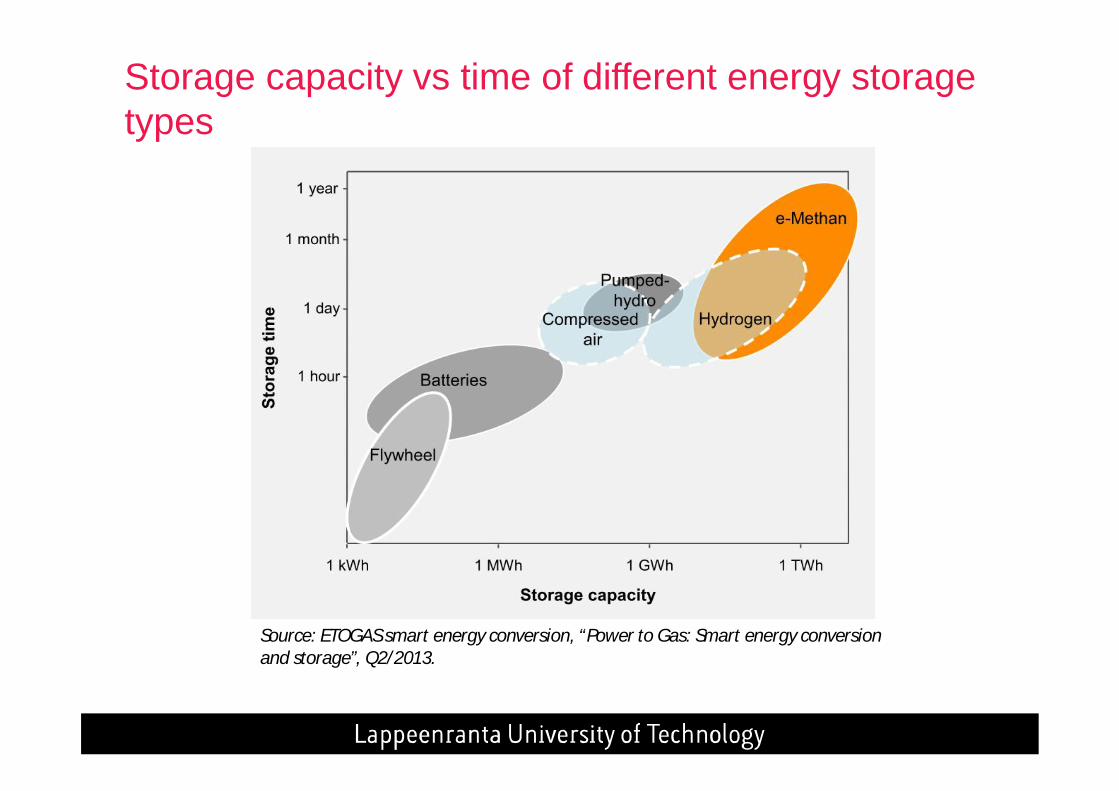
Storage capacity vs time of different energy storage types
Source: ETOGAS smart energy conversion, “Power to Gas: Smart energy conversion and storage”, Q2/2013.
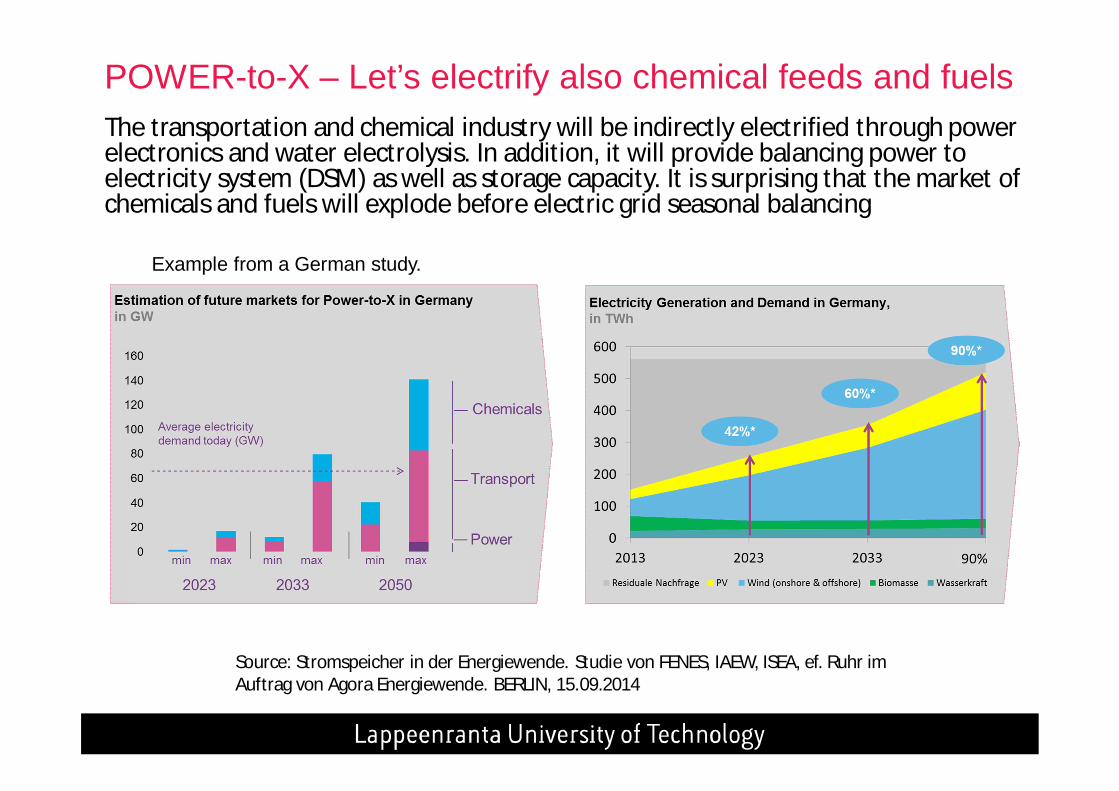
Example from a German study.
Source: Stromspeicher in der Energiewende. Studie von FENES, IAEW, ISEA, ef. Ruhr im Auftrag von Agora Energiewende. BERLIN, 15.09.2014
POWER-to-X – Let’s electrify also chemical feeds and fuelsThe transportation and chemical industry will be indirectly electrified through power electronics and water electrolysis. In addition, it will provide balancing power to electricity system (DSM) as well as storage capacity. It is surprising that the market of chemicals and fuels will explode before electric grid seasonal balancing
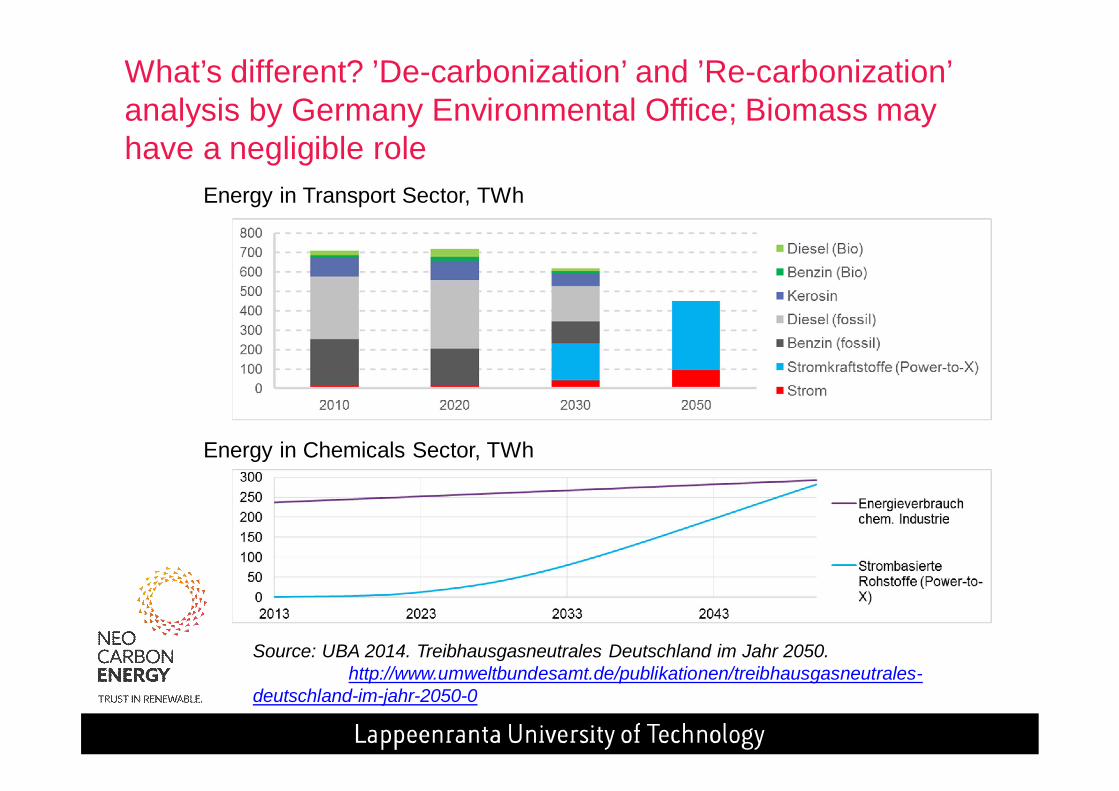
What’s different? ’De-carbonization’ and ’Re-carbonization’analysis by Germany Environmental Office; Biomass may have a negligible role
Energy in Transport Sector, TWh
Energy in Chemicals Sector, TWh
Source: UBA 2014. Treibhausgasneutrales Deutschland im Jahr 2050. http://www.umweltbundesamt.de/publikationen/treibhausgasneutrales-
deutschland-im-jahr-2050-0
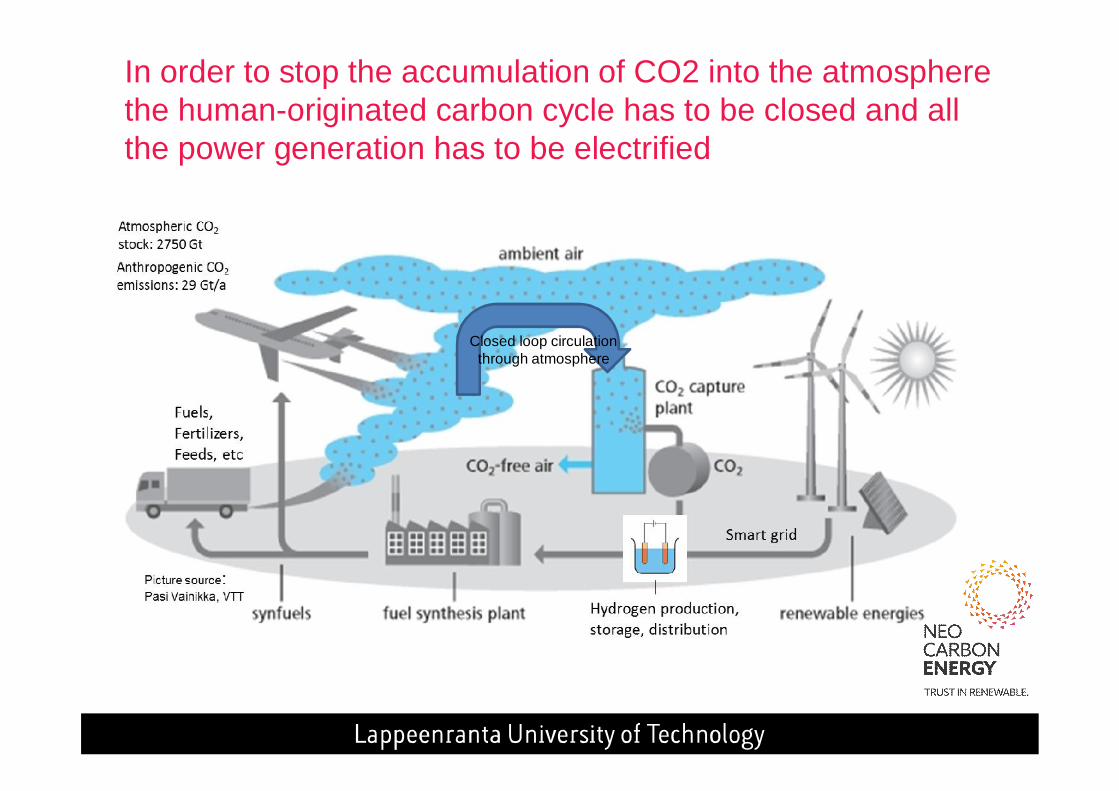
Closed loop circulation through atmosphere
In order to stop the accumulation of CO2 into the atmosphere the human-originated carbon cycle has to be closed and all the power generation has to be electrified
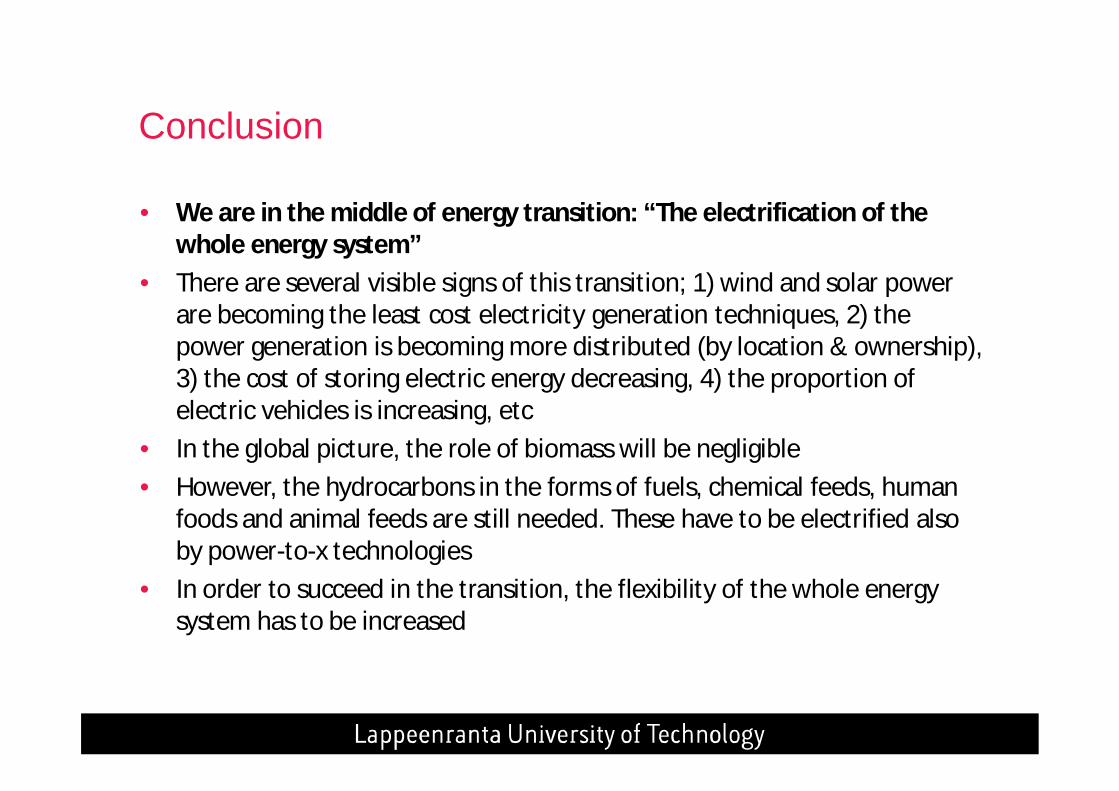
Conclusion
• We are in the middle of energy transition: “The electrification of the whole energy system”
• There are several visible signs of this transition; 1) wind and solar power are becoming the least cost electricity generation techniques, 2) the power generation is becoming more distributed (by location & ownership), 3) the cost of storing electric energy decreasing, 4) the proportion of electric vehicles is increasing, etc
• In the global picture, the role of biomass will be negligible• However, the hydrocarbons in the forms of fuels, chemical feeds, human
foods and animal feeds are still needed. These have to be electrified also by power-to-x technologies
• In order to succeed in the transition, the flexibility of the whole energy system has to be increased