Embed Size (px)
Citation preview
Lake 2010: Wetlands, Biodiversity and Climate Change
22nd-24th December 2010 Page 1
SCOPE FOR RENEWABLE ENERGY IN HIMACHAL PRADESH, INDIA
- A STUDY OF SOLAR AND WIND RESOURCE POTENTIAL
Gautham Krishnadas and Ramachandra T V
Energy & Wetlands Research Group, Centre for Ecological Sciences, Indian Institute of Science
Bangalore 560 012
E Mail: [email protected]
ABSTRACT
Burgeoning human population and industrialization has put immense pressure on fossil fuel based sources like
petroleum and coal. In this context, renewable resources assure energy security while addressing the issues of
pollution, global warming and unemployment among others. Renewable energy sources unlike petroleum and coal
are locally distributed and closely linked to the human lives, necessitating the need for regional level assessment of
its potential to provide sustainable energy. This study has been done to estimate the potential of solar and wind
resources in Himachal Pradesh, India. Considering the importance of spatial and temporal variations in distribution
of renewable resources, geospatial techniques such as remote sensing and GIS has been used to quantify and
understand the spatiotemporal changes. The global insolation (solar radiation) received by the land surface, is
computed using the 22 year average datasets from National Aeronautical and Space Administration (NASA).
Results reveal that, except for the winter months of December and January, Himachal Pradesh gets insolation above
4kWh/m2/day which is reasonably good for solar based applications. Wind energy potential is assessed using
available on-site wind speed data procured from Indian Meteorological Department (IMD). High temporal
resolution wind speed dataset from Climate Research Unit (CRU) has been used to produce a wind atlas for
Himachal Pradesh, which is comparable to on-site measurements in spatial variations according to topography but
not in magnitude. However results indicate that the region can minimally support electricity generation and
applications such as water pumps. This investigation highlights the need for renewable energy potential assessment
towards addressing the regional energy demand in a sustainable way.
KEYWORDS
Renewable energy, solar, wind, Himachal Pradesh

Lake 2010: Wetlands, Biodiversity and Climate Change
22nd-24th December 2010 Page 2
INTRODUCTION
Renewable energy is gaining wide popularity around the globe. India has already taken steps to shift to the low
carbon economy with essential public and private participation. It has a target of 20,000 MW of solar based power
generation and nearly 45000 MW of wind energy potential is already assessed. [1]
Solar energy can be converted to electricity using photovoltaic (PV) panels or concentrators. It is observed that,
incoming solar radiation (insolation) above 4.5kWh/m2/day supports PV and concentrator based electricity
generation. Applications like solar water heaters and cookers augment the domestic needs of cooking and water
heating. Regions with wind speed above 15 kmph (~4m/s) support commercial electricity generation while those
with 7-15kmph (~2-4m/s) support agricultural applications like wind pumps.
Resource availability of solar and wind energy varies with geographic location, topography, microclimate and many
other factors. Hence understanding the regional availability of resources is essential for the design of conversion
devices which could effectively utilize the potential. This also helps in the regional level energy planning.
The study area of Himachal Pradesh lying in the western Himalayas is one of the hill states in India. It has a
geographical area of 55673 km2. The elevation varies from 300m to 6700m from the west to east providing a variety
of climatic conditions and resulting in diverse vegetation [2]. The solar and wind resource availability has been
assessed for the study area taking into consideration their wide spatial variability. Wherever available, data have
been obtained from ground based measurements. High temporal and spatial resolution remote sensing data
supplements the study. Geographical Information Systems (GIS) implements the representation of collateral data in
comprehensible resource maps for Himachal Pradesh.
METHODOLOGY
Solar potential assessment
Insolation received is measured with pyranometers at radiation stations. India has 45 radiation stations which
measures global insolation. This radiation network is insufficient to capture the regional insolation variation.
Different interpolation and extrapolation models based on meteorological parameters like rainfall, cloud cover and
temperature have been developed to estimate the insolation at data scarce regions. These models provide a near
approximation of insolation with Root Mean Square Error (RMSE) below 10% when compared with ground data for
distances within 34km [3]. As the distance increases, RMSE increases and these models stand inefficient in
accuracy. Hence satellite imagery based physical and statistical models have been developed since 1980’s with
better resolution and acceptable accuracy.
Lake 2010: Wetlands, Biodiversity and Climate Change
22nd-24th December 2010 Page 3
We have used the Surface Meteorology and Solar Energy (SSE) datasets from the National Aeronautical and Space
Agency (NASA). The NASA SSE datasets for global horizontal insolation have been developed based on a physical
model using 3 hourly satellite images taken for 22 years [4]. The monthly average global insolation data is obtained
for thirteen 1⁰X1⁰ optimum grids covering Himachal Pradesh as shown in Table 1. Using Inverse Distance
Weighted (IDW) interpolation in GIS tool, we generated the monthly global insolation maps with contours showing
regional variation.
Long Lat Jan Feb Mar Apr May Jun Jul Aug Sep Oct Nov Dec
77.5⁰E 29.5⁰N 3.68 4.56 5.80 6.84 7.31 6.71 5.57 4.93 5.25 5.05 4.26 3.54
76.5⁰E 30.5⁰N 3.57 4.61 5.71 6.81 7.42 7.12 5.89 5.46 5.62 5.29 4.32 3.45
77.5⁰E 30.5⁰N 3.66 4.55 5.75 6.92 7.53 6.93 5.65 5.08 5.43 5.40 4.44 3.57
78.5⁰E 30.5⁰N 3.75 4.50 5.64 6.76 7.42 6.73 5.36 4.83 5.25 5.42 4.49 3.69
76.5⁰E 31.5⁰N 3.41 4.31 5.45 6.68 7.43 7.17 5.68 5.29 5.55 5.30 4.23 3.36
77.5⁰E 31.5⁰N 3.58 4.26 5.38 6.49 7.21 6.87 5.59 5.15 5.41 5.41 4.42 3.52
78.5⁰E 31.5⁰N 2.85 3.37 4.28 5.09 6.03 6.10 5.63 5.33 5.15 4.89 3.88 2.97
79.5⁰E 31.5⁰N 3.10 3.62 4.41 5.26 6.57 7.02 6.64 6.09 5.80 5.15 4.04 3.11
75.5⁰E 32.5⁰N 3.25 4.15 5.22 6.55 7.32 7.33 5.86 5.48 5.75 5.29 4.13 3.18
76.5⁰E 32.5⁰N 3.23 3.84 4.98 6.02 6.85 6.87 5.66 5.22 5.40 5.16 4.11 3.21
77.5⁰E 32.5⁰N 2.67 3.29 4.23 5.05 5.80 6.33 6.01 5.53 5.19 4.67 3.55 2.66
78.5⁰E 32.5⁰N 3.17 3.86 4.66 5.44 6.42 7.02 6.67 6.20 5.78 5.11 3.86 3.01
76.5⁰E 33.5⁰N 2.59 3.20 4.04 4.88 5.83 6.49 6.10 5.76 5.35 4.58 3.41 2.57
Table 1 : Monthly average insolation (kWh/m2/day) data collected for the study
Wind resource assessment
For wind based energy generation, the wind regime has to be understood with the wind speed distribution as well as
the wind power density [5]. The wind speed is measured using anemometers installed at meteorological stations. We
obtained the wind speed data for 11 sites- Bilaspur (587m), Mandi (761m), Sundernagar (861m), Nahan (959m),
Chamba (996m), Bhuntar (1096m), Dharmshala (1211m), Dalhousie (1959m), Manali (2039m), Simla CPRI
(~2202m) and Shimla (2202m), from the Indian Meteorological Station (IMD). These sites are representative of
elevations below 2500m while no sites above that have recorded wind speed data. Hence a 10’X10’ spatial and 30
years temporal resolution wind speed dataset obtained from the Climate Research Unit (CRU) has been utilized to

Lake 2010: Wetlands, Biodiversity and Climate Change
22nd-24th December 2010 Page 4
understand the relative wind speed at elevations above 2500m. As in the case of solar dataset, the CRU monthly
average wind speed data is interpolated with IDW in GIS to produce wind maps.
RESULTS AND DISCUSSION
Solar energy potential
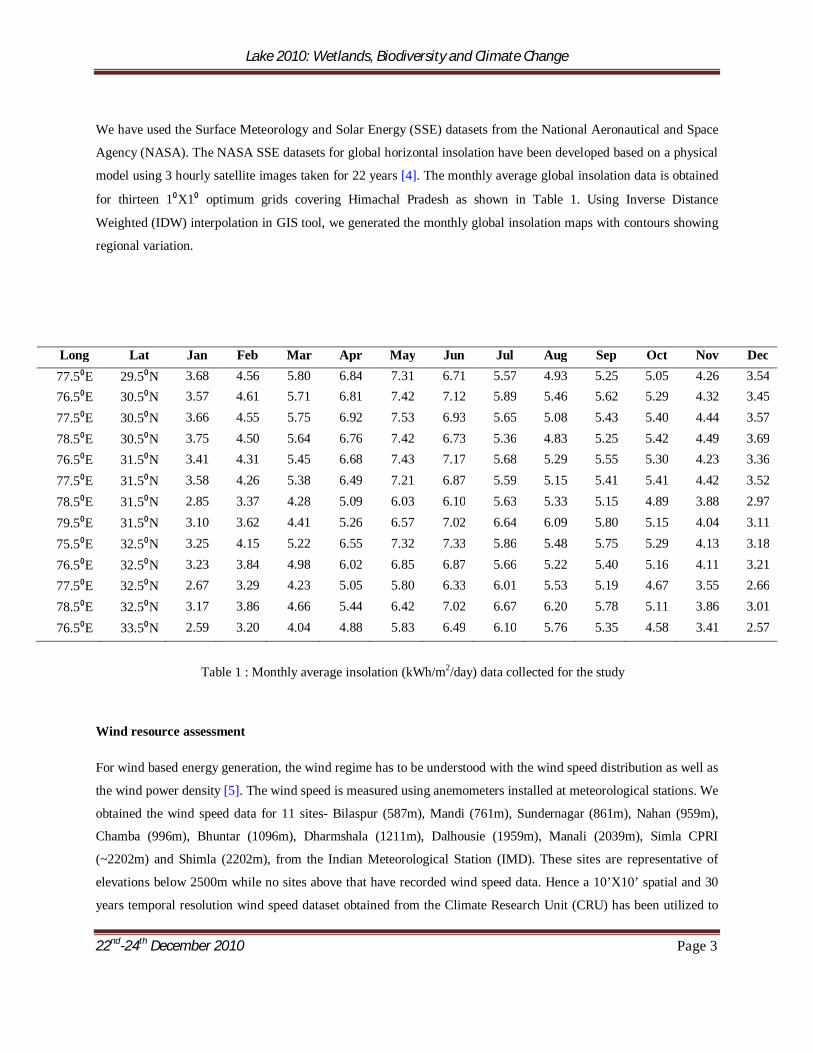
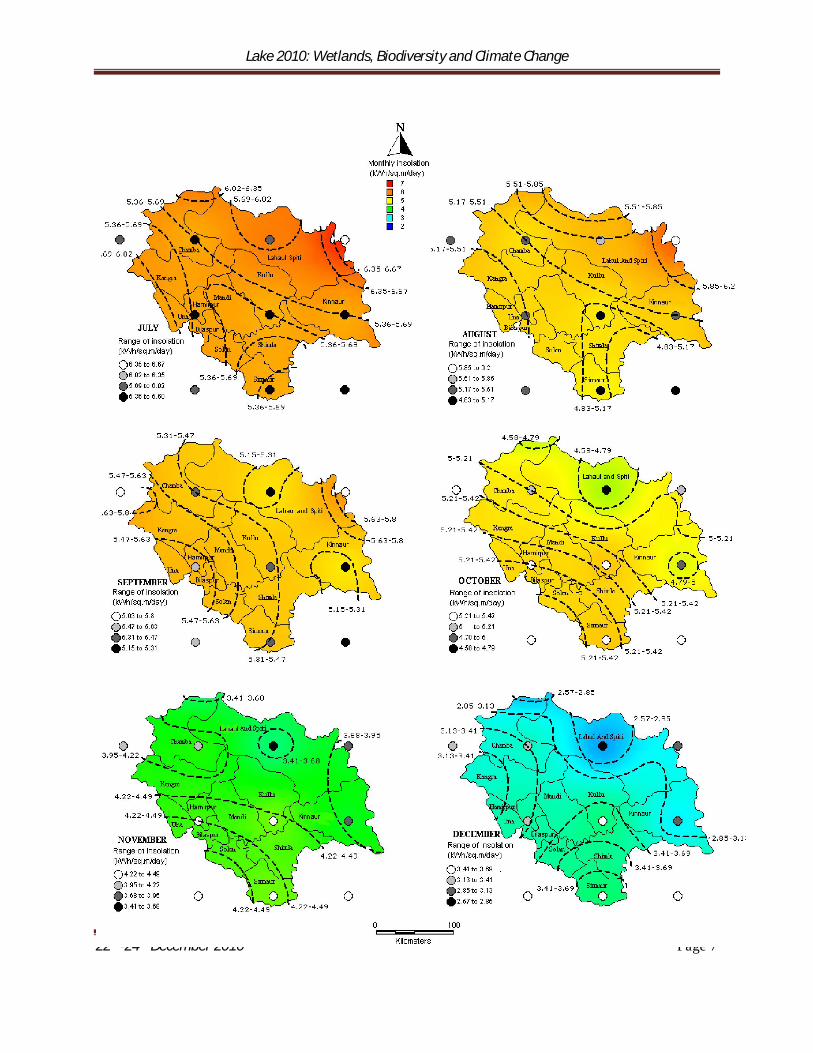
The solar energy potential in Himachal Pradesh has been assessed and can be inferred from the monthly average
global insolation maps shown in Figures 1a-b. Considering the seasonal influence, Himachal Pradesh receives an
average insolation of 5.99 kWh/m²/day in the warm summer months of March, April and May; 5.89 kWh/m²/day in
the wet monsoon months of June, July, August and September; 3.94 kWh/m²/day in the colder winter months of end
October, November, December, January and February. For the period from March to October the entire
physiographic zones of Himachal Pradesh receives insolation above 4 kWh/m²/day, favouring commercial as well as
domestic applications of solar energy. With the onset of winter by the end of October, the insolation in Himachal
Pradesh drops down and a low insolation period prevails till the end of February. This confines the exploitation of
the incident solar energy to domestic appliances like solar cookers, solar water heater etc in winter.
Lake 2010: Wetlands, Biodiversity and Climate Change
22nd-24th December 2010 Page 5
Lake 2010: Wetlands, Biodiversity and Climate Change
22nd-24th December 2010 Page 6
Figure 1a: Monthly average global insolation from January to June
Lake 2010: Wetlands, Biodiversity and Climate Change
22nd-24th December 2010 Page 7

Lake 2010: Wetlands, Biodiversity and Climate Change
22nd-24th December 2010 Page 8
Figure 1b: Monthly average global insolation from July to December
Wind energy potential
Wind speed collected for the 11 sites (Figure 2) shows wind speed increase for two occasions in a year. The first rise in
wind speed happens during March which resides by June/July and again rises in September/October after the rainy
season. This trend is not seen for Bhuntar where there is a single rise in wind speed reaching its peak in July/August.
Nahan records the highest wind speed with a monthly average of 6.5±1.1 kmph followed by Bhuntar with 4.2±1.6 kmph
and Dharamsala with 4.2±1.3 kmph. As observed from the wind speed variations, all other sites recorded less than a
monthly average of 3.4 kmph.
Figure 2: Monthly average wind speed for 11 sites
The wind maps (Figure 3) obtained from CRU dataset, represent the monthly average wind speed variation for
Himachal Pradesh. It is observed that, wind speed increases during the summer month of April and tallies with the
on-site data. Since no on-site measurements are available for higher elevations (above 2500m), the wind maps could
be relied upon to conclude that wind speed is relatively higher for regions like Lahaul-Spiti, Kinnar and Eastern
Kullu, when compared to lower elevations.
From the application point of view, Himachal Pradesh can minimally support wind energy based agricultural pumps
and electricity generation.

Lake 2010: Wetlands, Biodiversity and Climate Change
22nd-24th December 2010 Page 9
Figure 3: Monthly average wind speed variation based on synthesized data from CRU
CONCLUSION
This study is an attempt to appreciate the renewable energy potential in Himachal Pradesh with focus on solar and
wind resources. The regional level availability of solar and wind resources is measured with reliable ground as well
as remote sensing data. A high influence of seasons, topography and climate on the spatial resource variability is
observed in the study area. Solar energy received by Himachal Pradesh could be effectively utilized for commercial
applications like PV/concentrator based electricity in the period of March to October. The other months essentially
support domestic applications like solar cookers and water heaters. Wind speed measured at the sites as well as the
synthesized data from CRU shows that the region can minimally support wind energy based applications, while
elevations above 2500m deserve better observation.
The scope for renewable energy is vast. A closer study of the available renewable resources like the one presented
helps in the effective regional energy planning and achieving ambitious targets already set.
Lake 2010: Wetlands, Biodiversity and Climate Change
22nd-24th December 2010 Page 10
REFERENCES
[1] Ministry of New and Renewable Energy, Government of India, Viewed on October 15 2010,
<http://www.mnre.gov.in/>
[2] Statistical Data of Himachal Pradesh upto 2009-10, Himachal Pradesh Planning Department, Govt. of Himachal
Pradesh, Viewed on October 15, 2010, <http://hpplanning.nic.in/Statistical data of Himachal Pradesh upto 2009-
10.pdf>
[3] Richard Perez, Robert Seals, Antoine Zelenka, Comparing satellite remote sensing and ground network
measurements for the production of site/time specific irradiance data, Solar Energy, f50, (1997) 89-96
[4] NASA, Surface Meteorology and Solar Energy Release 6.0 Methodology, Viewed October 8 2010,
<http://eosweb.larc.nasa.gov/sse/documents/SSE6Methodology.pdf>
[5] Anna Mani, D.A. Mooley, Wind Energy Data for India, Allied Publishers, New Delhi, 1983