Embed Size (px)
Citation preview

The First Step in Information Management
looker.com
Produced by:
MONTHLY SERIES
In partnership with:
The Importance of Effective Communications in AnalyticsMarch 1, 2018

Why We’re Here … and What We’ll Cover
pg 2First San Francisco Partners www.firstsanfranciscopartners.com© 2018
What’s complicated about communicating analytics? Just pushing out information isn’t communicating
Messaging requirements can vary by audience
Effective communication is valued more in some areas, and less so in others
Data literacy is typically inconsistent across organizations
Today we’ll talk about how to: Effectively share data insights to convey business outcomes and actions
Grow your organization’s understanding of its data
Utilize data visualization and data storytelling
Think beyond the data

www.firstsanfranciscopartners.com
Effectively Share Data Insights toConvey Business Outcomes and Actions
Wise men speak because they have something to say;Fools because they have to say something.
– Plato, Philosopher and Writer

Start with Communication 101 Principles
pg 4First San Francisco Partners www.firstsanfranciscopartners.com© 2018
Communicating analytics, just like communicating anything else, benefits froma thoughtful approach.
Before you communicate anything, take time to plan out your efforts.− Consider frequency (is this a one-time message or does it need to be repeated?)− Is a formal communication plan needed?
Consider your audience and customize as needed.− What information is important to them? What should you not include?
Determine the best medium/channel for your message.− Leverage unique communication channels, not just email.
Decide what supports your message.− Is it research, case studies, etc.?
Deliver the message.− Incorporate feedback to improve your next delivery.

pg 5
Example: Components of a Communication Plan
Communication Plan Component Description
Qualitative Information Any general qualitative information that I would like to receive related to this deliverable
Quantitative Information Of the quantitative metrics that have been defined, which are the ones I would like to be informed about and how do I want the metric communicated to me to make the message pertinent
Frequency How often do I want to be informed about progress
Method What is my preferred mechanism of receiving the information
Owner Who is responsible for the communication
First San Francisco Partners www.firstsanfranciscopartners.com© 2018

www.firstsanfranciscopartners.com
Grow Your Organization’sUnderstanding of Its Data
“Communication is a skill that you can learn.It’s like riding a bike … if you’re willing to work at it,
you can improve the quality of every part of your life.”– Brian Tracy, Author and Motivational Speaker

The Road to Understanding Data as an Asset
Define what “data as an asset” means
Inventory your data landscape
Know your org’s KPIs and business requirements
Develop a plan to increase data awareness and maturity
Use data to anchor decisions and monitor closely
pg 7© 2018 First San Francisco Partners www.firstsanfranciscopartners.com

pg 8
Growing “Data Literacy” is Similar to Learning to Fly a Plane
First San Francisco Partners www.firstsanfranciscopartners.com© 2018
This is a standard learning model, and we adapt it to organizational learning.
Graphic from FAA
Correlation:Data is usedto anchordecisions

Example: Learning and Understanding Using Data
pg 9© 2018 First San Francisco Partners www.firstsanfranciscopartners.com
Rote• Here is a report.
Yesterday, we shipped 100 units.
Understanding • We were
supposed to ship 120 units, weren't we?
Application • Is there an
issue in the warehouse?
Correlation • This is the third
time in a row we haven't shipped 120. Is the forecast too high? Has the market changed?
pg 10© 2018 First San Francisco Partners www.firstsanfranciscopartners.com
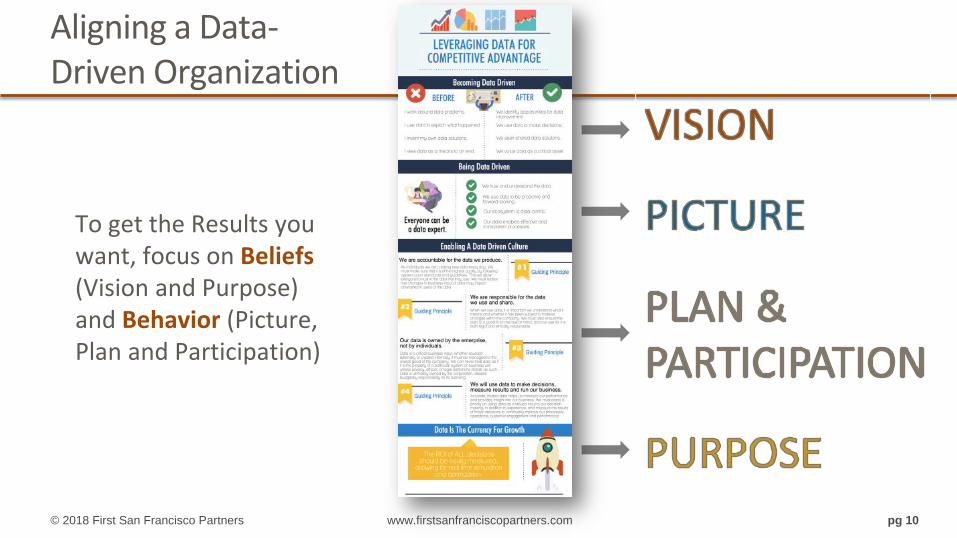
To get the Results you want, focus on Beliefs(Vision and Purpose) and Behavior (Picture, Plan and Participation)
Aligning a Data-Driven Organization

pg 11© 2018 First San Francisco Partners www.firstsanfranciscopartners.com
Vision

Picture: Future State
© 2016 First San Francisco Partners www.firstsanfranciscopartners.com Proprietary and Confidential pg 12

Guiding Principles
pg 13© 2018 First San Francisco Partners www.firstsanfranciscopartners.com

Guiding Principles
pg 14© 2018 First San Francisco Partners www.firstsanfranciscopartners.com

Purpose
pg 15© 2016 First San Francisco Partners www.firstsanfranciscopartners.com Proprietary and Confidential

www.firstsanfranciscopartners.com
Utilize Data Visualizationand Data Storytelling
"Good communication is just as stimulating as black coffee,and just as hard to sleep after."
– Anne Morrow Lindbergh, Author, Aviator and Wife of Charles

Why Use Data Visualization?
Helps you understand large amounts of data Explains findings easily and more quickly Clarifies areas of importance or required actions Allows you to discover and understand trends,
patterns and correlations Improves recall of information It’s more interesting and engaging!
pg 17© 2018 First San Francisco Partners www.firstsanfranciscopartners.com

pg 18
A Picture is Worth a Thousand Data Points
First San Francisco Partners www.firstsanfranciscopartners.com© 2018
UNDERSTANDINGVISUALSDATA
Kenneth Field’s visualization is from 1869 to present. Source: arcgis.com.To view this interactive visual, visit tinyurl.com/GCmap
Deaths in the Grand Canyon

What is Data Storytelling?
pg 19© 2018 First San Francisco Partners www.firstsanfranciscopartners.com
Four elements of a story or narrative
Constructed to engage people− We’re wired to be drawn to stories
Storytelling is effective for sharing analytics
Business problem
Risk tobusiness
Who/what impactedor who/what is helping
Future state wheninsights revealbusiness outcomesand opportunities
CHARACTERS TRANFORMATIONCONFLICT STAKES
www.firstsanfranciscopartners.com
Think Beyond the Data
"Of all of our inventions for mass communication,pictures still speak the most universally understood language.“
– Mickey Mouse’s Dad, Walt Disney

Rote
• Here is a report. Yesterday we shipped 100 units. COMPARATIVE VISUAL
Understanding
• We were supposed to ship 120 units, weren't we? COMPARATIVE VISUAL
Application
• Is there an issue in the warehouse? SEVERAL REPORTS, ad hoc BI
Correlation
• This is the third time in a row we haven't shipped 120. Is the forecast too high? Has the market changed?ANALYTICS
Directive
• We need to keep an eye on this all of the time
• We have an opportunity
• Please make this analysis part of the business
Action
• Implement Modeled KPI-based alerts
• Annual re-analysis Alter sandbox activities to address lessons learned from this scenario BAU
Data Driven means you have operationalized
correlative behavior
One-time Scenarios are Not Data-Driven Scenarios
pg 21© 2018 First San Francisco Partners www.firstsanfranciscopartners.com
Resolution means
communications have worked

We Encourage You to Think Beyond the Data
pg 22First San Francisco Partners www.firstsanfranciscopartners.com© 2018
Communicating analytics is both art and science.− It requires a plan and thoughtful approach.− It’s meant to drive understanding
and action.
Be creative and consider using compelling visuals.
Remember, you’re telling a story withthe data.
You and your organization will benefit from more effective analytics communication.

Share Your Questions and Comments!
MONTHLY SERIES

Thank you for joining us today!.Our next #DIAnaltyics webinar is Thursday, April 5,
Advanced Analytics Governance: EffectiveModel Management and Stewardship.
John Ladley @[email protected]
Kelle O’Neal @[email protected]