Embed Size (px)
Citation preview
July 10, 2001
1
Data Center Power Requirements:Measurements From Silicon Valley
Jennifer Mitchell-Jacksona, Jonathan G. Koomeyb*, Bruce Nordmanb, Michele Blazekc
aEnergy and Resources Group, 310 Barrows Hall, University of California, Berkeley, CA 94720bLawrence Berkeley National Laboratory 1 Cyclotron Road, Mail stop 90-4000, Berkeley, CA 94720
cAT&T, Suite 3188, 4430 Rosewood Drive, Pleasanton, CA 94588
*Corresponding author. Tel.: +1-510-486-5974; fax: +1-510-486-4247.Email address: [email protected] (J. Koomey)
Abstract
Current estimates of data center power requirements are greatly overstated because they are
based on criteria that incorporate oversized, redundant systems, and several safety factors.
Furthermore, most estimates assume that data centers are filled to capacity. For the most part,
these numbers are unsubstantiated. Although there are many estimates of the amount of
electricity consumed by data centers, until this study, there were no publicly available
measurements of power use. This paper examines some of the reasons why power requirements
at data centers are overstated and adds actual measurements and the analysis of real-world data
to the debate over how much energy these facilities use.
1. Introduction
Current reports of data center energy use are mostly exaggerations. There are numerous accounts
of data centers that consume over 1000 W/m2 of power—more than ten times what is required by
a typical commercial office space—as well as accounts of facilities that require a large fraction
of the power put out by a single power plant.1 For example, prospective builders of a data center
in Sacramento, California told the local utility that they would need 50 to 60 MW of power,

2
roughly the equivalent of all other growth in the area in an average year [1]; and a single data
center in New Jersey requested an amount of power equal to one-third of that used by the entire
city of Newark [2]. Overstated energy demands such as these are problematic. For data center
owners, overstated demands lead to extra construction expenses and less energy efficient
facilities; for utility planners, these assertions lead to the building of excess generation,
transmission, and distribution capacity; and for the public they perpetuate the urban legend that
“the Internet” is a huge consumer of electricity. Below we provide ten reasons for these
exaggerated claims and we offer some real data from which to build more accurate estimates.
2. Reasons for Exaggerated Forecasts
2.1 Lack of common definitions and metrics
Power in data centers is most commonly discussed in terms of power density (in W/m2, or W/ft2
in the U.S.). It is often unclear, however, what this watts-per-square-meter number means
because the numerator and the denominator vary from use to use. A stated power density of 1000
W/m2 could refer to the power drawn by an isolated rack, or the average power density of the
building. Furthermore, extrapolating the power density of an isolated rack to the entire floor area
of a building is misleading because the floor area within a building includes aisle space, office
space, restrooms and hallways, all of which require much less power per square meter than
computer racks.
2.2 Nameplate power versus actual power
Power needs are often determined based on the nameplate power consumption, which is the
theoretical maximum amount of power that the equipment can draw. For safety reasons most

3
equipment never draws more than 80% of the rated power even during peak demand, and the
majority of computer equipment draws much less than 80% of its nameplate rating.2 As early as
1990, Norford et. al. [3] reported that nameplate ratings for personal computers tend to be
overstated by factors of two to four. Furthermore, a more recent paper by Basler and Hofman [4]
reported the electricity consumption of various other pieces of network equipment (i.e., routers,
switches, multiplexers, micro repeaters, media converters) and found that the measured power
was usually about 30% of the nameplate specifications. Designing for nameplate power
consumption rather than actual power draws, therefore, will result in significantly oversizing
building circuits and supporting systems.
2.3 Installed versus utilized circuit capacity
Power estimates are often based on maximum capacity values even when it is unlikely or
impossible for the actual power to ever reach this value. For example, one data center facility
fact sheet [5] explains that, "To conform to electrical code for peak power use, maximum power
usage is limited to 75% of circuit values (e.g. 15 amperes (A) for a 20 ampere circuit)." In this
data center, every circuit would always be oversized by at least 33%. Since many data centers are
built long before the mix of internal computer equipment is determined, it is difficult to minimize
the oversizing of circuits. The capacity of the installed circuits, therefore, will far exceed the
actual current capacity needed.
2.4 Dual power supplies
Some computer equipment employ dual power supplies to provide sufficient backup should one
circuit fail. In this case, even though the equipment draws a maximum of 6A, it would have not
one but two 6A power supplies, each connected to its own circuit. Since each power supply must

4
be connected to a separate circuit, three 6A-rated servers with dual power supplies would require
two 20A circuits—approximately twice the actual power requirements of the equipment even if
it were to draw the full nameplate power.
2.5 Reduction in server dimensions
Current facility designs assume that the customer will use the latest most energy-intensive
equipment which would mean that a standard rack (approximately 1.8 meters) could hold
roughly 40 1U servers (where 1U= 4.445 centimeters). Since today’s 1U servers can have as
many processors as older 4U or 5U servers, the 1U server could consume about the same amount
of electricity but with a fraction of the physical size. Most data centers, however, still use many
pieces of larger, less energy intensive computer equipment.3
2.6 Rack and facility utilization
A typical or standard equipment rack has approximately 40U of space, all of which, in theory,
could be occupied by energy-using equipment. But regardless of how many pieces of equipment
can fit in a rack, many racks are under-utilized. At the data center that we studied in most detail,
for example, the average rack was only one-third filled, and 47% of the audited racks had no
electrical equipment at all. While revenues or payback periods are calculated based on renting
only 30-40% of capacity [6], power requirements often assume 100% utilization.
2.7 Anticipation of high future loads
A recent paper by the Uptime Institute [7], using information from 15 computer manufacturers,
shows the trend (from 1992 to 2010) in power use by a full rack of servers. The paper from the
Uptime Institute indicates that the amount of power used by a full rack of servers is expected to

5
roughly double between 2000 and 2005. Given the introduction of 1U servers, and the rapid
turnover of computer equipment, data centers have started designing for power-dense equipment.
The recent introduction of lower powered and power managed servers, however, may mean that
these anticipated loads will not materialize [8].
2.8 Oversized heating, ventilation and air conditioning (HVAC) systems
Overestimating the power needs of the computer equipment leads to an overestimate of the heat
that will be dissipated from such equipment. The resulting systems will require larger chillers
and fans, and more computer room air conditioners (CRAC) than needed. Corresponding
electrical systems will have to be sized to accommodate a fully loaded HVAC system even
though the full capacity will never be needed. Oversizing HVAC systems reduces system
efficiencies and wastes energy.
2.9 Compounded safety factors
In an industry where reliability is highly valued, several systems will be oversized so that each
provides redundancy. The oversizing of each system is further compounded by the fact that the
engineers that design the mechanical systems are not the same engineers that design the electrical
systems or the computer equipment. Each discipline adds its own safety factors. The electrical
system, therefore, will be oversized for an already oversized computer and mechanical load.
2.10 Overly optimistic forecasts of the number of data centers
As a result of the slowing market, it is likely that forecasts of the number of data centers and the
total floor area in these facilities are significantly overstated. Companies may not end up
completing data centers or building all of the data centers that they planned. It is also possible

6
that some of the speculative data centers are being double counted. When new data centers are
sited, owners may “shop” their power needs to more than one utility to secure favorable rates.
Speculative power requests can lead to overestimates of the aggregate amount of power required
for this industry.
All of the reasons above cause total data center power requirements to be portrayed as higher
than actual. While the current estimates are too high, security and confidentiality concerns make
it difficult to gather the data required to determine more accurate estimates of power densities or
total power loads for these facilities. Companies that own data centers are often unwilling to
share information about their operation because they feel it may compromise proprietary
information. For example, reporting the presence of empty racks or cabinets may make the
company seem unpopular or unprofitable to observers. For this reason, until this study, there
were no publicly available measurements of power requirements at data centers. In this paper, we
report our findings from one Silicon Valley data center and summarize billing data from four
others in order to bring actual measurements and the analysis of real-world data to the debate
over how much energy these facilities use. Examining the energy needs of this data center also
allows us to gain a better understanding of where energy efficiency measures could be most
effective.
The estimates below are based on measured data, electrical and mechanical drawings, equipment
counts, manufacturer’s specifications for the equipment at this data center, electricity billing
data, and, where specified, previous relevant studies. While still rough, these estimates provide a
benchmark for a variety of electricity uses within data centers and offer a sense of the
complexities involved with estimating the power needs of these facilities.
7
3. Measurements from a Silicon Valley Data Center
3.1 General description of the facility
The data below were collected from a 11,645 m2 facility located in Silicon Valley, California
(USA). Like many data centers throughout the country, this facility was built within an existing
building shell to minimize construction time. At the time these measurements were taken, there
were 2,555 m2 of active computer rooms that occupied 22% of the total building floor area. (See
Figure 1.) The facility also contained office space, equipment rooms, and areas still under
construction. All space under construction is included in the “Other Area” category in Figure 1.
Bathrooms, hallways, and lobbies are also included in “Other Area.” In addition to the renovated
space, there was approximately 1,170 m2 of floor area that remained in its prior use. All
equipment in this area, therefore, was in this facility prior to the recent renovation. Thus, the
power loads from this part of the building do not represent new power requirements due to
growth of the Internet, or the addition of a data center. This “Prior-Use Area” is approximately
10% of the total facility’s floor space.
All of the space in the active computer rooms was leased; however, on average, only one-third of
the rack capacity was used. This space contained both cages that could hold from five to several
dozen racks and free standing cabinets (racks with doors). The equipment in an easily accessible
portion of one computer room was inventoried to determine the different types of computer
equipment currently in this data center. The area was part of a co-location facility where the
computer equipment was enclosed in cabinets. These cabinets were located in an area that
covered approximately 240 m2. This area was selected because the equipment could be easily
8
viewed and counted. Racks within cages were not selected because access to the cages was
restricted and it was impossible to accurately inventory the computer equipment from outside the
cages. The data, therefore, may over-represent smaller customers because they tend to rent
cabinets rather than larger cages. The inventory for this area is reported in Table 1.
Approximately 47% of the racks in this space were empty. (A few had cable connections but no
energy-using equipment.) The remaining racks had varying amounts of equipment. Servers,
ranging in size from 1U to 8U accounted for 61% of the utilitized rack space. One third of these
servers were 2U servers. While the data in Table 1 give a sense of the types of equipment in this
space, it is difficult to estimate power consumption based on this information because the energy
demands vary depending on the internal configuration of the equipment. Although servers
generally use less power per unit area than routers, one 4U server may require significantly more
power than another 4U server depending on its vintage, design, function, etc. As a result, it is
difficult to determine the power requirements from the external appearance of the computer
equipment.
3.2 Determining power demands from computer equipment
All of the computer equipment was connected to power distribution units (PDUs) that displayed
the voltage and current for each of the three phases. Power readings from these PDUs were taken
in January 2001. The apparent power requirement for the computer equipment was
approximately 445 kW. A power factor of 0.97 was used to convert from apparent to real power.
Newer computer equipment usually corrects the incoming power to eliminate harmonic
distortions that might cause disruptions. For example, new switching power supplies for Sun
computers have active power factor correction to at least 0.99 in most cases.4 Measurements

9
from a both a New York City data center and an Oakland data center, however, indicated that the
aggregate power factor for computer equipment (including routers, switches and hubs) is closer
to 0.97. The real power requirement for the computer equipment was approximately 432 kW,
resulting in a computer power density slightly less than 170 W/m2.
3.3 Power used in the prior-use area
An approximate average power density for the “Prior-Use” area, which represented 10% of the
total building area, was determined from historic billing data. The power density was
approximately 215 W/m2 over this 1,170 m2 area. This value includes all of the equipment,
lights, fans and plug loads in this area but does not include the power needed to provide chilled
water to the air conditioning units (i.e., the central plant requirements—see 3.8 below) because
the HVAC central plant power was on a separate meter.
3.4 Power used by computer equipment in office space
The number of computers was much less than would be expected in an equally large commercial
office space since the main employees of the building were mechanical and electrical personnel.
The average heat gain for a typical office computer is approximately 55 watts [9]. A medium
sized monitor would add an additional 90 watts [10]. This estimate is for an active computer and
does not take into account that the computer and monitor would draw less if it is in a power
saving mode, nor the fact that these computers are probably not on 24 hours a day. Furthermore,
a laptop would require less power and generate less heat than a desktop computer. We assumed
that the twelve computers found in the office space consumed 145 watts at all times. This is
approximately 1,740 watts, or 1.1 W/m2 over the 1,330 m2 office space.

10
3.5 Lighting
The electrical drawings indicated that the power density of the lighting in the computer rooms
was approximately 12 W/m2. Mechanical and equipment rooms tend to have a slightly lower
lighting power density; therefore, a value of 8 W/m2—a typical value for this type of room
determined from an earlier study on lighting [11]—was used for these areas. In the office space
of a typical commercial building, lighting requires approximately 19 W/m2 [11]. Using these
values, the total load from lighting was approximately 117 kW. (This does not include lighting in
the Prior-Use area.)
3.6 Other Loads
In addition to lights and computers, other office equipment such as copiers and fax machines
contribute small power loads throughout the office space. A recent ASHRAE Journal reported the
heat gain to be approximately 1,100 watts from an office copier, 30 watts from a facsimile
machine, 25 watts from an image scanner, and 550 watts from a large office laser printer [9].
These numbers do not take into account power saving modes or end-of-the-work-day shutdowns
but they give a reference point for calculating the additional loads in this space. For our
calculations, we assumed that this additional equipment drew just 3 W/m2 since the power
density of the computers in this area was already included in an earlier step, and since this space
was not densely occupied. In addition, 1 W/m2 was added to all “other” areas to account for
small miscellaneous loads. These values carry with them less certainty than the measured data
reported above, but they are small in comparison to the larger loads of the computers and HVAC
system (discussed below).
3.7 Losses due to auxiliary equipment
11
As electricity passes through the uninterruptible power supplies (UPSs) and power distribution
units (PDUs) some is lost to the internal components in this equipment. With a full load, UPSs
are approximately 95% efficient, and PDUs can be close to 98% efficient. As the load drops,
however, these efficiencies decrease. Since these systems were under light loads, we assumed
that the PDU and UPS efficiencies were on the lower end of these ranges and that the losses were
approximately 5% and 7%, respectively. As a result, approximately 22 kW were consumed by
the PDUs and 32 kW were used by the UPSs, for a total of 54 kW. In addition, line losses and
other auxiliary equipment such as building controls, fire alarms, security systems, telephone
systems, and backup diesel generators also use small amounts of power. Overall, approximately
100 kW were consumed by auxiliary equipment and line losses. While these power draws
occurred throughout the facility, they were allocated to the active computer rooms since the
majority of this auxiliary equipment was in the building for the sole purpose of supporting the
computer rooms.
3.8 Power for the HVAC central plant
The active chiller in this facility was an 800 ton York chiller. (An additional 800 ton chiller was
also onsite as a backup.) The total heat load in this facility, as indicated by the monitor on the
chiller, was approximately 320 tons. Since the chiller required approximately 0.52 kW/ton,
demand from the chiller was approximately 166 kW. The active cooling tower had a 30
horsepower, or approximately 22 kW, motor. However, since the cooling tower was running at
only 40% of capacity, the motor was using the minimum amount of power: 2.2 kW or 10% of the
design.5 While the chiller and the cooling tower were operating at 40% of capacity, the pump to
circulate the chilled water through the facility required a constant horsepower regardless of the

12
load. This pump, therefore, required full power or approximately 45 kW.6 In total, the central
plant (including the chiller, cooling towers and pump) required approximately 213 kW.
3.9 Power for air distribution
The computer rooms in this facility employed twelve 50-ton CRAC units and six 30-ton CRAC
units. In addition, there were four additional air conditioning units that cooled air remotely and
then blew the cool air into the computer rooms. Overall, therefore, there were 22 units; for
redundancy purposes, however, only 18 ran at one time. Under the current light loads, these units
were operating at approximately 30% of capacity. The fans within these units, however, ran
constantly. The fans in a typical 50-ton CRAC unit require approximately 10 horsepower or 7.5
kW each. The fans in the smaller 30-ton units used slightly less power. A CRAC with
dehumidifiers and reheat systems as well as internal monitors and other components, however,
requires closer to 40 HP or approximately 30 kW. Assuming that 5 of the CRAC units were able
to dehumidify and reheat and that the others were just cooling units, the 22 units would use a
total of approximately 215 kW. In addition, the office space had its own packaged air-handling
unit and additional fans were located throughout the building. As a result, the total air
distribution system for this facility was estimated to be 250 kW.
3.10 Total power needs
The computer rooms in this facility were designed so that the computer equipment could draw an
average of 646 W/m2. As shown in Table 2, however, the actual computer power density was
169 W/m2—just over one-fourth of the design value. Computer power density, however, includes
only the power drawn by the computer equipment and does not include power required by the
supporting systems. It is not, therefore, indicative of the total power needs of this data center.

13
Over the building’s 11,645 m2 floor area, the average building power density was 118 W/m2. (All
power density assumptions are listed in Table 3.) The building’s total power requirement,
approximately 1.4 MW, was determined by multiplying the power density for each area by the
appropriate floor area. (See Table 4 for total power needs by end use.) This monthly average
was confirmed by the electricity billing data from the local utility.
Average building power densities, however, are also not indicative of the power required by data
centers because many computer rooms have been added to buildings with previously existing
energy needs. In these cases, a significant portion of the power required is not new power or
power required by the data center. Furthermore, because the ratio of computer room to other
space varies between facilities, it is also impossible to compare these power densities. The
average building power density of a skyscraper with one large densely packed computer room,
for example, would most likely be much less than the average building power density of a small
sparsely filled computer room in a small facility despite the fact that the data center in the
skyscraper requires much more energy.
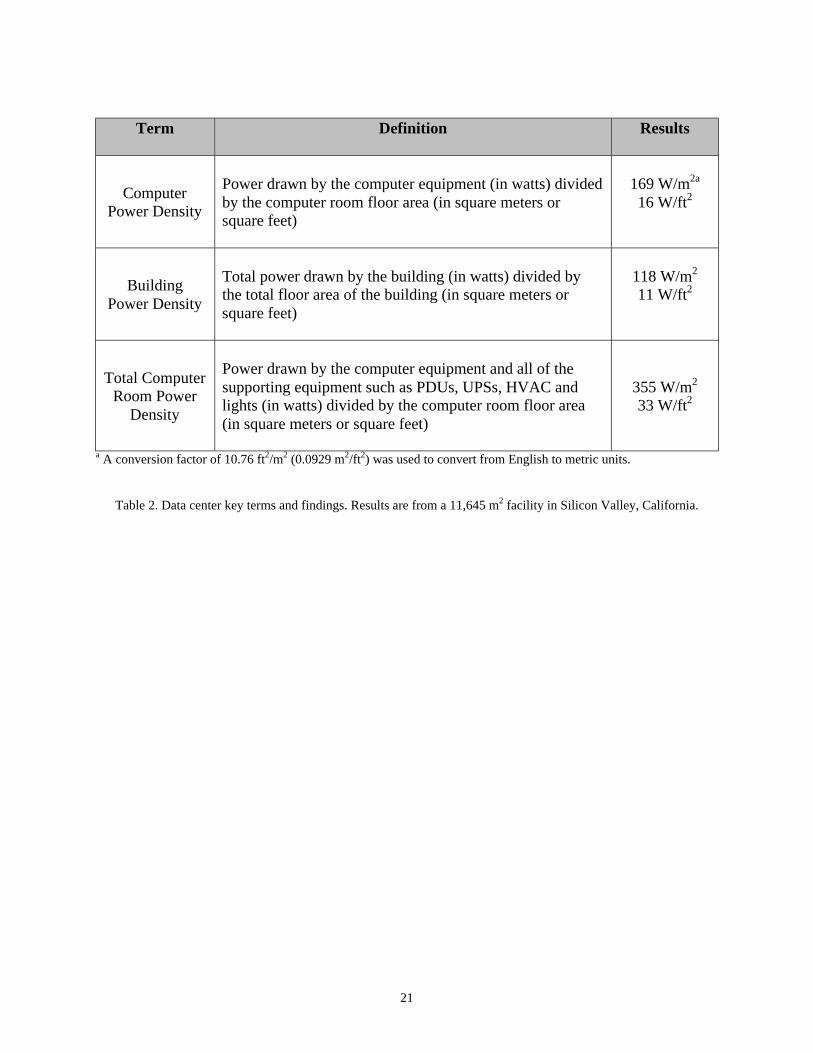
Estimates of total computer room power density are most indicative of data center power needs.
(See Table 2.) We define the total computer room power density as the power drawn by the
computer equipment and all of the supporting equipment such as PDUs, UPSs, HVAC and lights
(in watts) divided by the computer room floor area (in square meters). After including all of the
support systems, we estimated that the total computer room power density for this building was
approximately 355 W/m2 (33 W/ft2). This value was supported by a review of billing data for

14
four additional data centers throughout the country. In each of these four facilities, we found that
the total computer room power density was less than 430 W/m2 (40 W/ft2).7
Nearly one half of the power used to support the computer rooms went to the computer
equipment. (See Figure 2.) The remaining power was used for the HVAC and auxiliary
equipment as well as other end uses such as lighting. The HVAC system (including the central
plant and the air distribution, or fans) accounted for approximately 38% percent of the power.
Lighting represented only a small percentage—less than 3% of the power needs.
4. Conclusions
Standardized definitions and estimation methodologies can facilitate comparisons of data center
energy use. In particular, estimates of total computer room power density allow for comparisons
of data center power use between buildings of different sizes as well as between data centers at
different stages of development. The total computer room power density captures all power
drawn by the computer equipment as well as by the supporting equipment such as HVAC, PDUs
and UPSs (in watts) divided by the computer room floor area (in square meters). In the data
center examined in this study, total computer room power density was determined to be
approximately 355 W/m2 (33 W/ft2), which is much less than the numbers often cited by the
media.
To support the 2,555 m2 of critical computer room floor area in this facility, the data center drew
approximately 900 kW of power. This 900 kW is most indicative of the new power requirements
at this data center due to Internet growth. The remaining power (approximately 500 kW)

15
required by this facility was used for “Prior Uses” and is not indicative of additional power
requirements due to Internet growth. When determining power requirements of data centers, care
should be taken not to include previously existing loads.
While not as high as reported, data center power densities are much higher than those for typical
commercial office buildings because of the densely packed computer equipment. Since many
systems within data centers are designed inefficiently, energy efficiency measures can lead to
significant energy savings. Targeting computer equipment for energy efficiency gains is an
effective measure since computer equipment accounts for nearly one-half of electricity
consumption in data centers. Reducing the energy requirements of the computer equipment and
getting more accurate estimates of the computer equipment’s electricity use can also have a
significant impact because most of the other systems within the facility are sized to the estimated
power needs of this equipment.
While this study serves as a benchmark for power densities found at data centers, additional
studies and collaborative efforts between utilities, data centers, and local governments are
needed. Further studies can help to create a better understanding of the real power needs of data
centers and also help to determine appropriate energy efficiency measures for these facilities.
References
[1] Peyton C. Data servers crave power: High-tech electricity needs amplify crisis. The Sacramento Bee,
November 26, 2000.
[2] Feeder B. Digital Economy’s Demand for Steady Power Strains Utilities. New York Times, July 2,
2000.
16
[3] Norford L, Hatcher A, Harris J, Roturier J, Yu O. Electricity Use in Information Technologies. Annu.
Rev. Energy 1990;15:423-53.
[4] Kunz, M. Energy consumption of electronic network components (English Version). Zurich:
Bundesamt für Energiewirtschaft Forschungsprogramm Elektrizität, Basler & Hofman, November 26,
1997.
[5] HostPro spec sheet on cabinets, http://www.hostpro.com/datacenters/specs.html, viewed April 12,
2001.
[6] Mahedy S, Cummins D, Joe D. Internet Data Centers: If Built…Will They Come. New York, NY:
Salomon Smith Barney, August 3, 2000, p 16.
[7] The Uptime Institute. Heat Density Trends in Data Processing, Computer Systems, and
Telecommunications Equipment. White Paper issued by the Uptime Institute, 2000.
[8] Stein J. More Computing Power, Less Electrical Power. In: ET Currents Number 7, E Source, March
2001.
[9] Wilkins C, Hosni MH. Heat Gain From Office Equipment. ASHRAE Journal, June 2000.
[10] Kawamoto K, Koomey J, Nordman B, Piette M, Brown RE. Electricity Used by Office Equipment
and Network Equipment in the U.S.: Detailed Report and Appendices. Berkeley, CA: LBNL Publication
45917, February 2001. Available at http://enduse.lbl.gov/Projects/InfoTech.html.
[11] Richman EE, Jones CC, Lindsley J. An Empirical Data Based Method for Development of Lighting
Energy Standards. Journal of the Illuminating Engineering Society, Summer 1999.
[12] Mitchell-Jackson, J. 2001. Energy Needs in an Internet Economy: A Closer Look at Data Centers.
M.S. Thesis, Energy and Resources Group, University of California, Berkeley. May. Available at
http://enduse.lbl.gov/Projects/InfoTech.html.

17
Computer Rooms22%
Prior Use10%
Equipment Rooms26%
Office Space11%
Other Area31%

18
computer equipment48%
lights3%
central chiller plant14%
fans, CRAC units, AHUs24%
auxiliary equipment11%

19
Figure captions
Fig. 1. Facility floor space (11,645 m2 total).
Fig. 2. Total computer room power by end use.

20
Space in ‘U’s
Type of Equipment Number (where 1U=4.445 cm)
Percent of utilizedrack space devoted to
equipment
Servers 229 596 61%
Switches 101 177 18%
Disks 18 88 9%
Routers 13 81 8%
Firewalls 8 15 2%
Other 12 19 2%
Total 381 976 100%
Table 1. Inventory of equipment found in cabinets in a co-location hosting facility. The aboveequipment was located in approximately 240 m2 of a computer room in Silicon Valley, California.Data collected by Bruce Nordman and Jennifer Mitchell-Jackson, November 2000.
21
Term Definition Results
ComputerPower Density
Power drawn by the computer equipment (in watts) dividedby the computer room floor area (in square meters orsquare feet)
169 W/m2a
16 W/ft2
BuildingPower Density
Total power drawn by the building (in watts) divided bythe total floor area of the building (in square meters orsquare feet)
118 W/m2
11 W/ft2
Total ComputerRoom Power
Density
Power drawn by the computer equipment and all of thesupporting equipment such as PDUs, UPSs, HVAC andlights (in watts) divided by the computer room floor area(in square meters or square feet)
355 W/m2
33 W/ft2
a A conversion factor of 10.76 ft2/m2 (0.0929 m2/ft2) was used to convert from English to metric units.
Table 2. Data center key terms and findings. Results are from a 11,645 m2 facility in Silicon Valley, California.

22
Area BreakdownFloor Area
(m2) aDirect Use Power Densities
(W/m2)Supporting Equipment Power
Densities (W/m2)
PowerDensity(W/m2) c
computers or prior
uselights other
auxiliaryequipment
centralchillerplant c
fans,CRACunits,
AHUs c
Computer Rooms 2,555 169 12 0 39 51 83 355Prior Use 1,170 215 b n.a. n.a. n.a. 50 n.a 265Equipment Rooms 2,990 0 8 0 0 2 3 13Office Space 1,330 1 19 3 0 6 9 38Other Floor Area 3,600 0 11 1 0 3 4 19
Total Building 11,645 59 10 1 9 18 21 118a A conversion factor of 10.76 ft2/m2 (0.0929 m2/ft2) was used to convert from English to metric units.b Lights, other, auxiliary equipment and fans for the “Prior Use” area are included in the 215 W/m2. Billing data forthis area did not permit a more detailed breakdown.c Note that some values differ slightly from earlier write-up of results [12] because of recent modifications to thecalculation methods.
Table 3. Power density by end use from a data center facility in Silicon Valley, California.

23
Area Breakdown Direct Use Power (kW)Supporting Equipment Power
(kW)Total Power (kW) a
computerequipment or
prior use lights otherauxiliary
equipment
centralchillerplant a
fans,CRACunits,
AHUs a Computer Rooms 432 30 0 100 131 213 907
Prior Use 252 n.a. n.a. n.a. 59 n.a. 311
Equipment Rooms 0 23 0 0 5 9 36
Office Space 2 26 4 0 7 12 51
Other Floor Area 0 39 4 0 10 16 69
Total 686 117 8 100 213 250 1,374 a Note that some values differ slightly from earlier write-up of results [12] because of recent modifications to thecalculation methods.
Table 4. Total power demanded by end use as found in a 11,645 m2 facility in Silicon Valley, California.
24
Endnotes 1 A conversion factor of 10.76 ft2/m2 (0.0929 m2/ft2) was used to convert from English to metric units.
2 See Mitchell-Jackson, Jennifer, “Energy Needs in an Internet Economy: A Closer Look at Data Centers,” May
2001 for details on where these exaggerations occur, and further information other parts of this paper. Document
available at http://enduse.lbl.gov/Projects/InfoTech.html.
3 It should also be noted that new bladed servers offer even higher server densities than 1 U servers. Information on
the RLX System 324, for example, states that one rack can support 336 servers. Manufacturer reports, however,
indicate that these servers require less power per square meter than 1 U servers. See RLX Technologies’ White
Paper on Redefining Server Economics, May 2001 for more details on bladed servers. Document available at
http://www.rlxtechnologies.com/media/kits/.
4 Email from Sun Microsystems technical support desk, 07 February 2001. Email text as follows: an active power
factor correction to at least 0.99 “has become a regulatory requirement for almost all new switching power supplies,
with particularly strict regulations in the European Union. Uncorrected power factor can cause core saturation in the
distribution transformers leading to early failure and decreased efficiency in the distribution grid.” Also supported
by The Uptime Institute, 2000.
5 Data gathered from the manufacturer.
6 From manufacturer’s specification.
7 The four values were: 85 W/m2, 365 W/m2, 375 W/m2, and 410 W/m2.