Embed Size (px)
Citation preview


AGENDA:
ABOUT USCLOUDINDUSTRIES.EUDASHBOARDSAPPLICATIONS

AGENDA:
ABOUT USCLOUDINDUSTRIES.EUDASHBOARDSAPPLICATIONS
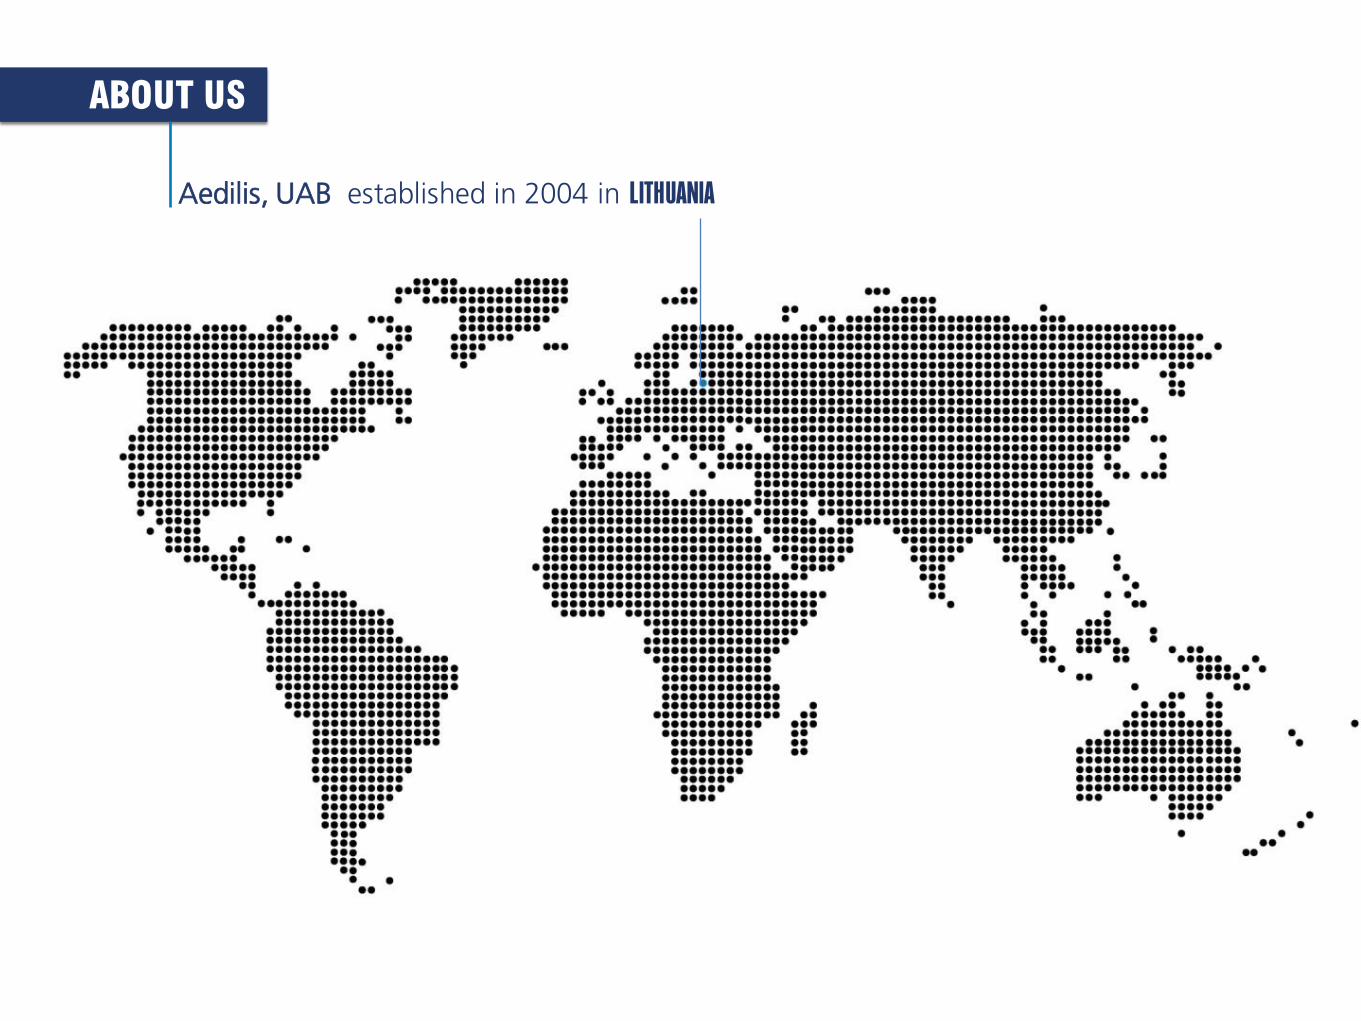
Aedilis, UAB established in 2004 in LITHUANIA
ABOUT US
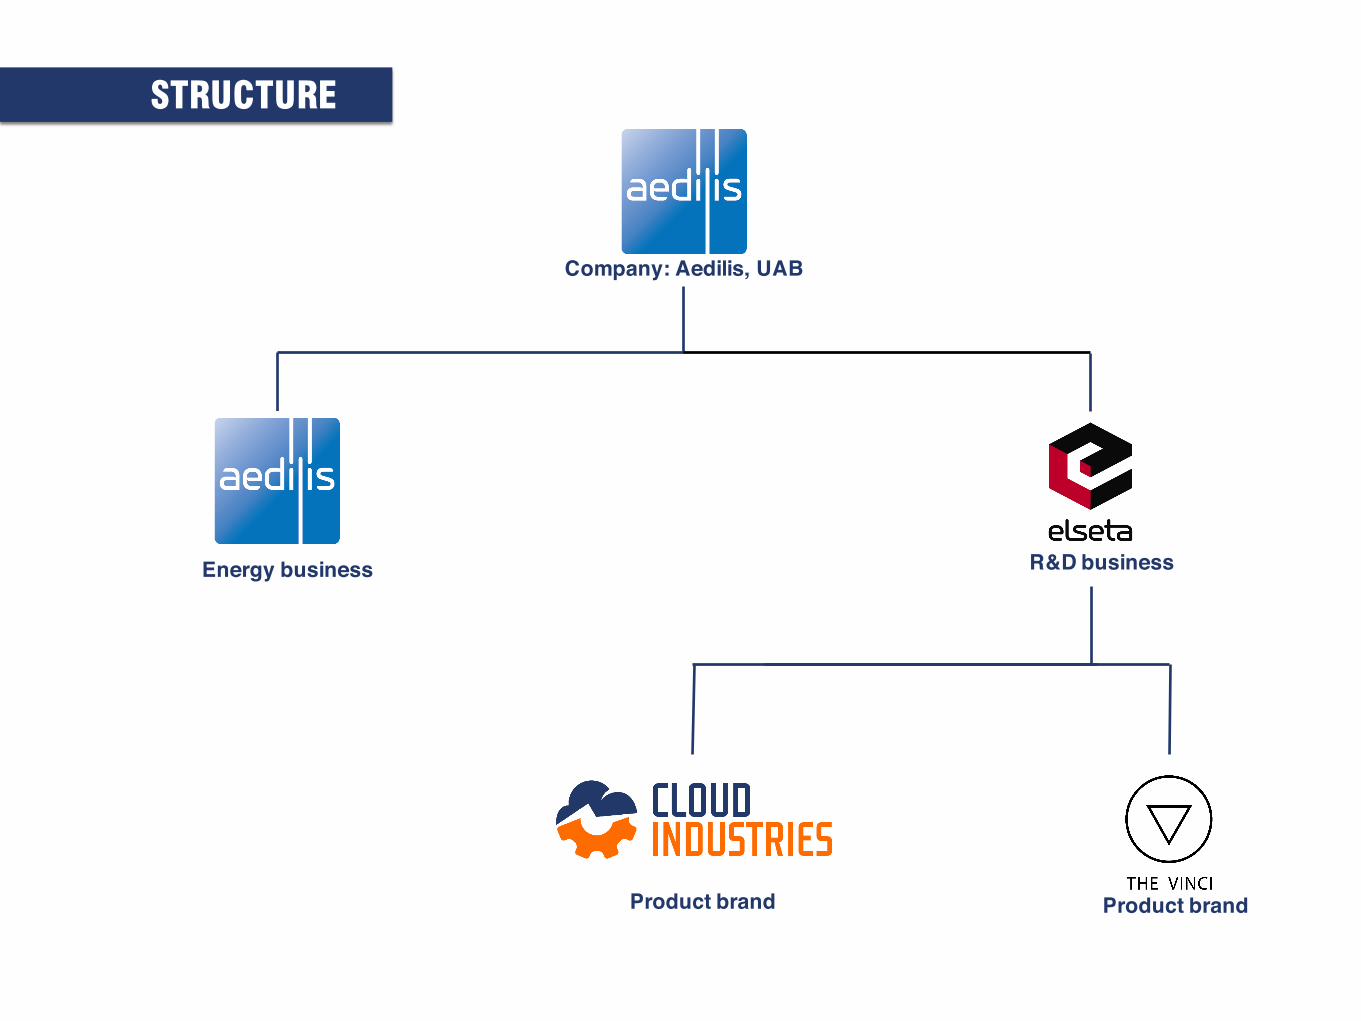
STRUCTURE
Company: Aedilis, UAB
Energy business R&D business
Product brand Product brand
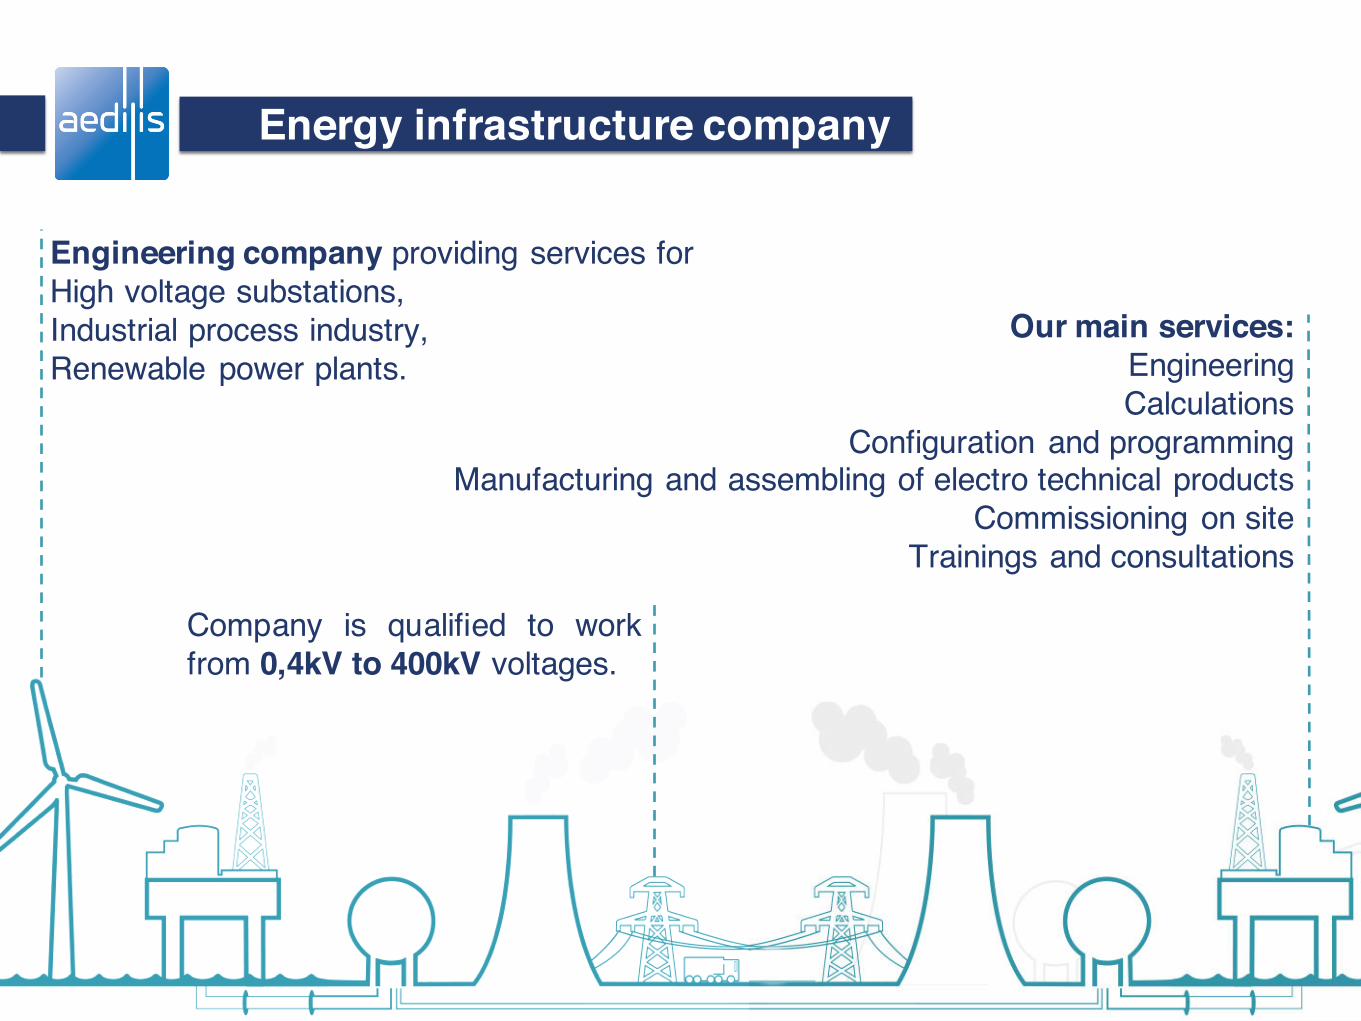
Energy infrastructure company
Engineering company providing services forHigh voltage substations,Industrial process industry,Renewable power plants.
Company is qualified to workfrom 0,4kV to 400kV voltages.
Our main services:EngineeringCalculations
Configuration and programmingManufacturing and assembling of electro technical products
Commissioning on siteTrainings and consultations
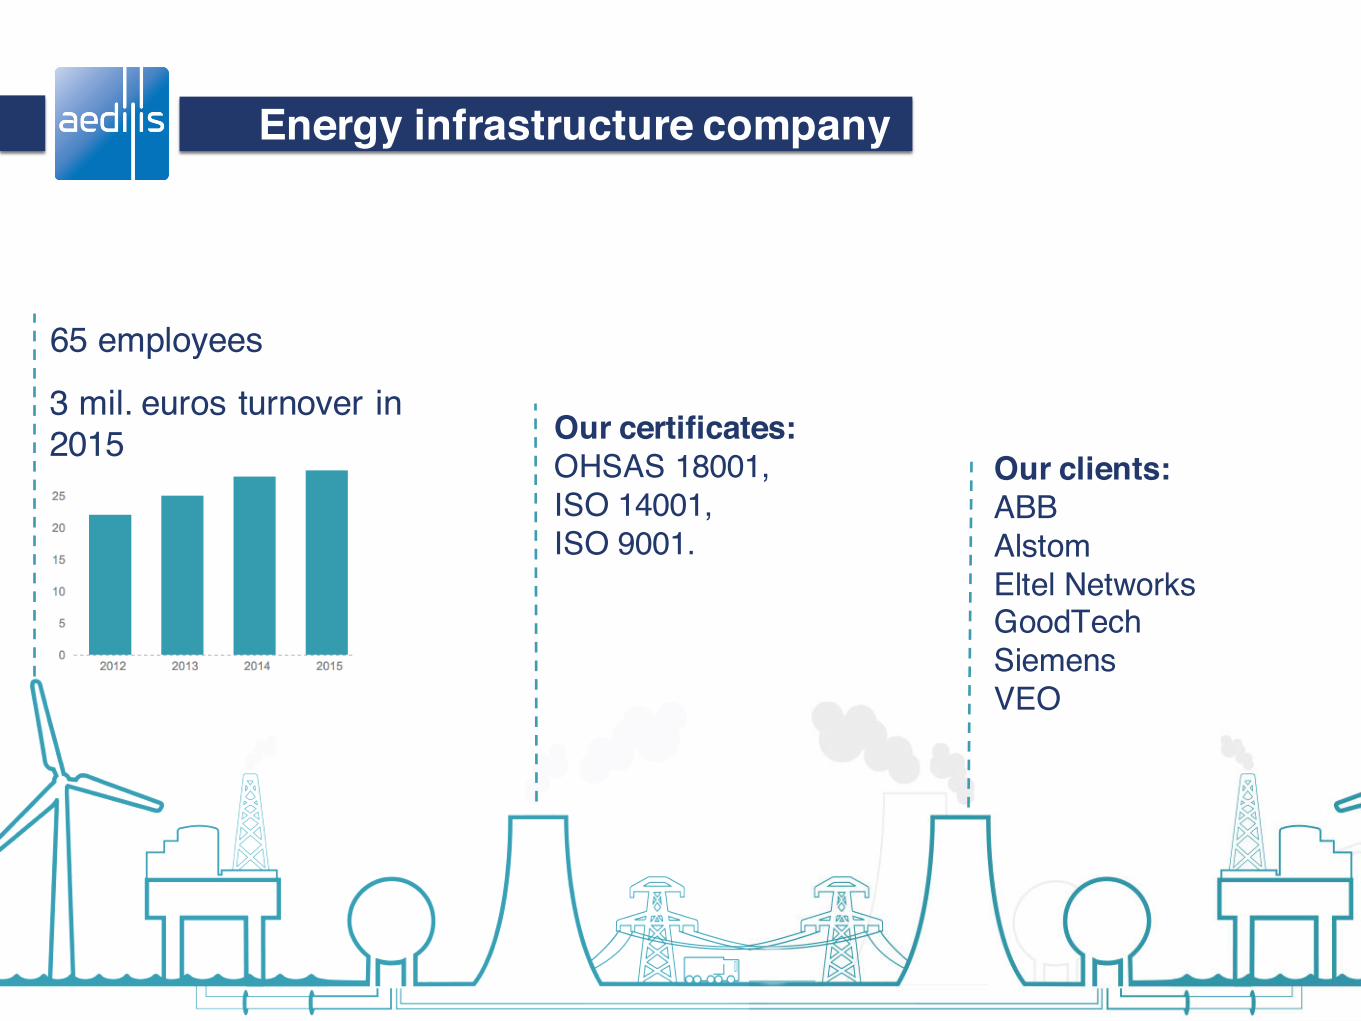
Energy infrastructure company
65 employees
3 mil. euros turnover in 2015 Our certificates:
OHSAS 18001, ISO 14001, ISO 9001.
Our clients:ABBAlstomEltel NetworksGoodTechSiemensVEO
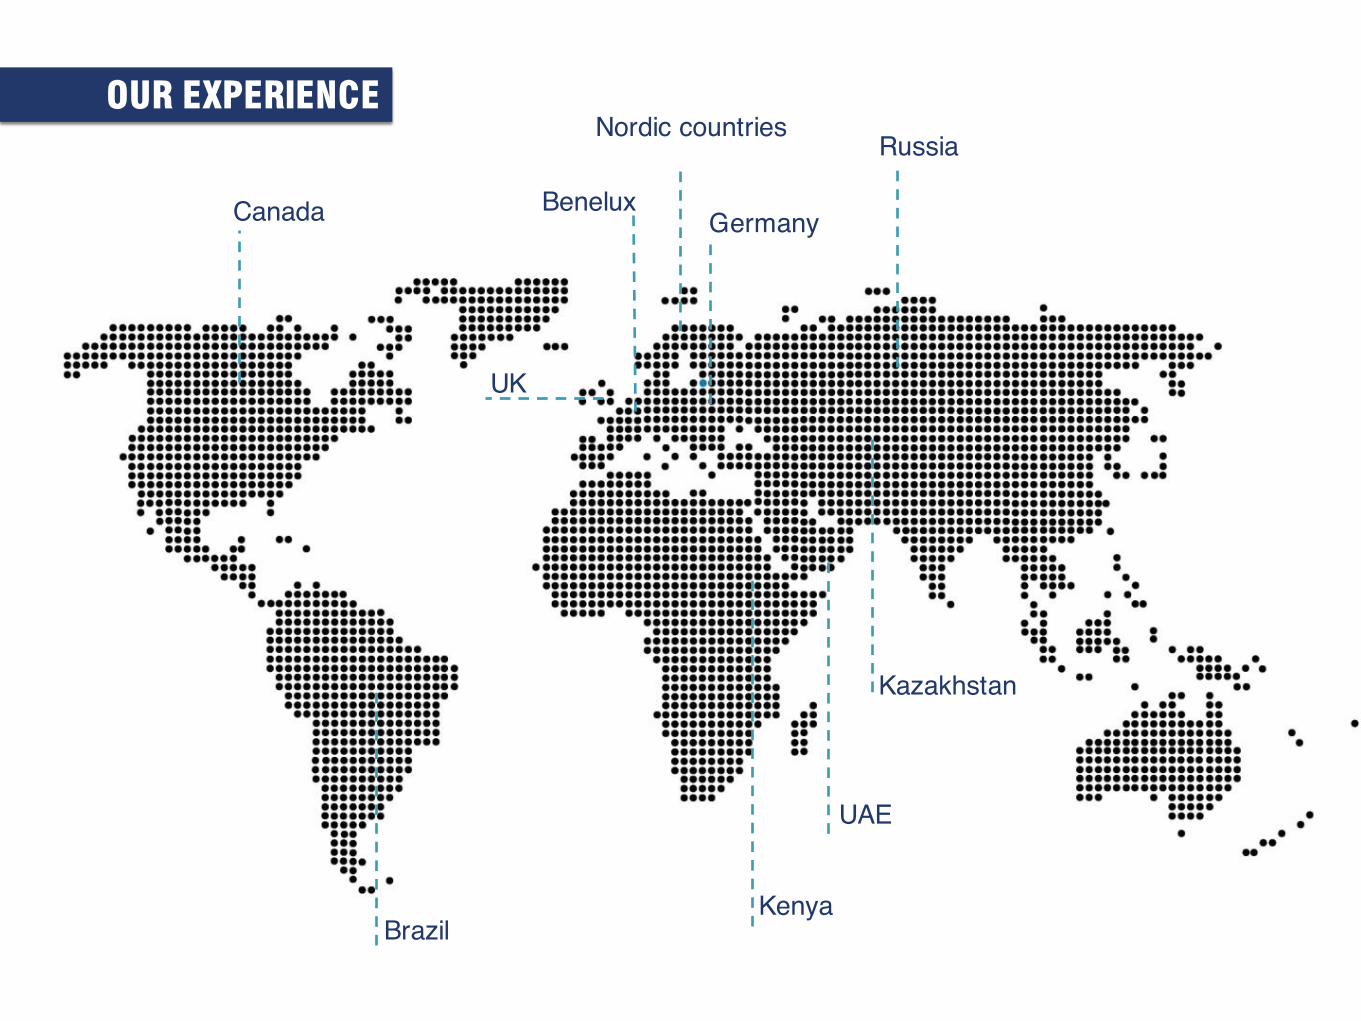
Nordic countriesRussia
Kazakhstan
UAE
KenyaBrazil
Canada
UK
GermanyBenelux
OUR EXPERIENCE

AGENDA:
ABOUT USCLOUDINDUSTRIES.EUDASHBOARDSAPPLICATIONS
ELSETA
R&D group established in 2011
Leading product is CloudIndustries.eu
Team of 12 people
Our engineers work in close cooperation with our clients andcan consult on solving electronics and software problems.
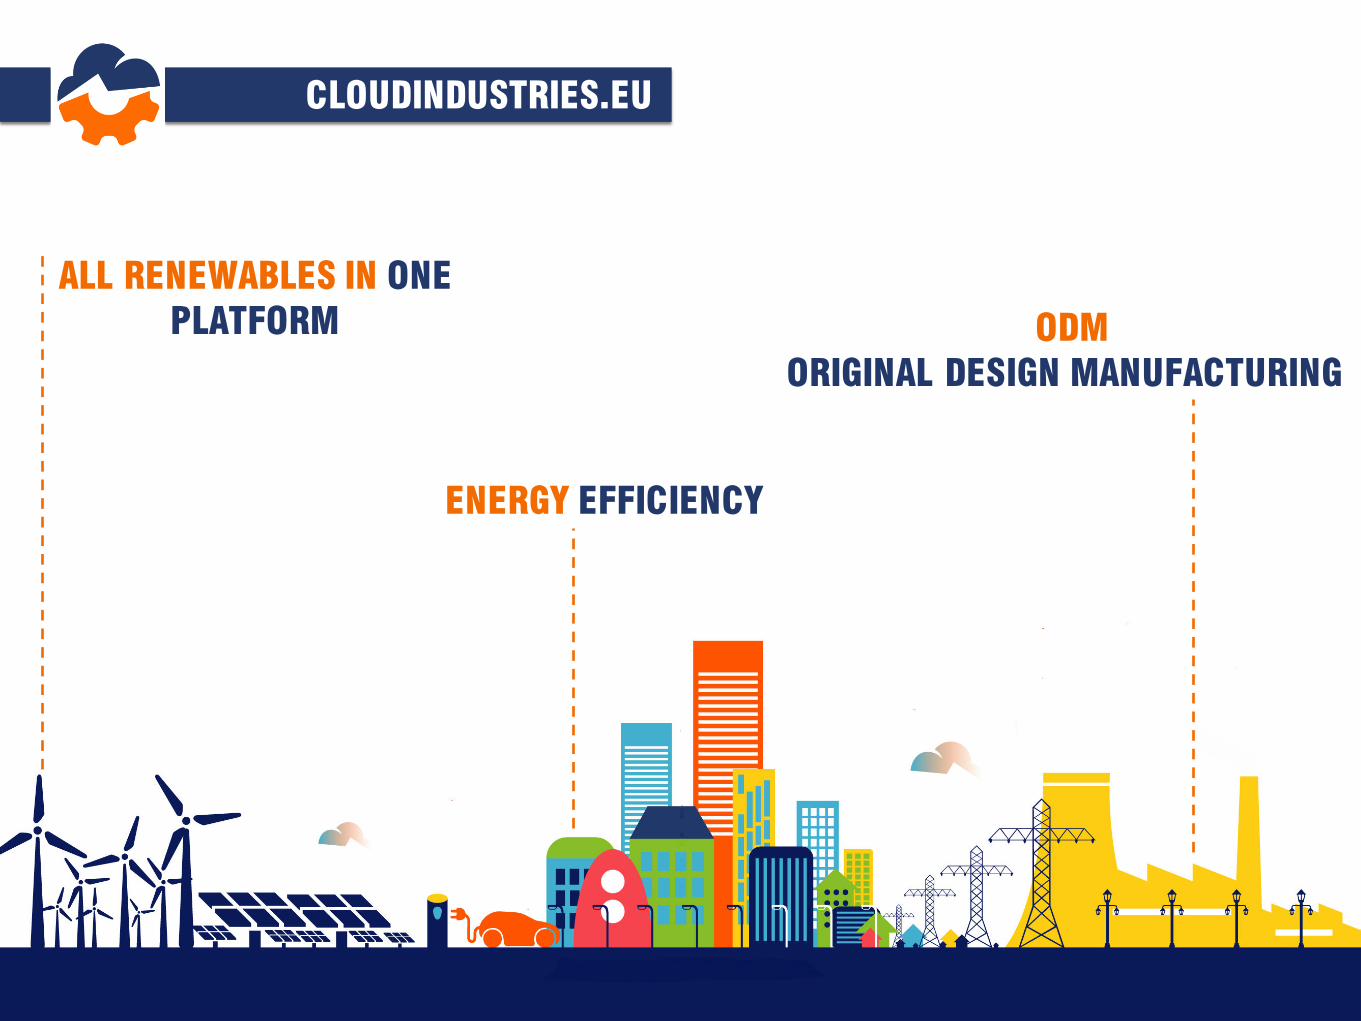
CLOUDINDUSTRIES.EU
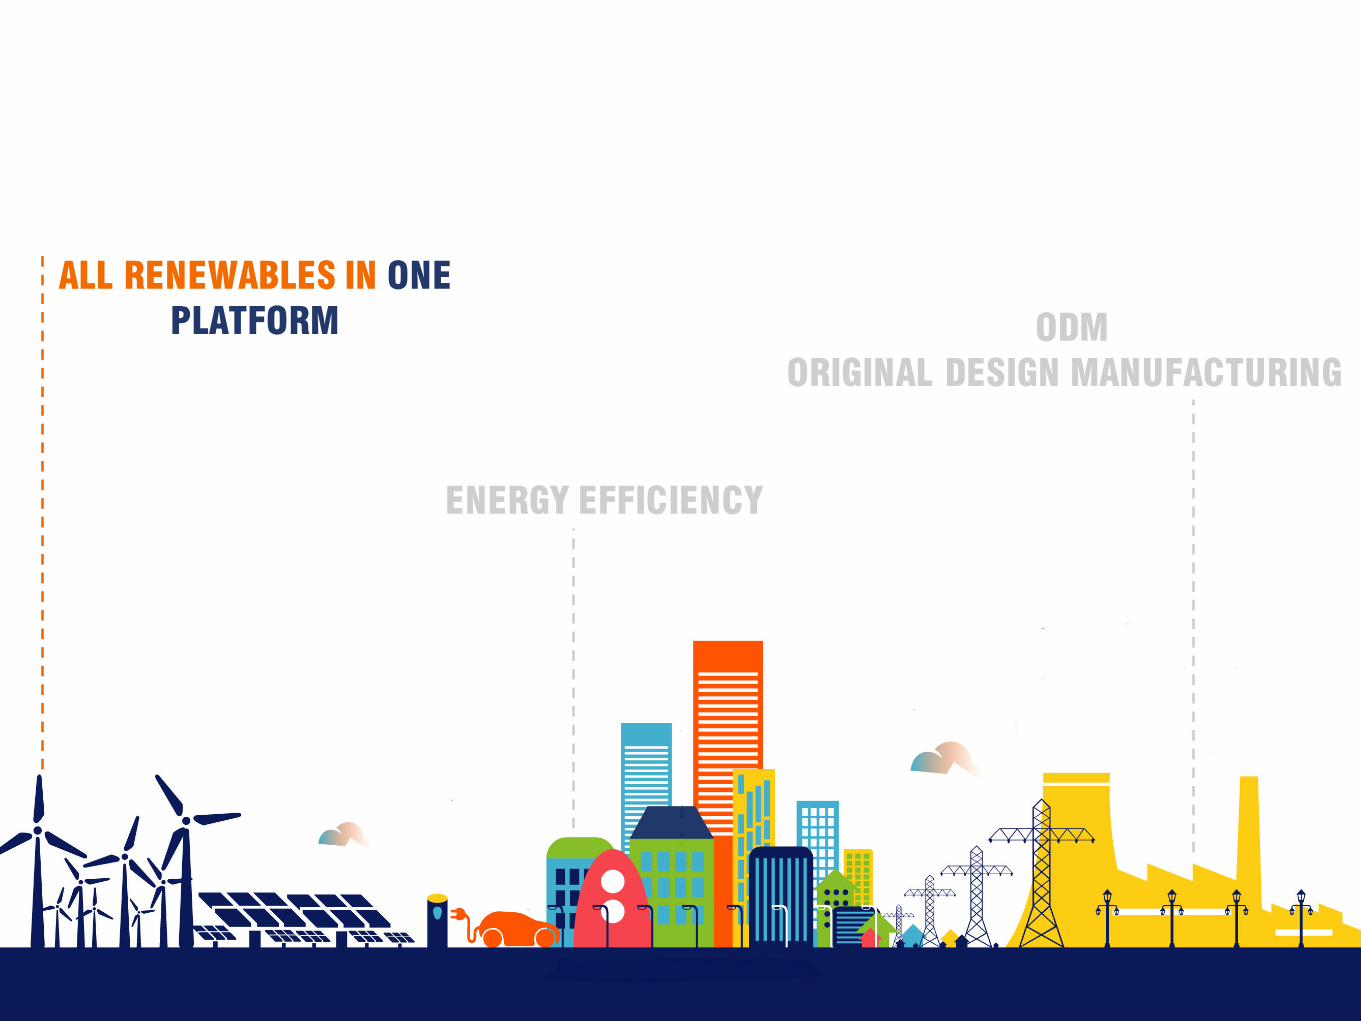
ALL RENEWABLES IN ONE PLATFORM
ENERGY EFFICIENCY
ODMORIGINAL DESIGN MANUFACTURING
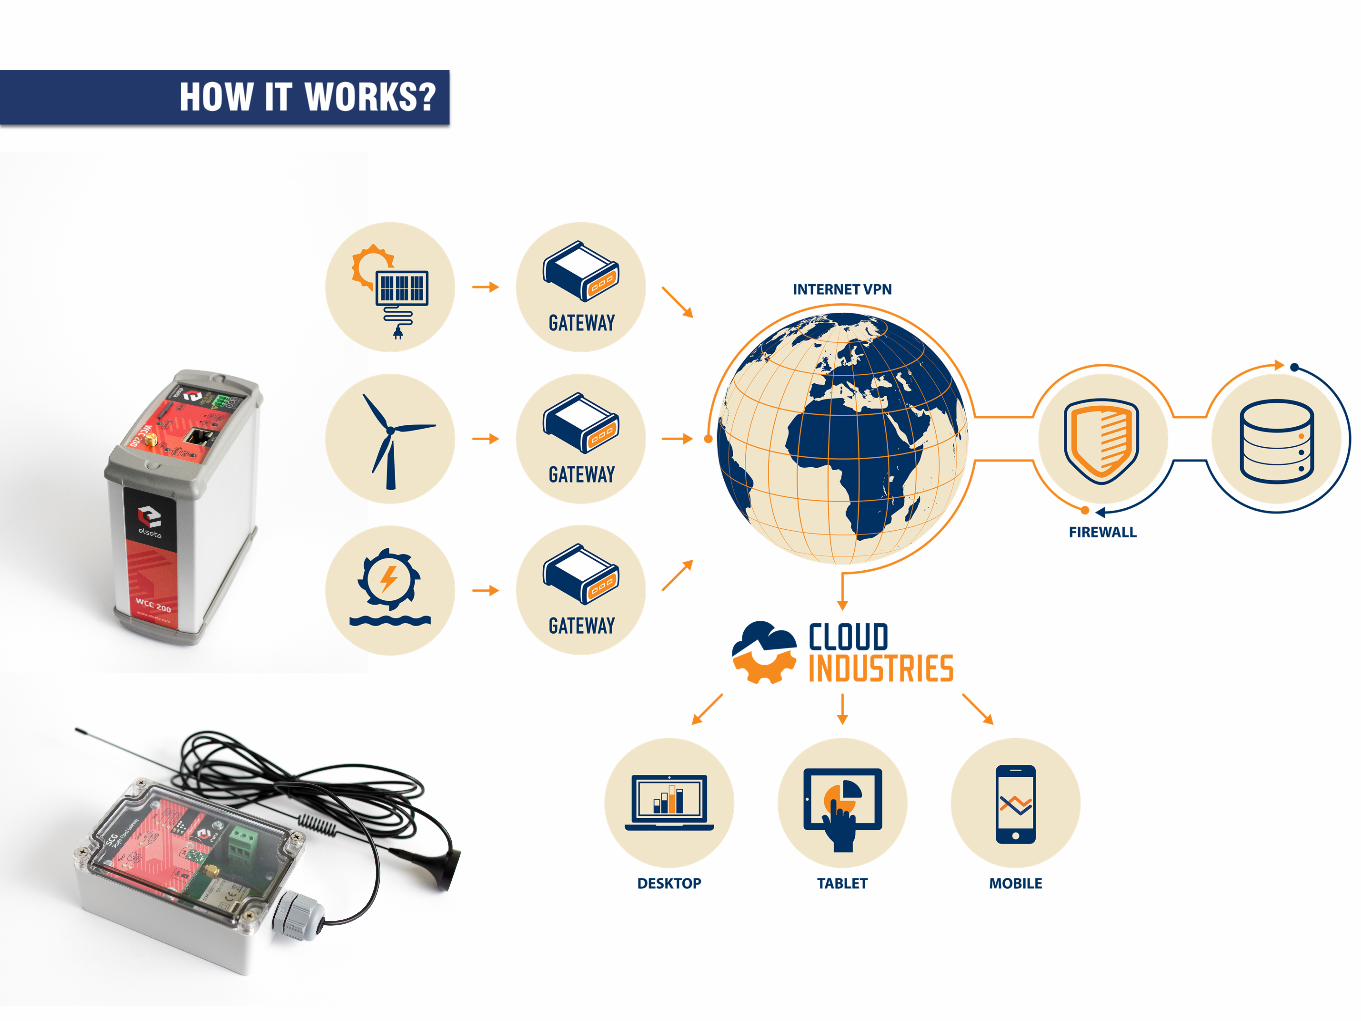
HOW IT WORKS?


Fromintuitiontoanalytics
SHIFTING IDEA ABOUT DECISION MAKING
FROMINTUITION
TOANALYTICS

AGENDA:
ABOUT USCLOUDINDUSTRIES.EUDASBOARDSAPPLICATIONS
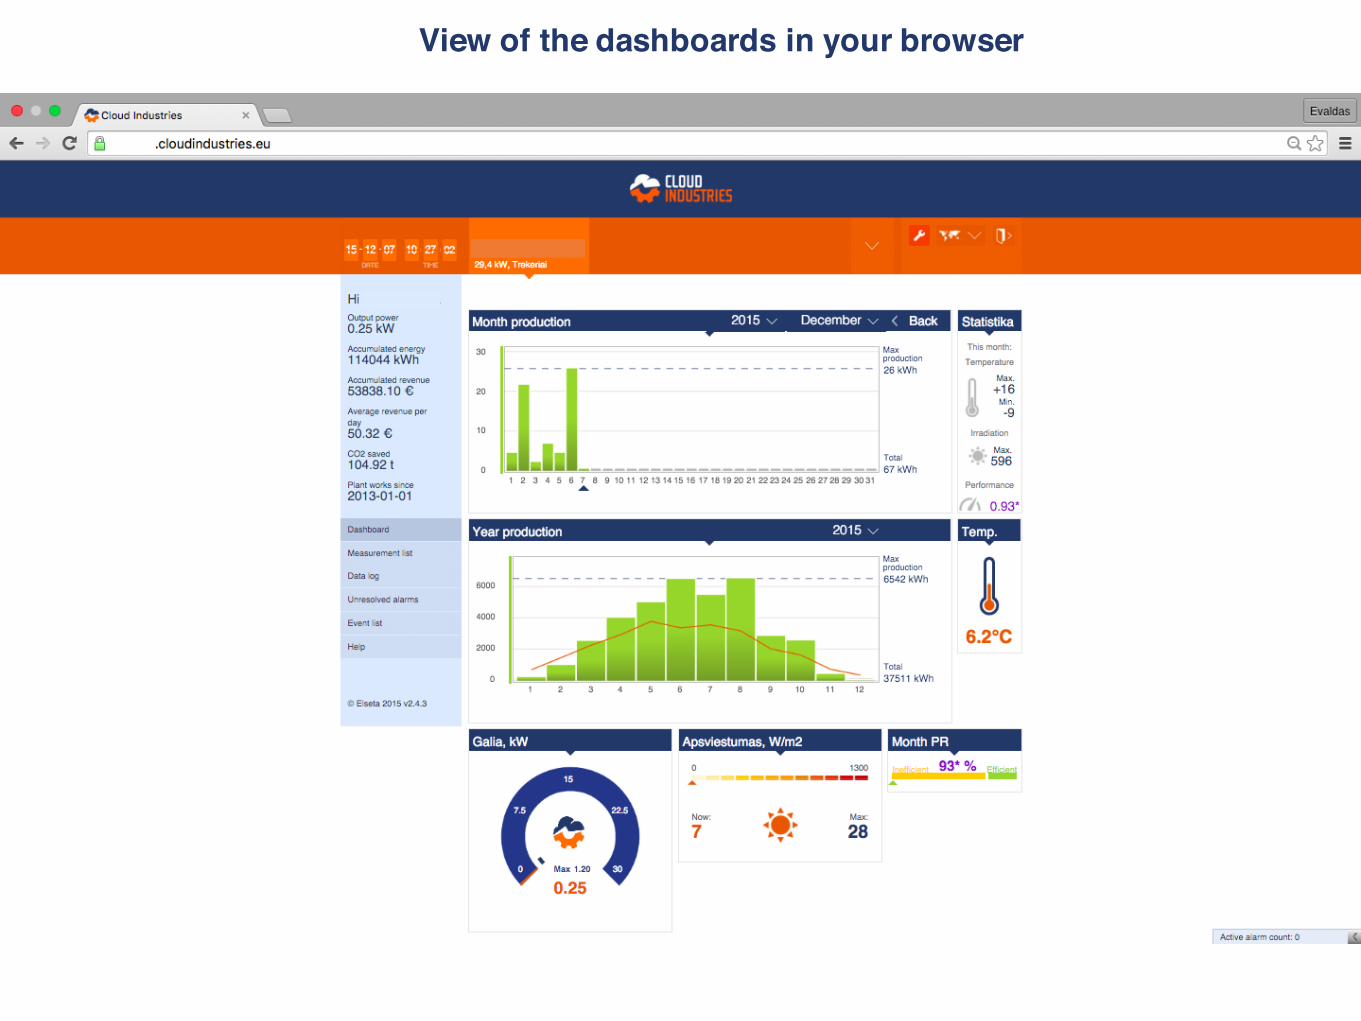
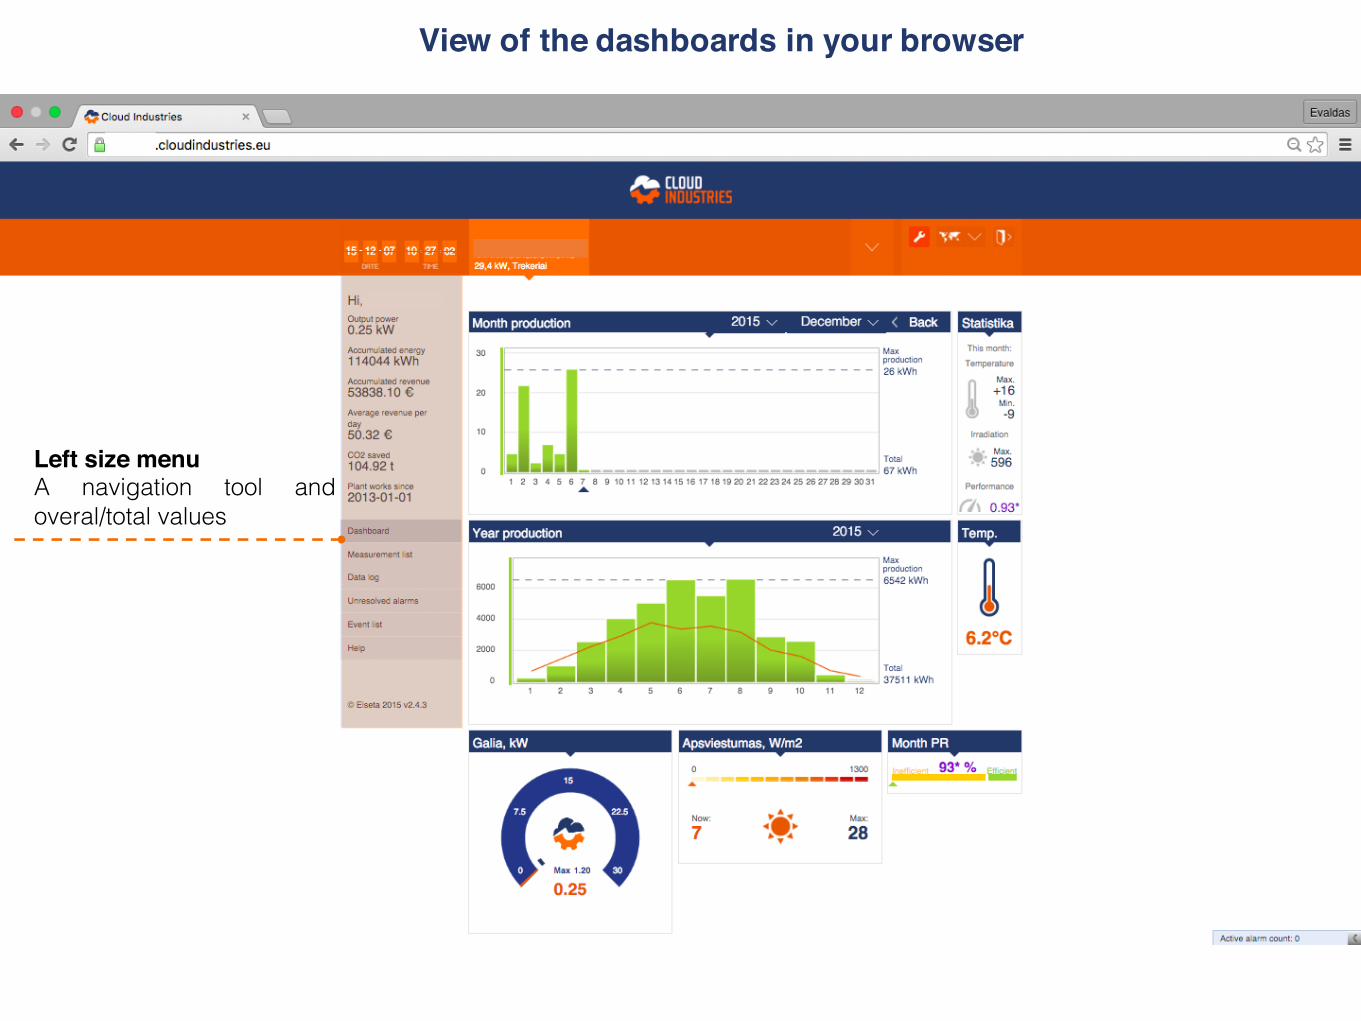
View of the dashboards in your browser
View of the dashboards in your browser
Left size menuA navigation tool andoveral/total values

Top menuDrop down menu fornavigation through yourprojects.
View of the dashboards in your browser

View of the dashboards in your browser
DashboardsIn the middle of the browserthe main dashboard islocated.
Graphs and other widgetsare customizable by a user.
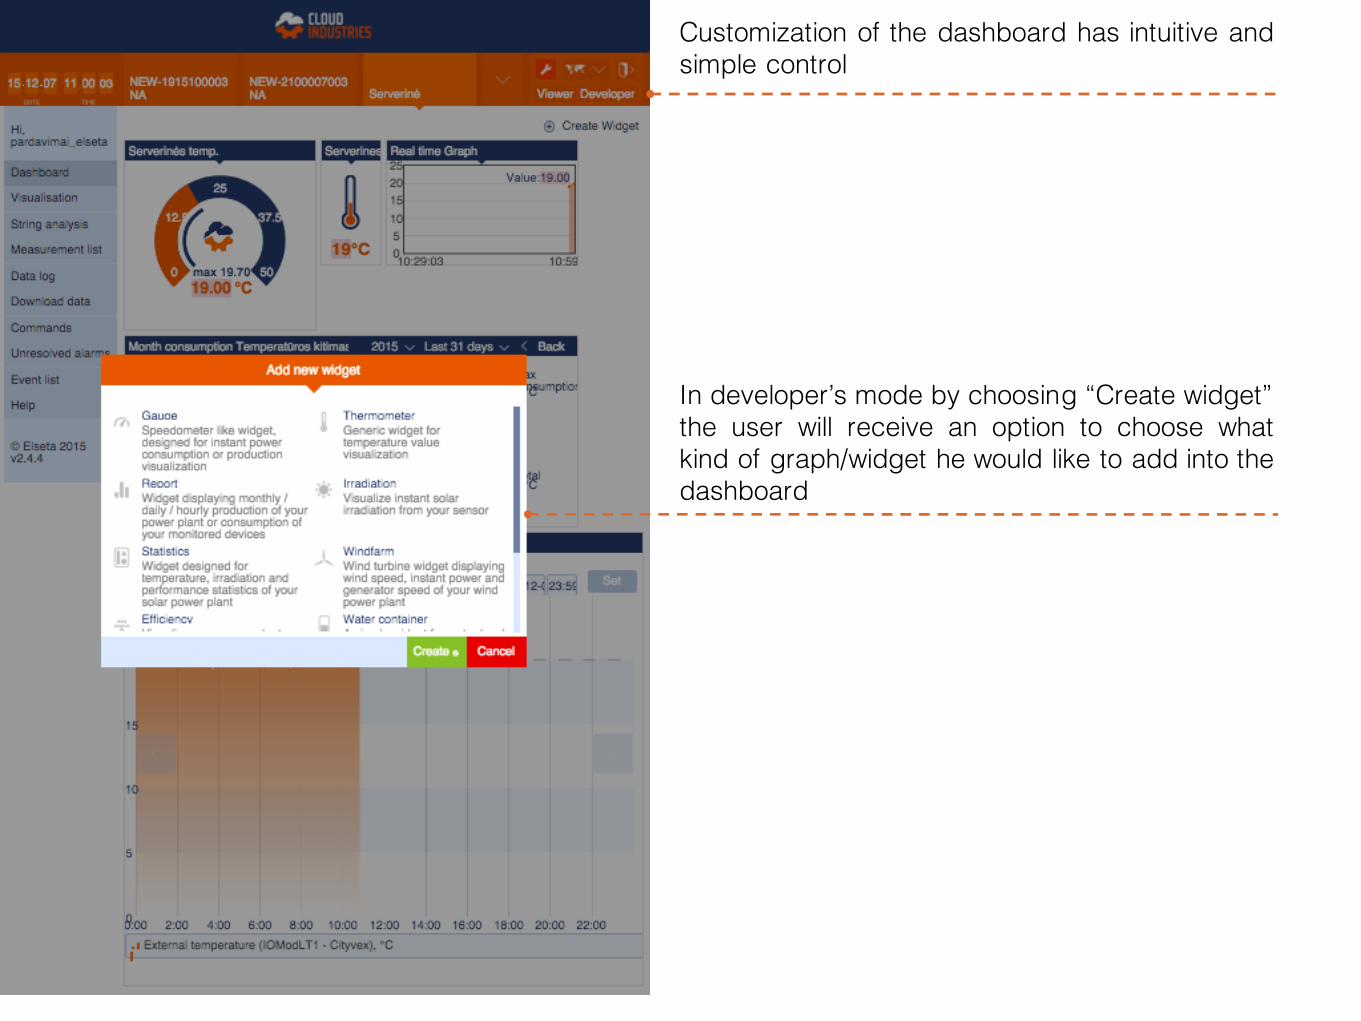
Customization of the dashboard has intuitive andsimple control
In developer’s mode by choosing “Create widget”the user will receive an option to choose whatkind of graph/widget he would like to add into thedashboard
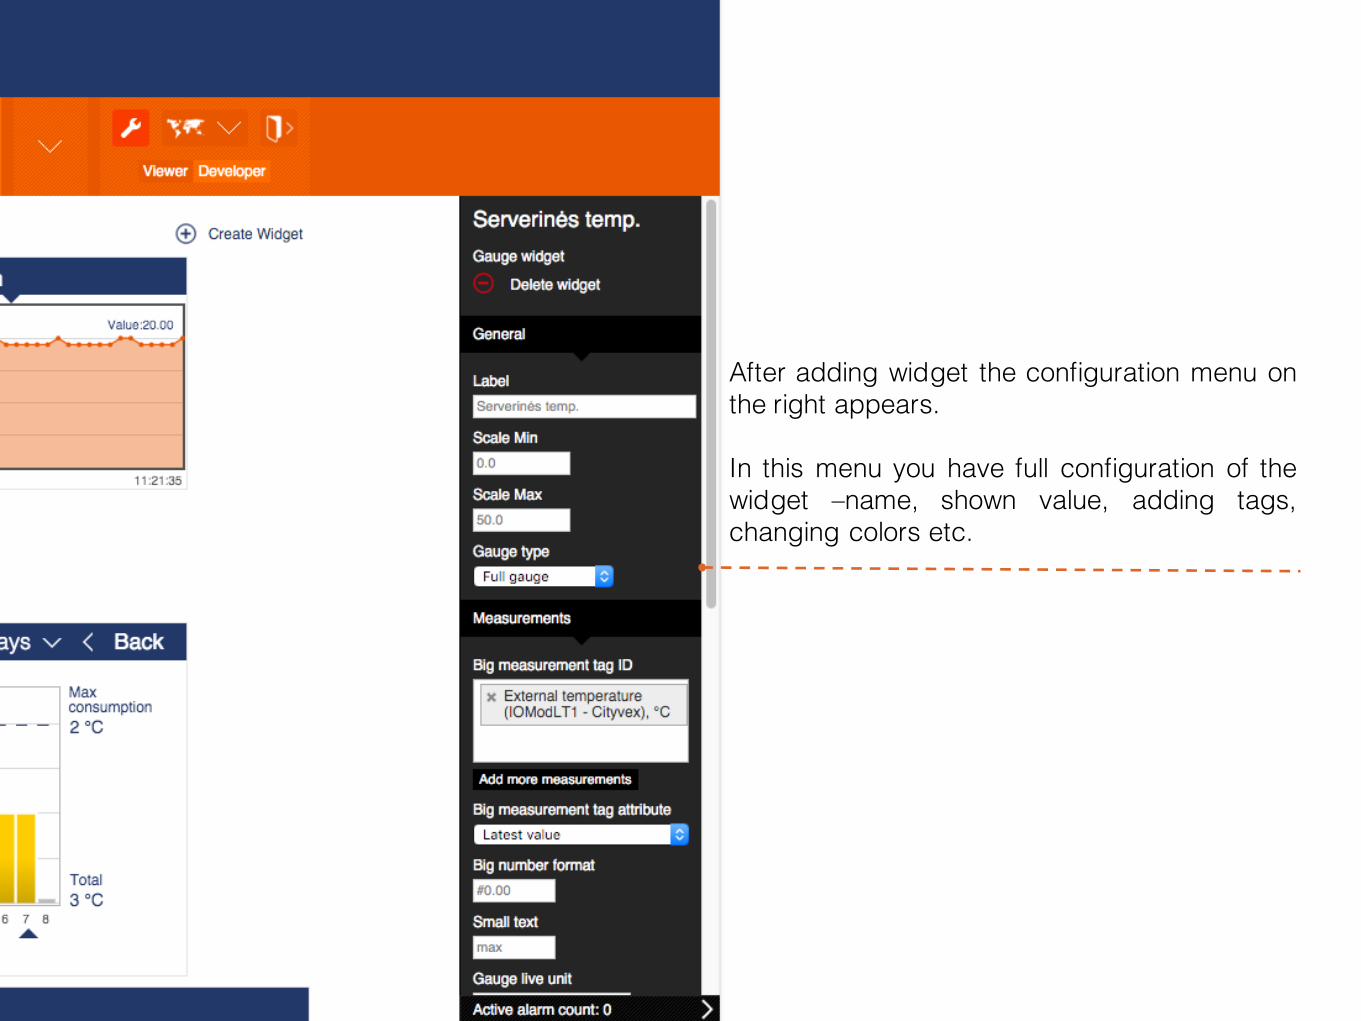
After adding widget the configuration menu onthe right appears.
In this menu you have full configuration of thewidget –name, shown value, adding tags,changing colors etc.
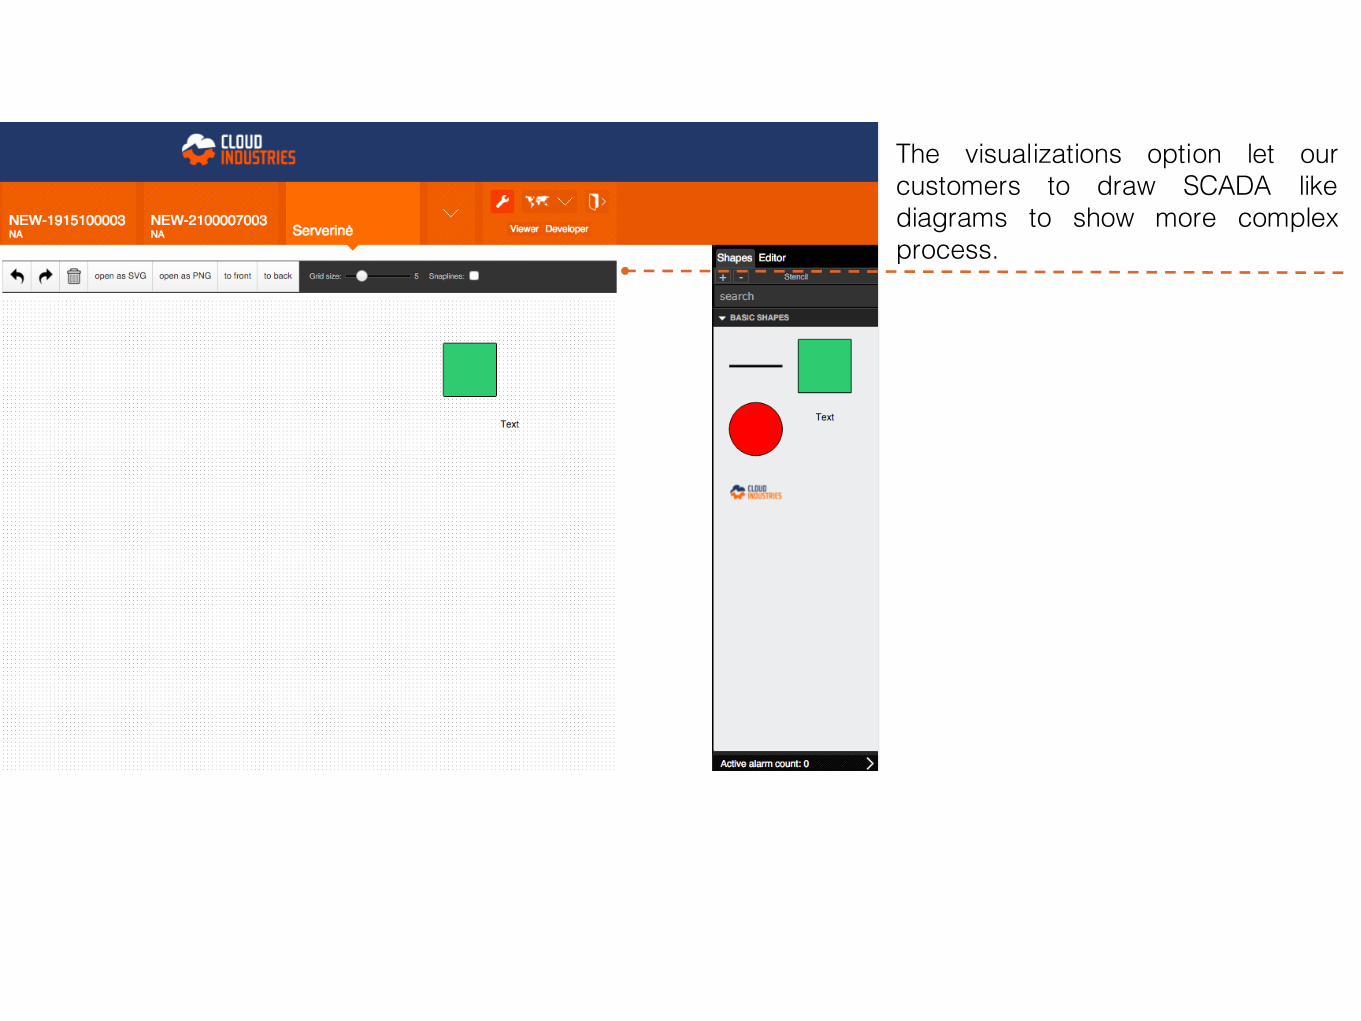
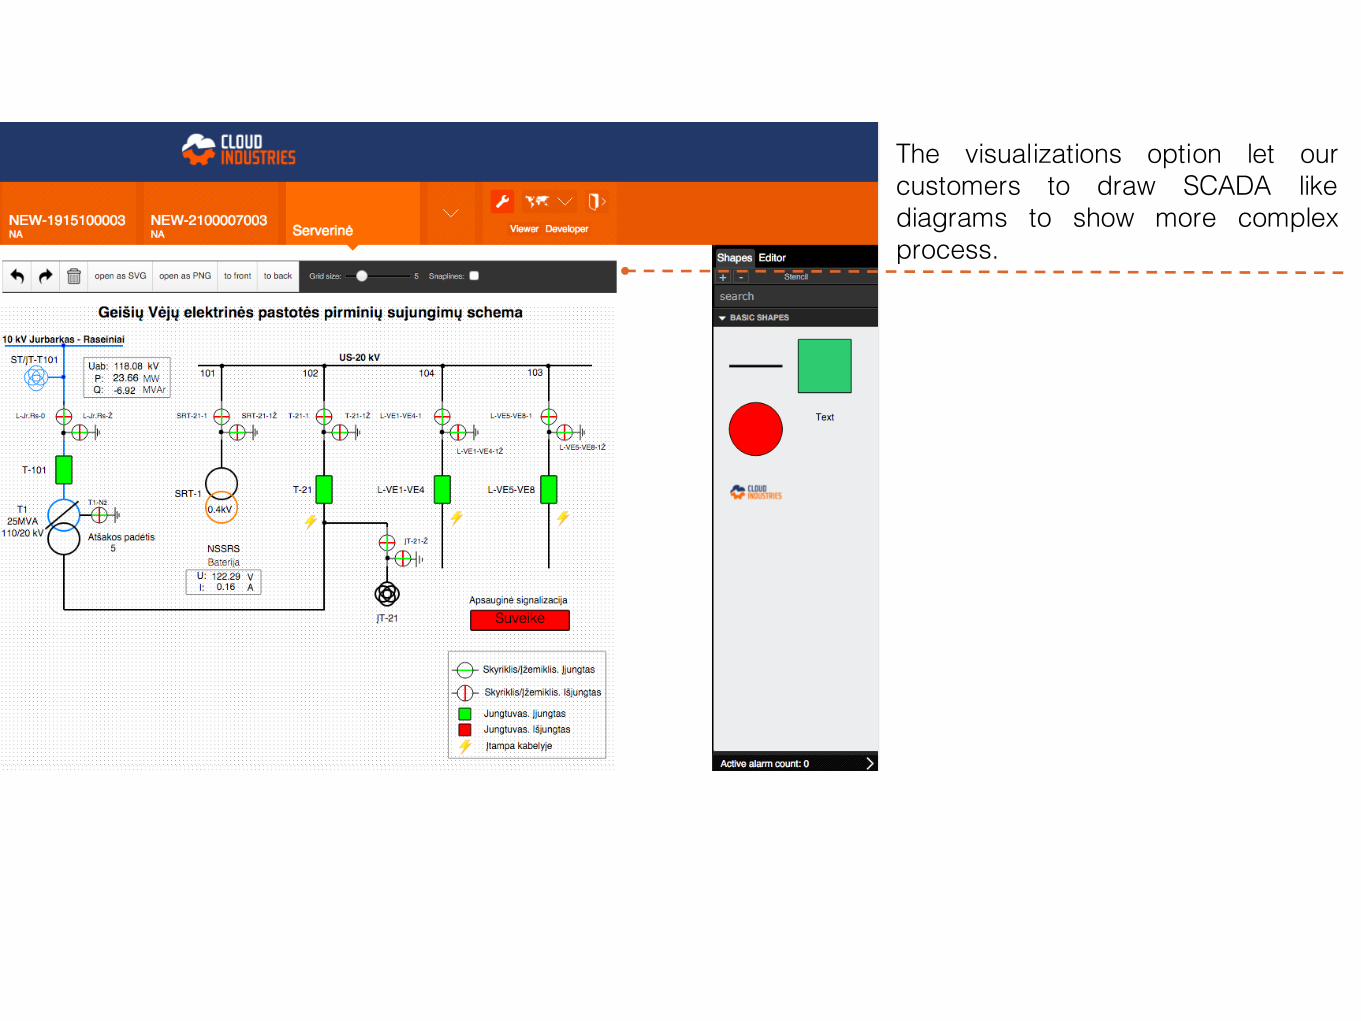
The visualizations option let ourcustomers to draw SCADA likediagrams to show more complexprocess.
The visualizations option let ourcustomers to draw SCADA likediagrams to show more complexprocess.

AGENDA:
ABOUT USCLOUDINDUSTRIES.EUDASBOARDSAPPLICATIONS
CLOUDINDUSTRIES.EU
ALL RENEWABLES IN ONE PLATFORM
ENERGY EFFICIENCY
ODMORIGINAL DESIGN MANUFACTURING
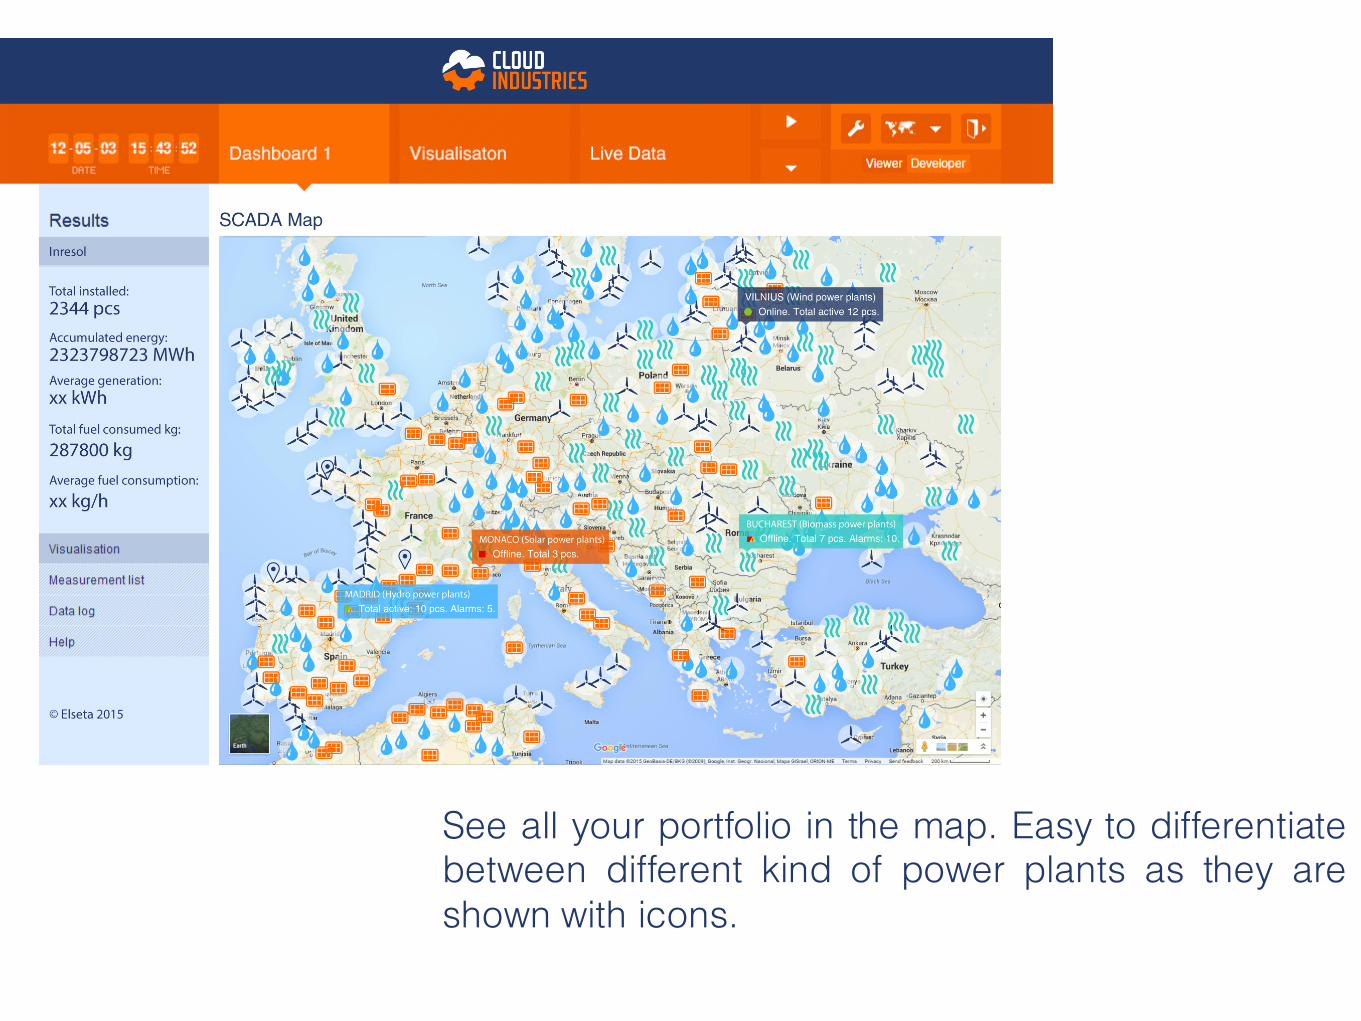
See all your portfolio in the map. Easy to differentiatebetween different kind of power plants as they areshown with icons.
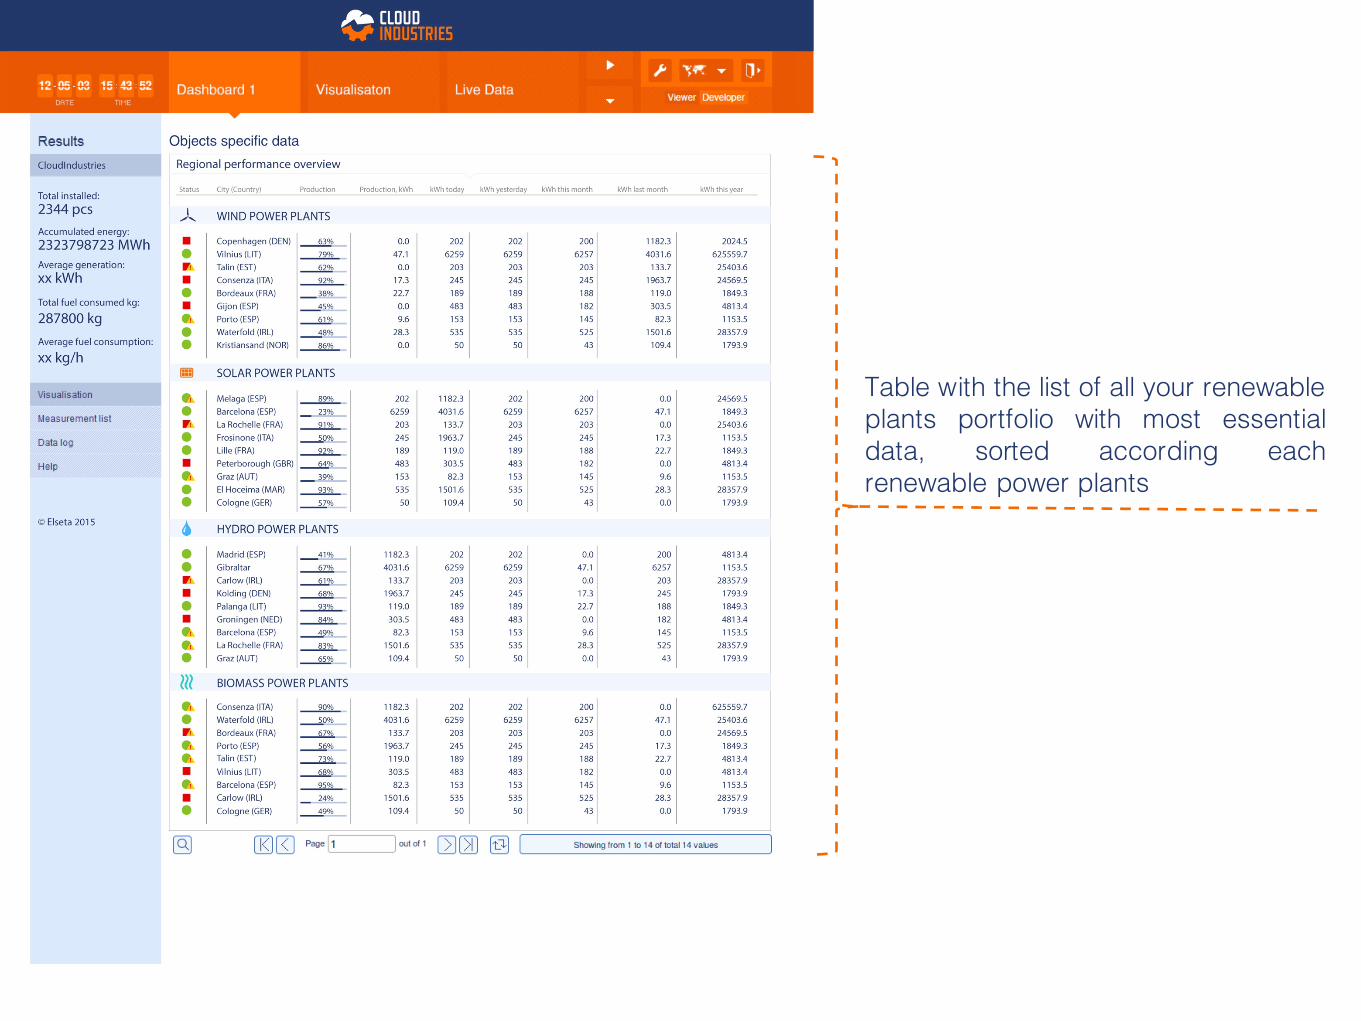
Table with the list of all your renewableplants portfolio with most essentialdata, sorted according eachrenewable power plants
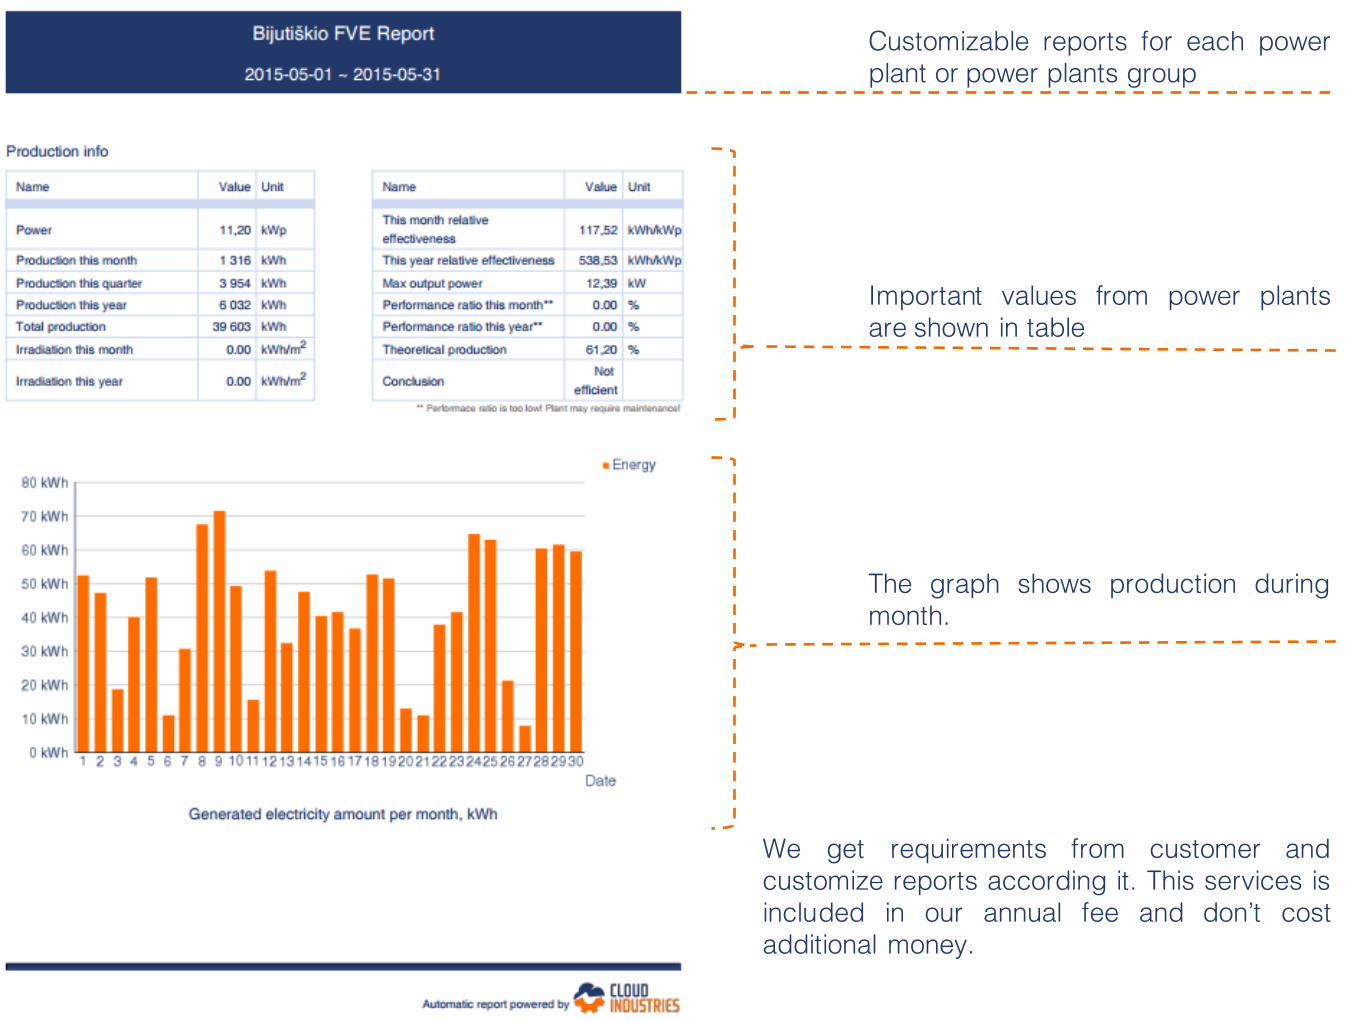
Customizable reports for each powerplant or power plants group
Important values from power plantsare shown in table
The graph shows production duringmonth.
We get requirements from customer andcustomize reports according it. This services isincluded in our annual fee and don’t costadditional money.
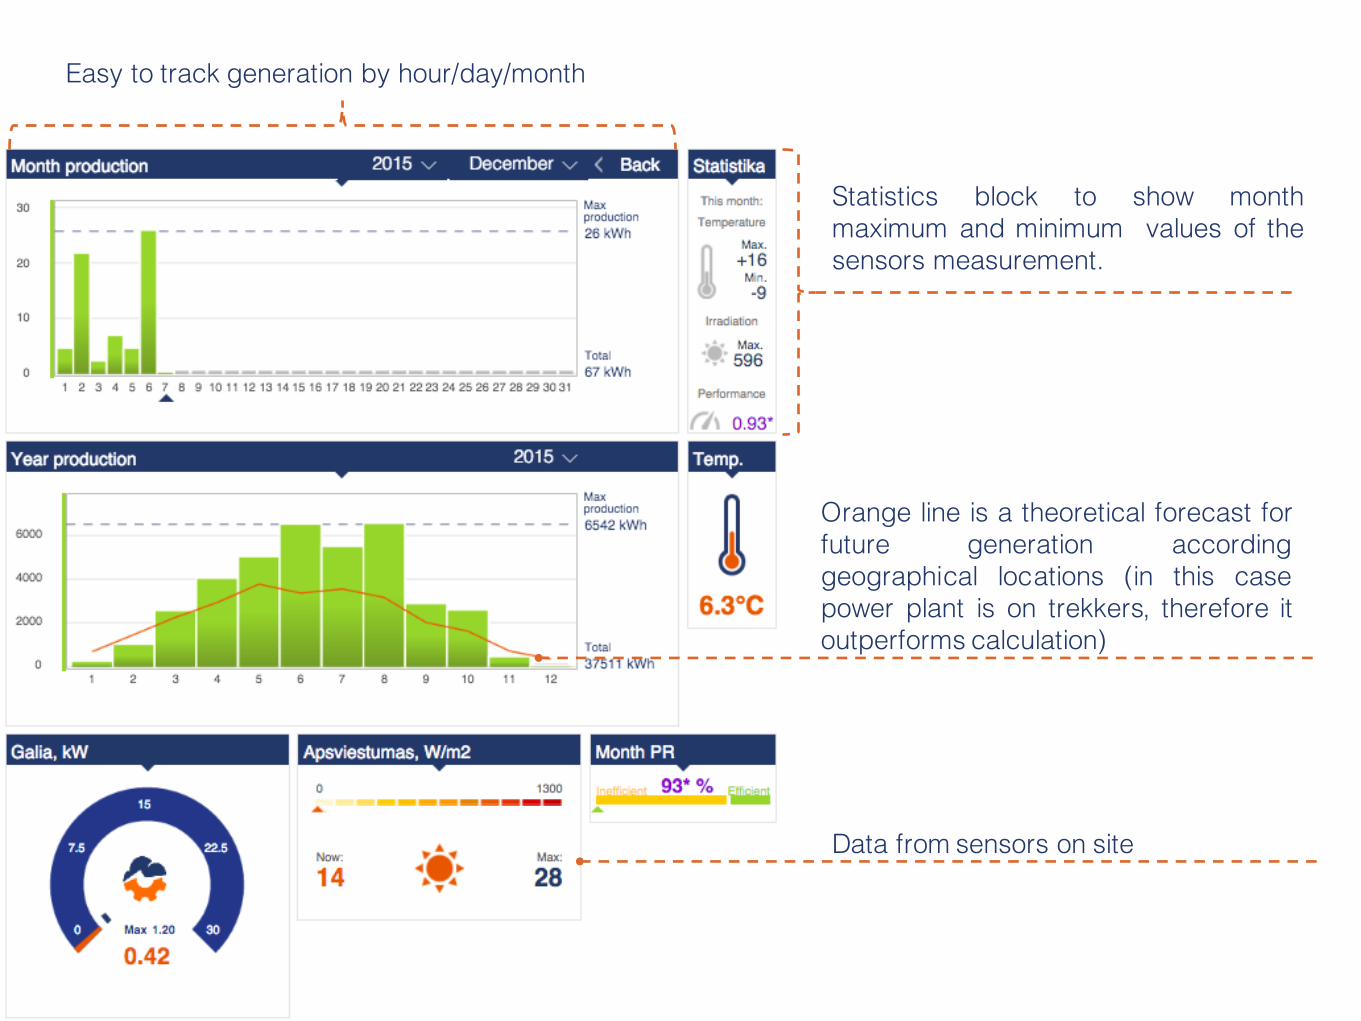
Statistics block to show monthmaximum and minimum values of thesensors measurement.
Orange line is a theoretical forecast forfuture generation accordinggeographical locations (in this casepower plant is on trekkers, therefore itoutperforms calculation)
Data from sensors on site
Easy to track generation by hour/day/month
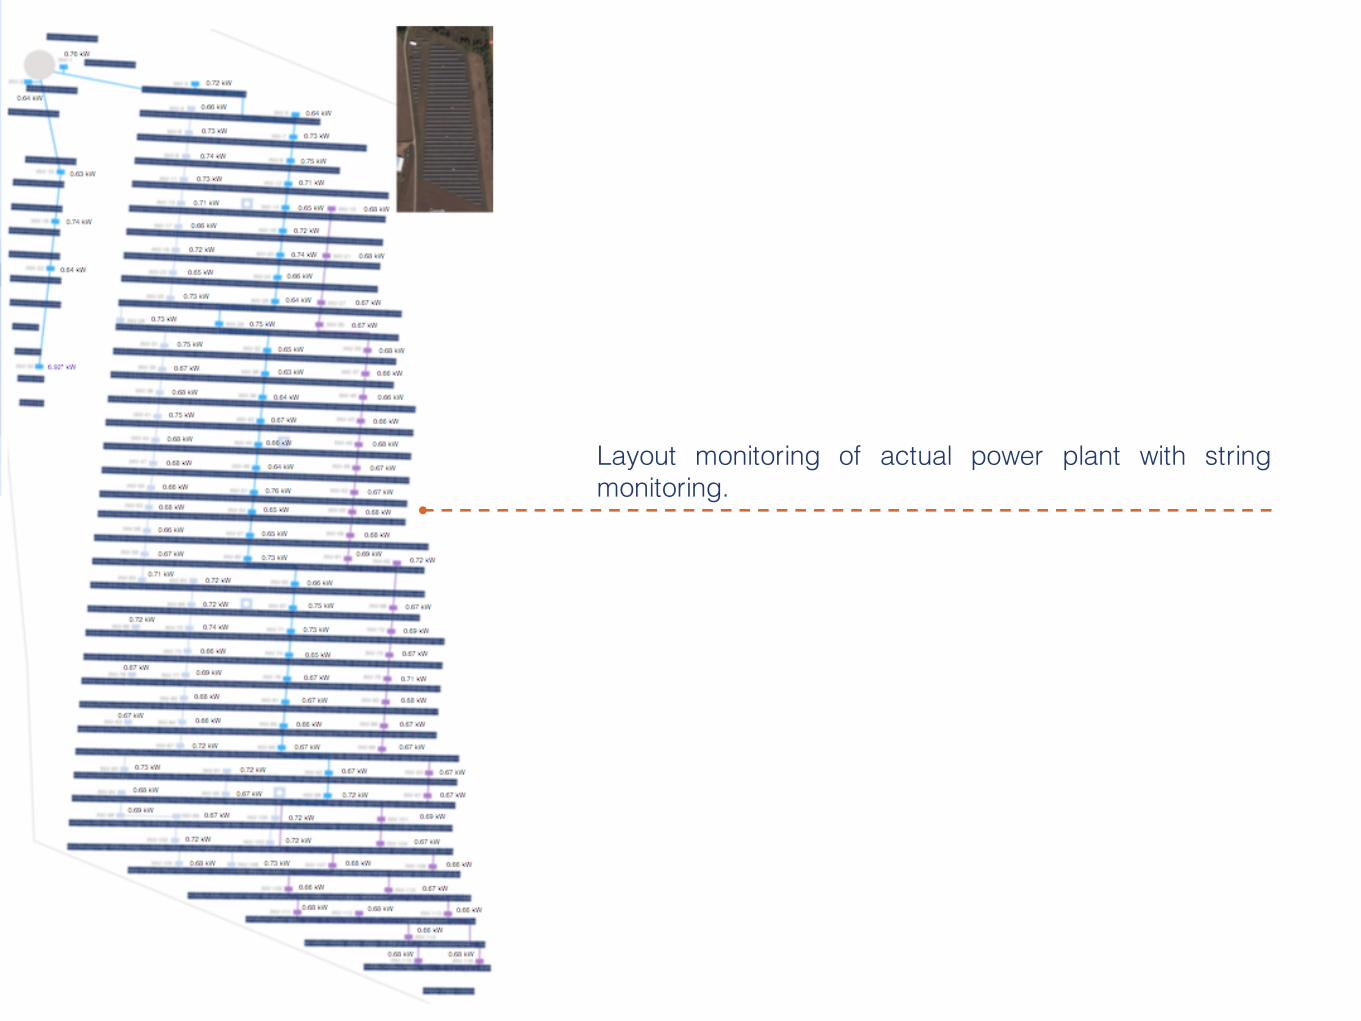
Layout monitoring of actual power plant with stringmonitoring.
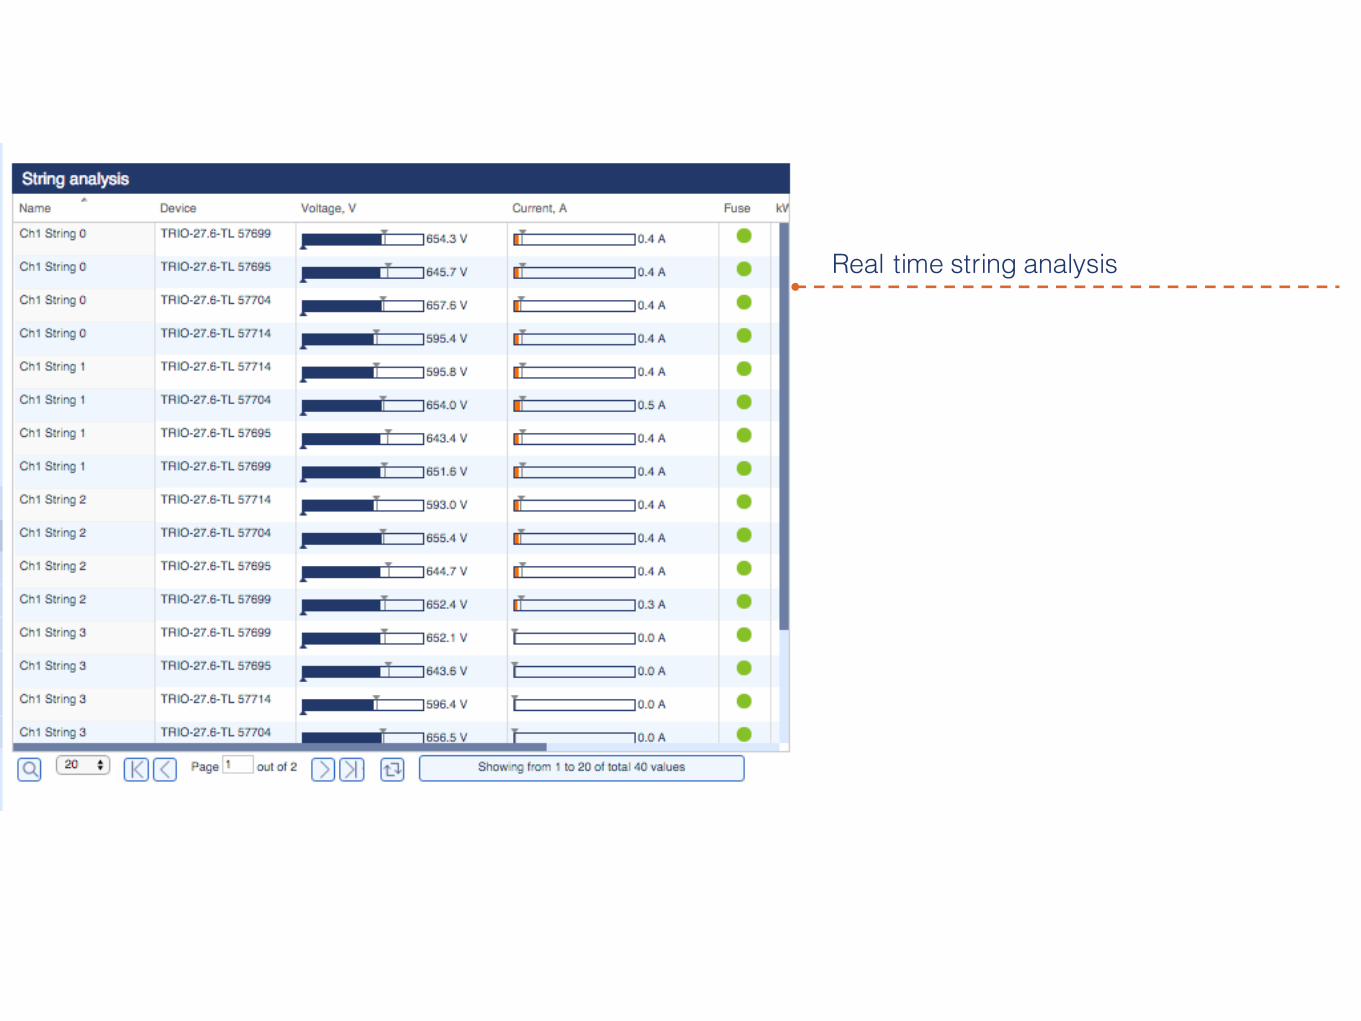
Real time string analysis
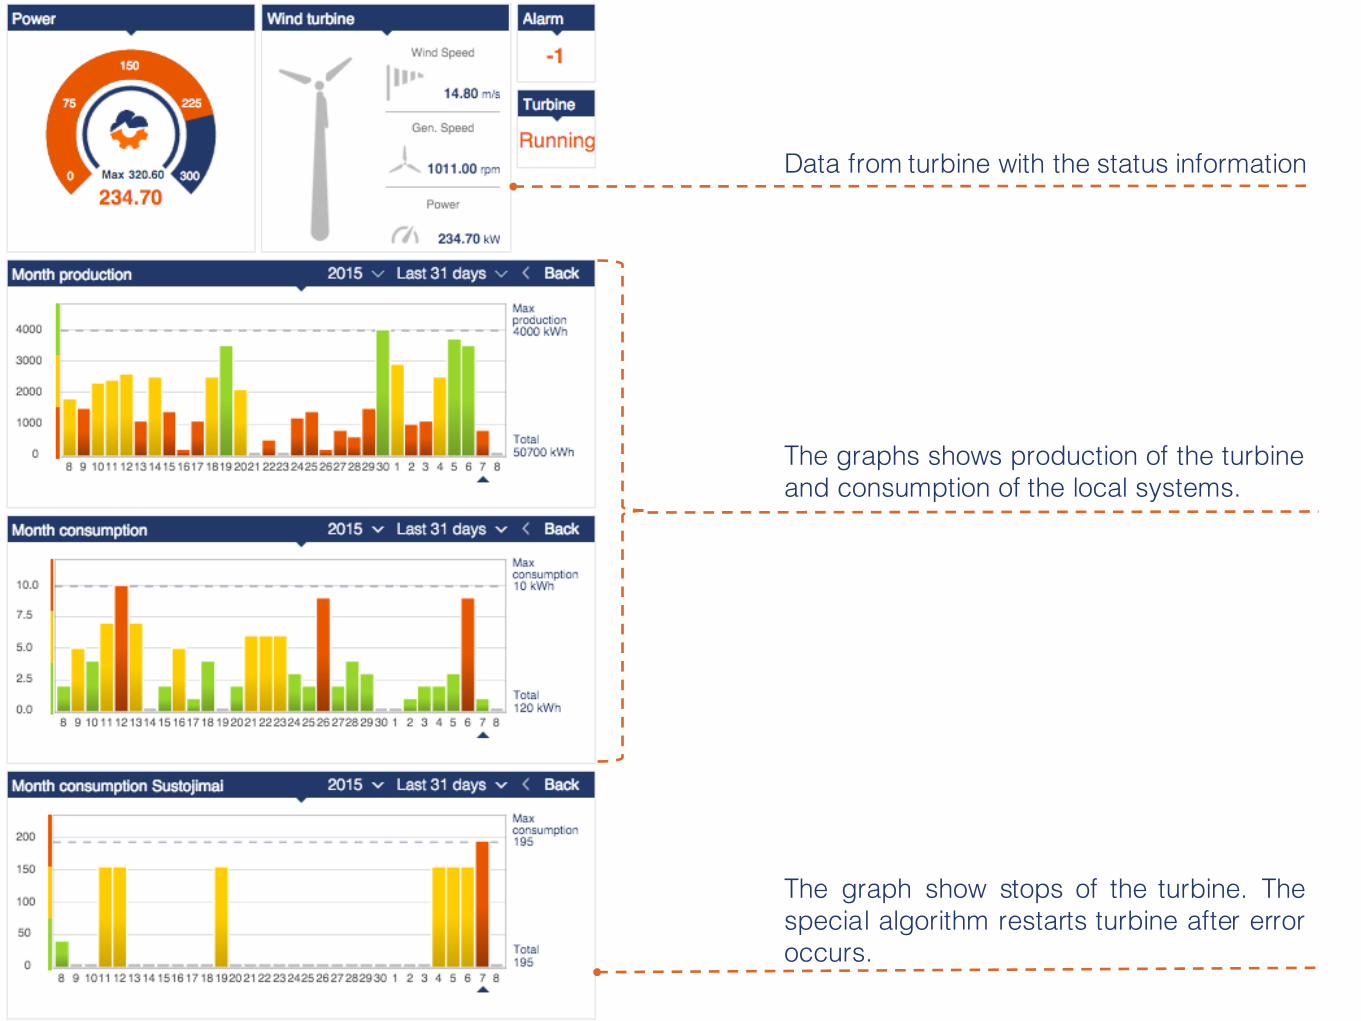
Data from turbine with the status information
The graphs shows production of the turbineand consumption of the local systems.
The graph show stops of the turbine. Thespecial algorithm restarts turbine after erroroccurs.
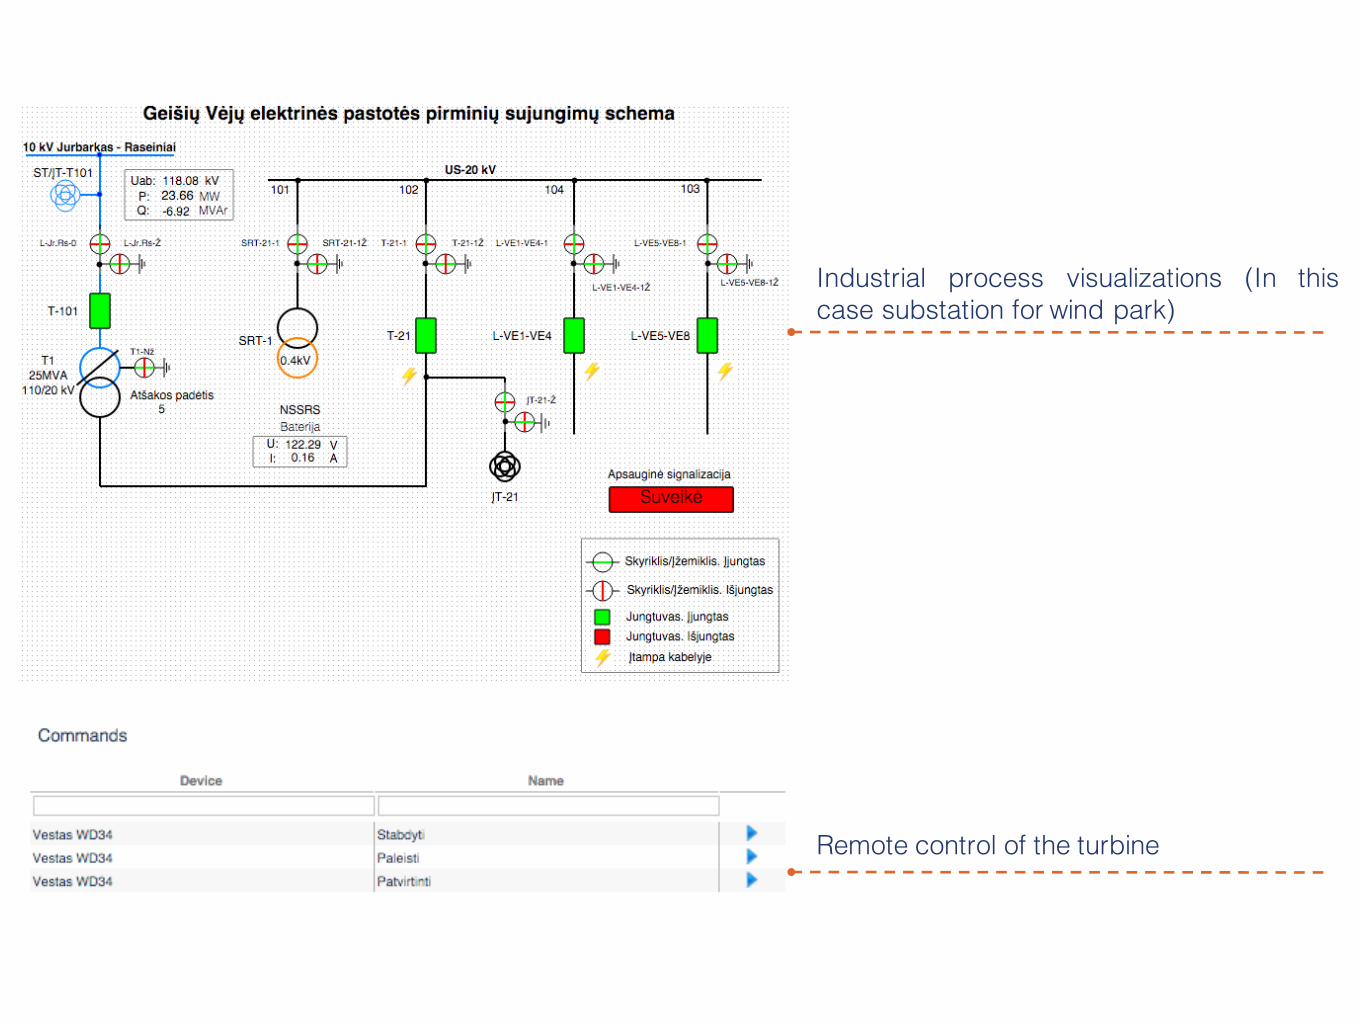
Industrial process visualizations (In thiscase substation for wind park)
Remote control of the turbine
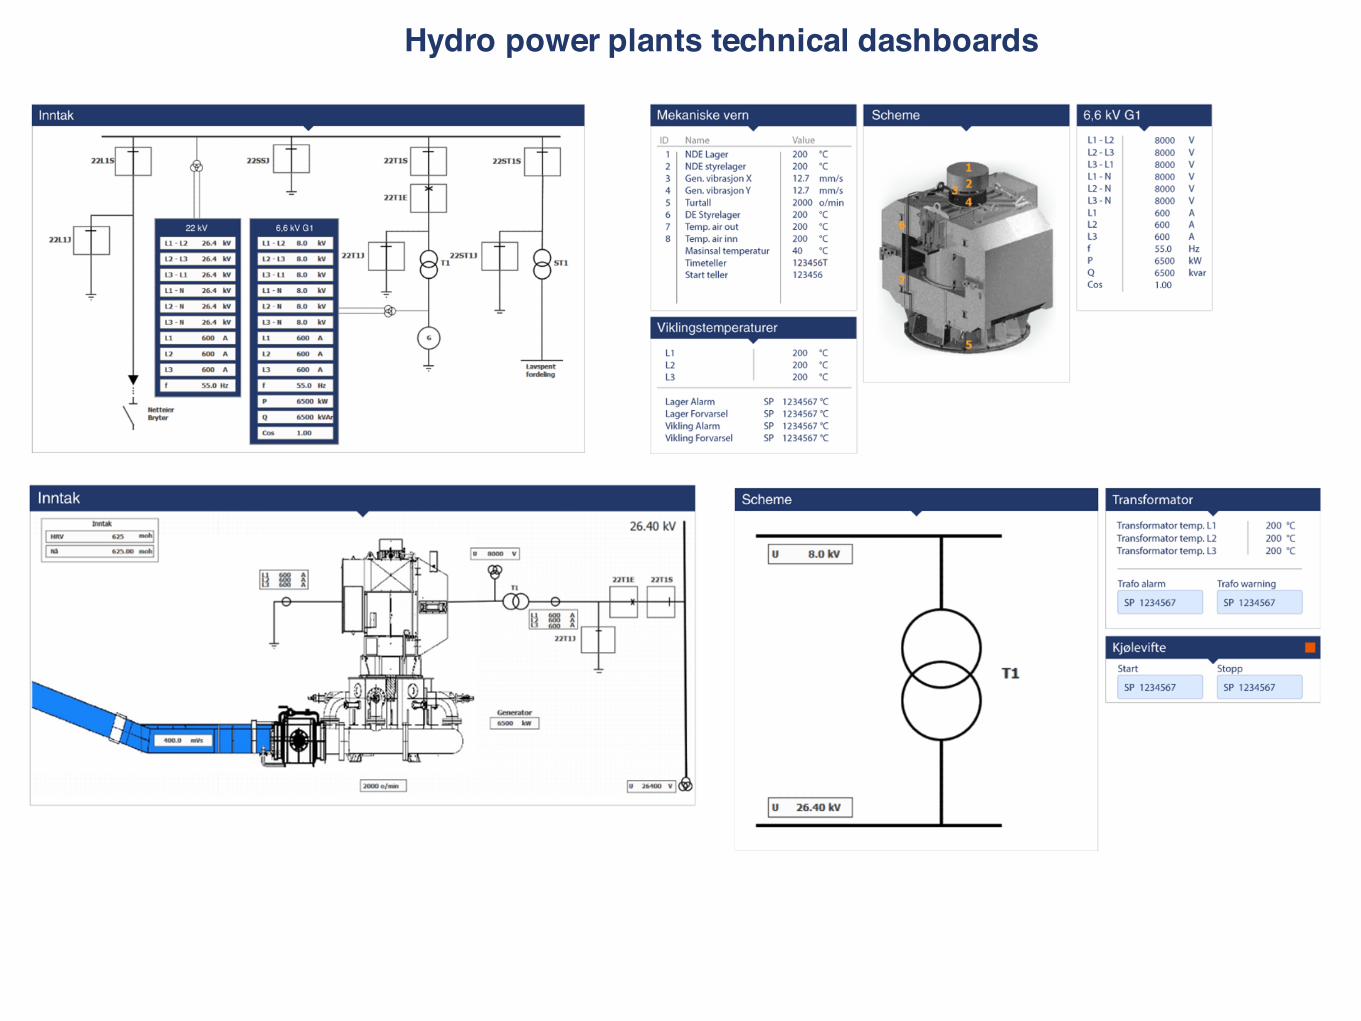
Hydro power plants technical dashboards
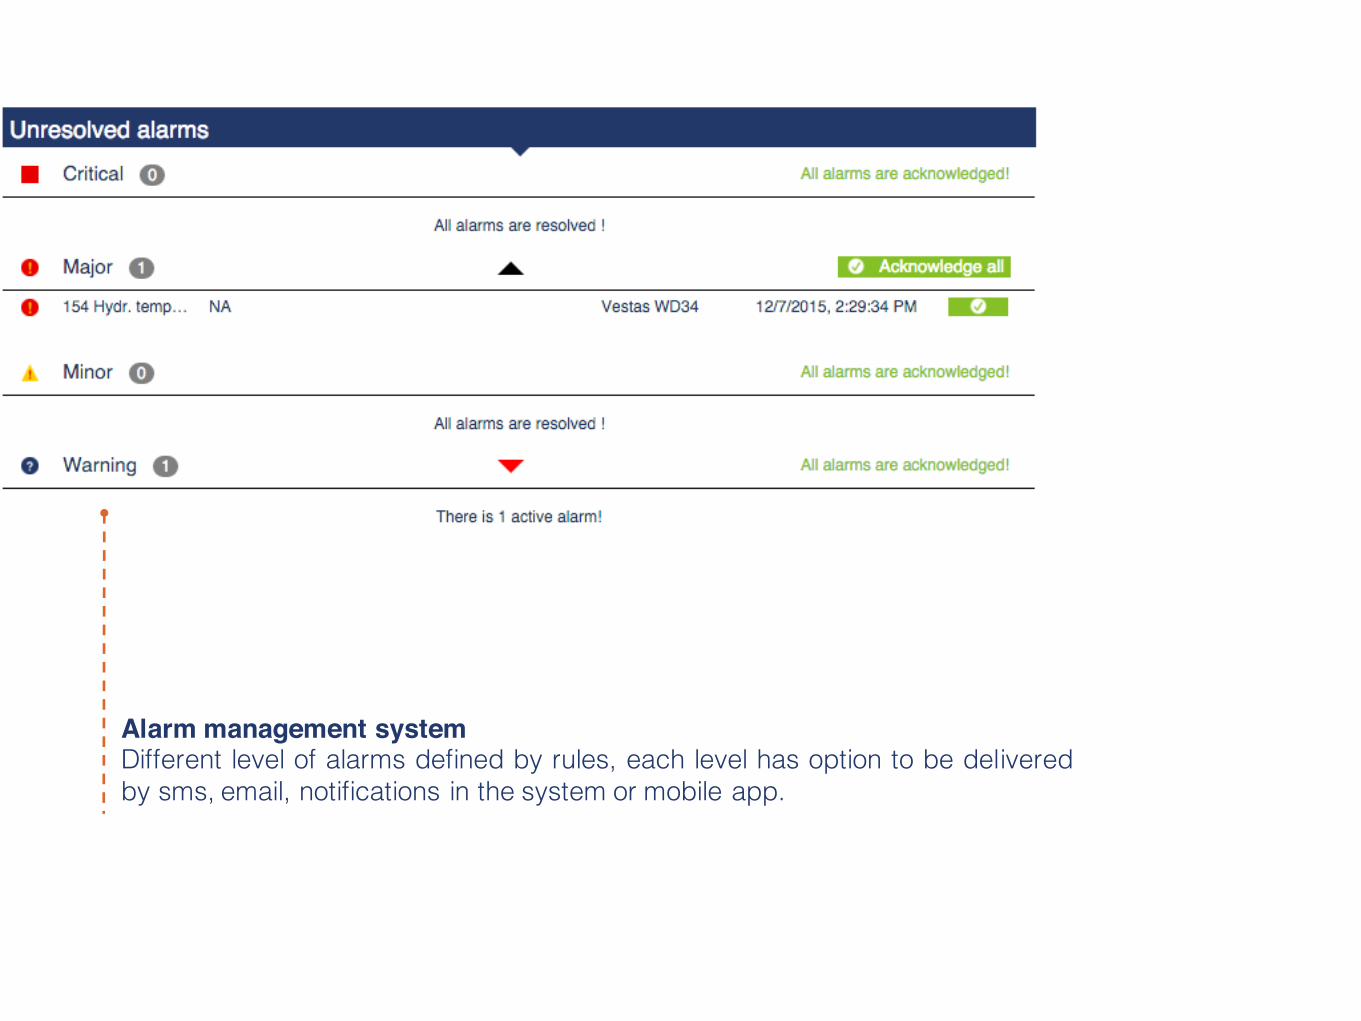
Alarm management systemDifferent level of alarms defined by rules, each level has option to be deliveredby sms, email, notifications in the system or mobile app.
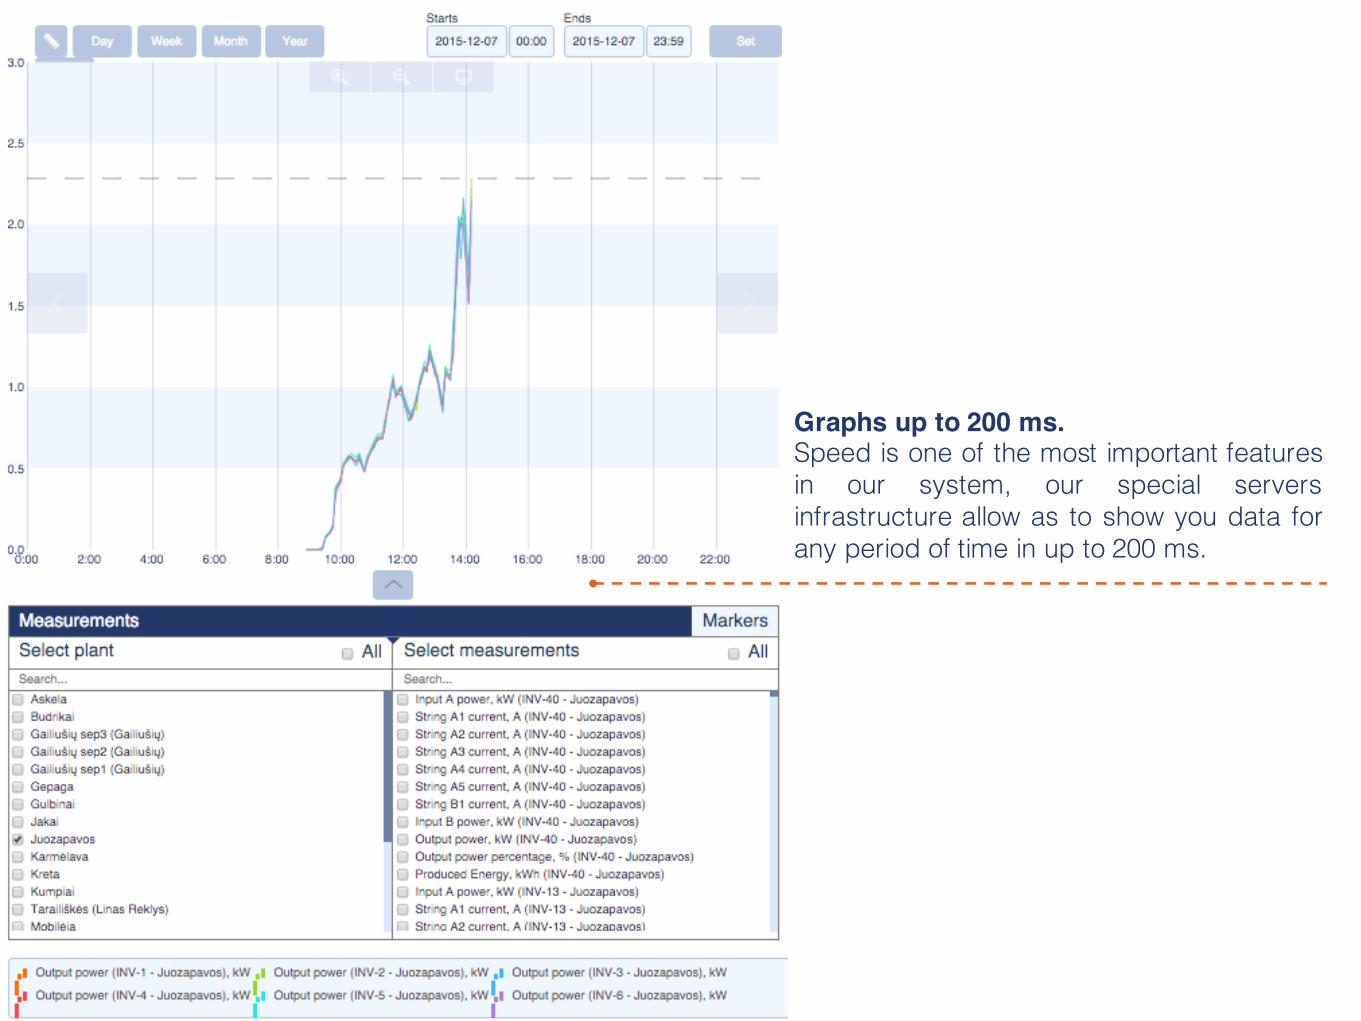
Graphs up to 200 ms.Speed is one of the most important featuresin our system, our special serversinfrastructure allow as to show you data forany period of time in up to 200 ms.

IP video stream from site

CLOUDINDUSTRIES.EU
ALL RENEWABLES IN ONE PLATFORM
ENERGY EFFICIENCY
ODMORIGINAL DESIGN MANUFACTURING
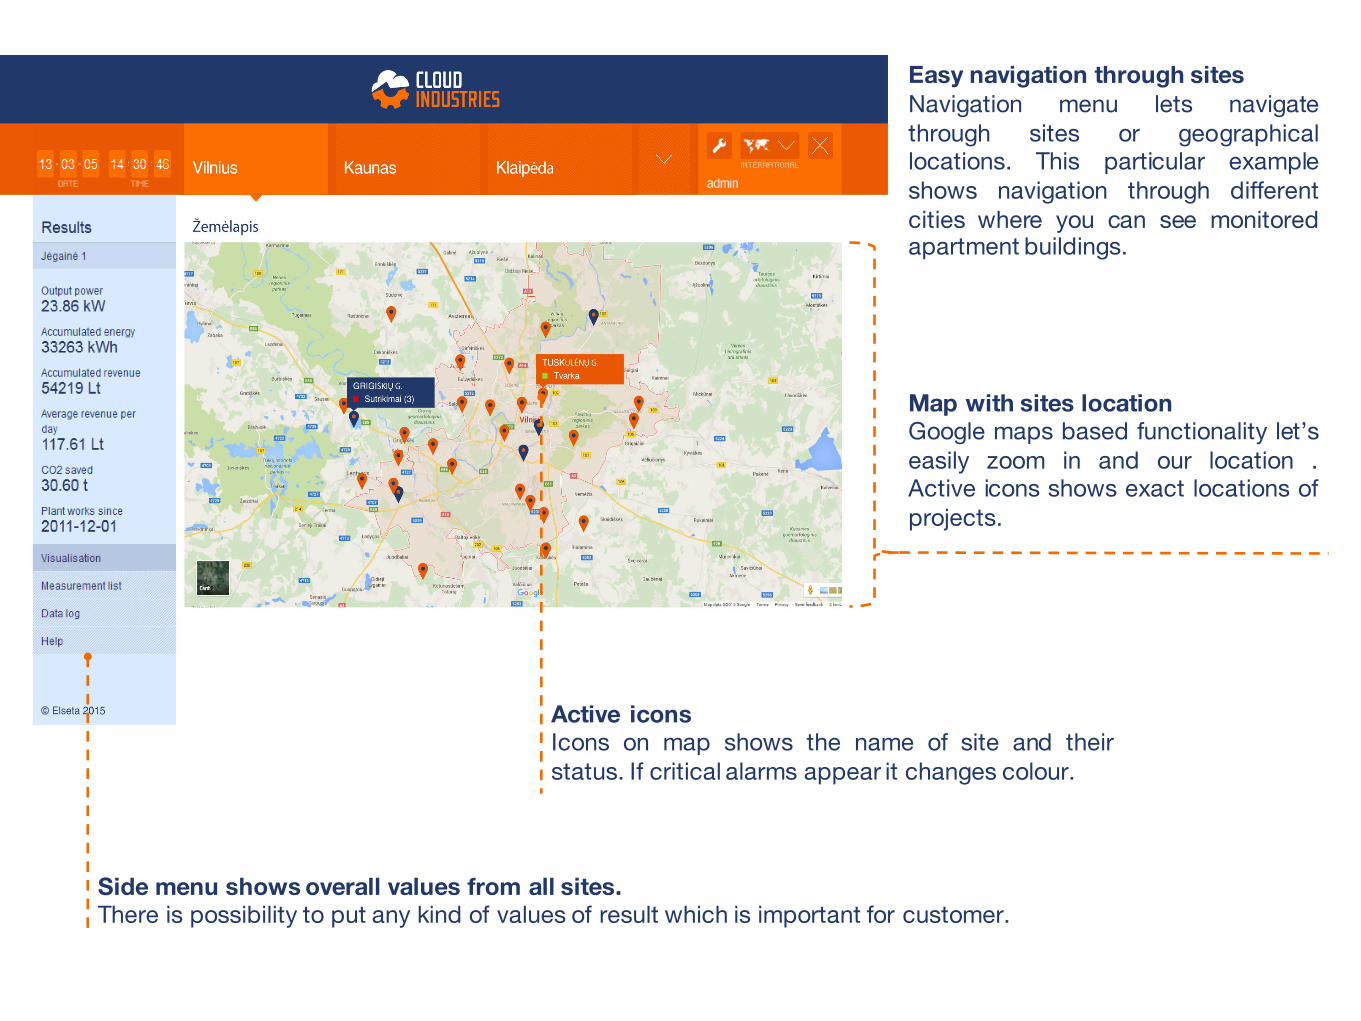
Easy navigation through sitesNavigation menu lets navigatethrough sites or geographicallocations. This particular exampleshows navigation through differentcities where you can see monitoredapartment buildings.
Map with sites locationGoogle maps based functionality let’seasily zoom in and our location .Active icons shows exact locations ofprojects.
Active iconsIcons on map shows the name of site and theirstatus. If critical alarms appear it changes colour.
Side menu shows overall values from all sites. There is possibility to put any kind of values of result which is important for customer.

Overview of the apartment buildingDashboard shows you a number of floors and flats in each floor.Each block give you information about flat usage of electricity, hot/cold water,gas etc. If the number of household members is known there is calculation ofhow much energy is used per person.
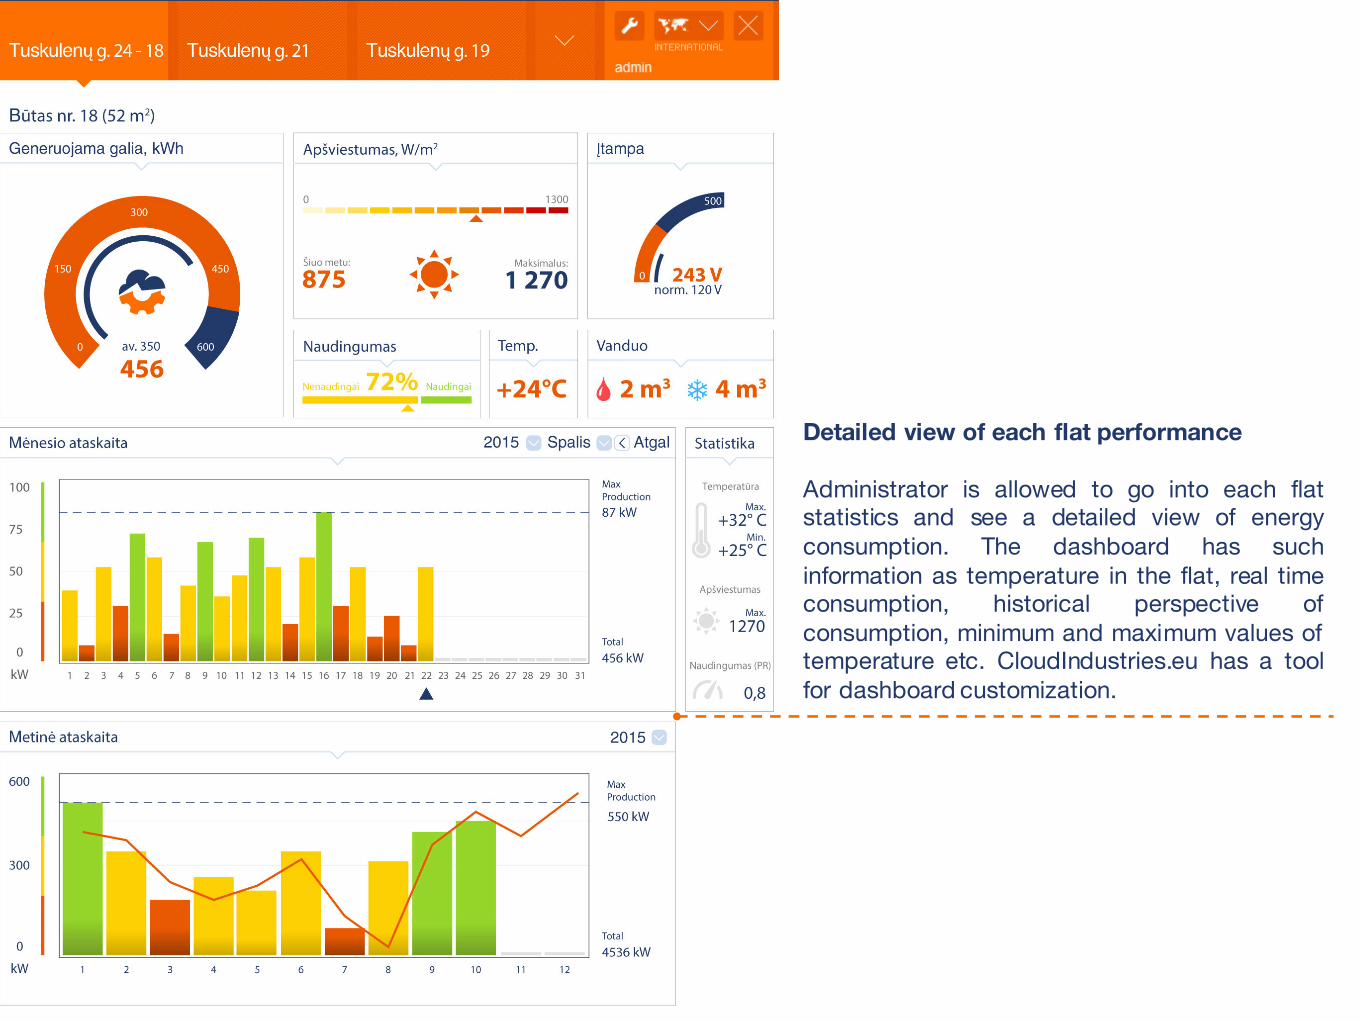
Detailed view of each flat performance
Administrator is allowed to go into each flatstatistics and see a detailed view of energyconsumption. The dashboard has suchinformation as temperature in the flat, real timeconsumption, historical perspective ofconsumption, minimum and maximum values oftemperature etc. CloudIndustries.eu has a toolfor dashboard customization.

Graphs up to 200 ms.Analyze data of the meters and othersensors. According data you could decidesaving policies and recommendations.
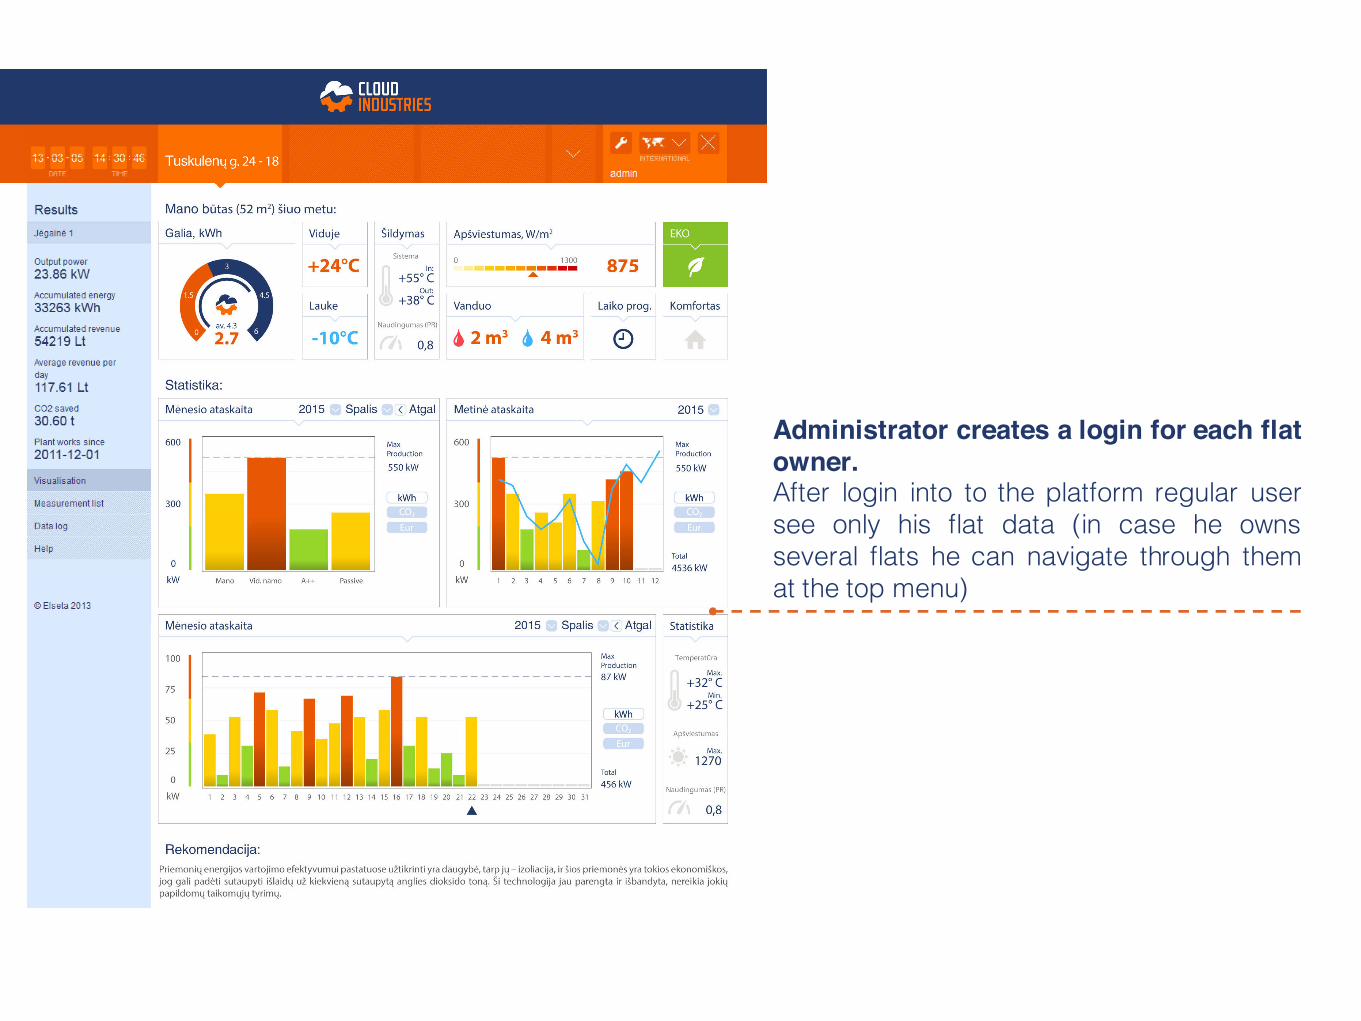
Administrator creates a login for each flatowner.After login into to the platform regular usersee only his flat data (in case he ownsseveral flats he can navigate through themat the top menu)
Switch between economy and comfort modes
SchedulingTime programming when to switch between modes
RecommendationsPlatform is capable to do benchmarking between apartmentbuilding or flats and send message fore ach owner how wellthey are doing.
In case customers have algorithms, they can be implementedand automatically generated recommendations will appear.
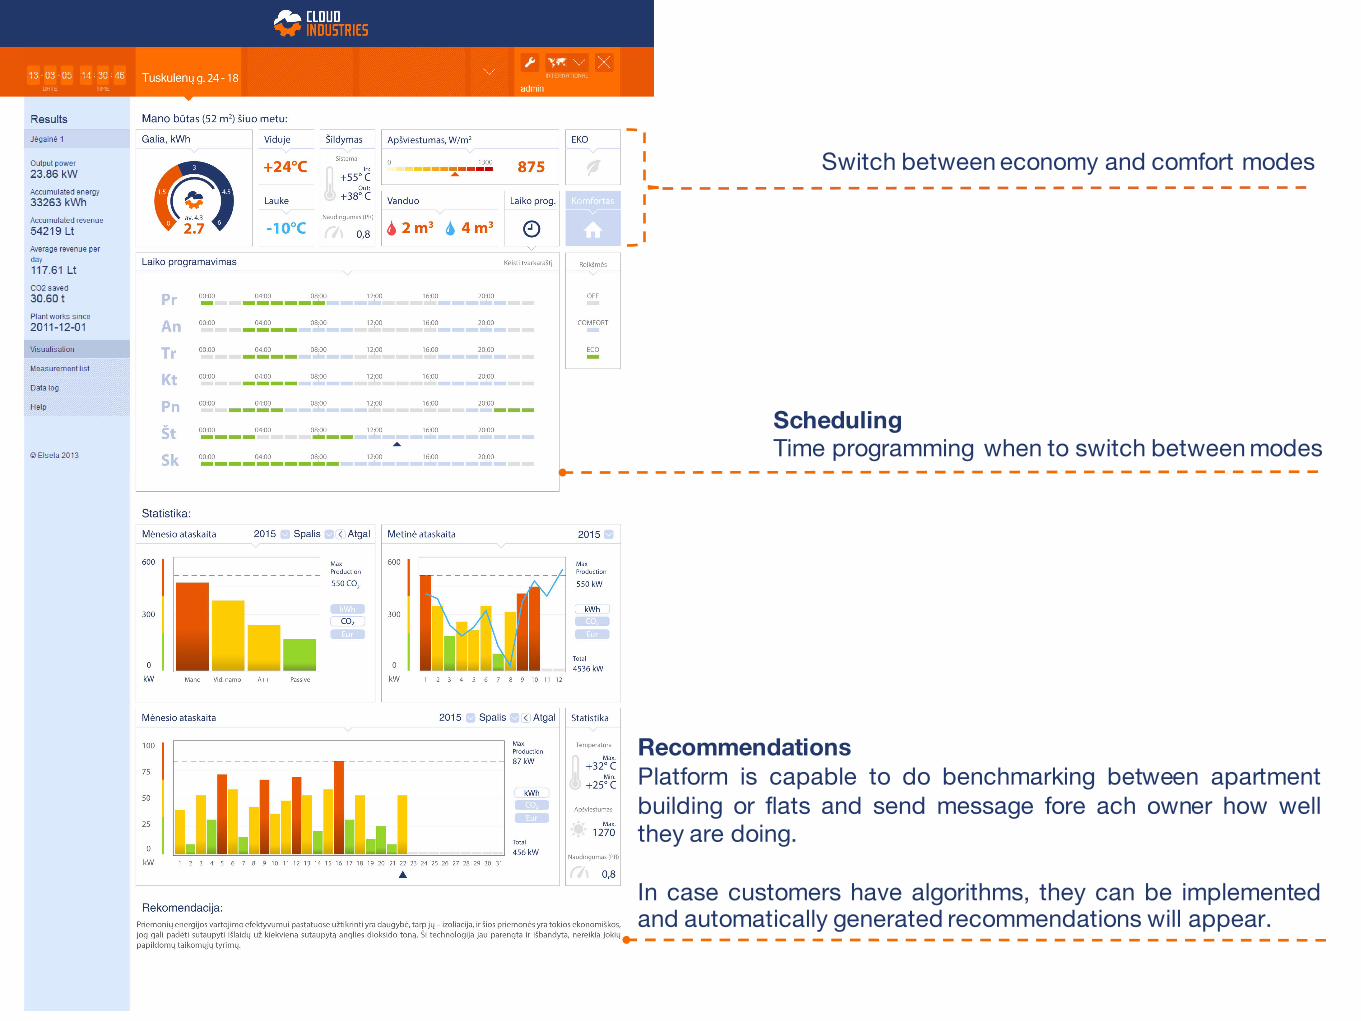
Automatically generated reports and bills

Add visualisations of building systems
CLOUDINDUSTRIES.EU
ALL RENEWABLES IN ONE PLATFORM
ENERGY EFFICIENCY
ODMORIGINAL DESIGN MANUFACTURING

ODM - ORIGINAL DESIGN MANUFACTURING
CloudIndustries.eu team works as consultants
We will develop a monitoring solution for yourhardware solutions
Our team have experience not only onprogramming but in embedded electronics anddesign as well
Full branding - the monitoring system will be likeyour product.
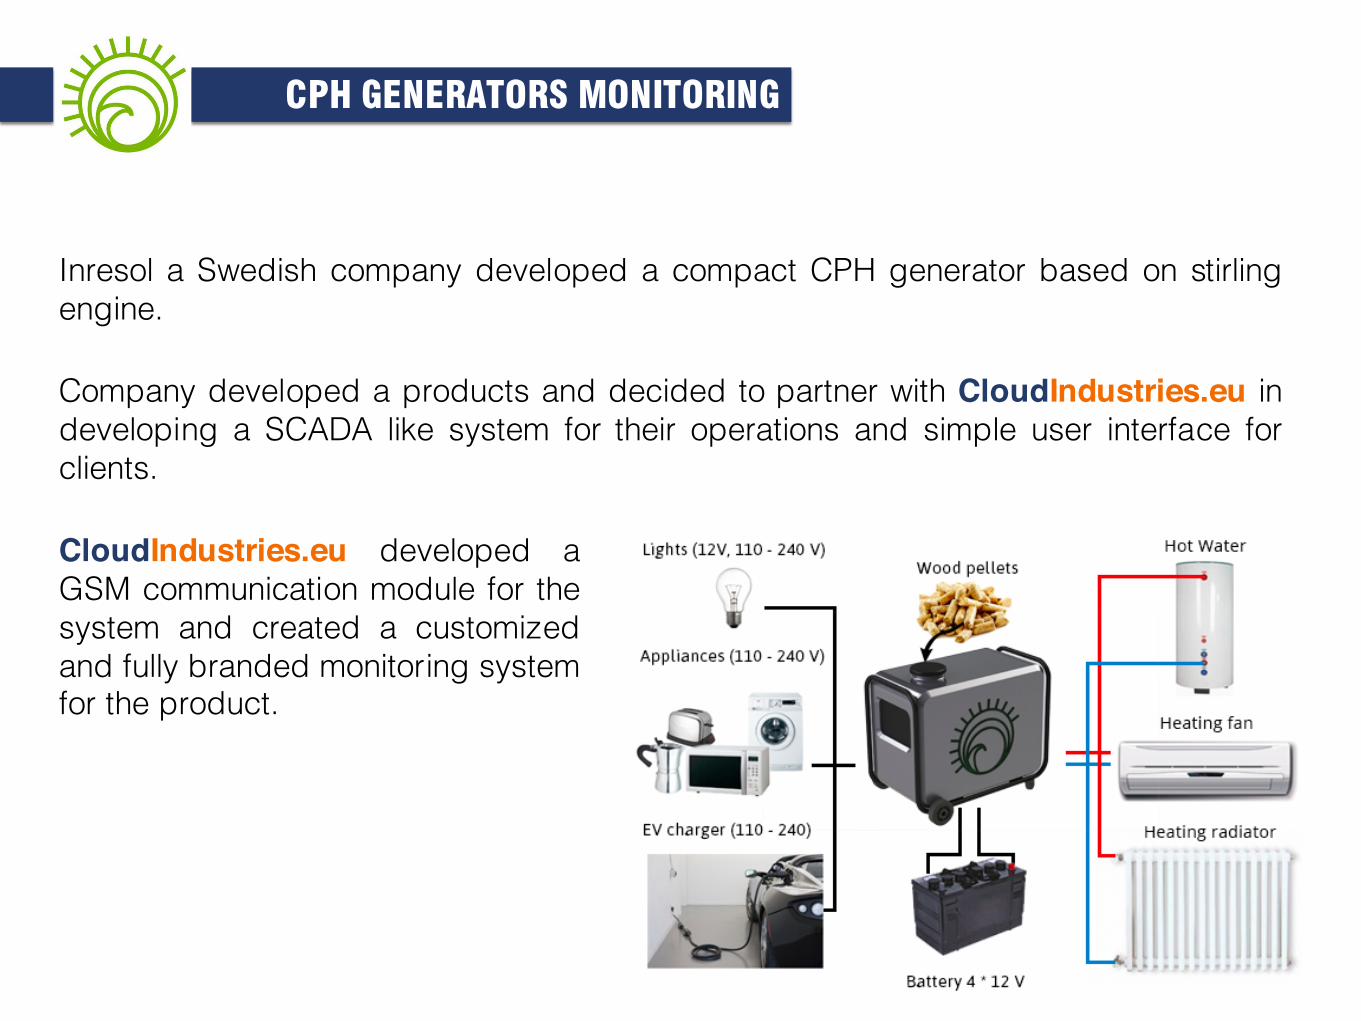
CPH GENERATORS MONITORING
Inresol a Swedish company developed a compact CPH generator based on stirlingengine.
Company developed a products and decided to partner with CloudIndustries.eu indeveloping a SCADA like system for their operations and simple user interface forclients.
CloudIndustries.eu developed aGSM communication module for thesystem and created a customizedand fully branded monitoring systemfor the product.

Map to see active/inactivegenerators all over the world
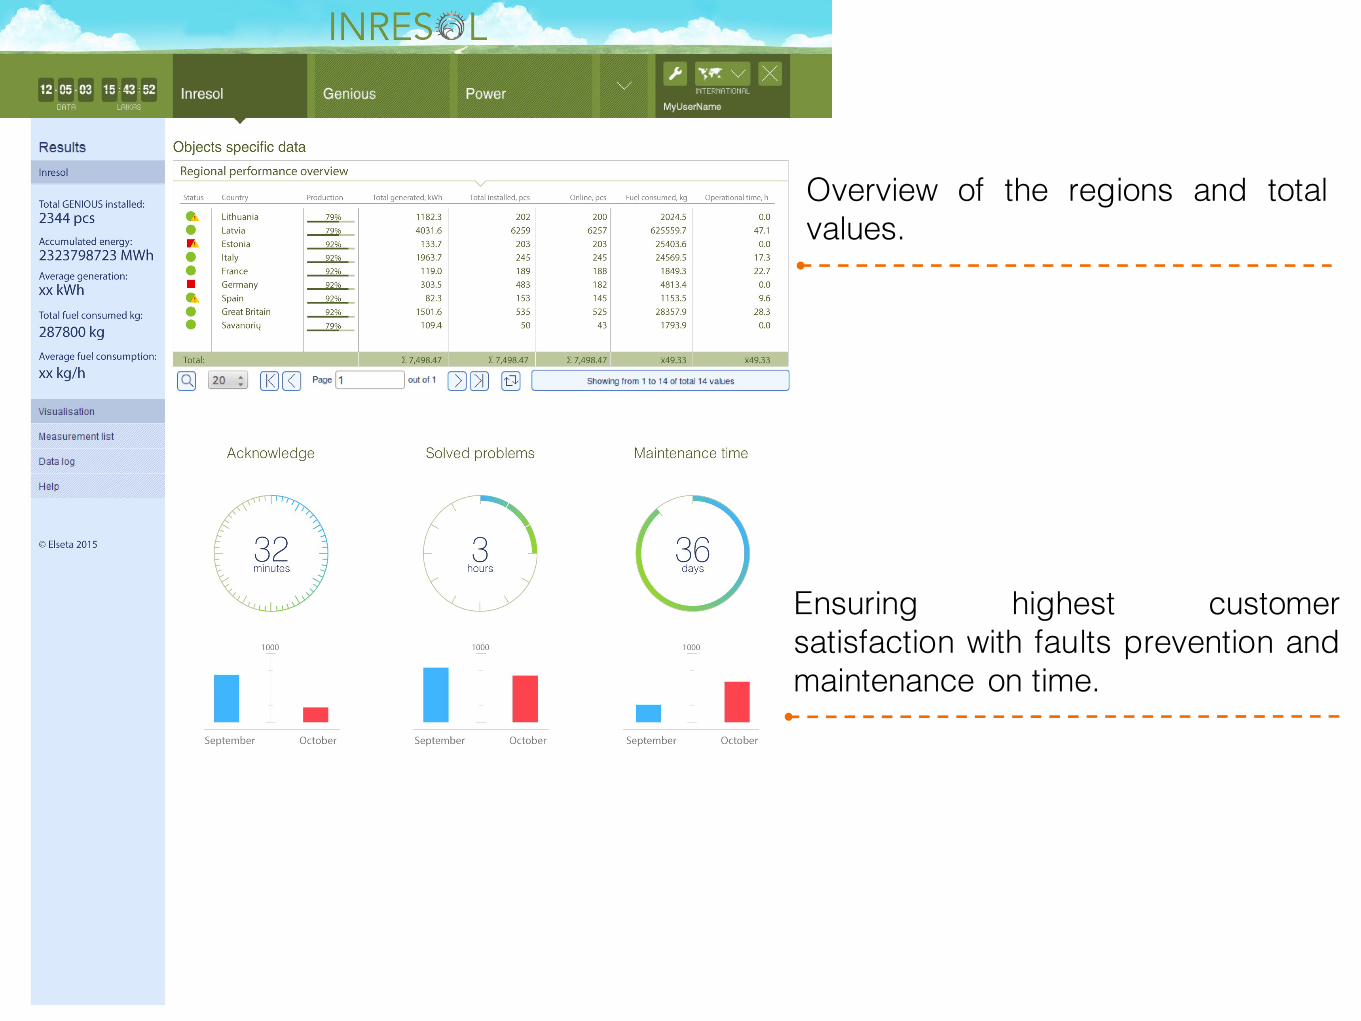
Overview of the regions and totalvalues.
Ensuring highest customersatisfaction with faults prevention andmaintenance on time.
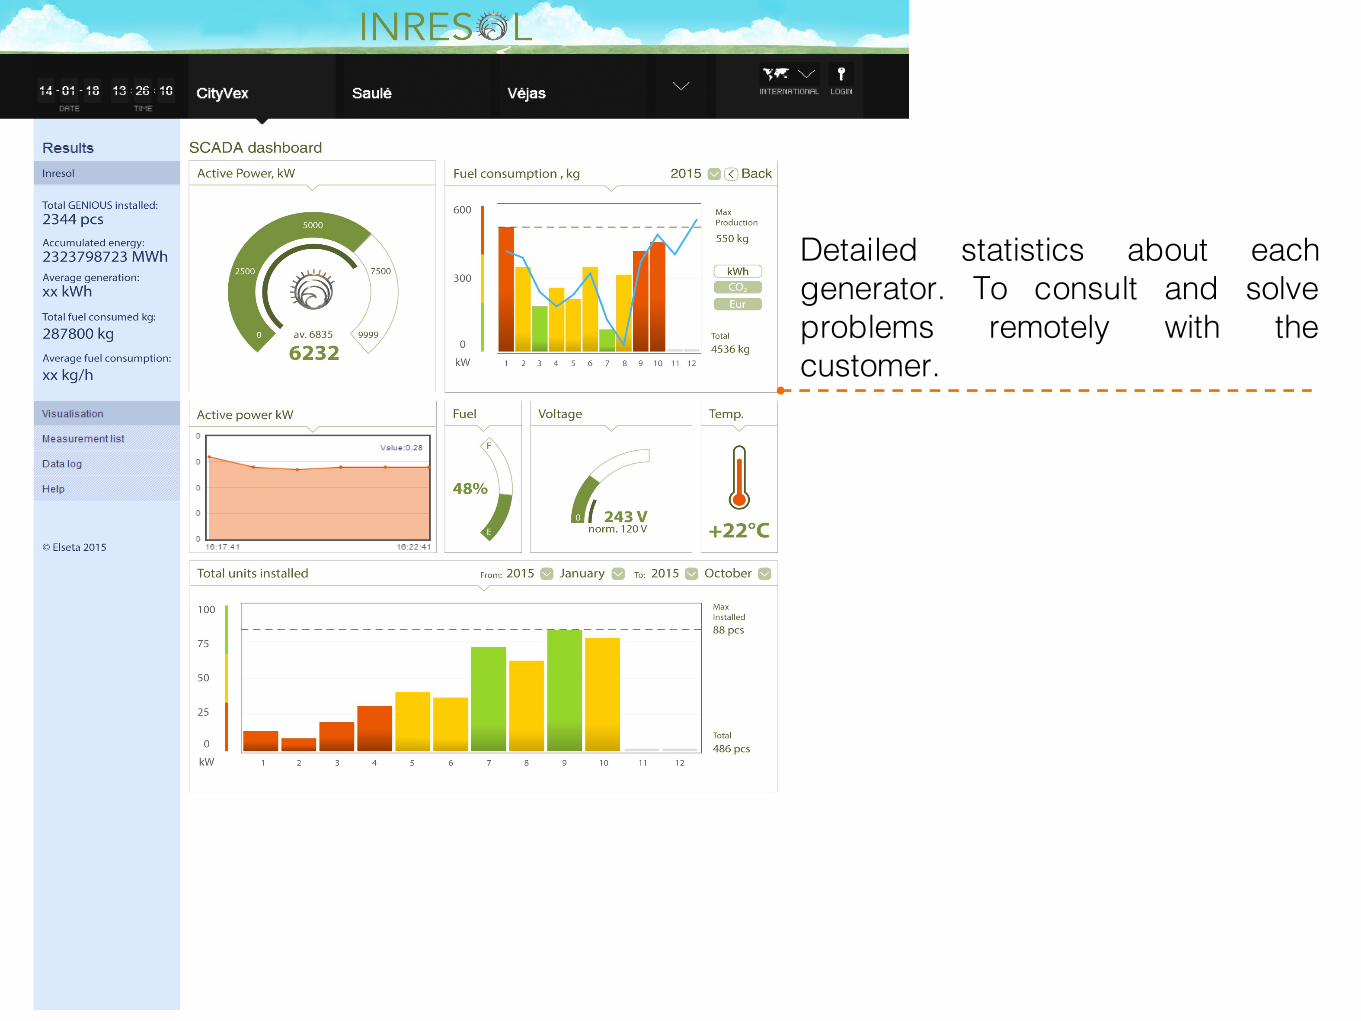
Detailed statistics about eachgenerator. To consult and solveproblems remotely with thecustomer.
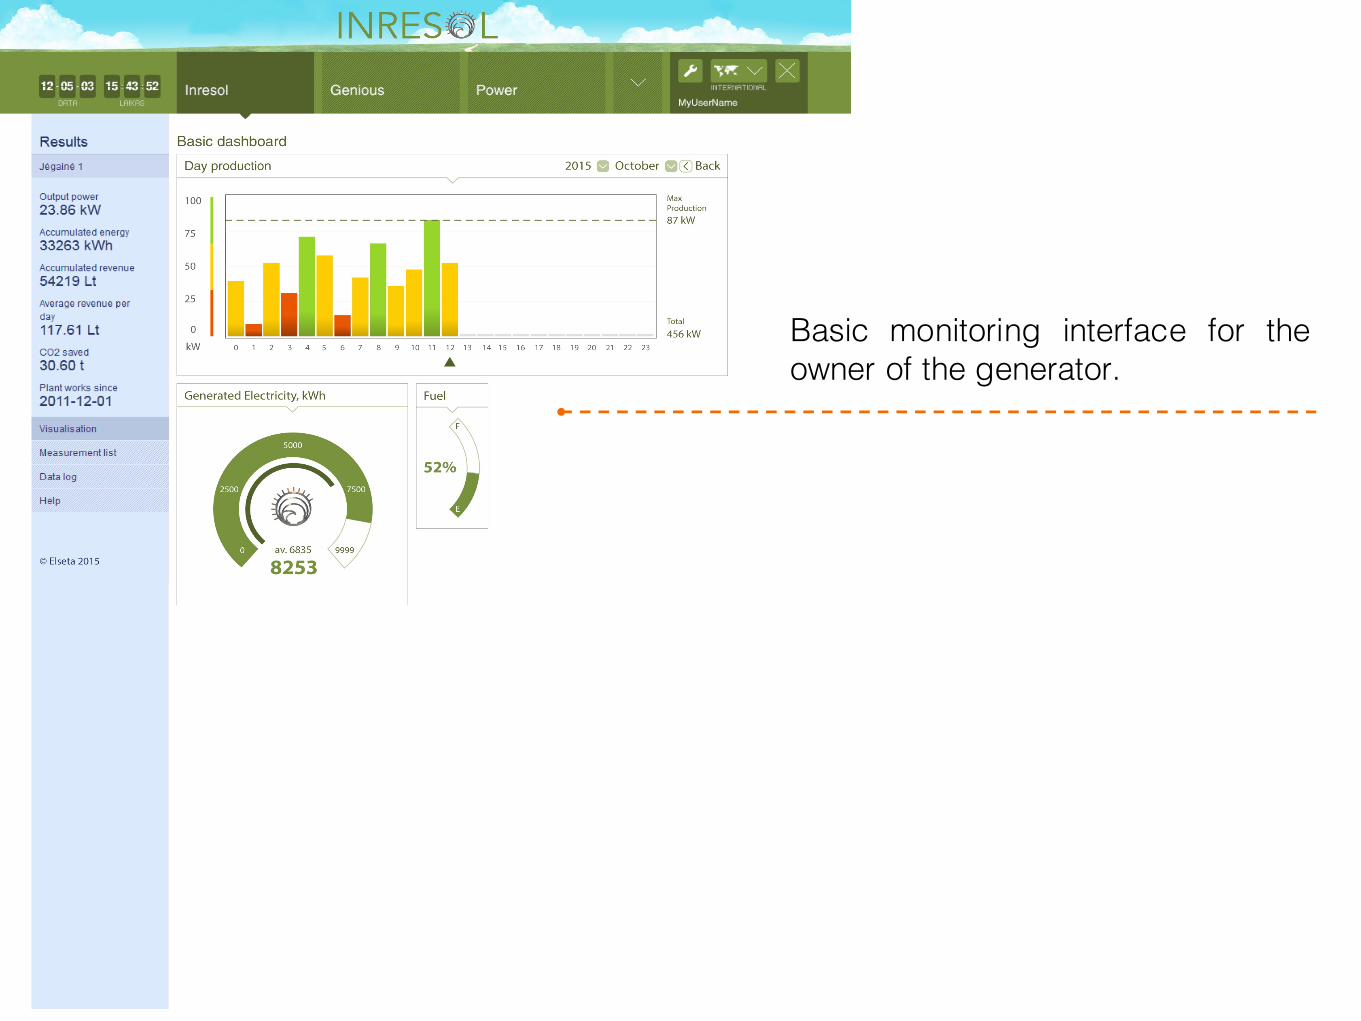
Basic monitoring interface for theowner of the generator.
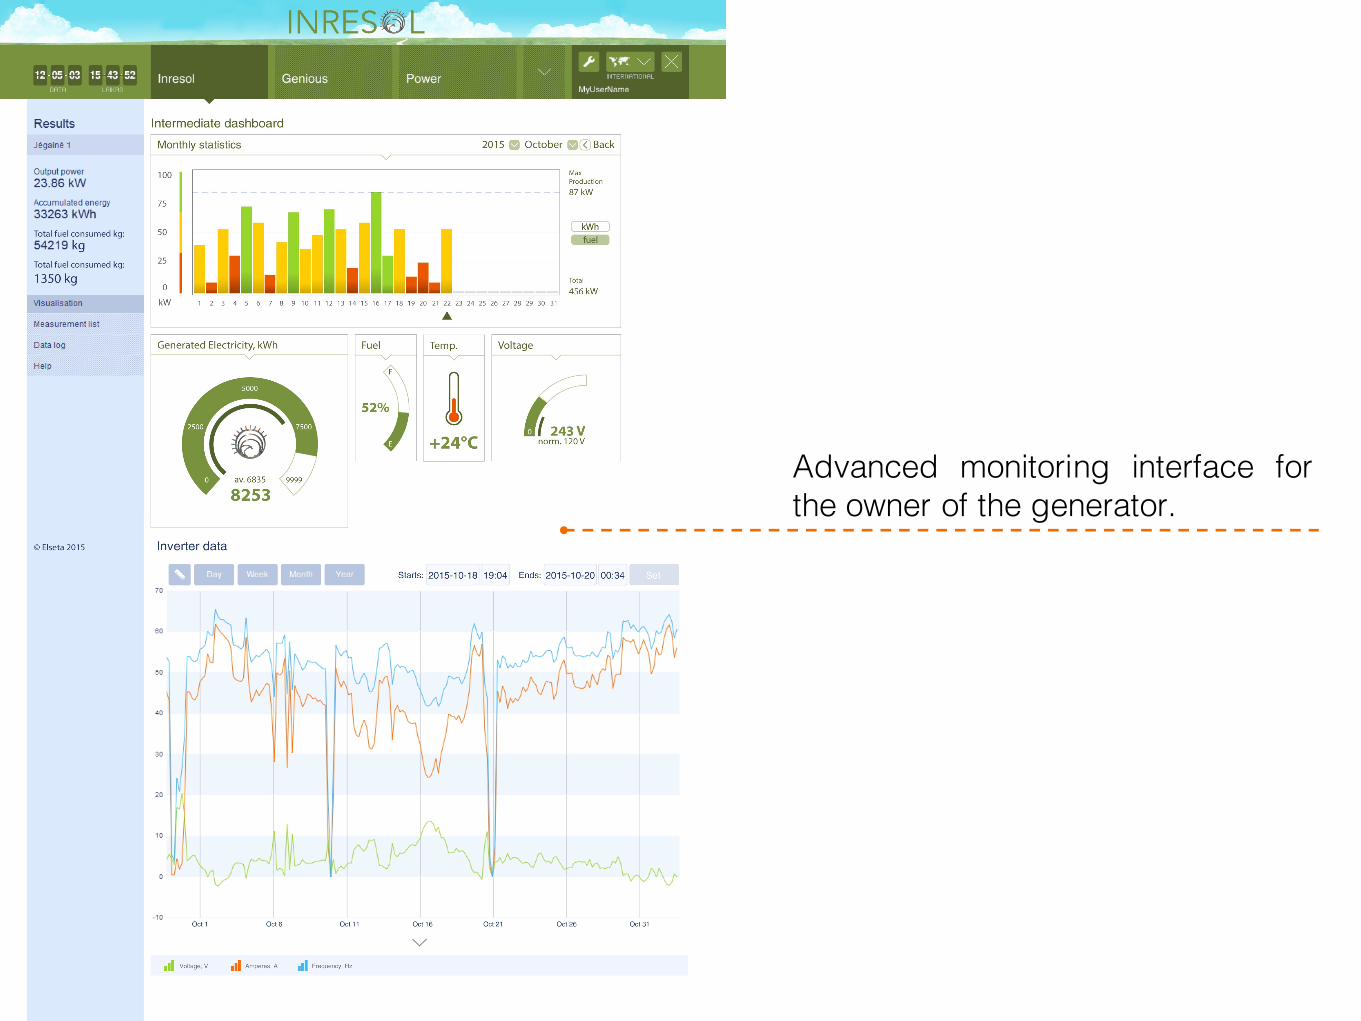
Advanced monitoring interface forthe owner of the generator.
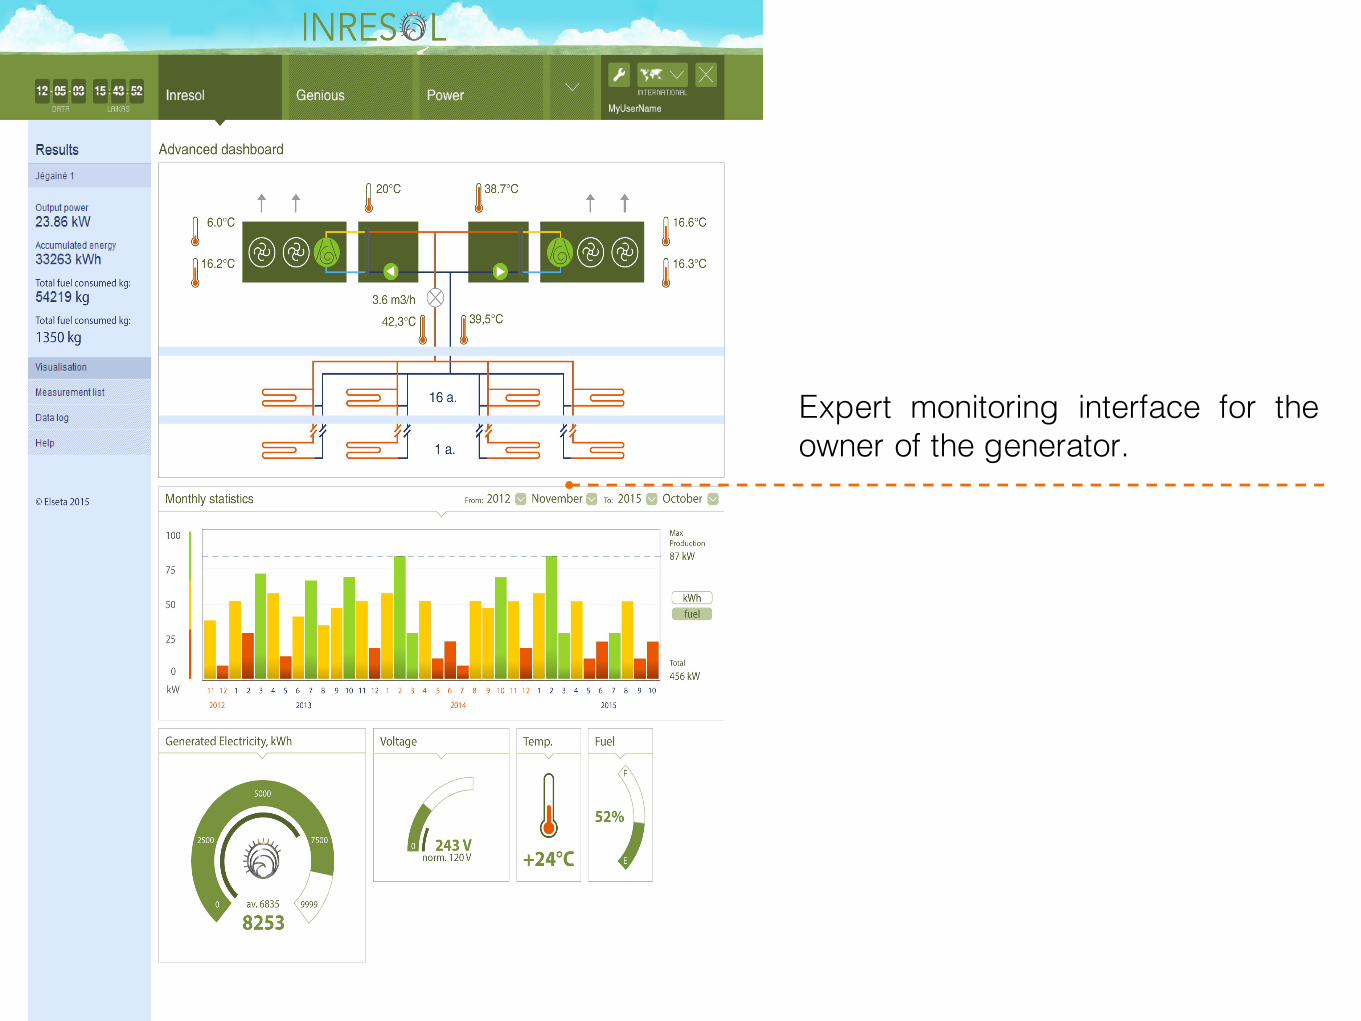
Expert monitoring interface for theowner of the generator.

ENERGY EFFICIENCY FOR INDUSTRY
EICenergy is a Lithuanian company which is offering methodology, equipment and theirknowledge to help their customers to control and optimize energy usage.
Company’s main clients are factories and other industrial sites.
The solution of EICenergy consist of sensors, control and power equipment installed atthe productions lines where various data is monitored for period of time and thencompetitive consultants provide insights about possible savings.
The CloudIndustries.eu had a task to create a gateway and a great user interface with dashboards to visualize all data which are taken each 10 seconds.
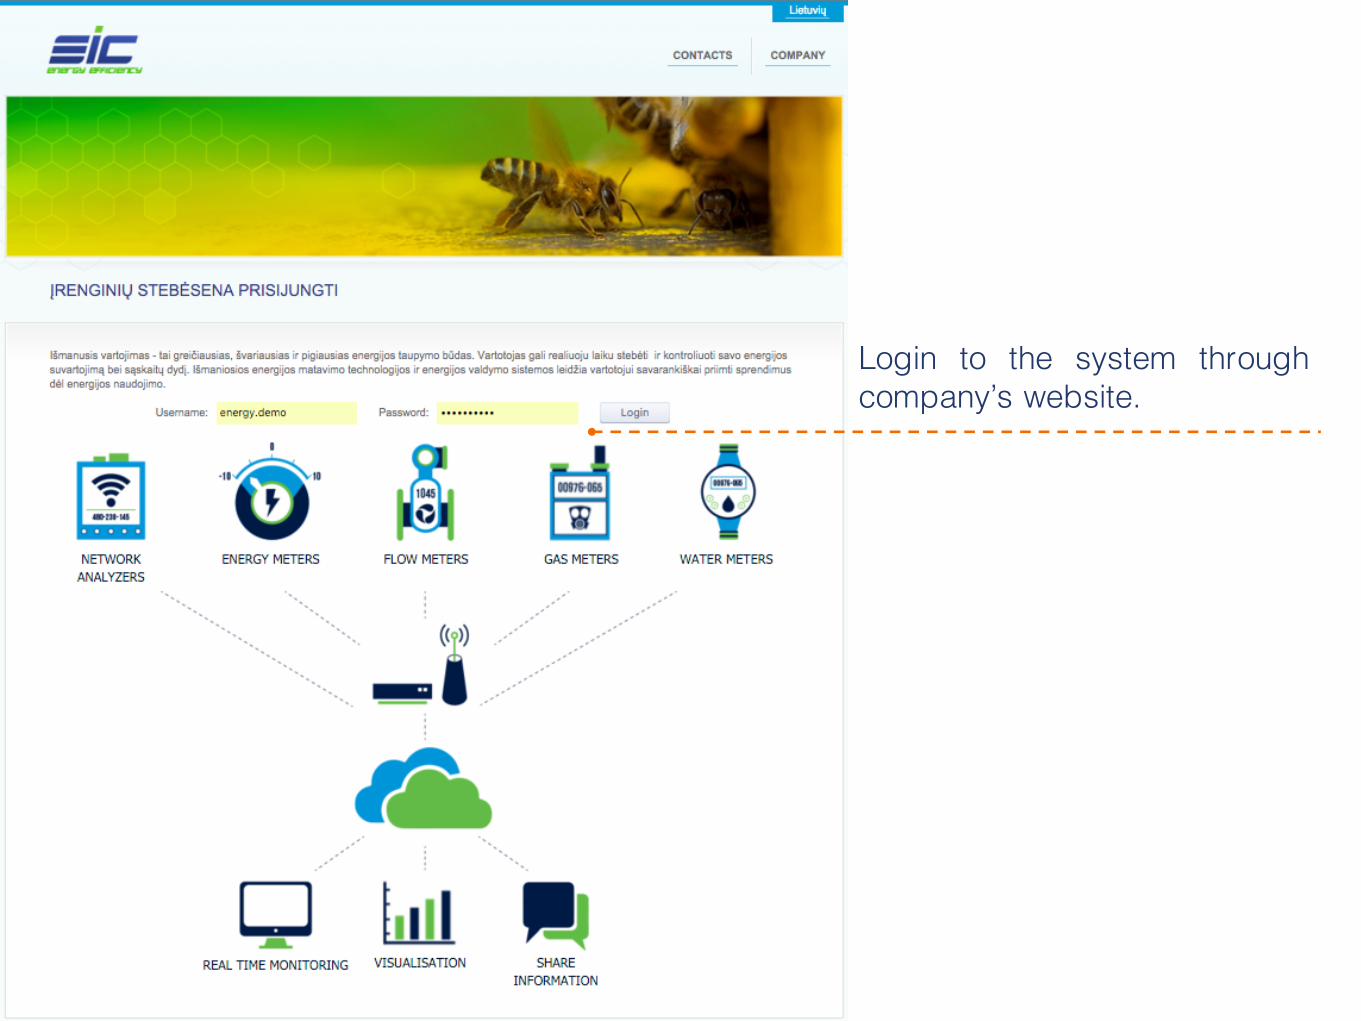
Login to the system throughcompany’s website.
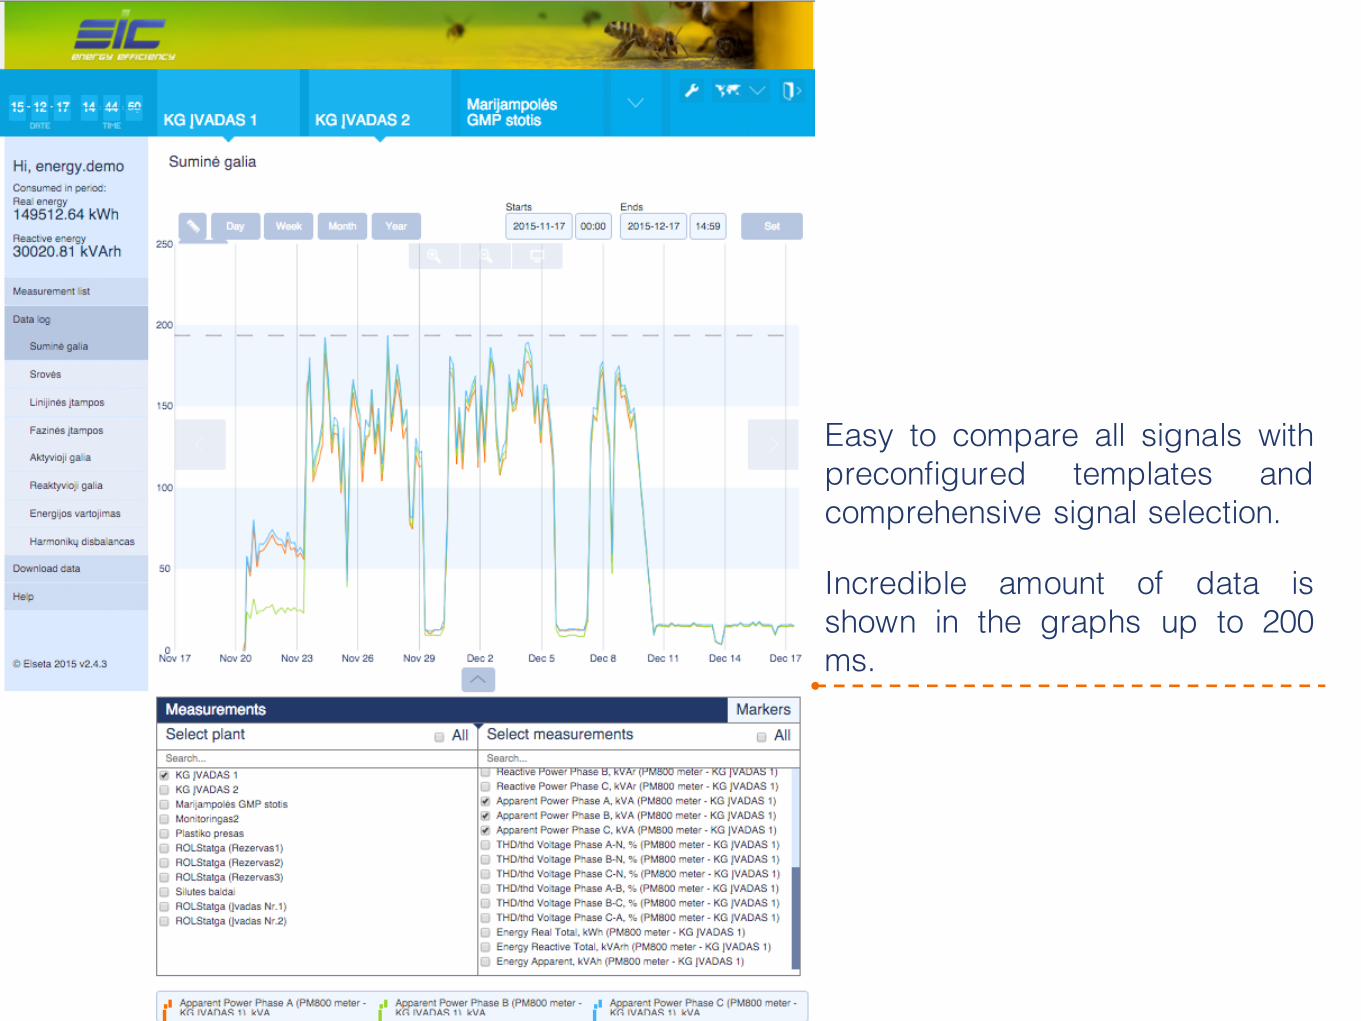
Easy to compare all signals withpreconfigured templates andcomprehensive signal selection.
Incredible amount of data isshown in the graphs up to 200ms.
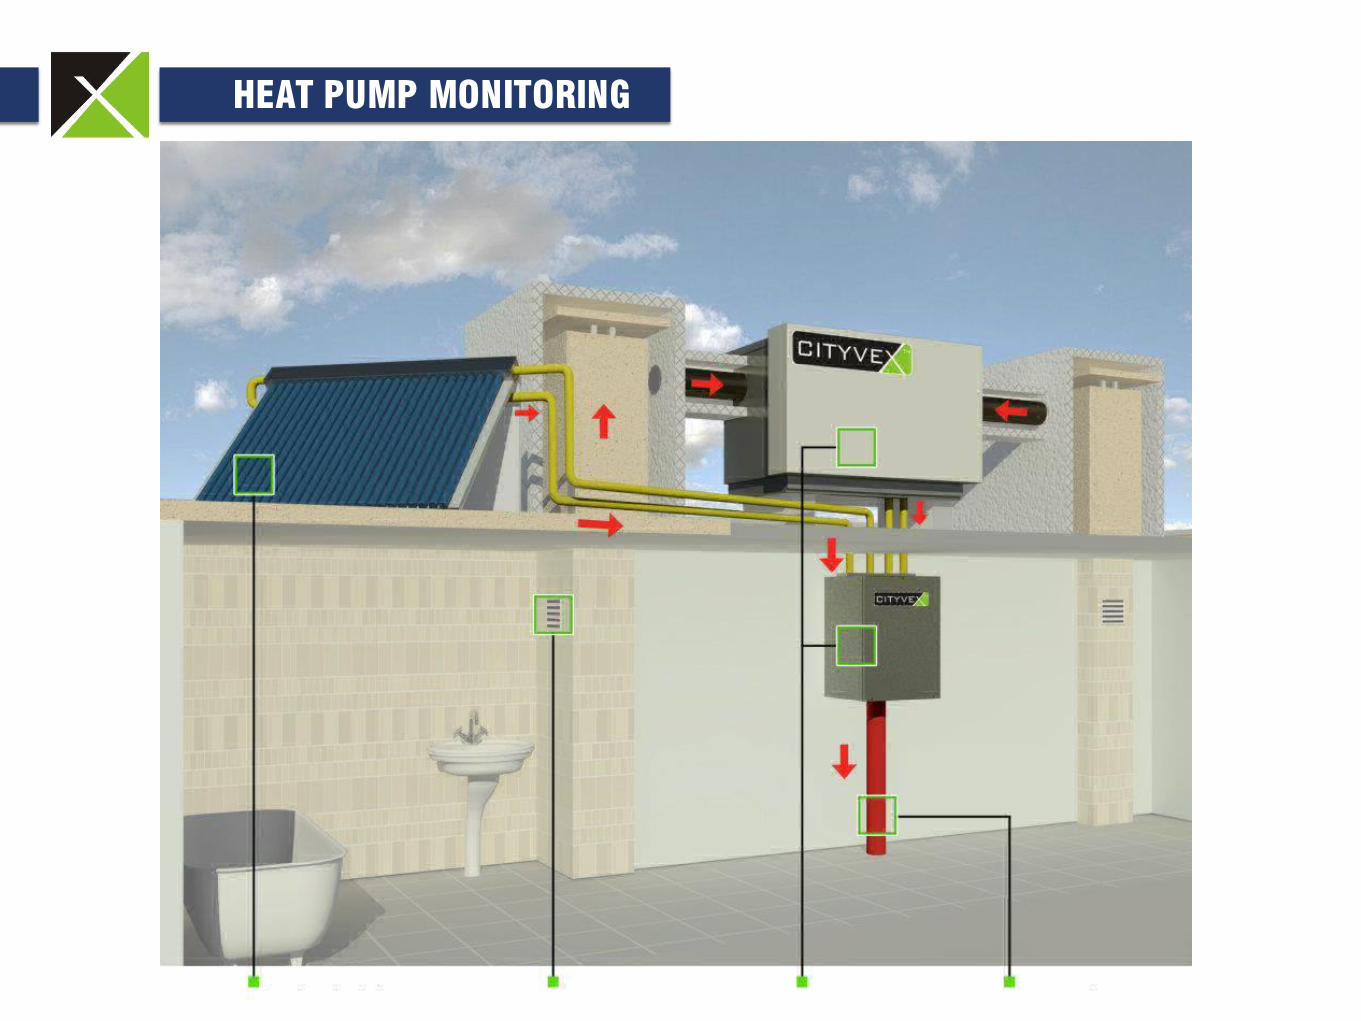
HEAT PUMP MONITORING

HEAT PUMP MONITORING
Cityvex is an innovative heat pump for old apartment buildingsdeveloped by company Enso Baltic.
This is an economical heating for multi-store apartment buildings.Cityvex uses warm air out from the ventilation shafts in the sanitaryunits and returns the heat energy to the building.The heat can be used in two ways:- for heating towel driers;- for partial heating of water.
The CloudIndustries.eu task was to create communications models and a user interface with dashboards to visualize all data which are taken each 10 seconds.
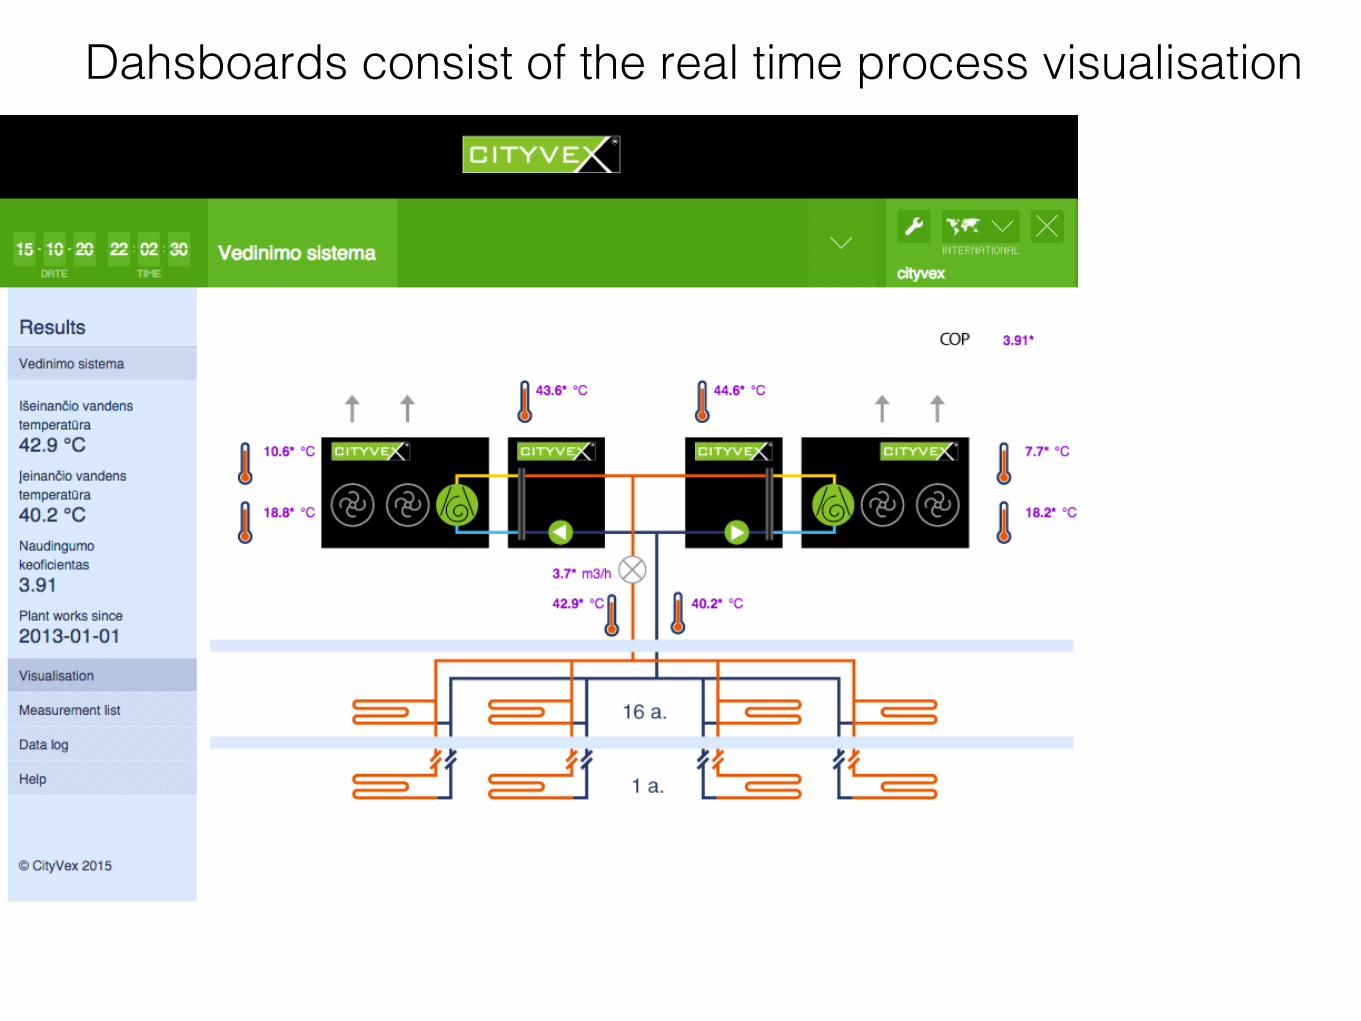
Dahsboards consist of the real time process visualisation
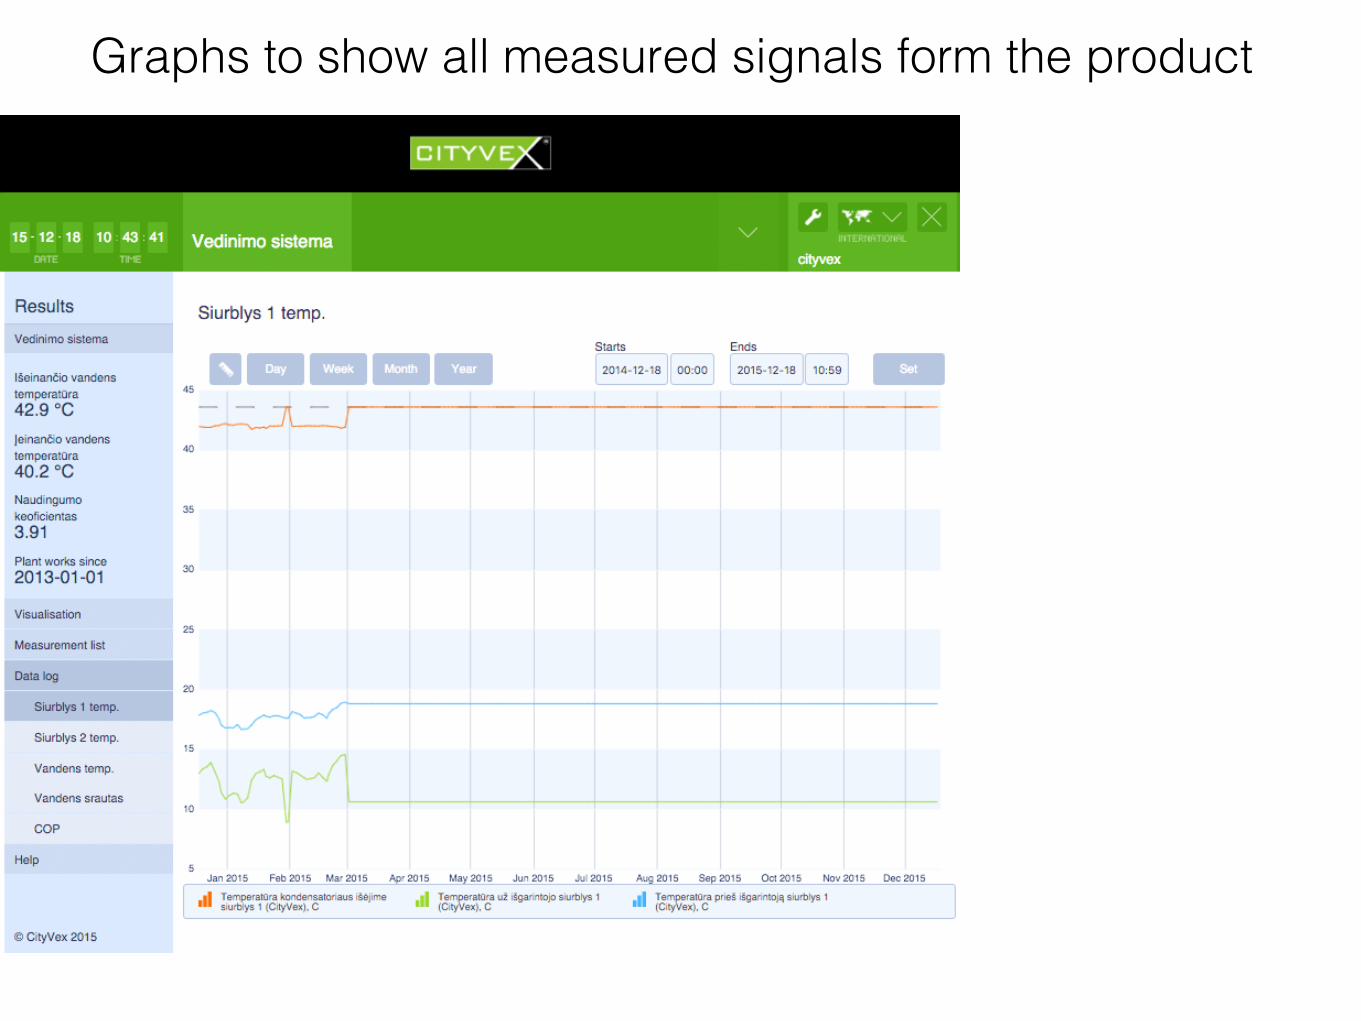
Graphs to show all measured signals form the product

Let’screateinnovationstogether
Contactus
JustinaBankauskaitė[email protected]
+37067251802
+37062047648www.cloudindustries.eu