Embed Size (px)
Citation preview

Brazilian Scenario - Trends and Challenges to keep IT investments
Jayme Faria - ICT Consulting Manager Latin America
Frost & Sullivan
February - 2016
xxx
Presented to:

2
2009 2013 2014 2015
Macroeconomic “rollercoaster” in the past 7 years
High Expectations Path errors Weak political
leadership to change Issues Foreseen
• Commodities Boom helps exports • Strong R$ X USD • Decreasing inflation/interest rates (Selic and Public
Banks) • Increasing middle class and consumption • World Cup + Olympics to boost GDP • Petrobras pre-salt investments (Oil US$110/barrell in
2011) • Respect for investors • Fiscal superavit
• Commodities Low Prices (China < demand) • Weak R$ X USD • Increasing inflation/interest rates • Consumption reduces significantly • World Cup as explanation for lower GDP • Petrobras corruption scandals and reduced investments (Oil US$40/barrel in 2015) • Downgrade of Brazilian debt to junk status from Fitch and Standard & Poor’s (end of 2015) • Optimistic forecasts indicate a 2.5% shrinkage for Brazilian economy in 2016 • The finance minister quit in despair after less than a year in the job (end of 2015) • High inflation rates and unemployment rates tending to get even worse during 2016
Source: The Economist, Frost & Sullivan
2016
Policy and economy at the edge of the
precipice

3
Brazil’s perspective is not so encouraging...
•Consumers are indebted
•Consumers confidence index decrease
•Social conditions deterioration
•Exports reduction
•Drop on investments grade
•Commodities price decrease
•Shortage of credit
•Petrobras crisis
•Fall in president’s popularity
•Lack of Government actions
•Difficulty on comply the budget
•Unemployment rates – 6.8% in 2015
•Higher inflation rate – 10.7% in 2015
•Currency devaluation – 1USD = 4BRL
•Increase in interest rates – SELIC 14.25%
•GDP shrinkage: 3.8% in 2015
Economy Politics
Consumption Trade
Source: Frost & Sullivan
4
Diversify the agenda is the solution for exports and to the overall economy in Brazil
Source: Frost & Sullivan and OECD-FAO Agricultural Outlook 2015
• Growth rate expected is ‘just’ 7% for 2015
• Stock market crash of values
• Lower commodities prices globally
China’s lower growth
path • China accounts for 27,2% of total Agriculture sector exportation of Brazil
• 35% of Brazil’s total oilseed production exported to China
Brazil’s exports dependency on China
• Directly through bilateral trade
• Indirectly through changing world prices
• 33% of decrease on exportations in first semester of 2015
Brazilian agriculture affected
• Brazil has stimulated the consumption, but forgot about the production capacity
• Commodities vs manufactured products
Recent years brief overview

5
Productivity is what sustained the growth of the agriculture business in Brazil, and is the necessary diversification to overcome the current situation
Source: Frost & Sullivan and cepea.esalq.usp.br
2010 2011 2012 2013 2014
Total (excluding Agribusiness) 7.5% 2.0% 2.2% 2.1% -0.3%
Agribusiness 7.5% 5.4% -2.8% 3.9% 1.6%
-4.0%-2.0%0.0%2.0%4.0%6.0%8.0%
10.0%
GDP growth comparison
Technology leveraged the grains productivity
• Harverters and Irrigation techniques boosted the growth –
6.4% from 2014 to 2015 More productivity with no area increase (just 1.7% of growth)
• The acreage grew from 57 million to 58 million hectares from 2014 to 2015
IOT could take Agriculture to the next level
• Predictive data analytics , Sensors, Smart meters, Precision seeding,
Fertility and disease management and weather accurate forecasts
2012 was a bad year due to the
unfavorable weather conditions which
affected mainly corn and soybean crops
6
Budget pressures generate important incentives for increased productivity in different sectors
On-demand instead of peak capacity
Opex instead of Capex
Don't just invest your budget, optimize it Source: Frost & Sullivan

7
Digital transformation will take place in this context
Big Data Cloud
Mobile
Social
IOE
The Brazilian Big Data
market was expected to
end on US$400
million in 2015
The Brazilian Cloud market was expected
to end on US$668
million in 2015
The Brazilian users of
smartphones with a mobile
broadband have surpassed
70 million during the
1H2015
The Brazilian WhatsApp
active users were more
than 50 million in 2015
The Brazilian M2M market was expected
to end on US$190
million in 2015
Source: Frost & Sullivan

8
Industry executives recognize that change is here and see new challenges in IT
New, disruptive
competitors Digitalisation New Business
Models
Servitisation
Forces Driving Change
36% 27% 18% 12%
Perceived Rate of Industry Change
0% 5% 10% 15% 20% 25% 30% 35% 40% 45%
2010
Now
Not changing at all
Changing only slowly
Changing at a moderate pace
Changing fast
Changing very fast
Source: Frost & Sullivan survey of 1,500 executives, 2014
Source: Frost & Sullivan

9
And need to transform the business with strategic and tactical initiatives
Strategic Focal Points Tactical Focal Points
Business Model
Cost
Customer Experience
Partnership
Innovation Supply Chain Management
Operational Excellence
Risk Management
Workforce Empowerment
Reducing Cost
Service Excellence
Digital Products and Services
Source: Frost & Sullivan
10
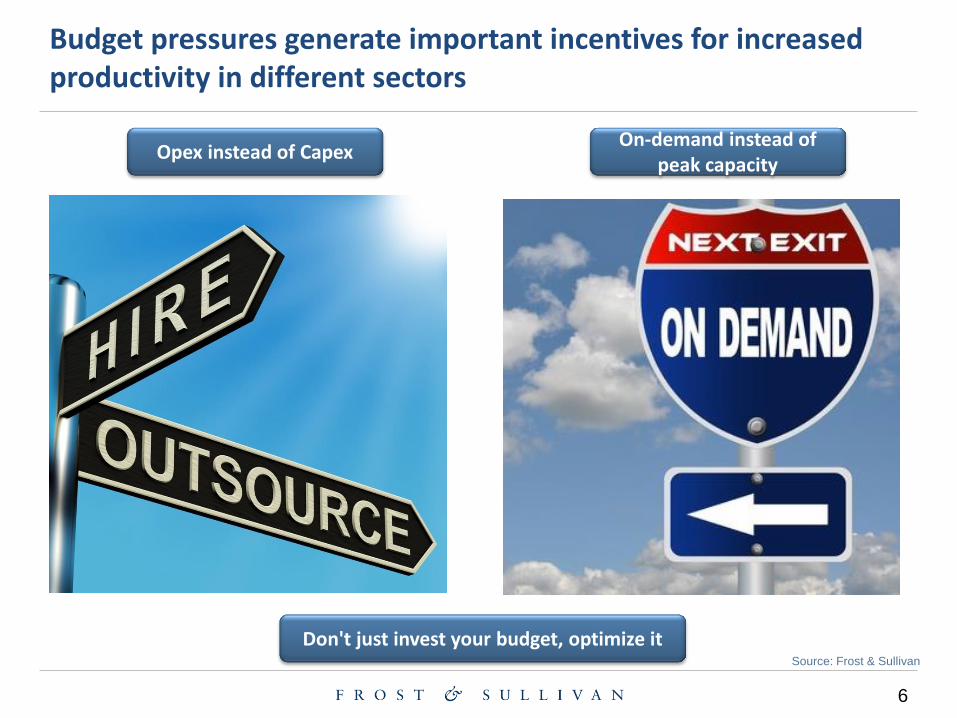
UBER, a transportation services or a Big Data company?
Source: Frost & Sullivan and expandedramblings.com/
Fare, Route, Traffic conditions and time are crossed after a ‘taxi’ is requested
Predictive analysis to previously
determine time and price
Combining Uber’s data with personal data provided by
customers
Mutual evaluation system enhance customer loyalty and experience
The database is increasing and
becoming a smart tool
Simplicity: One app for all countries and cities
Visionary Thinking: First market participant to
establish trust by sharing driver information
Adaptability: Tailor-made solutions for
different markets to cover niches
Cashless Solution: Fares automatically charged
to credit cards
Reliability: Transparent—feedback
by mutual rating of drivers and customers
on a 5-star scale
What makes Uber different
What makes Uber disruptive on Big Data
60 countries
+ 8 MM users
Expects to hire 1 MM drivers in the next 6
months
+ 1 MM trips daily
51% of drivers work 15hs or less a week
11
Source: Frost & Sullivan
Bradesco has successfully implemented a mobile solution
Solution
• Bradesco has negotiated with the 4 major carriers a standard offer providing a free access to its clients through mobile application and web-site
Business impact
• The number of mobile banking users has doubled, achieving 25% of the entire database
• ROI 3 times superior to the initial investments
Challenge
• Enhance mobile banking adoption • Guarantee deployment ROI • Offer a service to the whole clients
database
Why free data?
• Lower cost on each transaction by mobile banking
• Rapid payback due to clients’ adherence and higher perceived value to differentiate from competitors

12
Market Demand
• Sao Paulo is the financial center of Brazil
• High consumption
• Proof of concept to future rollout in the whole state
Opportunity for Innovation
• Create an environment of continuous innovation
• Evaluation of new concepts and solutions
Effectiveness of Investments
• Customers interaction
• Alternative supply
• Loss reduction
Productivity
• Smart Meters
• Process Automation
Source: Frost & Sullivan and Cisco
Cisco and Eletropaulo are partners on a Smart Grid project in Barueri
Reduce technical and commercial losses
(fraud)
Improve the service quality
Reduce operational costs
Improve planning of grid expansion
Improve assets management
Promote energy efficiency
Grid suitable to connect micro-
generation (Eolic and solar)
Customers manage their own
consumption using Client Portal
Main Benefits
Main Motivations

13
Source: Frost & Sullivan
Lessons that Brazil could take from European countries which retook growth path after the financial collapse: Spain
How the crisis started?
- Spain also saw the boom and bust that accompany a housing bubble
- During the economic boom, 800 thousand apartments were built in the country every year
- Too many projects were financed on credit, and as result, private debt was twice as high as the entire Spanish GDP in 2008
How Spain faced the
crisis?
- In 2012, Spain also received billions of dollars from the European Union to rescue the banking system
- The Spanish government undertook a tough policy of fiscal austerity prompting protests among ordinary citizens
How is Spain nowadays?
- The government expects economic growth of 3 percent in 2015
- The situation is much better than some years ago, but the main problems still remain unresolved
- Almost one in five people in Spain remain unemployed, lower rate than the highest of 27% which were seen during the worst crisis’ period
14
Source: Frost & Sullivan
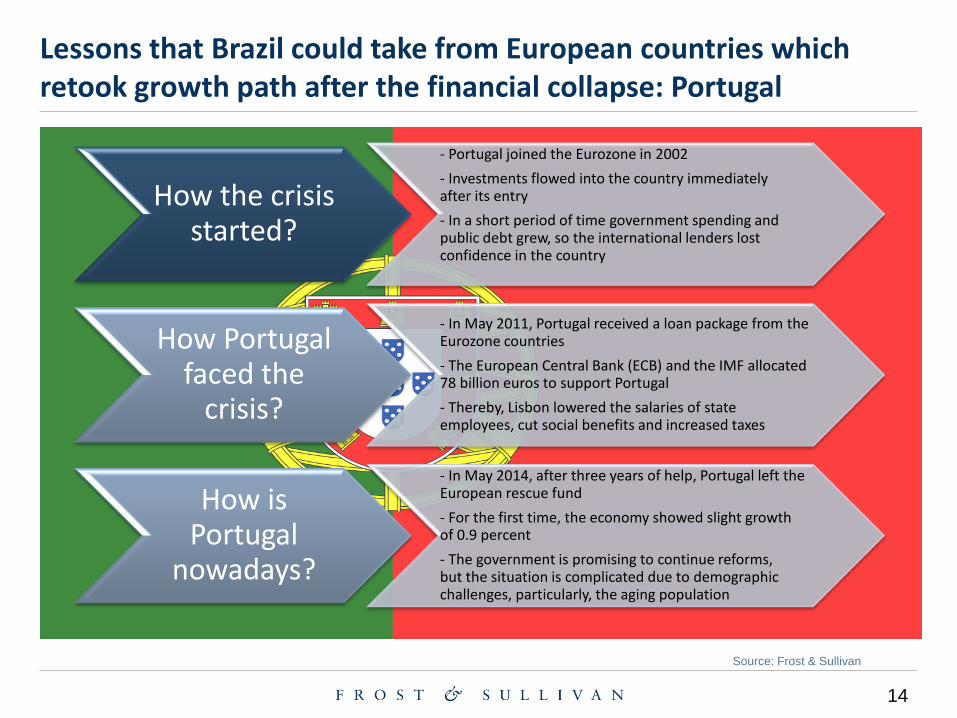
Lessons that Brazil could take from European countries which retook growth path after the financial collapse: Portugal
How the crisis started?
- Portugal joined the Eurozone in 2002
- Investments flowed into the country immediately after its entry
- In a short period of time government spending and public debt grew, so the international lenders lost confidence in the country
How Portugal faced the
crisis?
- In May 2011, Portugal received a loan package from the Eurozone countries
- The European Central Bank (ECB) and the IMF allocated 78 billion euros to support Portugal
- Thereby, Lisbon lowered the salaries of state employees, cut social benefits and increased taxes
How is Portugal
nowadays?
- In May 2014, after three years of help, Portugal left the European rescue fund
- For the first time, the economy showed slight growth of 0.9 percent
- The government is promising to continue reforms, but the situation is complicated due to demographic challenges, particularly, the aging population

15
The opportunity is here…
0
1
2
3
4
5
6
7
2013 2018
Glo
bal
Rev
enu
es (
US$
Tn) Smart Grids
Smart Manufacturing
Healthcare
Smart Cities
Smart Buildings
Connected Car
Traditional
$3.8 Tn
$6.3 Tn
2014 2018
• There is a need to evaluate the strategies and options towards a focus on business needs, innovation and transformation.
The need for change is now
Smart and connected industries
Cloud and enterprise application
Orchestration, Collaboration,
Enablers
Programmable Infrastructure
Programmable Network
SDN, SDS, SD-WAN & NFV: Data centers orchestration and automation, mobile network virtualization
SaaS, BAaaS, PaaS, IaaS, ERP, CRM, SCM, HCM, mobile apps
BPM, BRM, Big Data Analytics, IoT
Smart: cities, homes, health, transport, etc
Digitally-Enabled Business Services
Source: Frost & Sullivan

16
Conclusions
In an increasingly competitive scenario, and restrained by economic crisis, companies should assess co-operation relationships, alliances
and acquisitions to effectively monetize emerging opportunities.
Integrate disruptive and emerging technologies. Be Proactive, new ideas create new businesses and generate more revenue sources.
Source: Frost & Sullivan