Embed Size (px)
Citation preview

Instrumentation and analysis of NPB
Zafar GilaniEMDC 2012
Measurement Tools and TechniquesUPC
● Introduction to benchmark app● Testbeds● Instrumentation● Traces● Measurement criterion● Evaluation● Anomalies● Conclusions
Outline
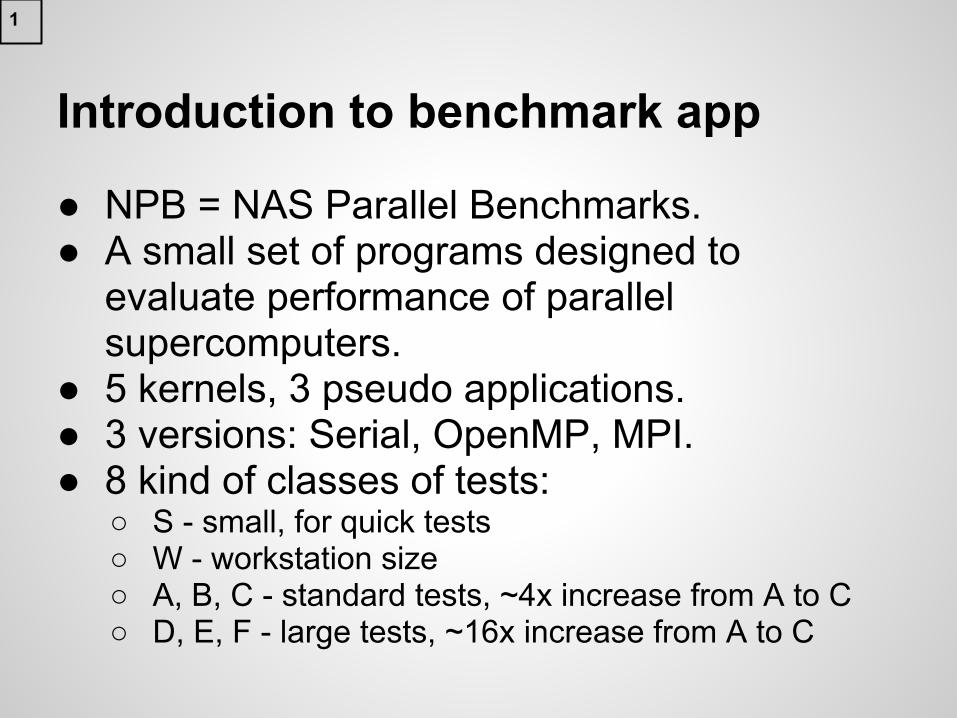
Introduction to benchmark app
● NPB = NAS Parallel Benchmarks.● A small set of programs designed to
evaluate performance of parallel supercomputers.
● 5 kernels, 3 pseudo applications.● 3 versions: Serial, OpenMP, MPI.● 8 kind of classes of tests:
○ S - small, for quick tests○ W - workstation size○ A, B, C - standard tests, ~4x increase from A to C○ D, E, F - large tests, ~16x increase from A to C
1
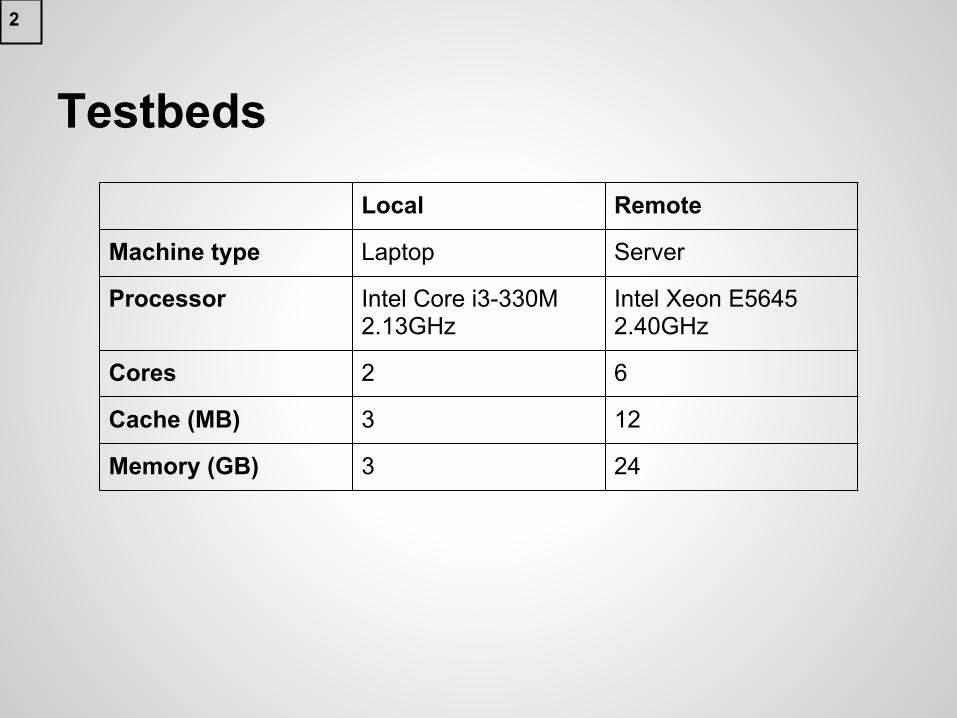
Testbeds
Local Remote
Machine type Laptop Server
Processor Intel Core i3-330M 2.13GHz
Intel Xeon E5645 2.40GHz
Cores 2 6
Cache (MB) 3 12
Memory (GB) 3 24
2
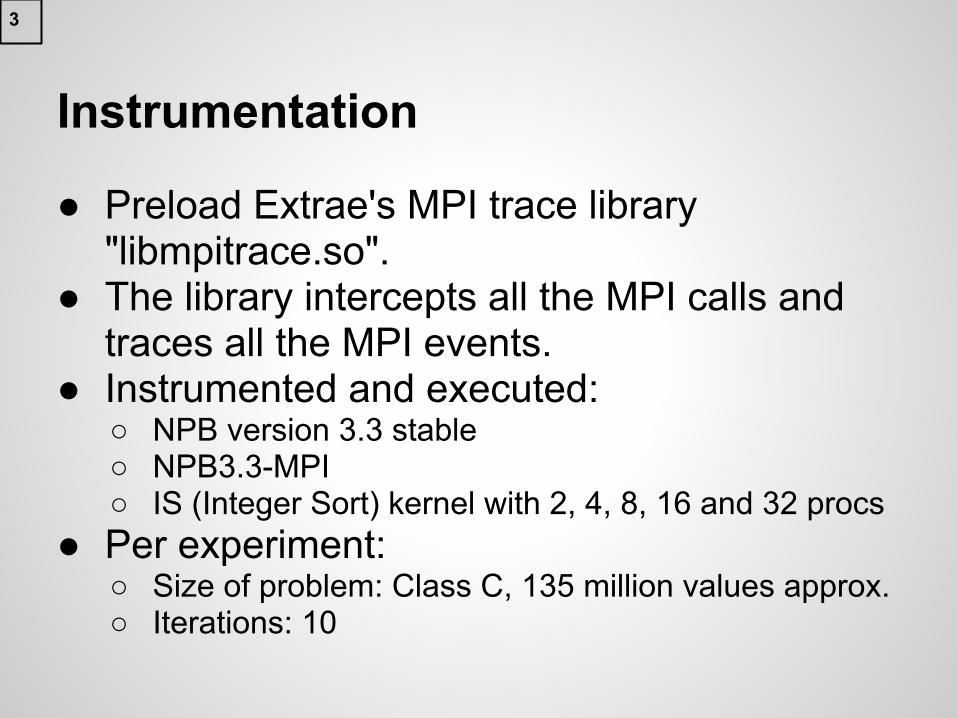
Instrumentation
● Preload Extrae's MPI trace library "libmpitrace.so".
● The library intercepts all the MPI calls and traces all the MPI events.
● Instrumented and executed:○ NPB version 3.3 stable○ NPB3.3-MPI○ IS (Integer Sort) kernel with 2, 4, 8, 16 and 32 procs
● Per experiment:○ Size of problem: Class C, 135 million values approx.○ Iterations: 10
3
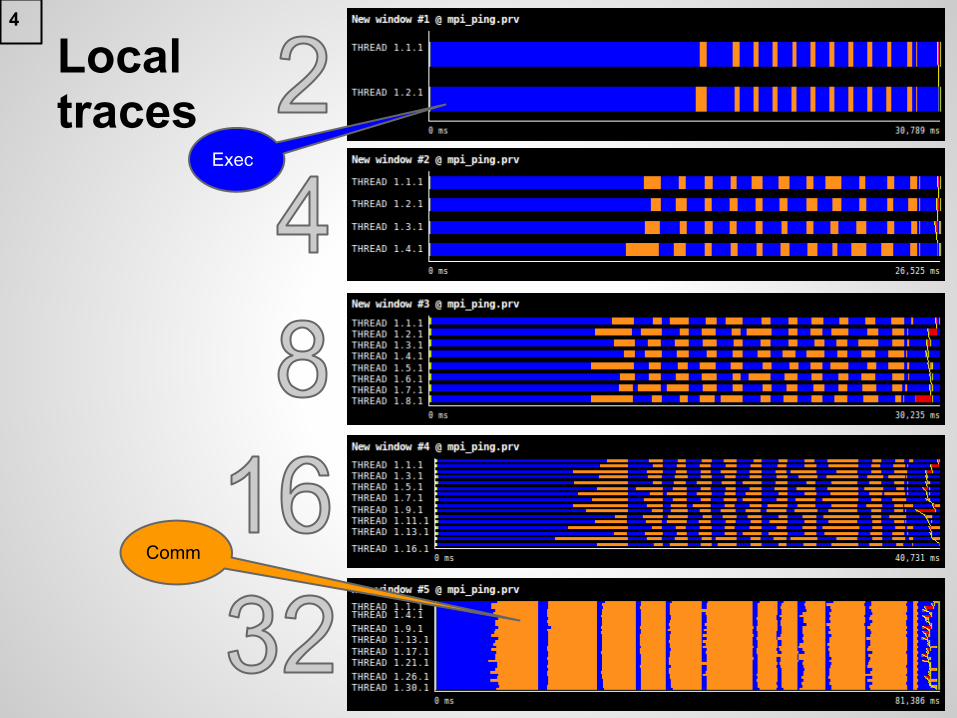
Local traces
4
Exec
Comm
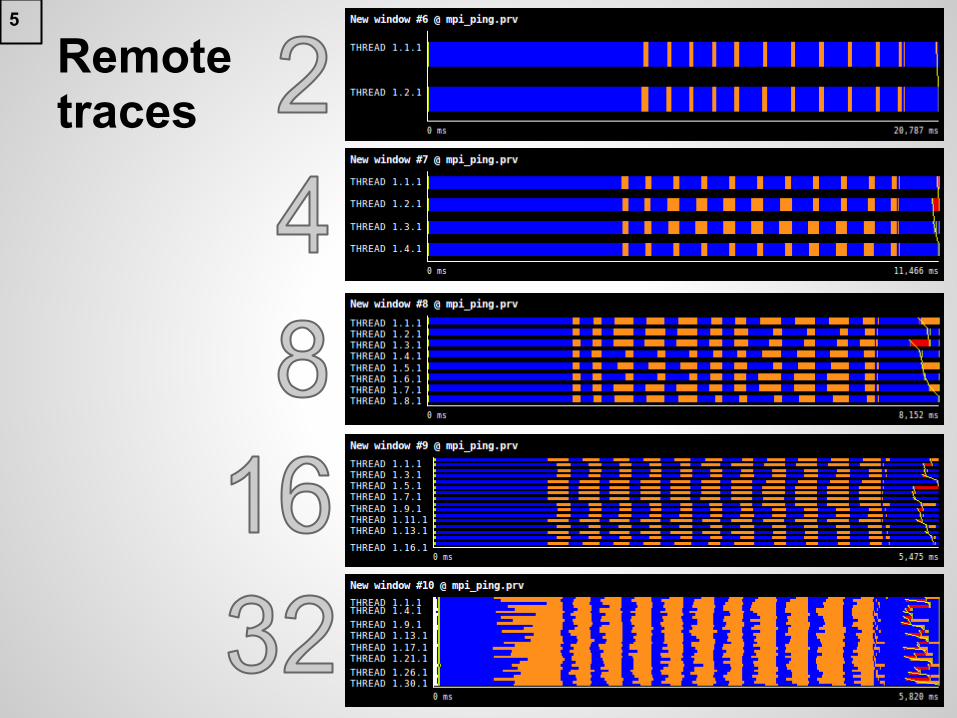
Remote traces
5

Evaluation & Comparative Analysis
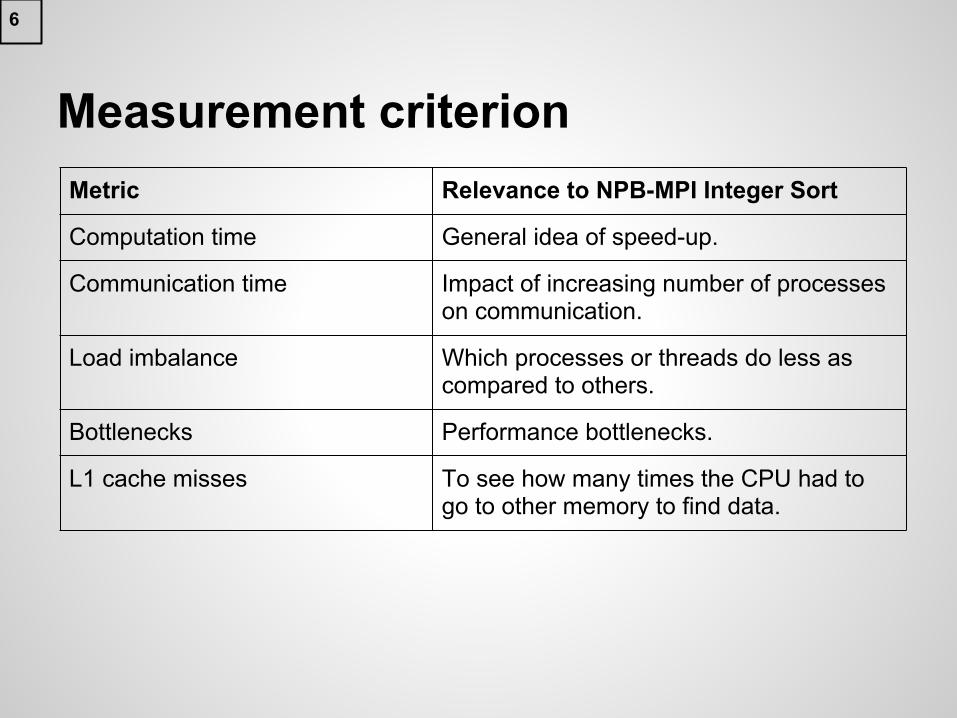
Measurement criterionMetric Relevance to NPB-MPI Integer Sort
Computation time General idea of speed-up.
Communication time Impact of increasing number of processes on communication.
Load imbalance Which processes or threads do less as compared to others.
Bottlenecks Performance bottlenecks.
L1 cache misses To see how many times the CPU had to go to other memory to find data.
6
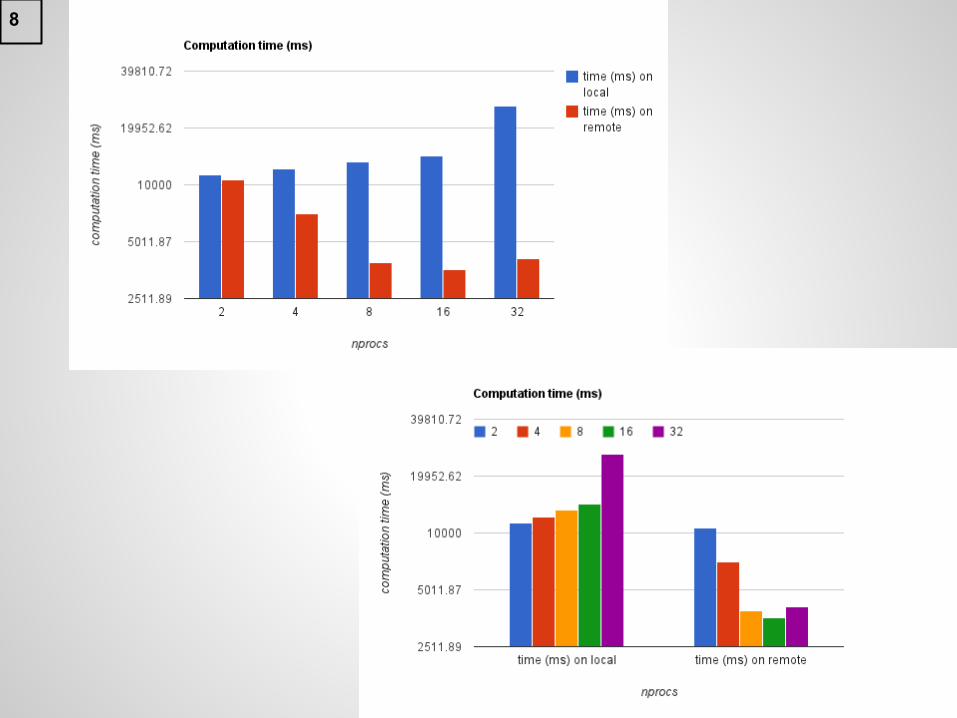
Computation time
● Measured: thread processing time.● Local:
○ increase in time directly proportional to nprocs○ upto 32 processes○ poor scalability
● Remote:○ decrease in time directly proportional to nprocs○ upto 32 processes○ good scalability
7
8
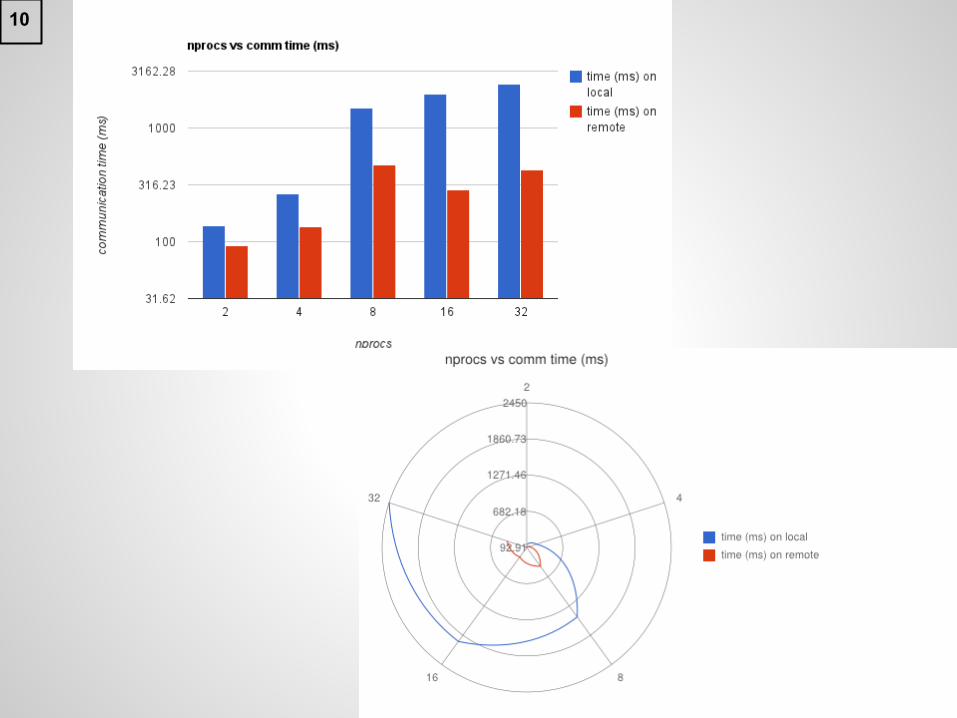
Communication time
● Overall communication time is determined by the process taking maximum time.
● Local:○ rapid increase in time as number of processes are
increased● Remote:
○ nominal increase in time as number of processes are increased
9
10
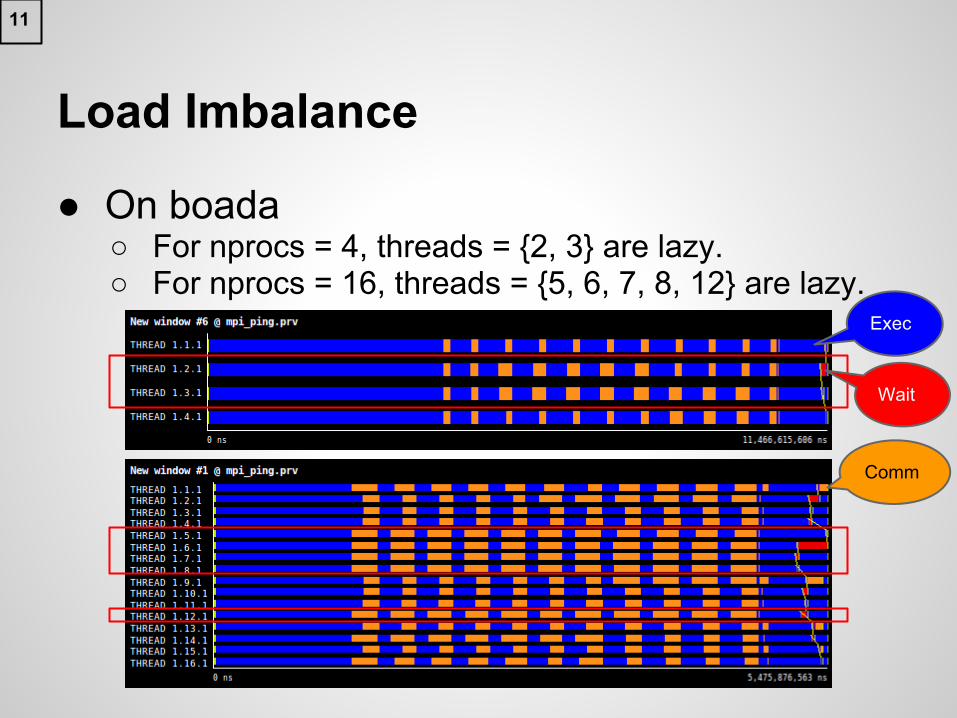
Load Imbalance
● On boada○ For nprocs = 4, threads = {2, 3} are lazy.○ For nprocs = 16, threads = {5, 6, 7, 8, 12} are lazy.
Exec
Comm
Wait
11
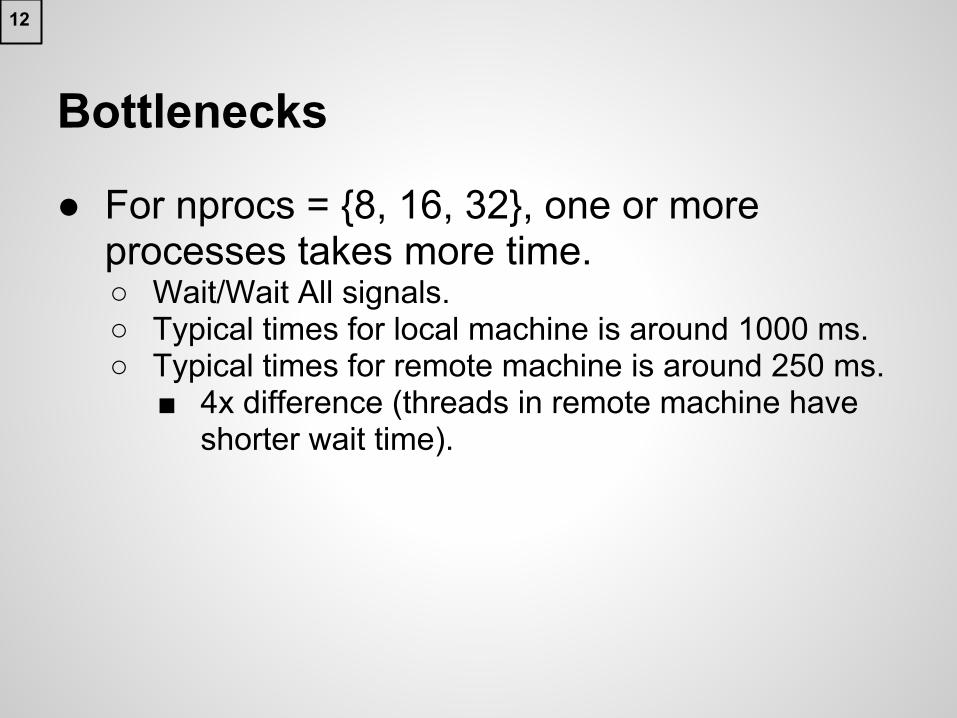
Bottlenecks
● For nprocs = {8, 16, 32}, one or more processes takes more time.○ Wait/Wait All signals.○ Typical times for local machine is around 1000 ms.○ Typical times for remote machine is around 250 ms.
■ 4x difference (threads in remote machine have shorter wait time).
12
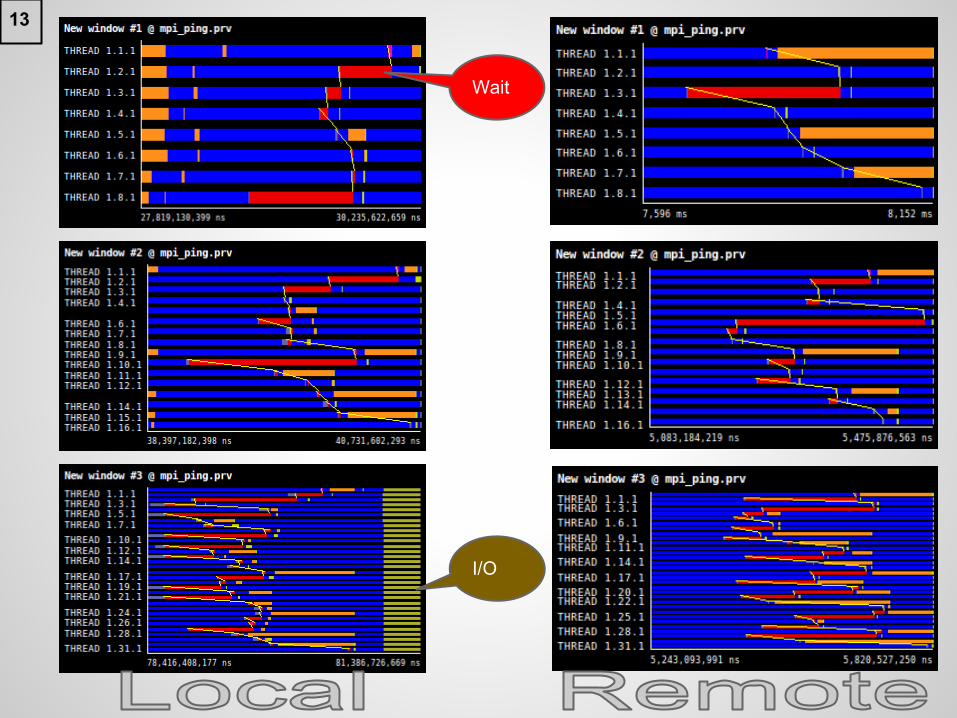
I/O
Wait
13
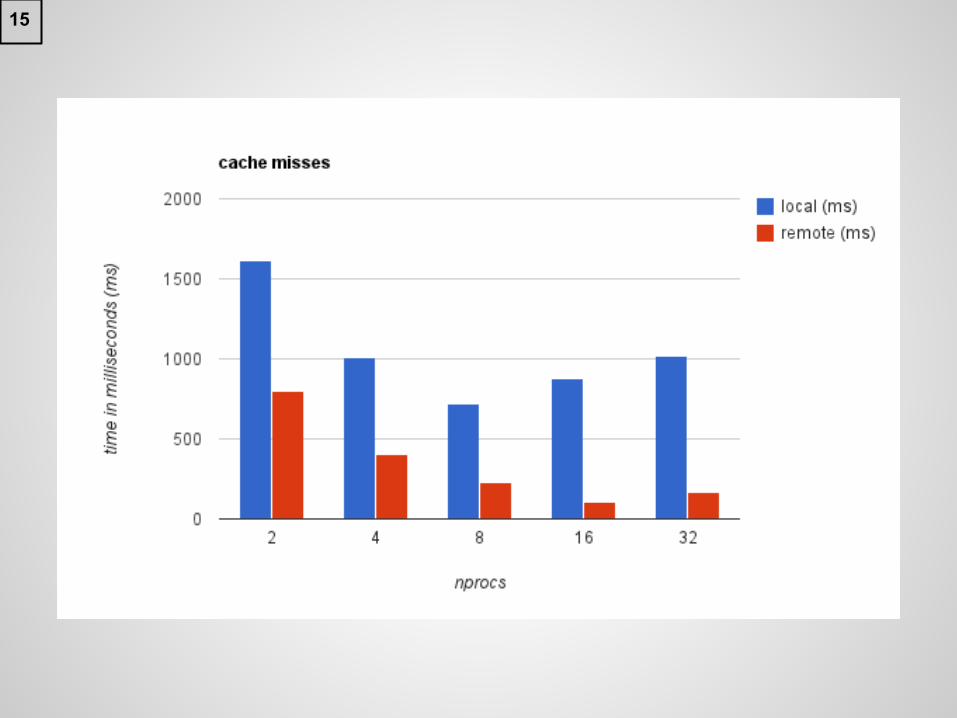
● Cache misses in local machine are more expensive: typically costing 5x more time.○ Cache size difference? Local has to "look"
elsewhere more often.■ i3 has 3MB cache.■ Xeon has 12MB cache.
L1 cache misses
14
15
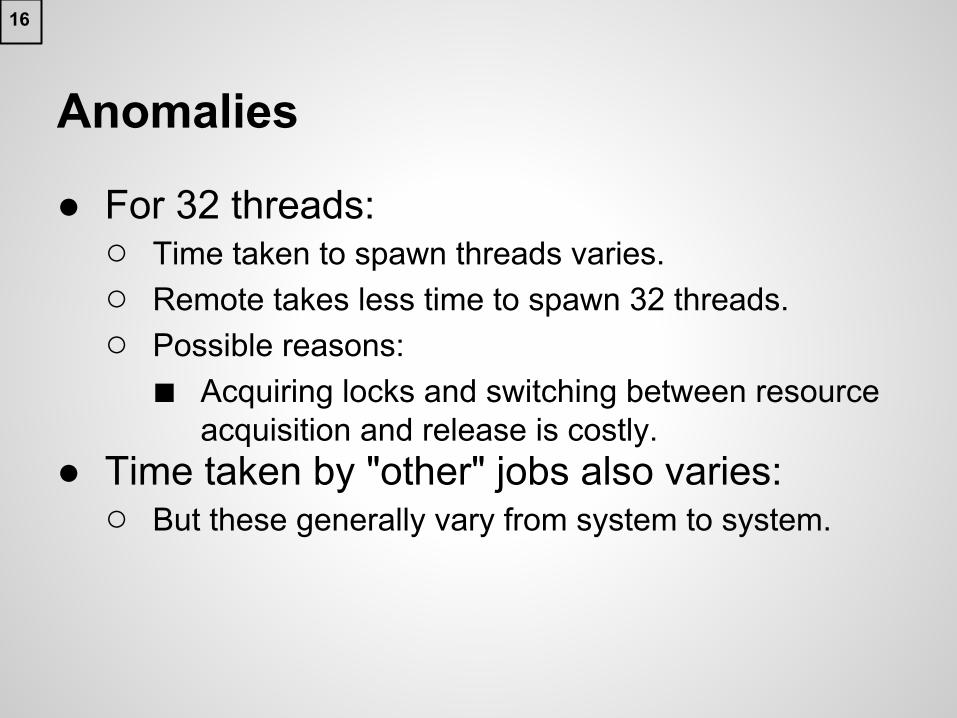
Anomalies
● For 32 threads:○ Time taken to spawn threads varies.○ Remote takes less time to spawn 32 threads.○ Possible reasons:
■ Acquiring locks and switching between resource acquisition and release is costly.
● Time taken by "other" jobs also varies:○ But these generally vary from system to system.
16
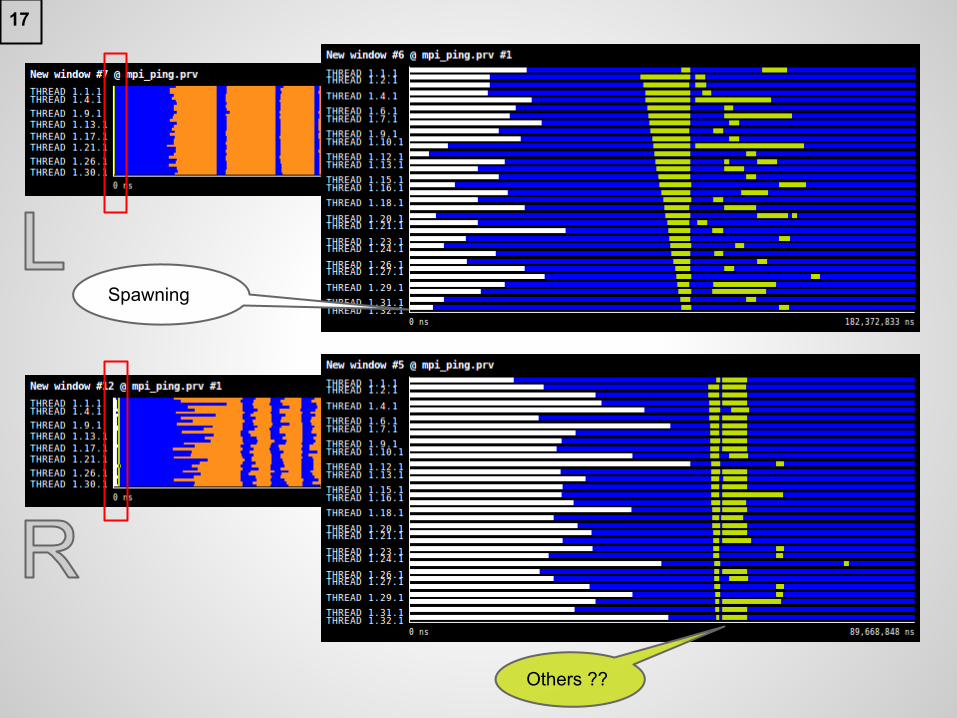
Spawning
Others ??
17
Conclusions
● Instrumentation is necessary to reveal performance insights of parallel code.
● Extrae supports a handy procedure for automatic instrumentation.
● Some interesting observations:○ IS does not properly scale on low-end machines
beyond 16 procs.○ Scales nicely on a server such as boada.○ IS code becomes communication intensive when
nprocs is increased.○ Some bottlenecks deteriorate performance.
18

Instrumentation and analysis of NPB
Zafar GilaniEMDC 2012
Measurement Tools and TechniquesUPC