Embed Size (px)
Citation preview
© Copyright IBM Corporation 2015. Technical University/Symposia materials may not be reproduced in whole or in part without the prior written permission of IBM.
pPL3090
Architecting Virtualized Environments: A Business Perspective
Charlie ClerEnterprise ArchitectForsythe [email protected]
2
Agenda
§ Introduction
§ Self assessment
§ PowerVM virtualization toolkit
§ Virtualized architectures and examples
3
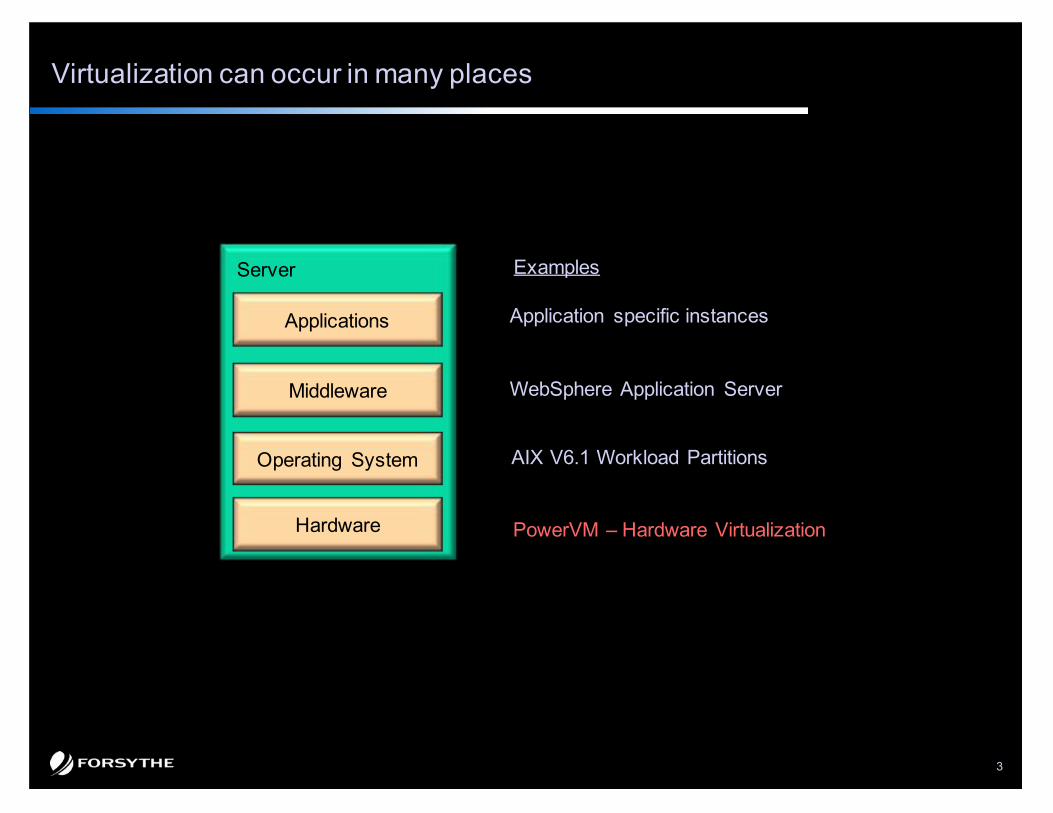
Hardware
Operating System
Middleware
Applications
PowerVM – Hardware Virtualization
AIX V6.1 Workload Partitions
WebSphere Application Server
Application specific instances
Server Examples
Virtualization can occur in many places
4
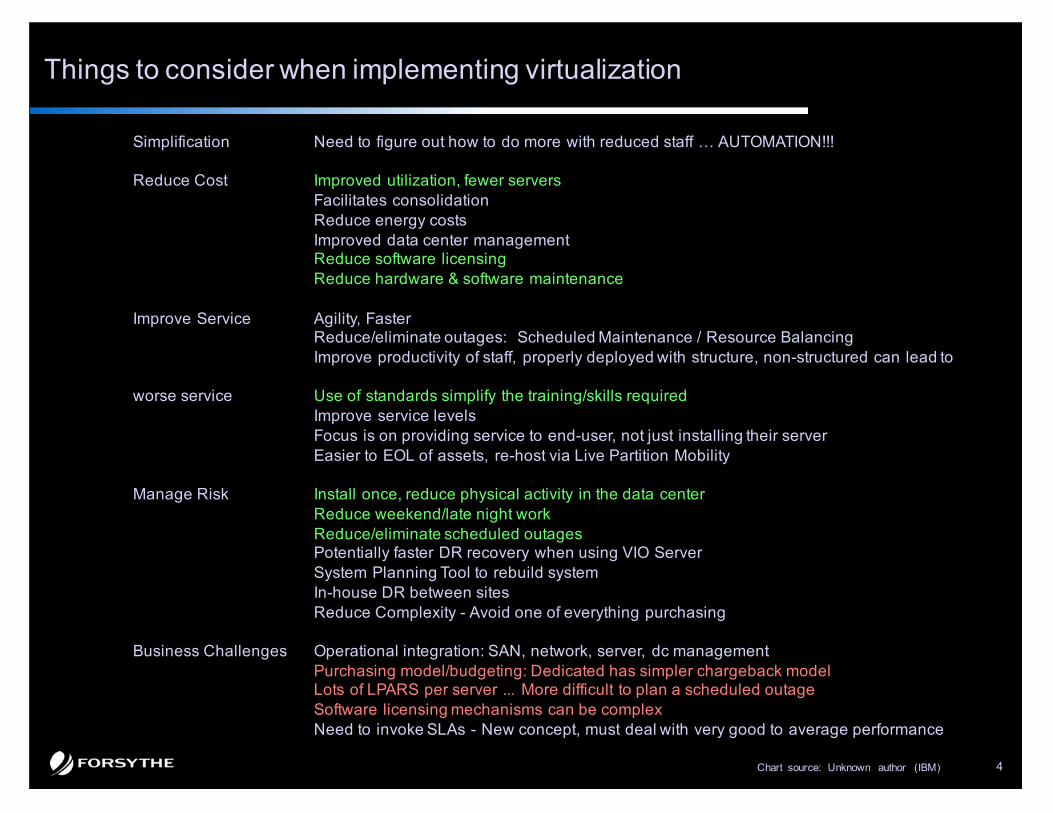
Things to consider when implementing virtualization
Simplification Need to figure out how to do more with reduced staff … AUTOMATION!!!
Reduce Cost Improved utilization, fewer serversFacilitates consolidationReduce energy costsImproved data center managementReduce software licensingReduce hardware & software maintenance
Improve Service Agility, FasterReduce/eliminate outages: Scheduled Maintenance / Resource BalancingImprove productivity of staff, properly deployed with structure, non-structured can lead to
worse service Use of standards simplify the training/skills requiredImprove service levelsFocus is on providing service to end-user, not just installing their serverEasier to EOL of assets, re-host via Live Partition Mobility
Manage Risk Install once, reduce physical activity in the data centerReduce weekend/late night workReduce/eliminate scheduled outagesPotentially faster DR recovery when using VIO Server System Planning Tool to rebuild systemIn-house DR between sitesReduce Complexity - Avoid one of everything purchasing
Business Challenges Operational integration: SAN, network, server, dc managementPurchasing model/budgeting: Dedicated has simpler chargeback modelLots of LPARS per server ... More difficult to plan a scheduled outageSoftware licensing mechanisms can be complexNeed to invoke SLAs - New concept, must deal with very good to average performance
Chart source: Unknown author (IBM)
5
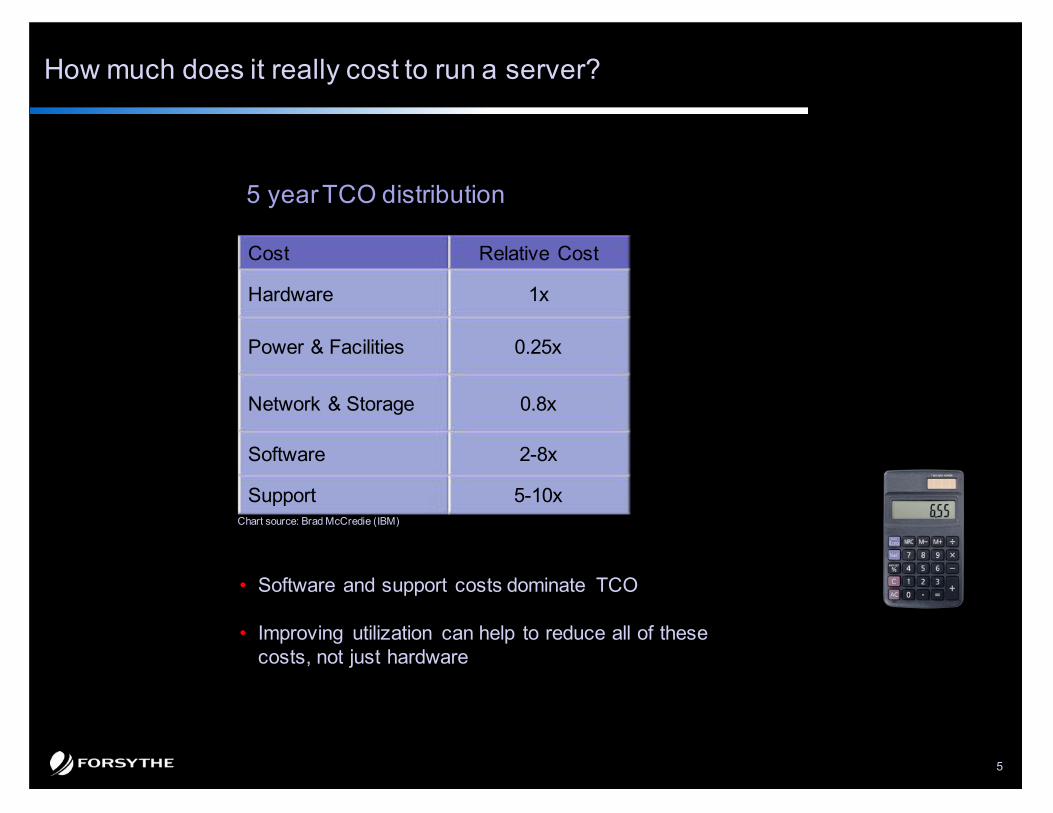
How much does it really cost to run a server?
• Software and support costs dominate TCO
• Improving utilization can help to reduce all of these costs, not just hardware
5 year TCO distribution
Chart source: Brad McCredie (IBM)
Cost Relative Cost
Hardware 1x
Power & Facilities 0.25x
Network & Storage 0.8x
Software 2-8x
Support 5-10x
6
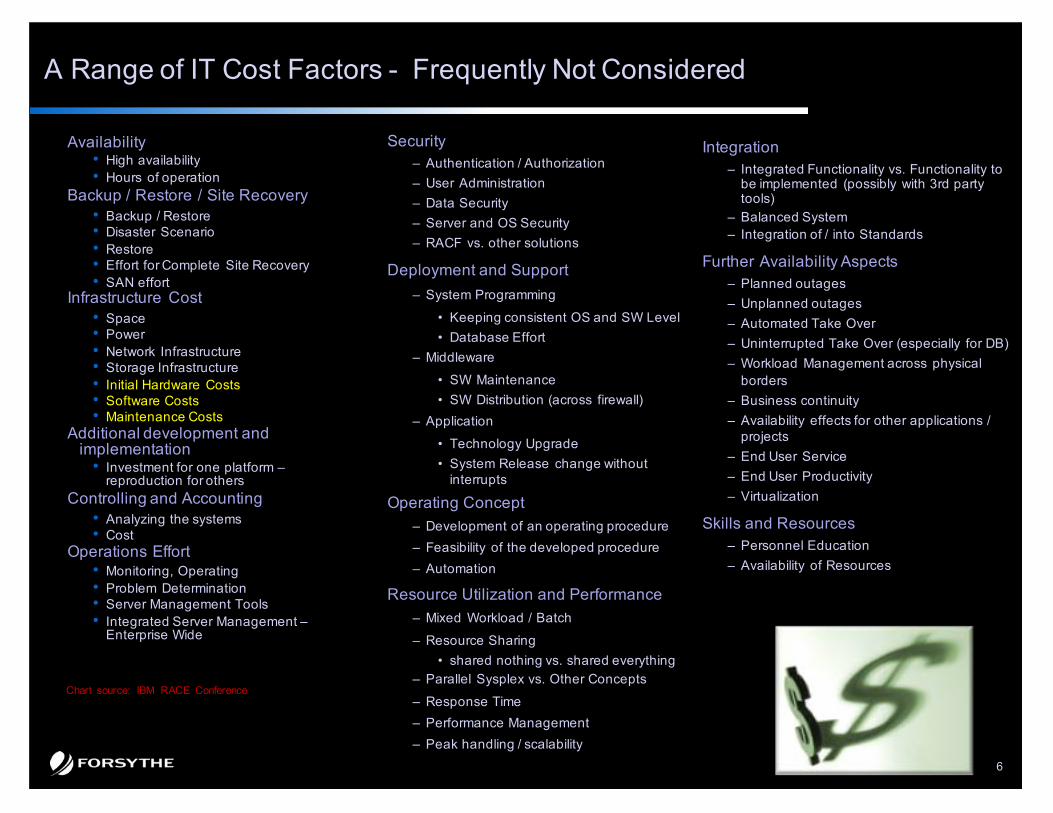
Availability• High availability• Hours of operation
Backup / Restore / Site Recovery• Backup / Restore• Disaster Scenario• Restore• Effort for Complete Site Recovery• SAN effort
Infrastructure Cost• Space• Power• Network Infrastructure• Storage Infrastructure• Initial Hardware Costs• Software Costs• Maintenance Costs
Additional development and implementation
• Investment for one platform –reproduction for others
Controlling and Accounting• Analyzing the systems• Cost
Operations Effort• Monitoring, Operating• Problem Determination• Server Management Tools• Integrated Server Management –
Enterprise Wide
A Range of IT Cost Factors - Frequently Not Considered
Integration– Integrated Functionality vs. Functionality to
be implemented (possibly with 3rd party tools)
– Balanced System– Integration of / into Standards
Further Availability Aspects– Planned outages– Unplanned outages– Automated Take Over– Uninterrupted Take Over (especially for DB) – Workload Management across physical
borders– Business continuity– Availability effects for other applications /
projects– End User Service– End User Productivity– Virtualization
Skills and Resources– Personnel Education– Availability of Resources
Security– Authentication / Authorization– User Administration– Data Security– Server and OS Security– RACF vs. other solutions
Deployment and Support – System Programming
• Keeping consistent OS and SW Level• Database Effort
– Middleware
• SW Maintenance• SW Distribution (across firewall)
– Application
• Technology Upgrade• System Release change without
interrupts
Operating Concept– Development of an operating procedure
– Feasibility of the developed procedure
– Automation
Resource Utilization and Performance– Mixed Workload / Batch
– Resource Sharing• shared nothing vs. shared everything
– Parallel Sysplex vs. Other Concepts
– Response Time
– Performance Management
– Peak handling / scalability
Chart source: IBM RACE Conference
7
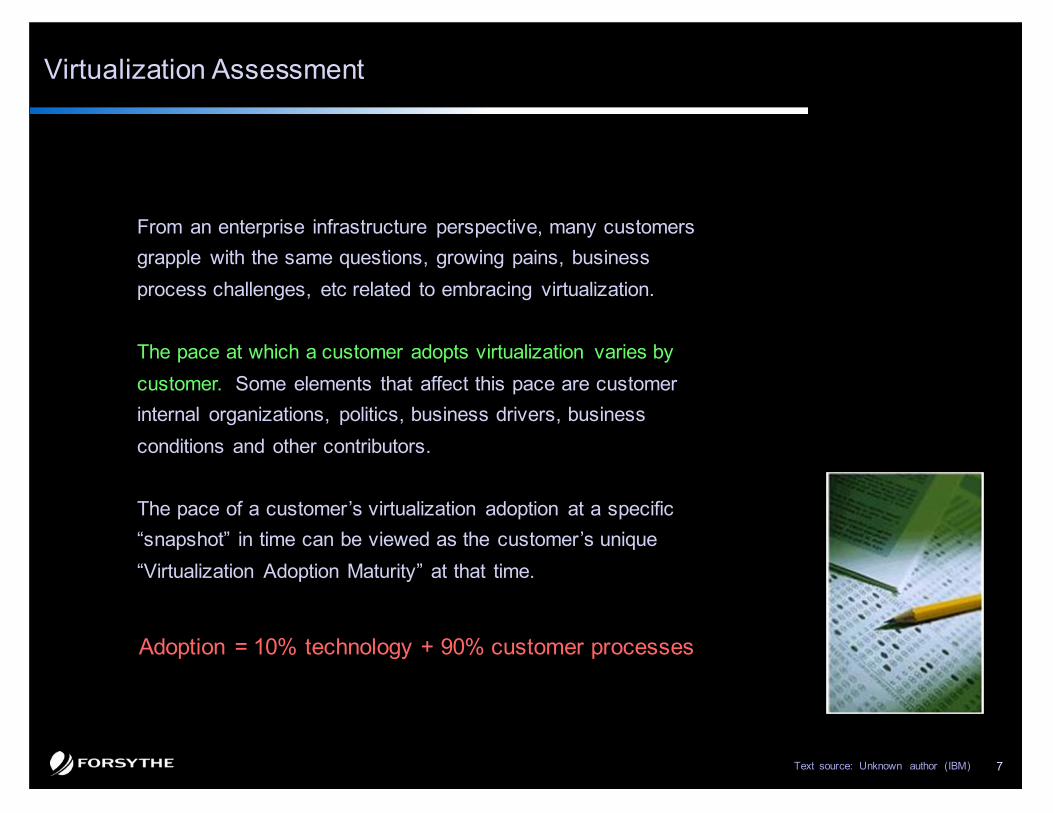
Virtualization Assessment
From an enterprise infrastructure perspective, many customers grapple with the same questions, growing pains, business
process challenges, etc related to embracing virtualization.
The pace at which a customer adopts virtualization varies by
customer. Some elements that affect this pace are customer internal organizations, politics, business drivers, business
conditions and other contributors.
The pace of a customer’s virtualization adoption at a specific “snapshot” in time can be viewed as the customer’s unique
“Virtualization Adoption Maturity” at that time.
Adoption = 10% technology + 90% customer processes
Text source: Unknown author (IBM)
8
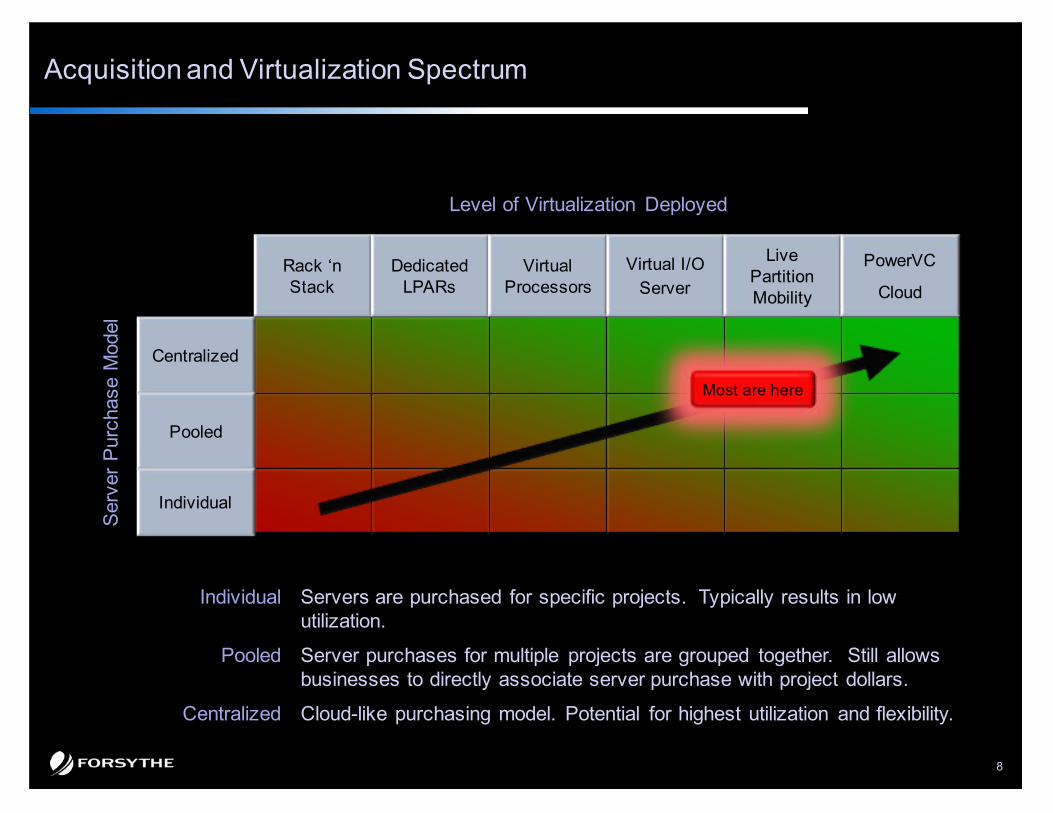
Rack ‘n Stack
Dedicated LPARs
Virtual Processors
Virtual I/OServer
Live Partition Mobility
PowerVC
Cloud
Centralized
Pooled
Individual
Acquisition and Virtualization SpectrumS
erve
r P
urch
ase
Mod
el
Level of Virtualization Deployed
Individual Servers are purchased for specific projects. Typically results in low utilization.
Pooled Server purchases for multiple projects are grouped together. Still allows businesses to directly associate server purchase with project dollars.
Centralized Cloud-like purchasing model. Potential for highest utilization and flexibility.
Most are here
9
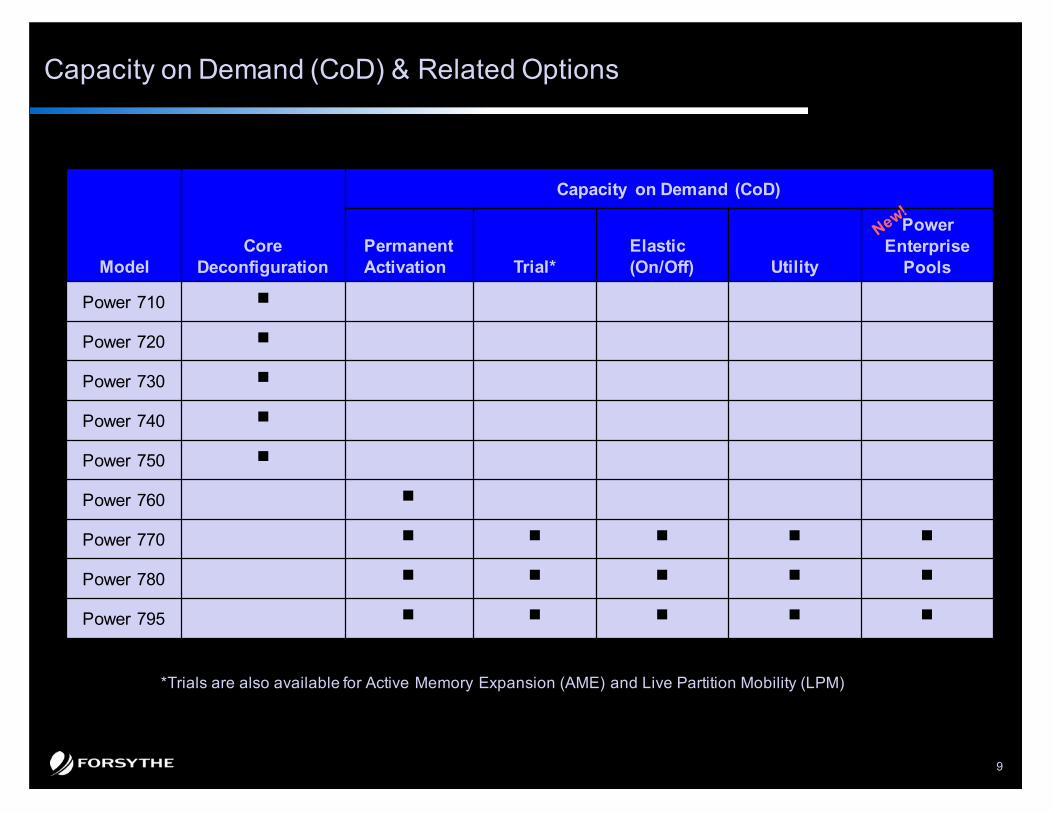
Capacity on Demand (CoD) & Related Options
*Trials are also available for Active Memory Expansion (AME) and Live Partition Mobility (LPM)
Model Core
Deconfiguration
Capacity on Demand (CoD)
PermanentActivation Trial*
Elastic(On/Off) Utility
Power Enterprise
Pools
Power 710 n
Power 720 n
Power 730 n
Power 740 n
Power 750 n
Power 760 n
Power 770 n n n n n
Power 780 n n n n n
Power 795 n n n n n
10
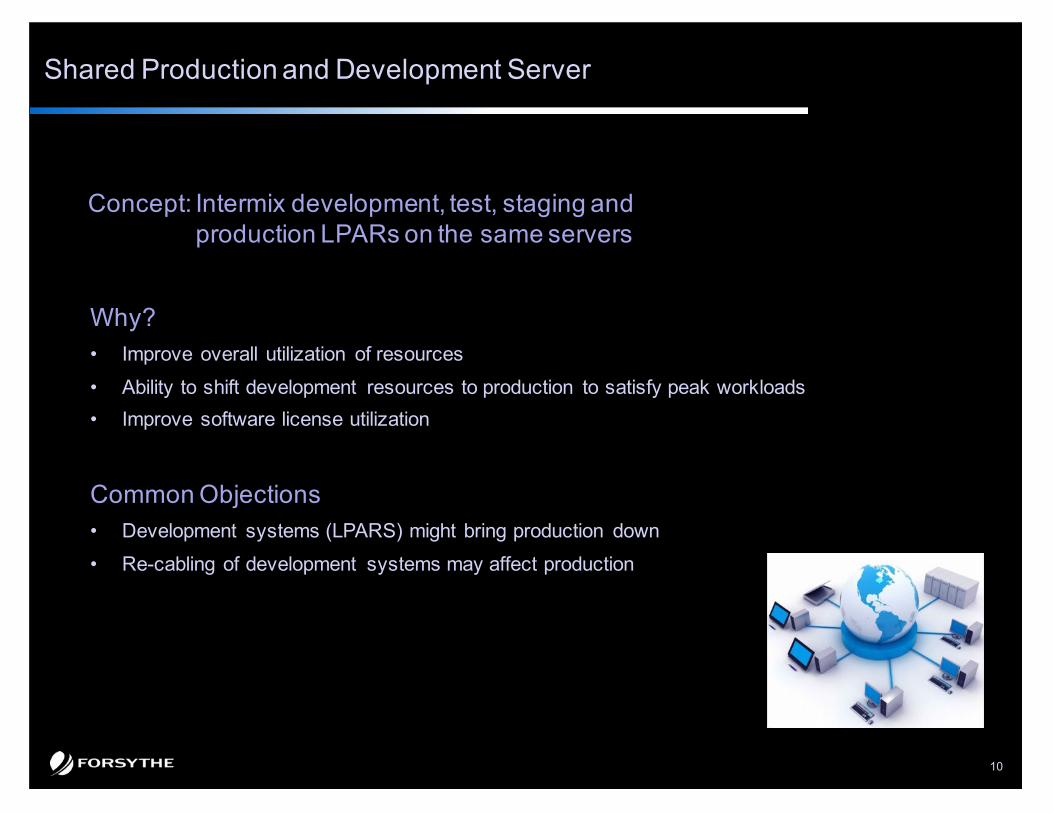
Shared Production and Development Server
Concept: Intermix development, test, staging and production LPARs on the same servers
Why?• Improve overall utilization of resources
• Ability to shift development resources to production to satisfy peak workloads
• Improve software license utilization
Common Objections• Development systems (LPARS) might bring production down
• Re-cabling of development systems may affect production
11
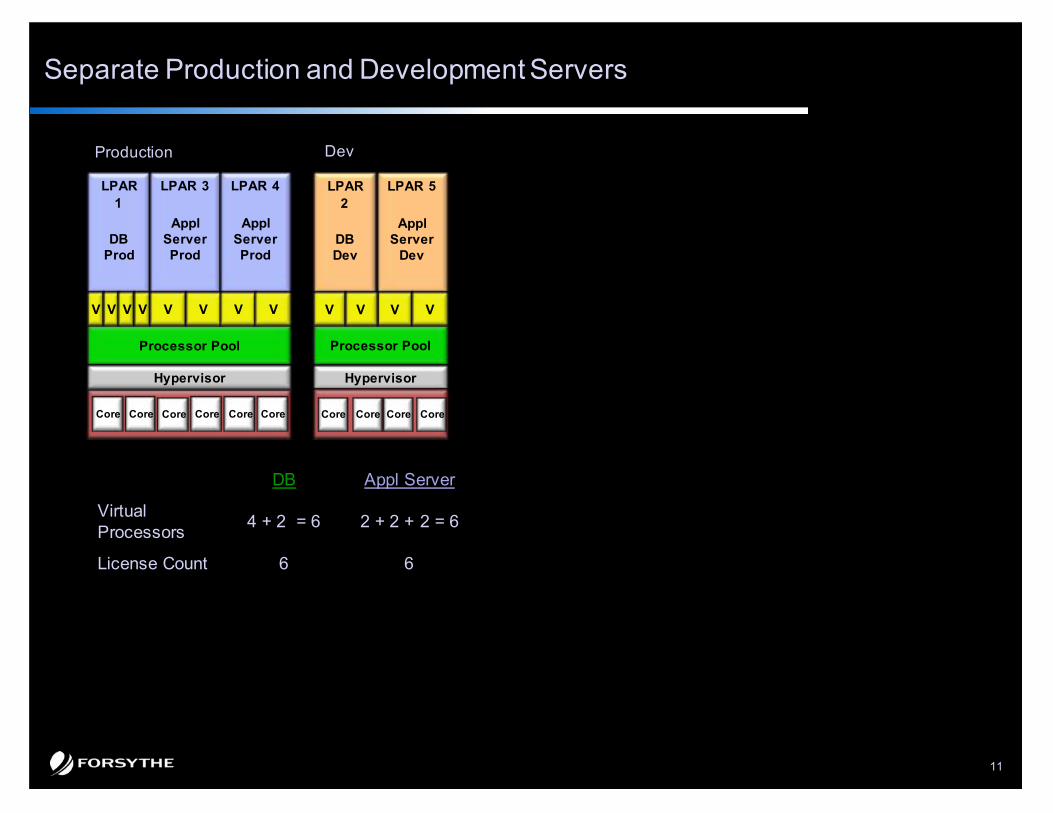
Separate Production and Development Servers
DB Appl Server
Virtual Processors
4 + 2 = 6 2 + 2 + 2 = 6
License Count 6 6
LPAR 1
DB Prod
LPAR 3
Appl Server Prod
LPAR 4
Appl Server Prod
LPAR 5
Appl Server
Dev
Processor Pool
V V V V V V
LPAR 2
DB Dev
V V
Processor Pool
Hypervisor Hypervisor
Core CoreCoreCoreCoreCore
V VV V
CoreCore Core Core
Production Dev
12
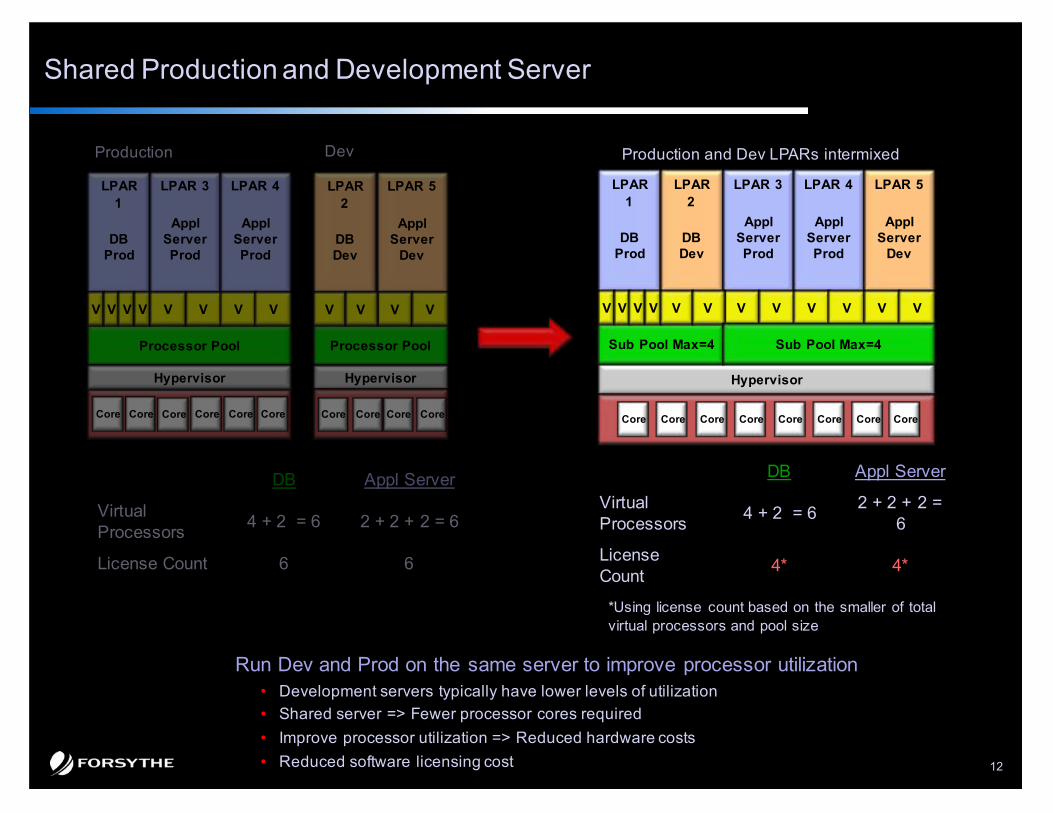
Shared Production and Development Server
DB Appl Server
Virtual Processors
4 + 2 = 6 2 + 2 + 2 = 6
License Count
4* 4*
Run Dev and Prod on the same server to improve processor utilization• Development servers typically have lower levels of utilization• Shared server => Fewer processor cores required• Improve processor utilization => Reduced hardware costs• Reduced software licensing cost
LPAR 1
DB Prod
LPAR 2
DB Dev
LPAR 3
Appl Server Prod
LPAR 4
Appl Server Prod
LPAR 5
Appl Server
Dev
Hypervisor
Core Core Core CoreCoreCoreCoreCore
Sub Pool Max=4
V V V V V V V V
DB Appl Server
Virtual Processors
4 + 2 = 6 2 + 2 + 2 = 6
License Count 6 6
LPAR 1
DB Prod
LPAR 3
Appl Server Prod
LPAR 4
Appl Server Prod
LPAR 5
Appl Server
Dev
Processor Pool
V V V V V V
LPAR 2
DB Dev
V V
Processor Pool
Hypervisor Hypervisor
Core CoreCoreCoreCoreCore
V VV V
CoreCore Core Core
V VV V
Sub Pool Max=4
*Using license count based on the smaller of total virtual processors and pool size
Production Dev Production and Dev LPARs intermixed
13
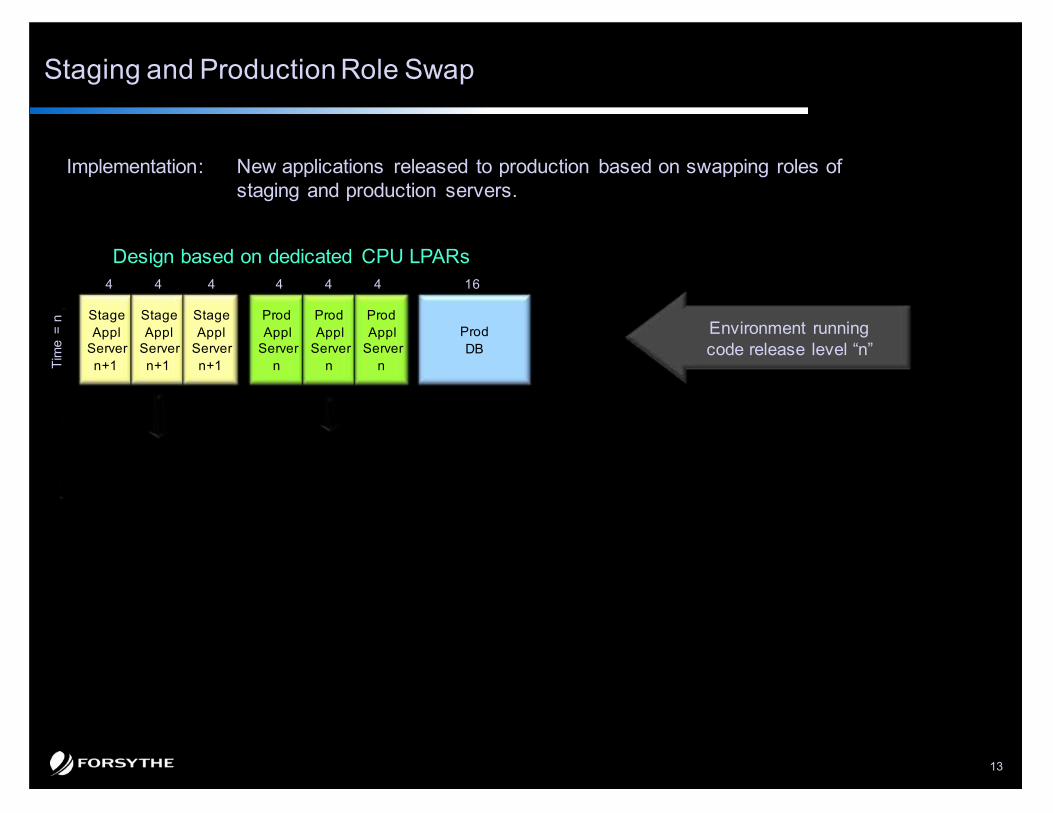
Staging and Production Role Swap
ProdDB
ProdAppl
Servern
ProdAppl
Servern
ProdAppl
Servern
StageAppl
Servern+1
StageAppl
Servern+1
StageAppl
Servern+1
Design based on dedicated CPU LPARs4 4 4 4 4 4 16
Implementation: New applications released to production based on swapping roles of staging and production servers.
Tim
e =
n
Environment running code release level “n”

14
Staging and Production Role Swap
ProdDB
ProdAppl
Servern
ProdAppl
Servern
ProdAppl
Servern
StageAppl
Servern+1
StageAppl
Servern+1
StageAppl
Servern+1
ProdDB
ProdAppl
Servern+1
ProdAppl
Servern+1
ProdAppl
Servern+1
StageAppl
Servern+2
StageAppl
Servern+2
StageAppl
Servern+2
Design based on dedicated CPU LPARs4 4 4 4 4 4 16
4 4 4 4 4 4 16
24 Licensed Appl Server Cores
Implementation: New applications released to production based on swapping roles of staging and production servers.
Staging servers and productions roles are reversed with each new application release. This environment requires that all staging and application servers be the same size for both CPUs and memory.
Tim
e =
nTi
me
= n
+ 1
Environment running code release level “n+1”
Environment running code release level “n”

15
Staging and Production Swap
Shared Processor Pool
ProdDB
ProdAppl
Servern
ProdAppl
Servern
ProdAppl
Servern
Stage A
pplS
tage Appl
Stage A
ppl
.2 .2 .2 4 4 4 12
ProdDB
ProdAppl
Servern
ProdAppl
Servern
ProdAppl
Servern
StageAppl
Servern+1
StageAppl
Servern+1
StageAppl
Servern+1
ProdDB
ProdAppl
Servern+1
ProdAppl
Servern+1
ProdAppl
Servern+1
StageAppl
Servern+2
StageAppl
Servern+2
StageAppl
Servern+2
Design based on dedicated CPU LPARs Using Shared Processor Pool4 4 4 4 4 4 16
4 4 4 4 4 4 16
24 Licensed Appl Server Cores
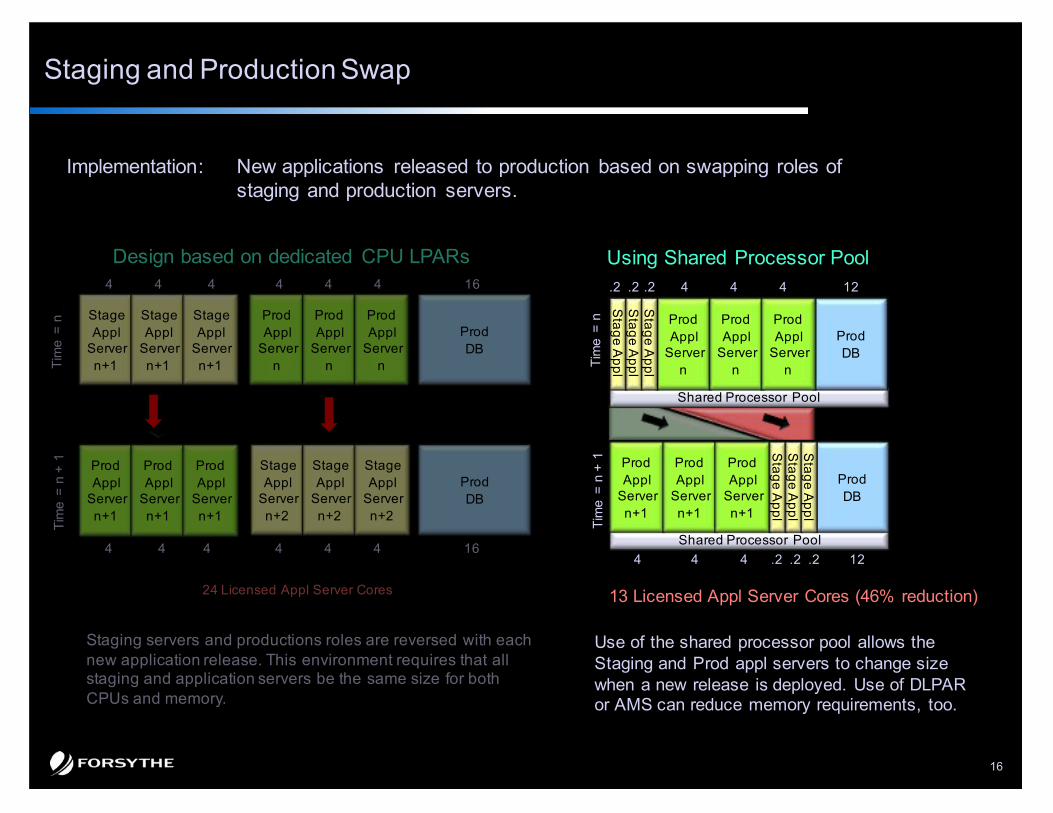
Implementation: New applications released to production based on swapping roles of staging and production servers.
Use of the shared processor pool allows the Staging and Prod appl servers to have their core allocations match their requirements.
Tim
e =
nTi
me
= n
+ 1
Tim
e =
n
Staging servers and productions roles are reversed with each new application release. This environment requires that all staging and application servers be the same size for both CPUs and memory.
16
Staging and Production Swap
Shared Processor Pool
ProdDB
ProdAppl
Servern
ProdAppl
Servern
ProdAppl
Servern
Stage A
pplS
tage Appl
Stage A
ppl
.2 .2 .2 4 4 4 12
Shared Processor Pool
ProdDB
ProdAppl
Servern+1
ProdAppl
Servern+1
ProdAppl
Servern+1
Stage A
pplS
tage Appl
Stage A
ppl
4 4 4 .2 .2 .2 12
ProdDB
ProdAppl
Servern
ProdAppl
Servern
ProdAppl
Servern
StageAppl
Servern+1
StageAppl
Servern+1
StageAppl
Servern+1
ProdDB
ProdAppl
Servern+1
ProdAppl
Servern+1
ProdAppl
Servern+1
StageAppl
Servern+2
StageAppl
Servern+2
StageAppl
Servern+2
Design based on dedicated CPU LPARs Using Shared Processor Pool4 4 4 4 4 4 16
4 4 4 4 4 4 16
24 Licensed Appl Server Cores
Implementation: New applications released to production based on swapping roles of staging and production servers.
Use of the shared processor pool allows the Staging and Prod appl servers to change size when a new release is deployed. Use of DLPAR or AMS can reduce memory requirements, too.
13 Licensed Appl Server Cores (46% reduction)
Tim
e =
nTi
me
= n
+ 1
Tim
e =
nTi
me
= n
+ 1
Staging servers and productions roles are reversed with each new application release. This environment requires that all staging and application servers be the same size for both CPUs and memory.
17
Live Partition Mobility – Potential Uses
1. Scheduled maintenanceEvacuate a server so that you can perform scheduled maintenance activities like firmware upgrades, non hot-plug service activities, etc.
2. Workload rebalancingMove an LPAR to another server that has more CPU or memory resources required to satisfy application demands.
3. End of service life migrationMigrate all running LPARs from an older system to a new system so that the older system can be retired.
18
Live Partition Mobility: Architecture Examples
1 2 3 4Perform Service1
2
3 4
2 2
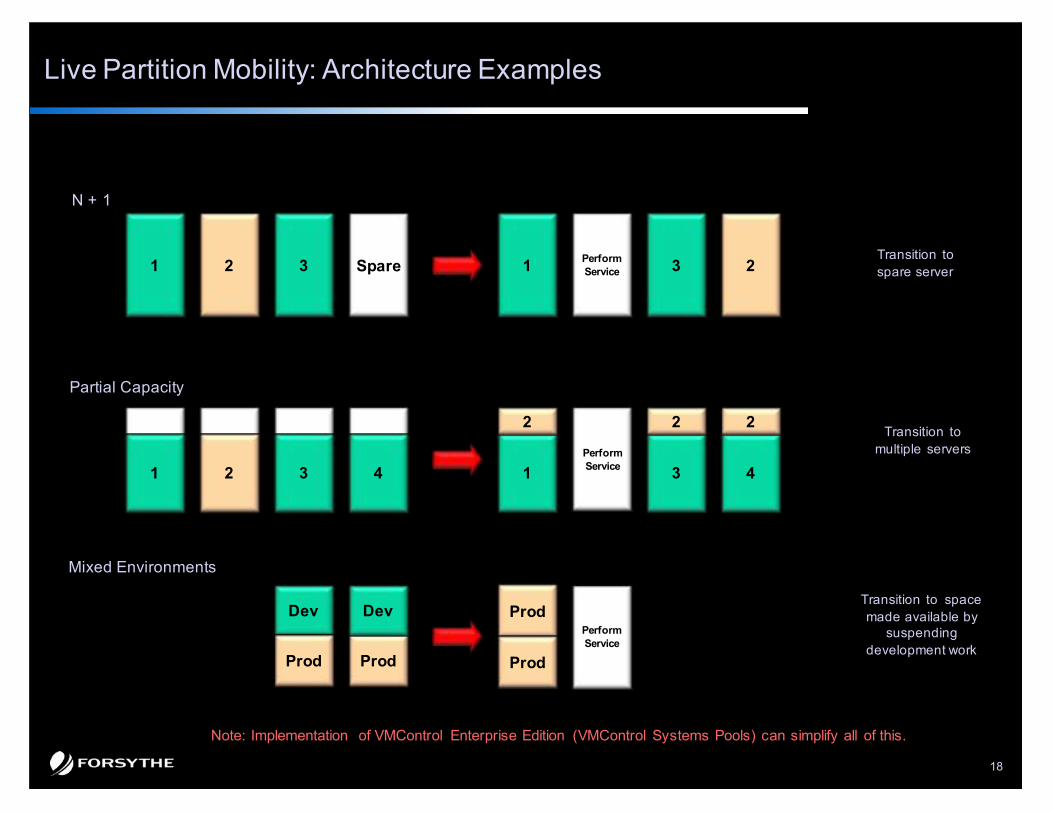
N + 1
Partial Capacity
Mixed Environments
Transition to space made available by
suspending development work
Transition to multiple servers
Transition to spare server
Prod
Prod
Dev Dev
ProdProd
Perform Service
Spare1 2 3 1 23Perform Service
Note: Implementation of VMControl Enterprise Edition (VMControl Systems Pools) can simplify all of this.
19
Live Partition Mobility: N+1
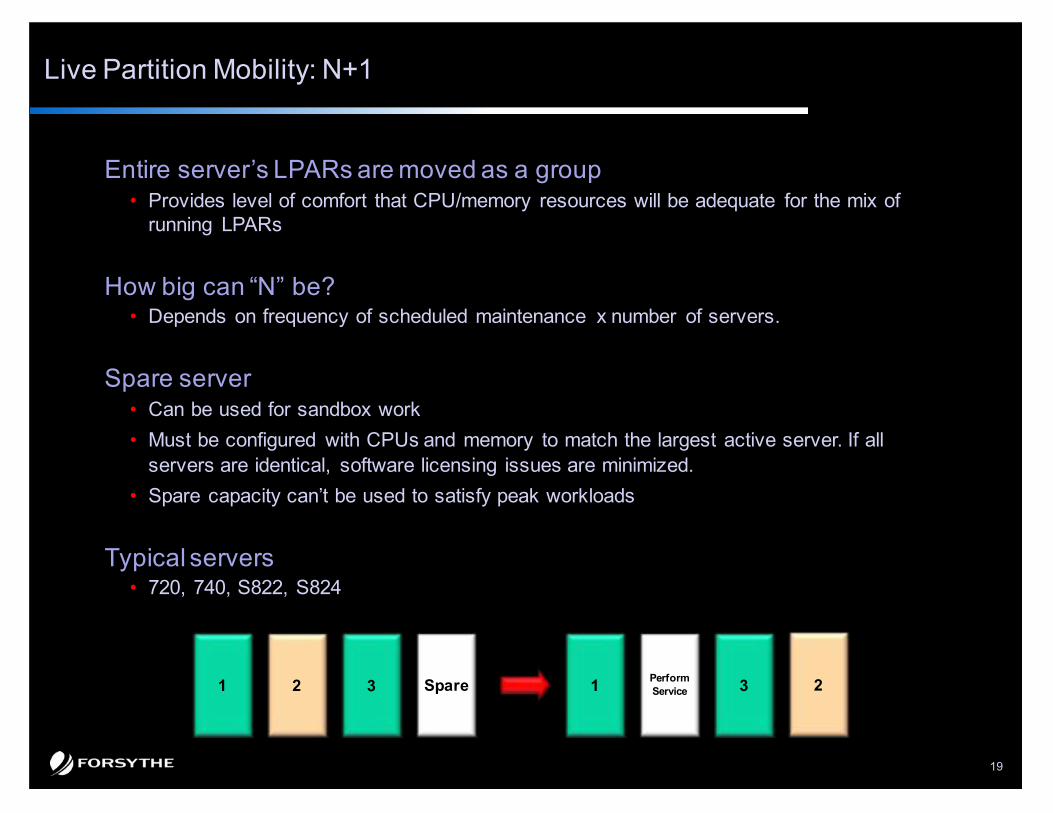
Entire server’s LPARs are moved as a group• Provides level of comfort that CPU/memory resources will be adequate for the mix of
running LPARs
How big can “N” be?• Depends on frequency of scheduled maintenance x number of servers.
Spare server• Can be used for sandbox work• Must be configured with CPUs and memory to match the largest active server. If all
servers are identical, software licensing issues are minimized.• Spare capacity can’t be used to satisfy peak workloads
Typical servers• 720, 740, S822, S824
Spare1 2 3 1 23Perform Service

20
Live Partition Mobility: Partial Capacity
Server’s LPARs are distributed among the other servers in the group• Resources (white space) are reserved on each server to support the evacuation of
the largest server in the group.
• As more servers are added, no addition reserve will be required (see server #5).
• Requires planning to figure out where to migrate LPARs to. Future automation might simplify this task
Benefits• Under normal conditions, excess CPU/memory capacity on servers can be used to
handle peak workloads
• White space can be CoD that is activated via On/Off during an active migration
Typical servers• 750, 770, 780, S824, E850, E870, E880
1 2 3 4Perform Service1
2
3 4
2 2
5 5
21
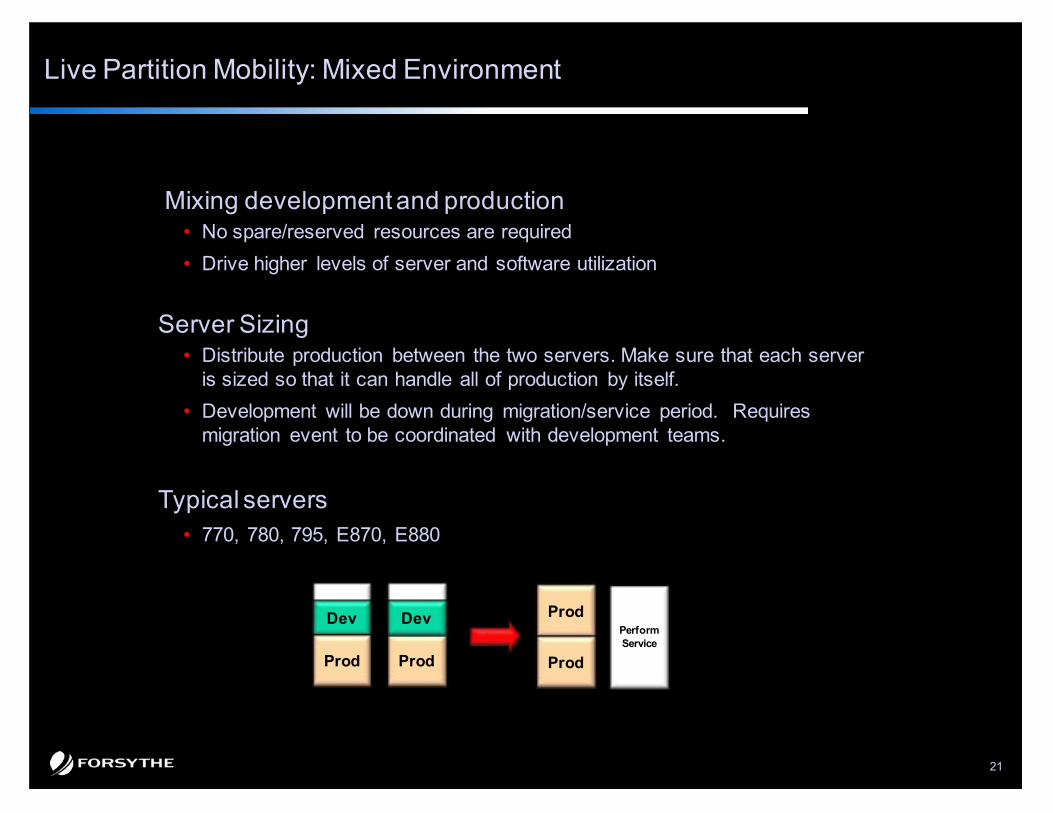
Live Partition Mobility: Mixed Environment
Mixing development and production• No spare/reserved resources are required
• Drive higher levels of server and software utilization
Server Sizing• Distribute production between the two servers. Make sure that each server
is sized so that it can handle all of production by itself.
• Development will be down during migration/service period. Requires migration event to be coordinated with development teams.
Typical servers• 770, 780, 795, E870, E880
Prod
Prod
Dev Dev
ProdProd
Perform Service
22
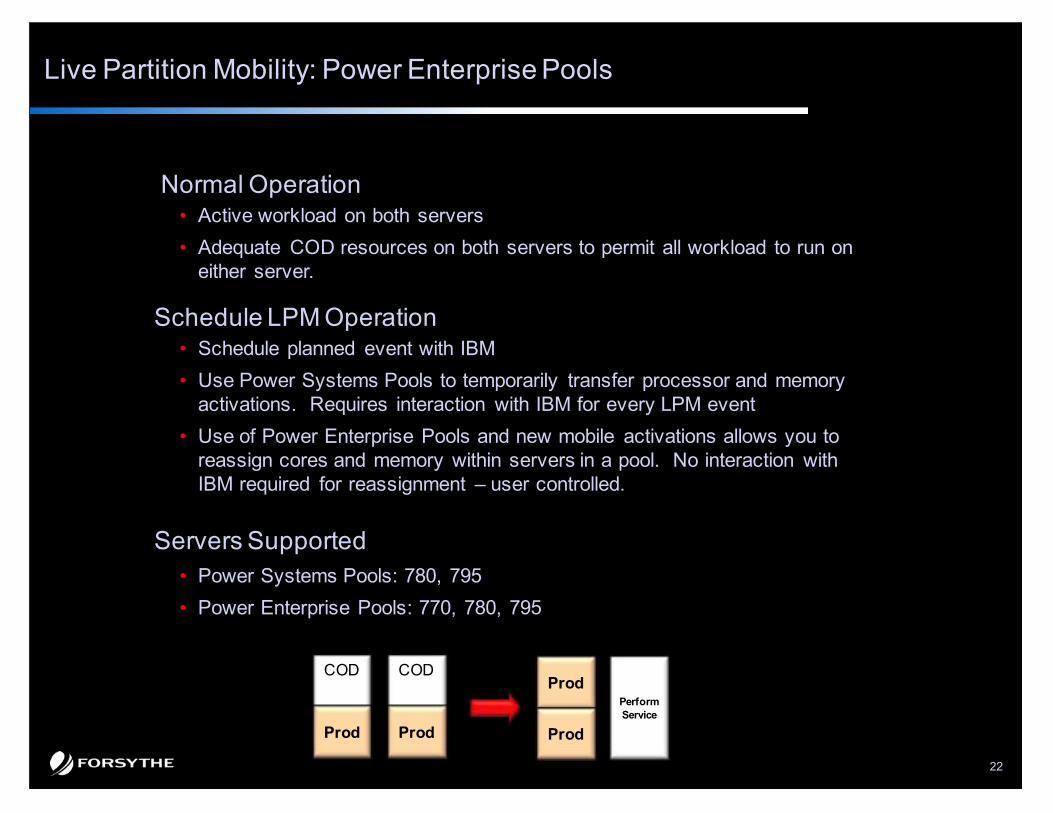
Live Partition Mobility: Power Enterprise Pools
Normal Operation• Active workload on both servers
• Adequate COD resources on both servers to permit all workload to run on either server.
Schedule LPM Operation• Schedule planned event with IBM
• Use Power Systems Pools to temporarily transfer processor and memory activations. Requires interaction with IBM for every LPM event
• Use of Power Enterprise Pools and new mobile activations allows you to reassign cores and memory within servers in a pool. No interaction with IBM required for reassignment – user controlled.
Servers Supported• Power Systems Pools: 780, 795
• Power Enterprise Pools: 770, 780, 795
COD CODProd
Prod ProdProd
Perform Service
23
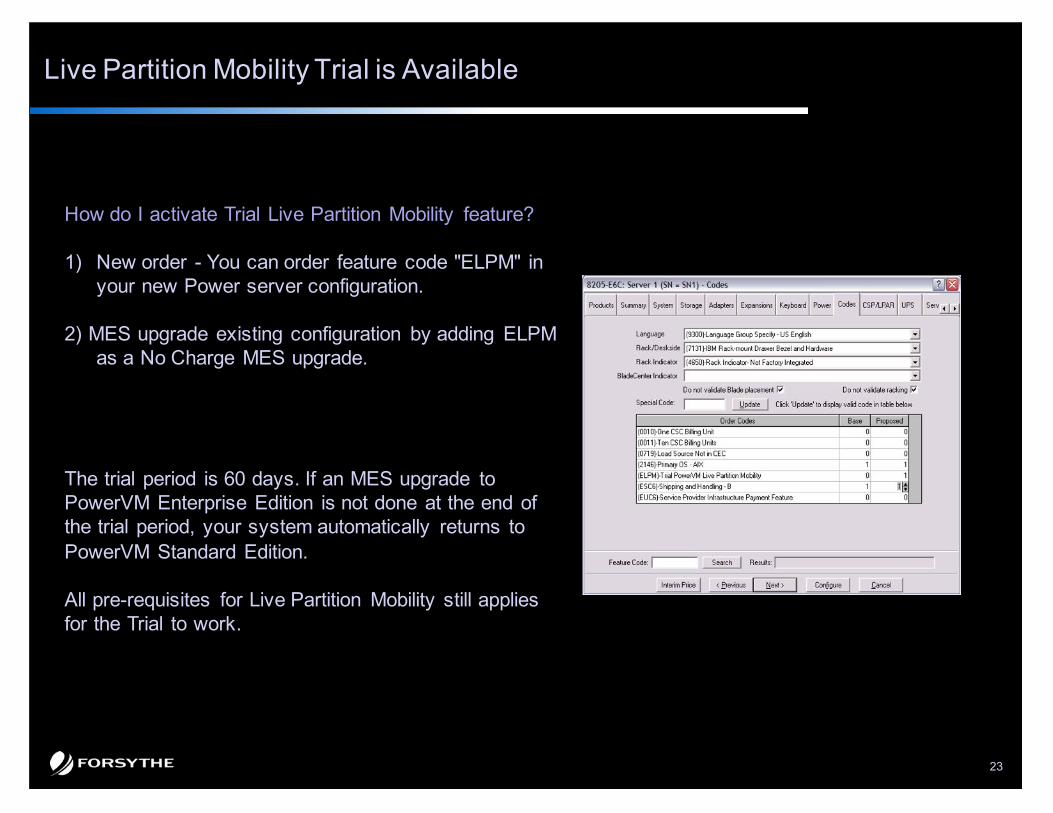
Live Partition Mobility Trial is Available
How do I activate Trial Live Partition Mobility feature?
1) New order - You can order feature code "ELPM" in your new Power server configuration.
2) MES upgrade existing configuration by adding ELPM as a No Charge MES upgrade.
The trial period is 60 days. If an MES upgrade to PowerVM Enterprise Edition is not done at the end of the trial period, your system automatically returns to PowerVM Standard Edition.
All pre-requisites for Live Partition Mobility still applies for the Trial to work.

24
Active Memory Sharing – PowerHA 5-to-1 Cluster
Design considerations• PowerHA cluster with many-to-1 cluster backup
• Shared Memory Pool reduces memory requirement on backup server
PowerHA
Hot Standby
PowerHA
Hot Standby
PowerHA
Hot Standby
PowerHA
Hot Standby
PowerHA
Hot Standby
Hypervisor
Shared Memory Pool (80 GB)
4 GB4 GB4 GB 4 GB 4 GB
VIO #2VIO #1
2 GB 2 GB
PowerHA
Production Server
64 GB
PowerHA
Production Server
64 GB
PowerHA
Production Server
64 GB
PowerHA
Production Server
64 GB
PowerHA
Production Server
64 GB
824 Production Servers 824 Stand-by Server
Dedicated Memory
25
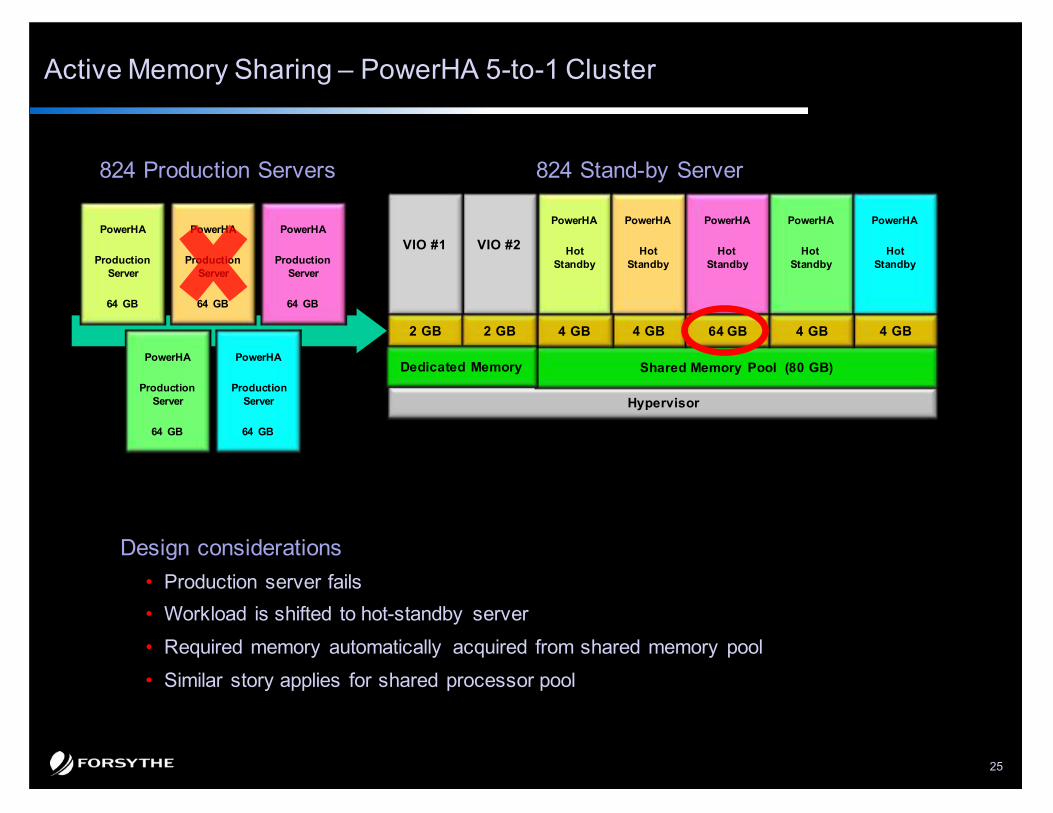
Active Memory Sharing – PowerHA 5-to-1 Cluster
Design considerations• Production server fails
• Workload is shifted to hot-standby server
• Required memory automatically acquired from shared memory pool
• Similar story applies for shared processor pool
PowerHA
Hot Standby
PowerHA
Hot Standby
PowerHA
Hot Standby
PowerHA
Hot Standby
PowerHA
Hot Standby
Hypervisor
Shared Memory Pool (80 GB)
4 GB4 GB4 GB 64 GB 4 GB
VIO #2VIO #1
2 GB 2 GB
PowerHA
Production Server
64 GB
PowerHA
Production Server
64 GB
PowerHA
Production Server
64 GB
PowerHA
Production Server
64 GB
PowerHA
Production Server
64 GB
824 Production Servers 824 Stand-by Server
Dedicated Memory
26
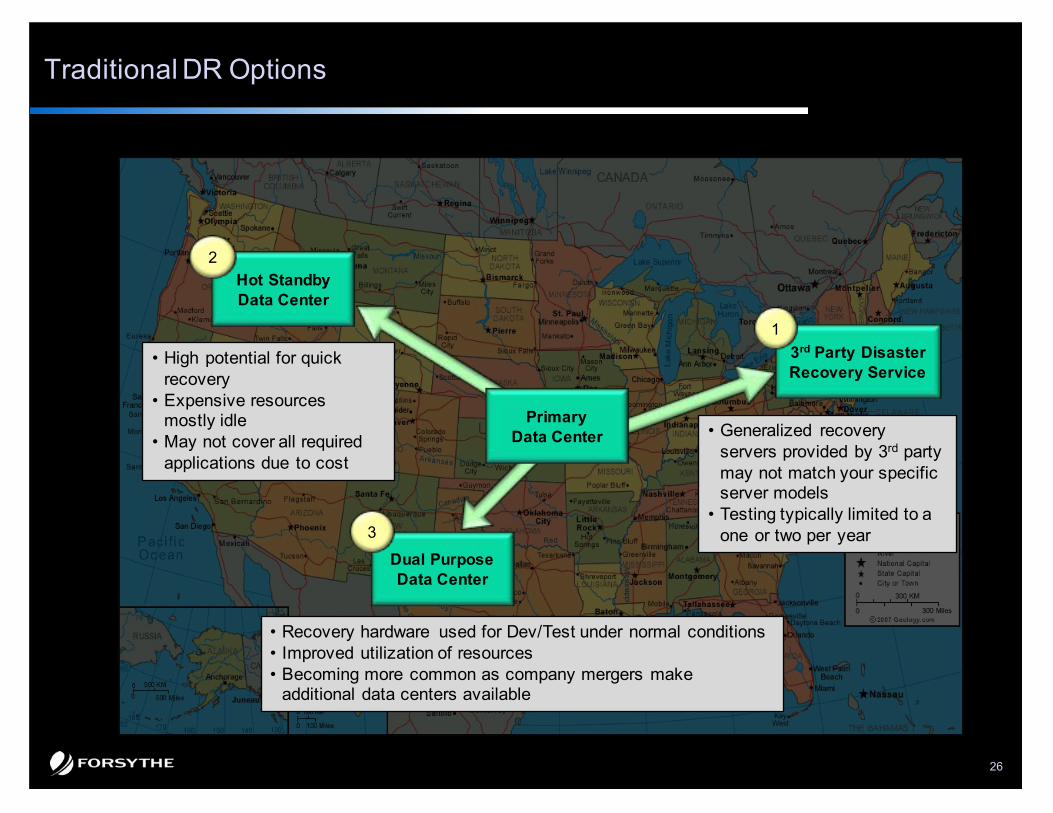
Traditional DR Options
PrimaryData Center
3rd Party Disaster Recovery Service
Hot Standby Data Center
Dual Purpose Data Center
• High potential for quick recovery
• Expensive resources mostly idle
• May not cover all required applications due to cost
• Generalized recovery servers provided by 3rd party may not match your specific server models
• Testing typically limited to a one or two per year
• Recovery hardware used for Dev/Test under normal conditions• Improved utilization of resources• Becoming more common as company mergers make
additional data centers available
1
2
3
27
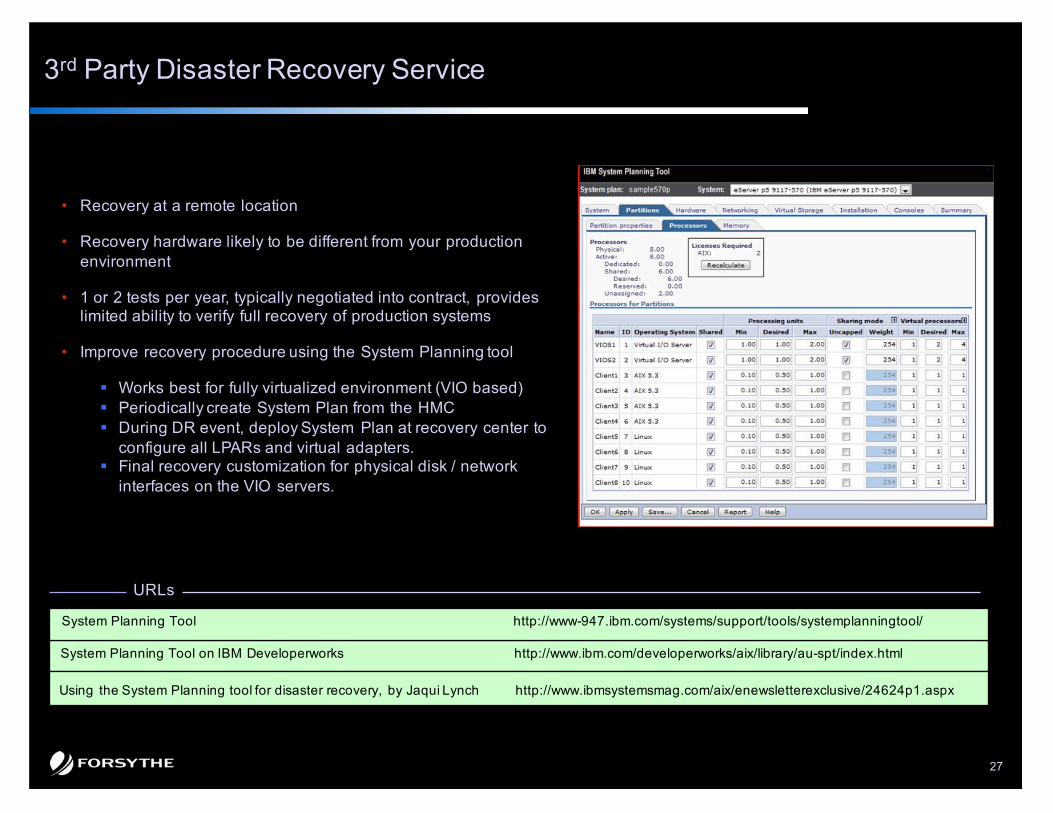
• Recovery at a remote location
• Recovery hardware likely to be different from your production environment
• 1 or 2 tests per year, typically negotiated into contract, provides limited ability to verify full recovery of production systems
• Improve recovery procedure using the System Planning tool
§ Works best for fully virtualized environment (VIO based)§ Periodically create System Plan from the HMC§ During DR event, deploy System Plan at recovery center to
configure all LPARs and virtual adapters. § Final recovery customization for physical disk / network
interfaces on the VIO servers.
3rd Party Disaster Recovery Service
System Planning Tool http://www-947.ibm.com/systems/support/tools/systemplanningtool/
URLs
http://www.ibmsystemsmag.com/aix/enewsletterexclusive/24624p1.aspxUsing the System Planning tool for disaster recovery, by Jaqui Lynch
System Planning Tool on IBM Developerworks http://www.ibm.com/developerworks/aix/library/au-spt/index.html
28
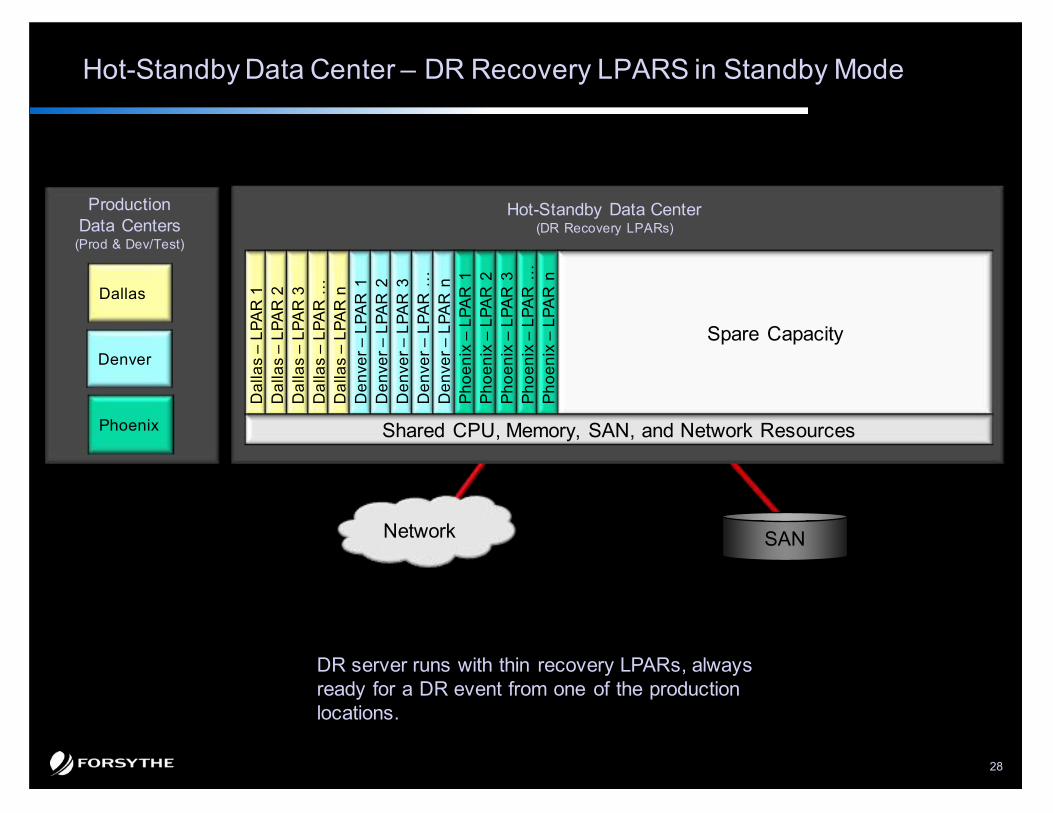
Hot-Standby Data Center – DR Recovery LPARS in Standby Mode
Dal
las
–LP
AR
1D
alla
s –
LPA
R 2
Dal
las
–LP
AR
3D
alla
s –
LPA
R …
Dal
las
–LP
AR
nD
enve
r –LP
AR
1D
enve
r –LP
AR
2D
enve
r –LP
AR
3D
enve
r –LP
AR
…
STL
–LP
AR
nP
hoen
ix –
LPA
R 1
Pho
enix
–LP
AR
2P
hoen
ix –
LPA
R 3
Pho
enix
–LP
AR
…P
hoen
ix –
LPA
R n
Den
ver –
LPA
R n
Spare Capacity
Shared CPU, Memory, SAN, and Network Resources
DR server runs with thin recovery LPARs, always ready for a DR event from one of the production locations.
Dallas
Denver
Phoenix
ProductionData Centers
(Prod & Dev/Test)
Hot-Standby Data Center(DR Recovery LPARs)
SANNetwork
29
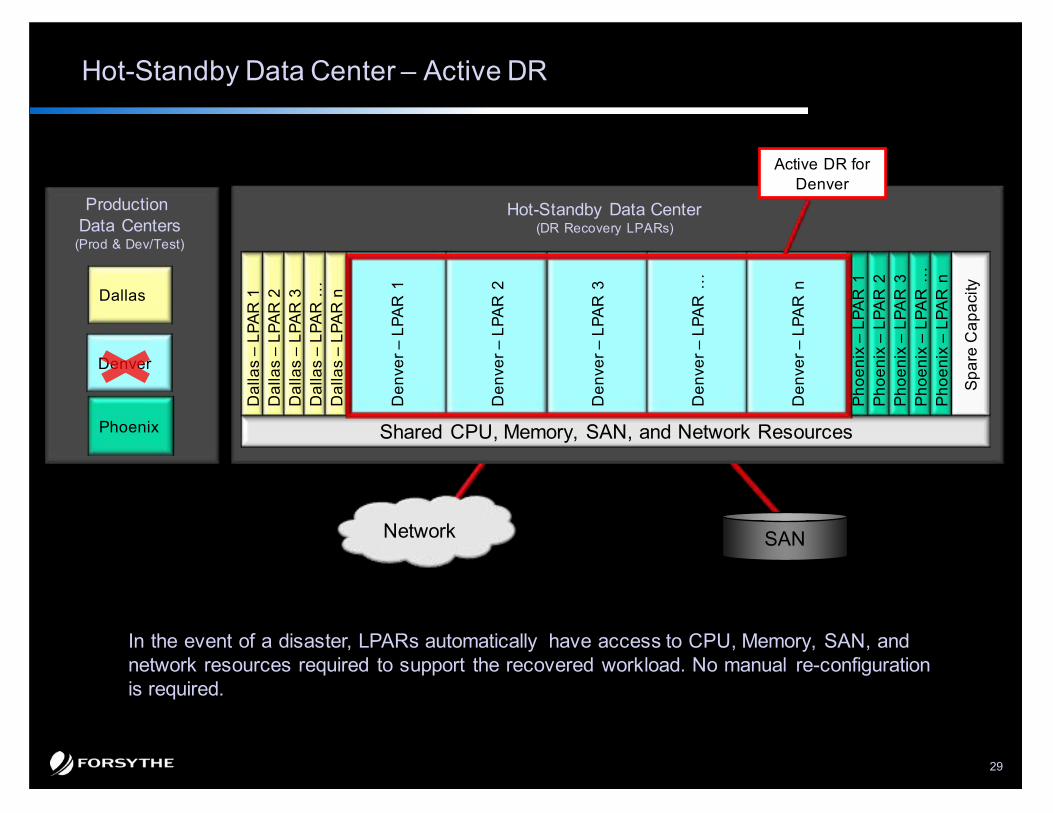
Hot-Standby Data Center – Active DR
Dallas
Denver
Phoenix
Dal
las
–LP
AR
1D
alla
s –
LPA
R 2
Dal
las
–LP
AR
3D
alla
s –
LPA
R …
STL
–LP
AR
nP
hoen
ix –
LPA
R 1
Pho
enix
–LP
AR
2P
hoen
ix –
LPA
R 3
Pho
enix
–LP
AR
…P
hoen
ix –
LPA
R n
Dal
las
–LP
AR
n
Den
ver –
LPA
R 1
Den
ver –
LPA
R 2
Den
ver –
LPA
R 3
Den
ver –
LPA
R …
Den
ver –
LPA
R n
Spa
re C
apac
ity
Shared CPU, Memory, SAN, and Network Resources
In the event of a disaster, LPARs automatically have access to CPU, Memory, SAN, and network resources required to support the recovered workload. No manual re-configuration is required.
SANNetwork
Production Data Centers
(Prod & Dev/Test)
Hot-Standby Data Center(DR Recovery LPARs)
Active DR for Denver

30
Den
ver –
1D
enve
r –2
Den
ver –
…D
enve
r –n
Den
ver –
Dev
Den
ver –
Dev
Den
ver –
Dev
Den
ver –
Dev
Den
ver –
Test
Den
ver –
3
Den
ver –
1D
enve
r –2
Den
ver –
…D
enve
r –n
Den
ver –
Dev
Den
ver –
Dev
Den
ver –
Dev
Den
ver –
Dev
Den
ver –
Test
Den
ver –
3
Dual Purpose Data Center – Normal Operation
Production data center servers can be smaller since they are no longer running Dev / Test.
At Dual Purpose data center, under normal operation, spare capacity is used to run Dev and Test LPARs. Thin, Live recovery LPARs continue to run.
SANNetwork
Shared CPU, Memory, SAN, and Network Resources
Pho
enix
–LP
AR
1P
hoen
ix –
LPA
R 2
Pho
enix
–LP
AR
…P
hoen
ix –
LPA
R n
Pho
enix
–D
ev
Pho
enix
–D
ev
Pho
enix
–D
ev
Pho
enix
–D
ev
Pho
enix
–Te
st
Pho
enix
–LP
AR
3
Server primarily used for Dev/test workloads
DR Recovery LPARs in standby mode
Dallas
Denver
Phoenix
ProductionData Center
(Prod & Dev)
Dallas
Denver
Phoenix

31
Den
ver –
1D
enve
r –2
Den
ver –
…D
enve
r –n
Den
ver –
Dev
Den
ver –
Dev
Den
ver –
Dev
Den
ver –
Dev
Den
ver –
Test
Den
ver –
3
Den
ver –
1D
enve
r –2
Den
ver –
…D
enve
r –n
Den
ver –
Dev
Den
ver –
Dev
Den
ver –
Dev
Den
ver –
Dev
Den
ver –
Test
Den
ver –
3
Dual Purpose Data Center – Active DR
Dallas
Denver
Phoenix
SANNetwork
ProductionData Center
(Prod & Dev)
Shared CPU, Memory, SAN, and Network Resources
Dallas
Denver
Phoenix
Dev/Test resources are reduced
Pho
enix
–D
ev
Pho
enix
–D
ev
Pho
enix
–D
ev
Pho
enix
–D
ev
Pho
enix
–te
st
Phoenix production data center has experienced a disaster.
Phoenix workload is transferred to the Dual Purpose data center where the Phoenix recovery LPARs automatically have access to required CPU, Memory, SAN, and network resources.
Phoenix development LPAR resources are reduced.
Pho
enix
–LP
AR
1
Pho
enix
–LP
AR
2
Pho
enix
–LP
AR
3
Pho
enix
–LP
AR
…
Pho
enix
–LP
AR
n
LPARs automatically expand to handle DR workload

32
Next steps…

33
Where is your business headed?
Is your company bringing together the application development, enterprise architecture, procurement, and facilities departments?
Which layer(s) of virtualization is your company currently using or planning to investigate?
34
Additional Information
www.ibm.com/redbooks
• PowerVM Virtualization on IBM System p Introduction and Configuration (SG24-7940)
• PowerVM Virtualization on IBM System p Managing and Monitoring (SG24-7590)
• IBM PowerVM Live Partition Mobility (SG24-7460)
• PowerVM Virtualization Active Memory Sharing (REDP-4470)
35
Trademarks
The following are trademarks of the International Business Machines Corporation in the United States, other countries, or both.
The following are trademarks or registered trademarks of other companies.
* All other products may be trademarks or registered trademarks of their respective companies.
Notes: Performance is in Internal Throughput Rate (ITR) ratio based on measurements and projections using standard IBM benchmarks in a controlled environment. The actual throughput that any user will experience will vary depending upon considerations such as the amount of multiprogramming in the user's job stream, the I/O configuration, the storage configuration, and the workload processed. Therefore, no assurance can be given that an individual user will achieve throughput improvements equivalent to the performance ratios stated here. IBM hardware products are manufactured from new parts, or new and serviceable used parts. Regardless, our warranty terms apply.All customer examples cited or described in this presentation are presented as illustrations of the manner in which some customers have used IBM products and the results they may have achieved. Actual environmental costs and performance characteristics will vary depending on individual customer configurations and conditions.This publication was produced in the United States. IBM may not offer the products, services or features discussed in this document in other countries, and the information may be subject to change without notice. Consult your local IBM business contact for information on the product or services available in your area.All statements regarding IBM's future direction and intent are subject to change or withdrawal without notice, and represent goals and objectives only.Information about non-IBM products is obtained from the manufacturers of those products or their published announcements. IBM has not tested those products and cannot confirm the performance, compatibility, or any other claims related to non-IBM products. Questions on the capabilities of non-IBM products should be addressed to the suppliers of those products.Prices subject to change without notice. Contact your IBM representative or Business Partner for the most current pricing in your geography.
Adobe, the Adobe logo, PostScript, and the PostScript logo are either registered trademarks or trademarks of Adobe Systems Incorporated in the United States, and/or other countries.Cell Broadband Engine is a trademark of Sony Computer Entertainment, Inc. in the United States, other countries, or both and is used under license therefrom. Java and all Java-based trademarks are trademarks of Sun Microsystems, Inc. in the United States, other countries, or both. Microsoft, Windows, Windows NT, and the Windows logo are trademarks of Microsoft Corporation in the United States, other countries, or both.Intel, Intel logo, Intel Inside, Intel Inside logo, Intel Centrino, Intel Centrino logo, Celeron, Intel Xeon, Intel SpeedStep, Itanium, and Pentium are trademarks or registered trademarks of Intel Corporation or its subsidiaries in the United States and other countries.UNIX is a registered trademark of The Open Group in the United States and other countries. Linux is a registered trademark of Linus Torvalds in the United States, other countries, or both. ITIL is a registered trademark, and a registered community trademark of the Office of Government Commerce, and is registered in the U.S. Patent and Trademark Office.IT Infrastructure Library is a registered trademark of the Central Computer and Telecommunications Agency, which is now part of the Office of Government Commerce.
For a complete list of IBM Trademarks, see www.ibm.com/legal/copytrade.shtml:
*, AS/400®, e business(logo)® , DBE, ESCO, eServer, FICON, IBM®, IBM (logo)®, iSeries®, MVS, OS/390®, pSeries®, RS/6000®, S/30, VM/ESA®, VSE/ESA, WebSphere®, xSeries®, z/OS®, zSeries®, z/VM®, System i, System i5, System p, System p5, System x, System z, System z9®, BladeCenter®
Not all common law marks used by IBM are listed on this page. Failure of a mark to appear does not mean that IBM does not use the mark nor does it mean that the product is not actively marketed or is not significant within its relevant market.Those trademarks followed by ® are registered trademarks of IBM in the United States; all others are trademarks or common law marks of IBM in the United States.


![CICADA - USENIX · 1 vm 2 vm 3 vm 4 vm 5vm 6 vm 7 vm 8 vm 9 vm 2 vm 3 vm 4 vm 5 vm 6 vm 7 vm 8 vm 9 vm 1 rigid application (similar to VOC [1]) vm 1 vm 2 vm 3 vm 4 vm 5vm 6 vm 7 vm](https://img.pdfslide.us/doc/110x75/5f3ade2be7477529602b0cb3/cicada-usenix-1-vm-2-vm-3-vm-4-vm-5vm-6-vm-7-vm-8-vm-9-vm-2-vm-3-vm-4-vm-5-vm.jpg)