Embed Size (px)
Citation preview

Founding Sponsors
This Presentation Courtesy of the International SOA SymposiumOctober 7-8, 2008 Amsterdam [email protected]
Gold Sponsors
Platinum Sponsors
Silver Sponsors
All Contents © 2008 Burton Group. All rights reserved.
SOA REPORT CARDSOA SYMPOSIUM7 OCTOBER 2008
Anne Thomas ManesVP & Research DirectorBurton [email protected]
2

All Contents © 2008 Burton Group. All rights reserved.3
SOA Promises
Increase agility Align ICT and business
Gain competitive advantage
Reduce costs
All Contents © 2008 Burton Group. All rights reserved.
SOA Realities
I thought SOA would solve our interop problems
No one wants to build services
Systems are more fragile
Costs are higher
Our services aren’t being
reused

All Contents © 2008 Burton Group. All rights reserved.
Our Research Process
5
All Contents © 2008 Burton Group. All rights reserved.
SOA Report Card
Thesis• Deep investigation into the status of SOA initiatives
• Goal: Identify patterns and commonalities• Found: A very sorry situation
• Most SOA initiatives stall within 18 months:• “If we build it they will come” methodology doesn’t work
• The business won’t engage• Strong resistance to change
• Success stories are inspiring• Deliver significant value to the business
6

All Contents © 2008 Burton Group. All rights reserved.
SOA Report Card
Agenda
• Report Card score
• Report Card findings
• Success killers
• Success factors
7
All Contents © 2008 Burton Group. All rights reserved.
REPORT CARD SCORESOA Report Card
8
All Contents © 2008 Burton Group. All rights reserved.
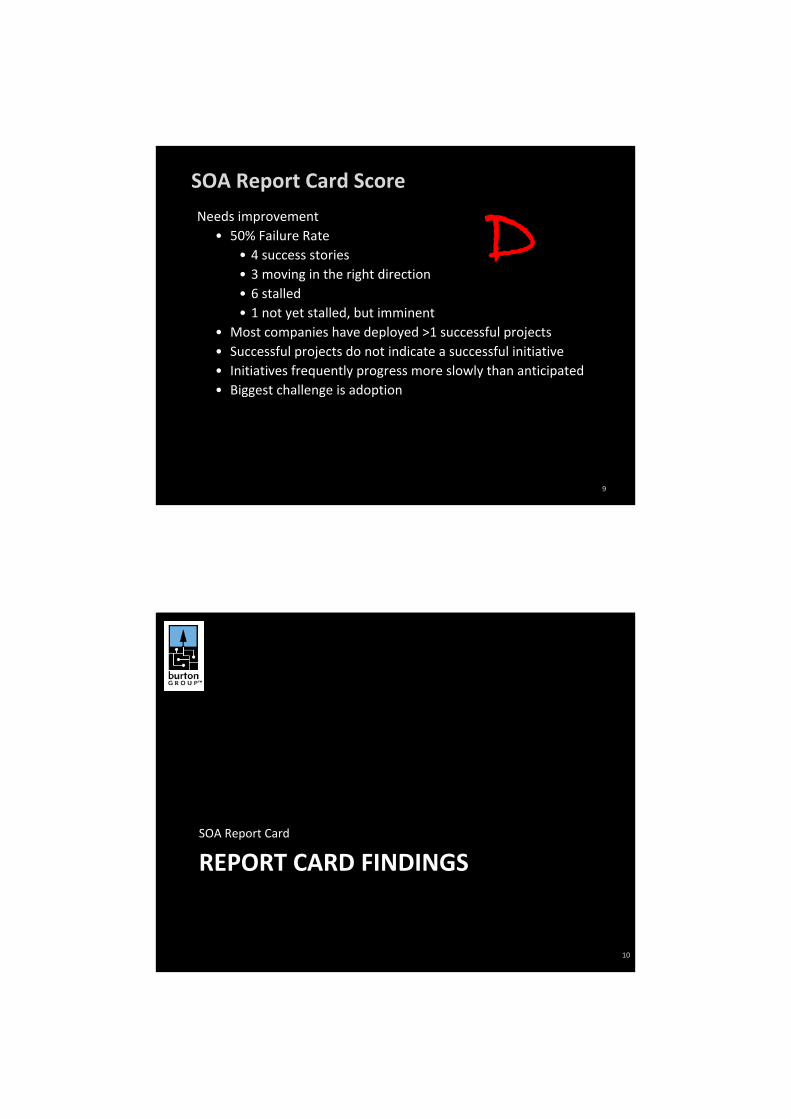
SOA Report Card Score
Needs improvement• 50% Failure Rate
• 4 success stories• 3 moving in the right direction• 6 stalled• 1 not yet stalled, but imminent
• Most companies have deployed >1 successful projects • Successful projects do not indicate a successful initiative• Initiatives frequently progress more slowly than anticipated• Biggest challenge is adoption
9
D
All Contents © 2008 Burton Group. All rights reserved.
REPORT CARD FINDINGSSOA Report Card
10

All Contents © 2008 Burton Group. All rights reserved.
All Contents © 2008 Burton Group. All rights reserved.
SOA Report Card Findings
Technology• Infrastructure
• Many organizations start by deploying an “ESB”(Infrastructure)
• Purpose: monitoring, SLA mgmt, security, runtime governance
• Specific tools for service enablement (e.g., ESB) considered out‐of‐scope for the core infrastructure
• Middleware• Typically SOAP (governed)• Sometimes MQ and/or POX (not governed)• REST still clearly viewed in the “innovators” stage
12
Technology

All Contents © 2008 Burton Group. All rights reserved.
SOA Report Card Findings
People
• Leadership• SOA initiatives are typically led by EA or special x‐dept team
• Projects are typically led by an app dev group (funded by BU)
• SOA initiatives led by app dev are often challenged• Sponsorship
• Requires CxO‐level sponsorship or higher (e.g., Board of Directors)
• Adoption
• Adoption challenges in both IT and business• Collaboration, engagement, and participation
• Makes or breaks the initiative
• IT/business disconnect must be overcome
13
People
All Contents © 2008 Burton Group. All rights reserved.
SOA Report Card FindingsProcess
• Plans and goals• DANGER ZONE: Roadmaps often lacking specificity• Successful initiatives begin with positive attitude
– “We can help the business” – focus on fixing what hurts
• Investment and value• SOA doesn’t have to be expensive (although most initiatives are)• DANGER ZONE: Big challenges measuring ROI
• Governance• Governance program requires cultural support• DANGER ZONE: Breakdowns:
– Many organizations still debating meaning and scope of governance
– Challenges getting projects to use runtime governance systems– Many push robust security protections until “later” (external services)
14
Process

All Contents © 2008 Burton Group. All rights reserved.
SOA Report Card Findings
Process• Education
• Many sources: PoCs and pilots, research and advisory, conferences, books and articles, blogosphere, new hires and consultants
• Service modeling• DANGER ZONE: Well‐defined service models are rare
– Few common business vocabularies and data models– Inadequate descriptions– Limited set of best practices defined
• Requirements management is a major source of concern• Business process modeling
• Many organizations correlate SOA with Business Process, although exact relationship is still TBD
15
Process
All Contents © 2008 Burton Group. All rights reserved.
SOA Report Card FindingsResults = portfolio
• Most organizations have deployed successful projects• DANGER ZONE: missing service ownership models
• Many organizations have big plans for 2008• e.g., Plan to roll out >25 additional service, deploy external services
• DANGER ZONE: Business often has not yet signed on to the plan• Common successful project entry points
• Infrastructure services (typically without business input)• Data services (especially reference and mainframe data)• Integration (often used for only one project—leads to JABOWS)
• SOA initiatives often focus on one of two areas:• Data• Business process
16
Results

All Contents © 2008 Burton Group. All rights reserved.
SUCCESS KILLERSSOA Report Card
17
All Contents © 2008 Burton Group. All rights reserved.
18

All Contents © 2008 Burton Group. All rights reserved.
19
Technology guys
Business guyProposed solution
All Contents © 2008 Burton Group. All rights reserved.
Isolated projects decrease agility 20

All Contents © 2008 Burton Group. All rights reserved.
Non-collaborative culture impedes adoption
Missing complementary initiatives
Lack of incentive
Success Killers
All Contents © 2008 Burton Group. All rights reserved.
22
Missing the big picture
Lack of attention to adoption drivers (business)
Success Killers

All Contents © 2008 Burton Group. All rights reserved.
23
Lack of IT maturity
Lack of understanding of SOA principles and terms
Success Killers
All Contents © 2008 Burton Group. All rights reserved.
Success Killers
Dysfunction• Disabling behaviors:
• Poor planning/communication• Blame and lack of trust
• No appreciation for risk• Technology focus
• No cultural support for governance
• Multiple problem areas:• Funding‐based disincentives
• People‐relationship disincentives• Project‐centric mindset
• “I’m special”• “If we build it, they will come”
• Ivory tower syndrome24

All Contents © 2008 Burton Group. All rights reserved.
25
Missing ownership and responsibility
All Contents © 2008 Burton Group. All rights reserved.
SUCCESS FACTORSSOA Report Card

All Contents © 2008 Burton Group. All rights reserved.
Success Factors
Success stories are inspiring• Real benefits
• Increased flexibility and agility• Reduced costs• Improved time to market/value
• Rapid results• Benefits appear within 12 months
• Initiatives focus on business value • Addressing pressing business issues
• Initiatives invariably part of larger transformation effort• Reorganization• Significant investment in social capital• Adoption of agile/iterative methodologies
27
A
All Contents © 2008 Burton Group. All rights reserved.
Success Factors
Critical success factors
• Trust relationship between IT and business
• Strong leadership
• Getting people on the same page (coordinated effort)
• Frequent and regular deliverables
• Tying activities/deliverables to business goals and value
28

All Contents © 2008 Burton Group. All rights reserved.
Success Factors
Build a strong team
• Develop a sphere of influence
• High‐powered influencer is required to drive adoption
• SOA champion must understand business challenges and goals to articulate a business case that will appeal
• Trust is key to adoption
• Personal relationships and deep project interaction build trust
29
All Contents © 2008 Burton Group. All rights reserved.
Success Factors
Think big, and in context
30
tech to biz stack2.jpg

All Contents © 2008 Burton Group. All rights reserved.
Success Factors
31
Business StrategiesBusiness Strategies
Operational ModelOperational Model
Enterprise ArchitectureEnterprise Architecture
IT InfrastructureIT Infrastructure
Prescribe Supports
RealizesGuides
FormalizesInfluences
BusinessTechnology
Think big, and in context
All Contents © 2008 Burton Group. All rights reserved.
Success Factors
Take small steps• Choose entry points wisely
• Try to piggyback SOA projects on key business initiatives
• Deliver value frequently
• Partner with a business unit
32

All Contents © 2008 Burton Group. All rights reserved.
Success Factors
Develop an appealing business case• Cost cutting is important, but not exciting• SOA demands that BUs relinquish self‐determination• You must answer: “What’s in it for me?”• More appealing arguments:
• Faster time‐to‐market• Improved business efficiency or effectiveness• Better quality data
33
All Contents © 2008 Burton Group. All rights reserved.
Success Factors
Funding models that work
• Services managed by traditional service provider groups
• Centralized discretionary funding model that enables IT to fund infrastructure, internal improvement, etc.
• Transfer responsibility for services to a shared services management group
• Fair distribution of responsibility for shared services
34

All Contents © 2008 Burton Group. All rights reserved.
SOA Report Card
Conclusion
• SOA initiative can be successful• Increased agility / faster time‐to‐value• Reduced costs
• Improved efficiency and/or effectiveness• Simplification of architecture
• Easier access to better quality data
• Cultural shift is a prerequisite for success• IT and business must collaborate, develop trust
• Goal must be to work together to improve the business
35
All Contents © 2008 Burton Group. All rights reserved.
Related Burton Group Research
• Building the Business Case for SOA Investment• Addressing SOA Fatigue• Service-Oriented Architecture: Developing the Enterprise
Roadmap• Enterprise Architects: Sowing the Seeds of SOA Success• VantagePoint 2008–2009: Think Big; Take Small Steps• Identifying and Enabling Business Capabilities• Enterprise Architecture is More than Engineering• Establishing and Maintaining Enterprise Architecture
Momentum• The Anatomy of Effective Enterprise Architecture
36