Embed Size (px)
Citation preview
1
WHERE ARE WE GOING?
• How it all began
• Agile Fluency – the model
• Case study
3
ARE WE THERE YET?
4
• How are we doing? • What should we do next? • How do we compare? • Who can help us with xyz?
IT’S COMPLICATED
5
• There are lots of Agile/CD/CI maturity models to choose from
• Many are free, some are not
• It’s not always clear what they are measuring against
• Many don’t consider context!
WHAT IS THE AGILE FLUENCY MODEL
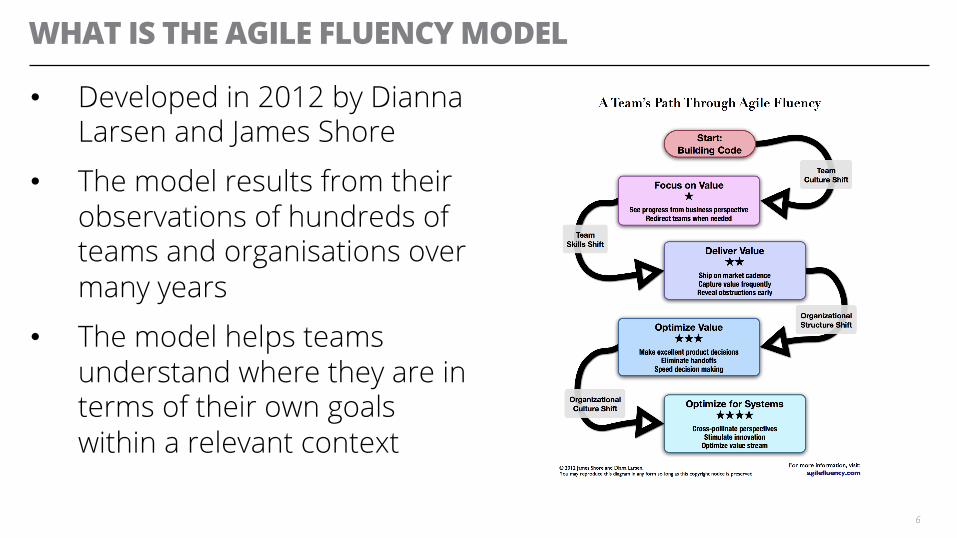
• Developed in 2012 by Dianna Larsen and James Shore
• The model results from their observations of hundreds of teams and organisations over many years
• The model helps teams understand where they are in terms of their own goals within a relevant context
6
WHAT IS FLUENCY?
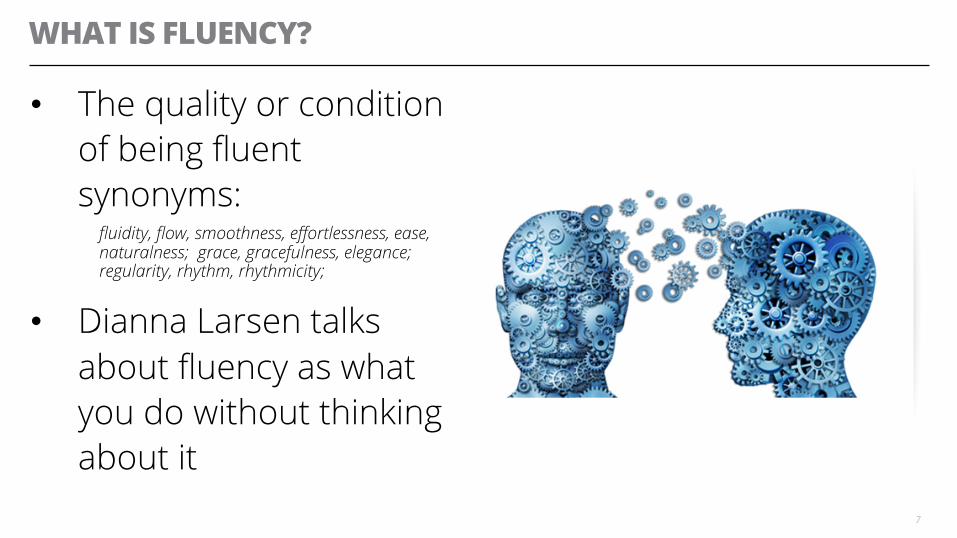
• The quality or condition of being fluent synonyms:
fluidity, flow, smoothness, effortlessness, ease, naturalness; grace, gracefulness, elegance; regularity, rhythm, rhythmicity;
• Dianna Larsen talks about fluency as what you do without thinking about it
7
HOW FLUENT IS FLUENT?
8
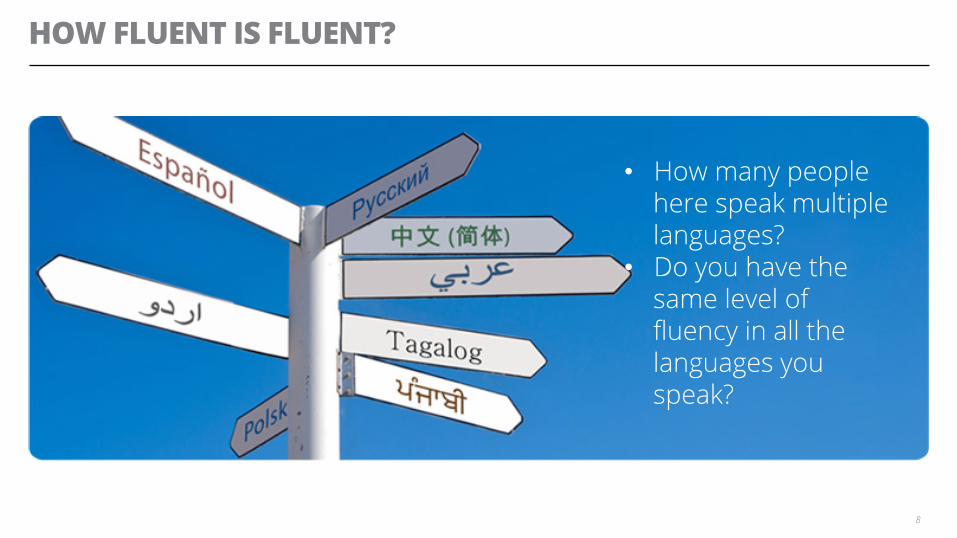
• How many people here speak multiple languages?
• Do you have the same level of fluency in all the languages you speak?
Understand what level of fluency makes sense for you
9
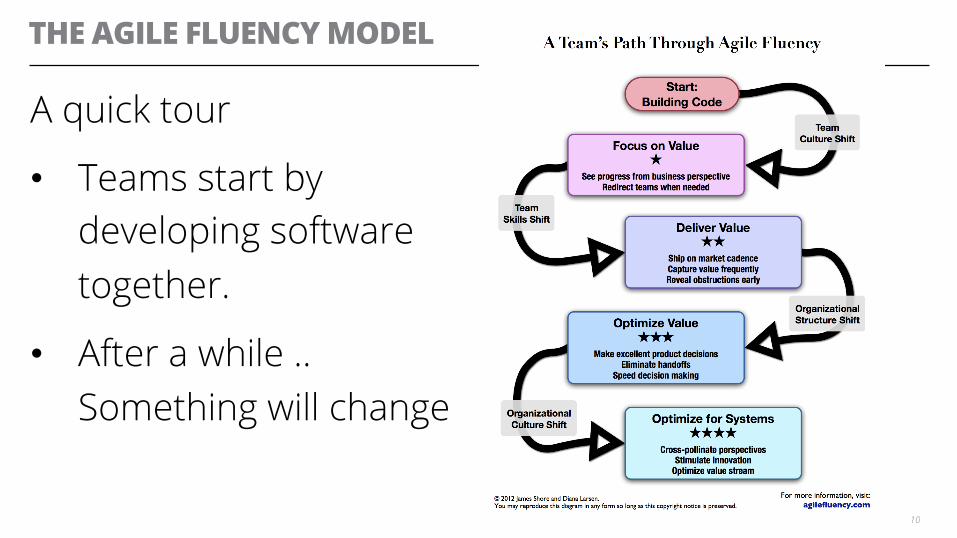
THE AGILE FLUENCY MODEL
A quick tour
• Teams start by developing software together.
• After a while .. Something will change
10
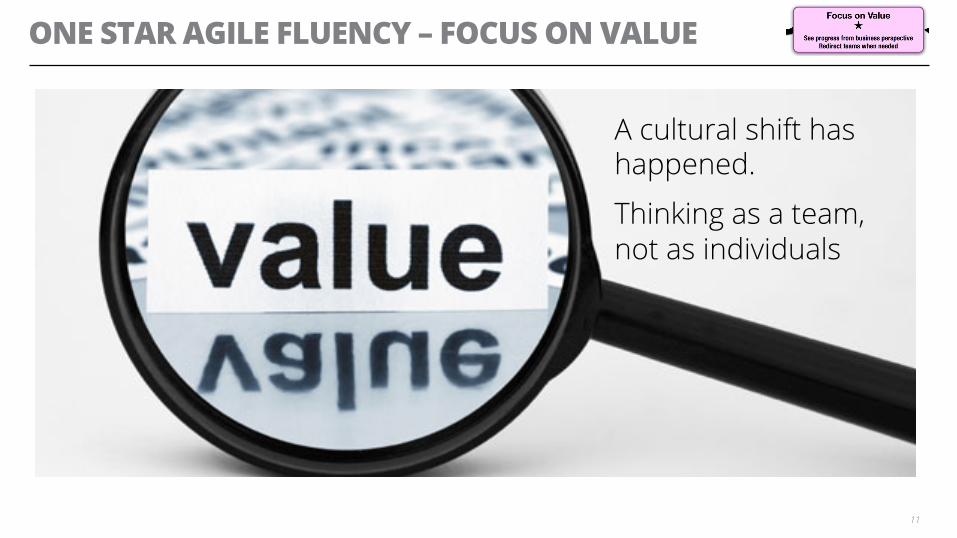
ONE STAR AGILE FLUENCY – FOCUS ON VALUE
A cultural shift has happened.
Thinking as a team, not as individuals
11
ONE STAR FLUENCY – TEAM AND ORGANISATIONAL CHARACTERISTICS
• Transparency
• Sharing information
• Actively seeking to improve practices
• Understand how their work contributes to the whole
12
* KEY METRIC
13
• Key Metric
• Does the team plan and work on delivering value?
• Can anyone in the organisation see progress?
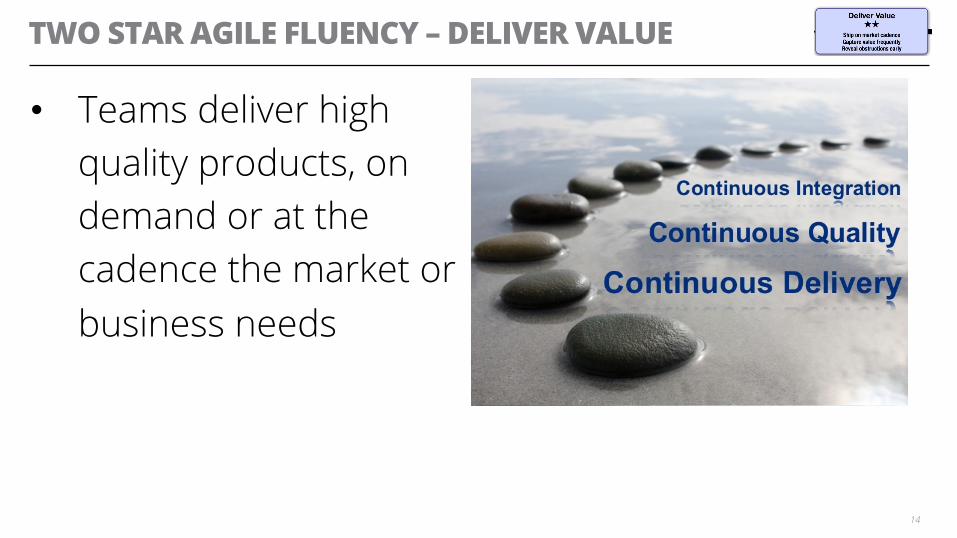
TWO STAR AGILE FLUENCY – DELIVER VALUE
• Teams deliver high quality products, on demand or at the cadence the market or business needs
14
TW0 STAR FLUENCY – TEAM AND ORGANISATIONAL CHARACTERISTICS
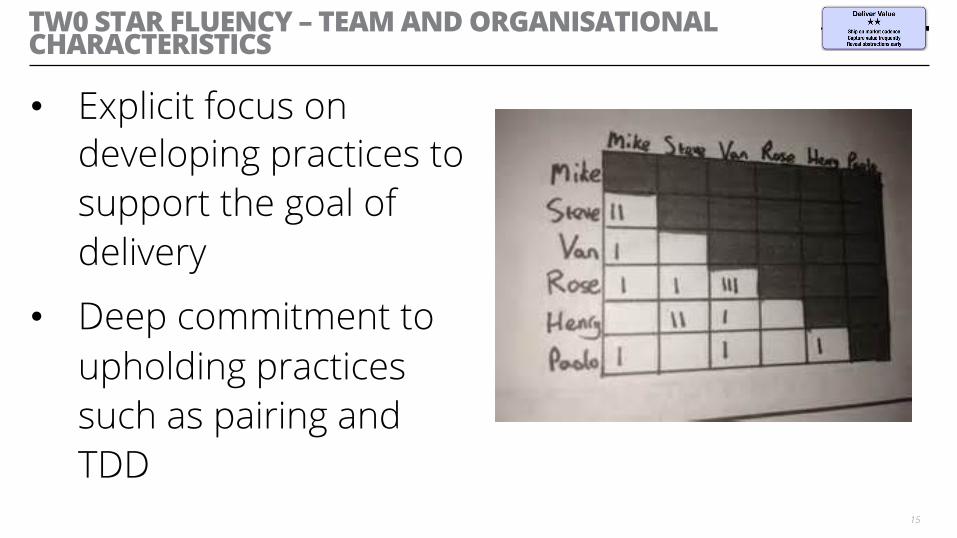
• Explicit focus on developing practices to support the goal of delivery
• Deep commitment to upholding practices such as pairing and TDD
15
** KEY METRIC
• Is continuous delivery the norm?
• Does the team know the cadence for the business and the market?
• Does the team have the right skills to deliver value and quality consistently?
16
THREE STAR FLUENCY – TEAM AND ORGANISATIONAL CHARACTERISTICS
• Truly cross functional teams
• Minimal management oversight
17
*** KEY METRIC
• The business and the team use a shared language to talk about goals and progress
• Teams have access to all the information they need to deliver high value products
• Teams are empowered to make product decisions
18
FOUR STAR AGILE FLUENCY – OPTIMISE FOR SYSTEMS
• Whole business involvement in the product or service delivery process
• A new organisational culture
19
**** KEY METRIC
• The work of every person in the organisation is driven by the work of the development teams
20
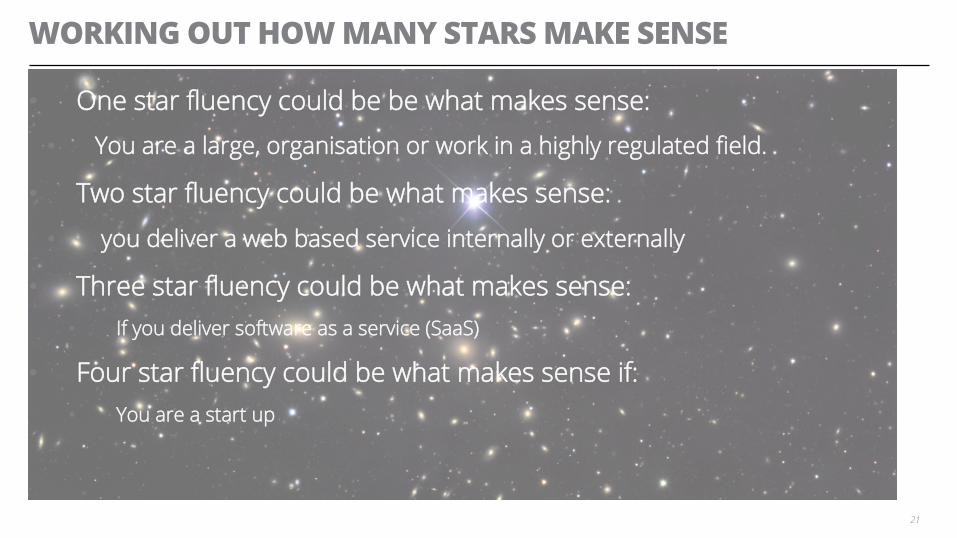
WORKING OUT HOW MANY STARS MAKE SENSE
• One star fluency could be be what makes sense:
• You are a large, organisation or work in a highly regulated field.
• Two star fluency could be what makes sense:
• you deliver a web based service internally or externally
• Three star fluency could be what makes sense: • If you deliver software as a service (SaaS)
• Four star fluency could be what makes sense if: • You are a start up
21
CASE STUDY Using the Agile Fluency model
22
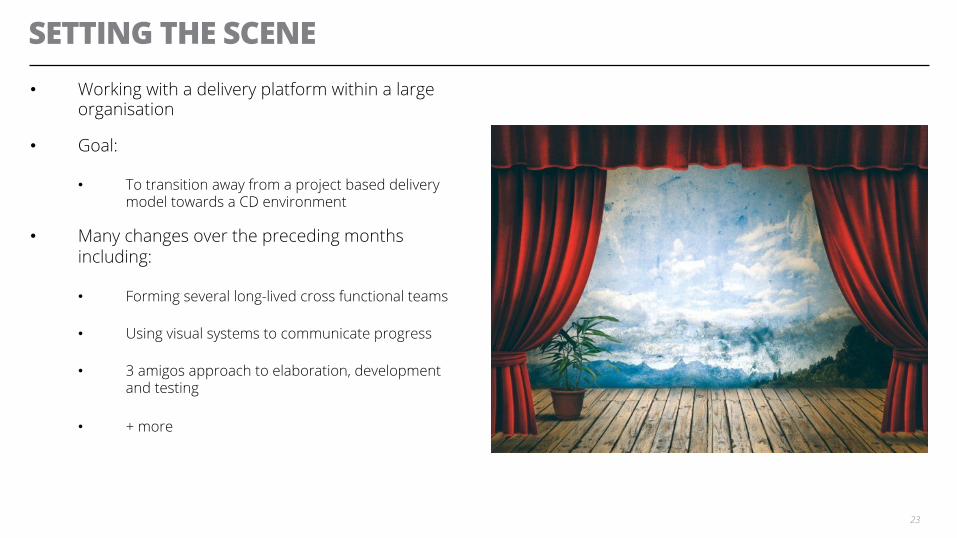
SETTING THE SCENE • Working with a delivery platform within a large
organisation
• Goal:
• To transition away from a project based delivery model towards a CD environment
• Many changes over the preceding months including:
• Forming several long-lived cross functional teams
• Using visual systems to communicate progress
• 3 amigos approach to elaboration, development and testing
• + more
23
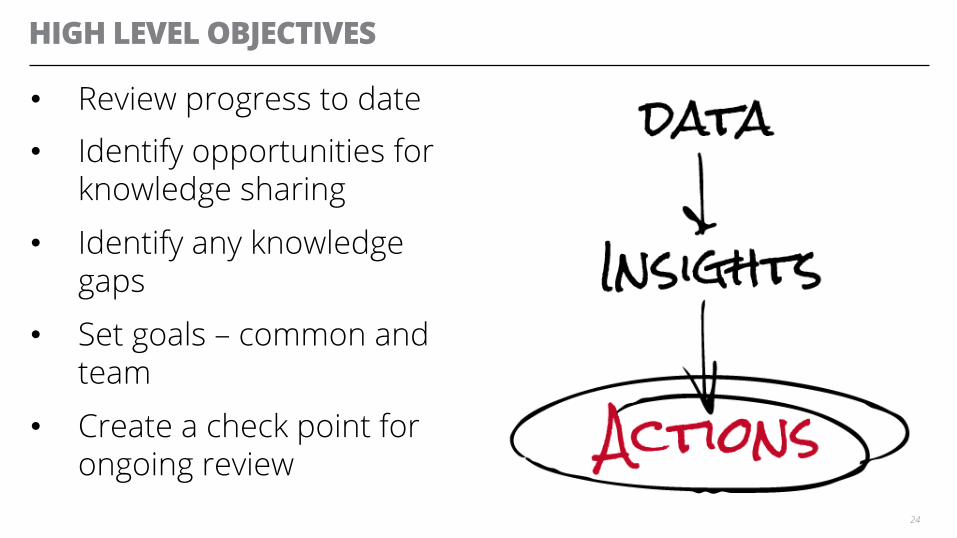
HIGH LEVEL OBJECTIVES
• Review progress to date • Identify opportunities for
knowledge sharing
• Identify any knowledge gaps
• Set goals – common and team
• Create a check point for ongoing review
24
APPROACH
• Basic requirements for the approach:
• Context sensitive
• Enjoyable to complete
• Team based
• Visual outputs
25
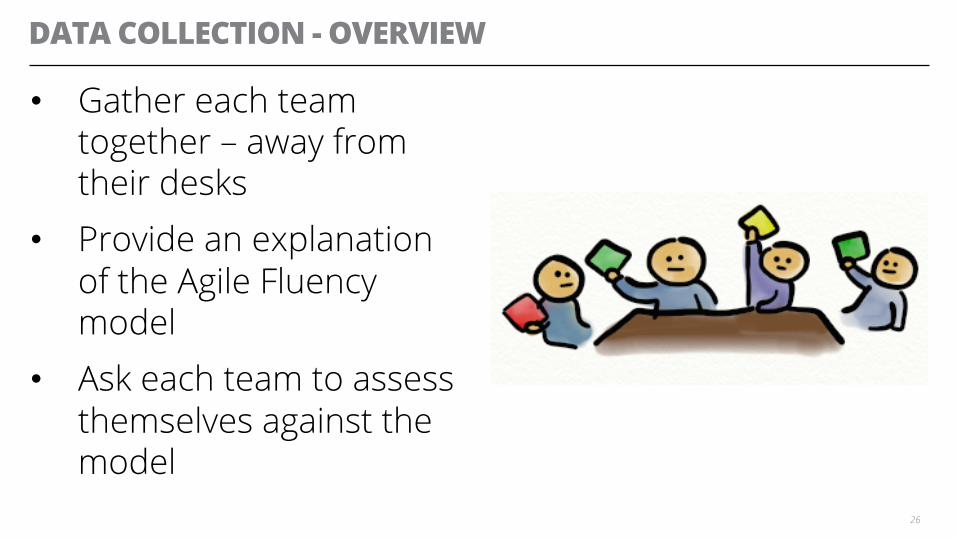
DATA COLLECTION - OVERVIEW
• Gather each team together – away from their desks
• Provide an explanation of the Agile Fluency model
• Ask each team to assess themselves against the model
26
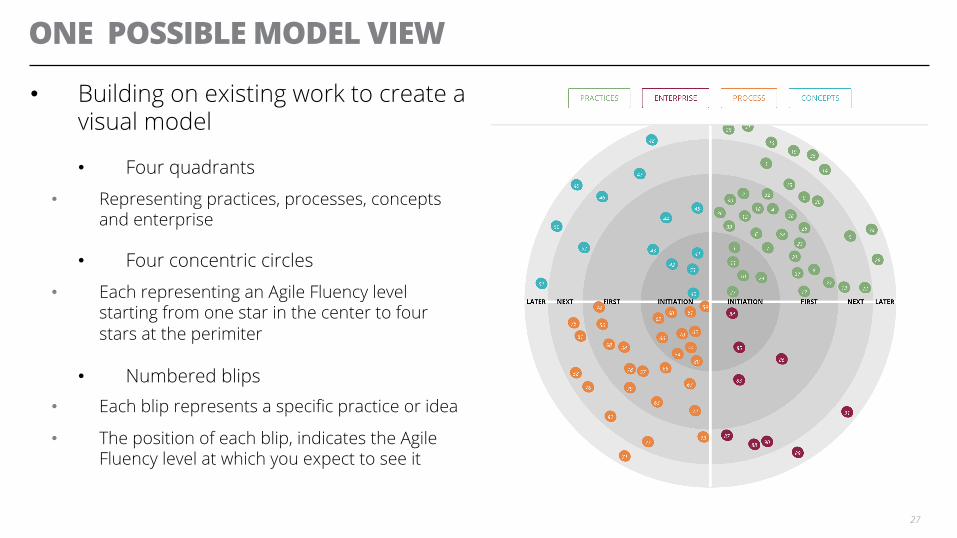
ONE POSSIBLE MODEL VIEW
• Building on existing work to create a visual model
• Four quadrants
• Representing practices, processes, concepts and enterprise
• Four concentric circles
• Each representing an Agile Fluency level starting from one star in the center to four stars at the perimiter
• Numbered blips • Each blip represents a specific practice or idea
• The position of each blip, indicates the Agile Fluency level at which you expect to see it
27
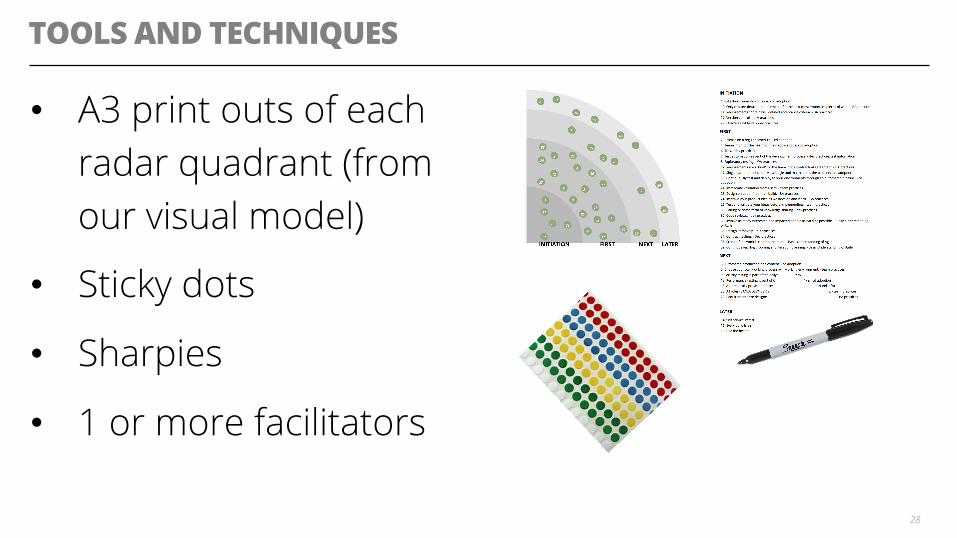
TOOLS AND TECHNIQUES
• A3 print outs of each radar quadrant (from our visual model)
• Sticky dots
• Sharpies
• 1 or more facilitators
28
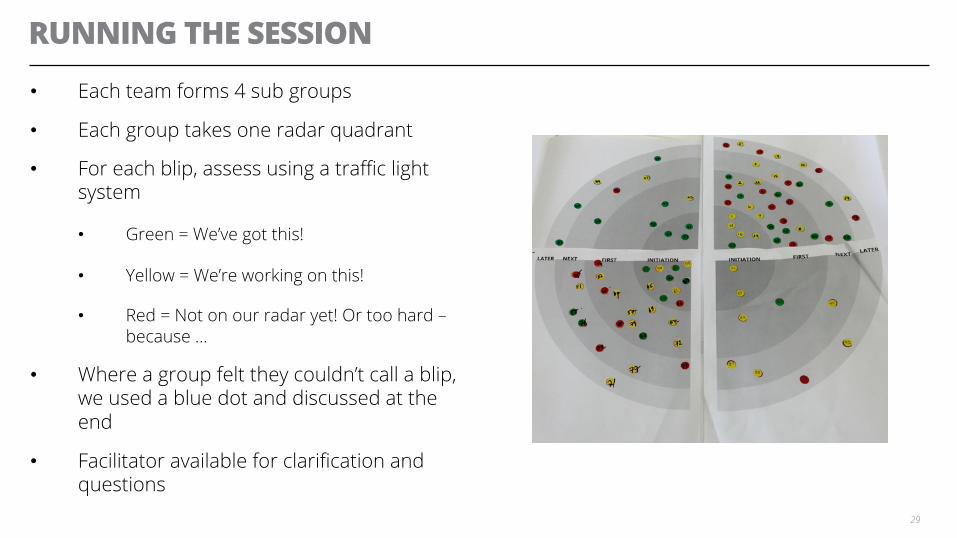
RUNNING THE SESSION • Each team forms 4 sub groups
• Each group takes one radar quadrant
• For each blip, assess using a traffic light system
• Green = We’ve got this!
• Yellow = We’re working on this!
• Red = Not on our radar yet! Or too hard – because …
• Where a group felt they couldn’t call a blip, we used a blue dot and discussed at the end
• Facilitator available for clarification and questions
29
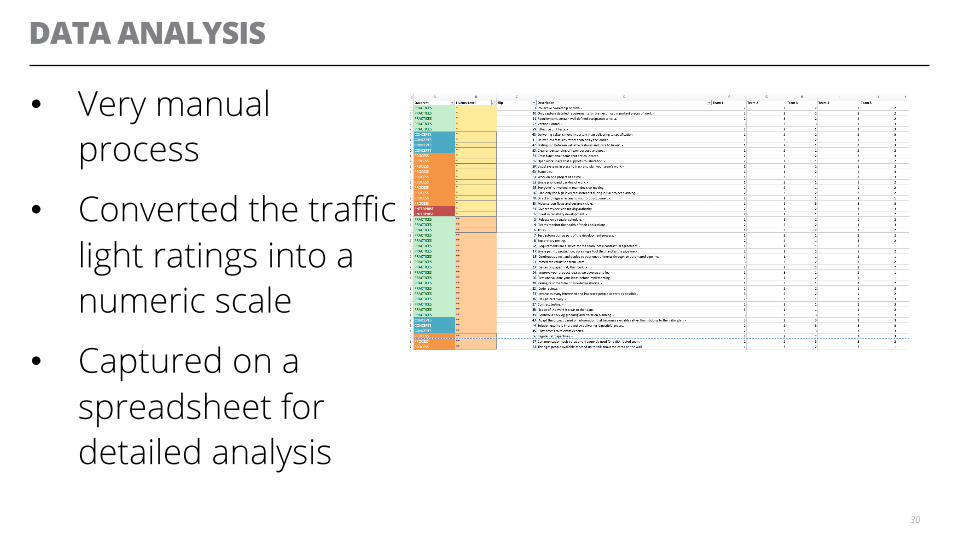
DATA ANALYSIS
• Very manual process
• Converted the traffic light ratings into a numeric scale
• Captured on a spreadsheet for detailed analysis
30
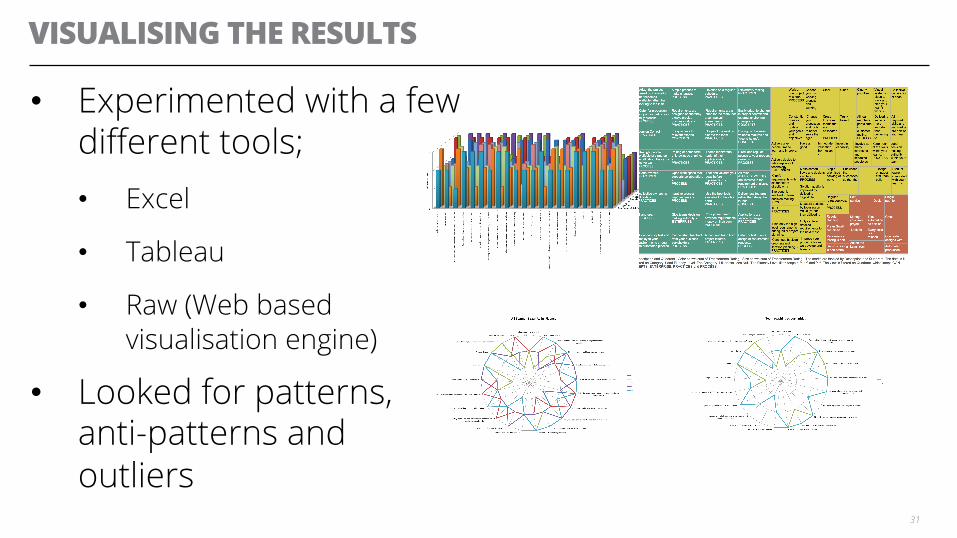
VISUALISING THE RESULTS
• Experimented with a few different tools; • Excel
• Tableau
• Raw (Web based visualisation engine)
• Looked for patterns, anti-patterns and outliers
31
GENERAL CONCLUSIONS • All of our teams were well on the way towards
achieving 2 star Agile Fluency
• Yellows in the one or two star circles indicate where we should focus next
• Reds in this area need to be better understood
• All the teams had yellows and greens in both three and four star area’s
• We could easily see where one team could provide support and coaching to another team
• We could see some opportunities for shared development activities
• All the teams reported that the process of sitting together and discussing their practices was highly valuable
32
NEXT STEPS
• Give the teams their data Suggest how they might use it
• For example: • Ask another team to put together a brown
bag or workshop in their strength area
• Asking another team to pair on a topic
• Suggesting internal or external speakers or training
• Developing and showcasing a team roadmap
• Asking for management support where progress in blocked by big picture challenges
33
THINKING RETROSPECTIVELY ABOUT THE PROCESS
• What went well?
• The lo-fi process
• It stimulated good open conversations
• People enjoyed the experience
• Using the radar
• It was simple to use
• Generated an immediate and relevant visual output
• The data
• Provided an overall snapshot
• Target the one thing which would make the most difference.
34
THINKING RETROSPECTIVELY (2)
What could have been done differently
• A simpler spreadsheet
• We didn't need to use all the categories of data we collected
• Asking teams to nominate their own practices rather than providing a generic set
• Would have been more relevant
• An easier way to enter/collect the data
• Hand data entry was very time consuming and error prone
35

ACTIONS – FOR NEXT TIME
• Digitise the data collection process, without losing the benefits of the face to face interactions and conversations
• Possibly a tablet based solution?
• Try using the model in a different context, e.g. with governance teams
36
LATEST THINKING
• Another perspective;
• More stars = more investment
• Investment = time + money + cost of change
• Essentials:
• Coaching
• Patience – willingness to slow down in order to learn how to speed up
• Business champion – someone willing to spend their social capital
37
WHAT CAN YOU DO?
¨ Step 1. Work out what fluency level makes sense for your team or organisation.
¨ Step 2. Create your own radar with quadrants and blips that make sense for you
¨ Step 3. Run the exercise together
¨ Step 4. Share the data
¨ Step 5. Improve the model we have provided and share it back to the community
38